Zip Codes with the Highest Poverty Level Among Seniors Over the Age of 65 in Los Angeles, CA

RELATED REPORTS & OPTIONS

Highest Poverty | Seniors 65+
Population
Families and Households
Female Fertility
Female Fertility (Unmarried)
Race (Community Size)
Race (Percentage)
Ancestry (Community Size)
AfghanAfricanAlaska NativeAlaskan AthabascanAlbanianAlsatianAmericanApacheArabArgentineanArmenianAssyrian / Chaldean / SyriacAustralianAustrianBahamianBangladeshiBarbadianBasqueBelgianBelizeanBhutaneseBlackfeetBolivianBrazilianBritishBritish West IndianBulgarianBurmeseCajunCambodianCanadianCape VerdeanCarpatho RusynCelticCentral AmericanCentral American IndianCherokeeCheyenneChickasawChileanChineseChippewaChoctawColombianColvilleComancheCosta RicanCreeCreekCroatianCubanCypriotCzechCzechoslovakianDanishDelawareDominicanDutchEastern EuropeanEcuadorianEgyptianEnglishEstonianEthiopianEuropeanFilipinoFinnishFrenchFrench American IndianFrench CanadianGermanGerman RussianGhanaianGreekGuamanian / ChamorroGuatemalanGuyaneseHaitianHonduranHopiHungarianIcelanderIndian (Asian)IndonesianIranianIraqiIrishIroquoisIsraeliItalianJamaicanJapaneseJordanianKenyanKiowaKoreanLaotianLatvianLebaneseLiberianLithuanianLumbeeLuxembourgerMacedonianMalaysianMalteseMexicanMexican American IndianMongolianMoroccanNative HawaiianNavajoNew ZealanderNicaraguanNigerianNorthern EuropeanNorwegianOkinawanOsagePaiutePakistaniPalestinianPanamanianParaguayanPennsylvania GermanPeruvianPimaPolishPortuguesePotawatomiPuebloPuerto RicanPuget Sound SalishRomanianRussianSalvadoranSamoanScandinavianScotch-IrishScottishSeminoleSenegaleseSerbianShoshoneSierra LeoneanSiouxSlavicSlovakSloveneSomaliSouth AfricanSouth AmericanSouth American IndianSoviet UnionSpaniardSpanishSpanish AmericanSpanish American IndianSri LankanSubsaharan AfricanSudaneseSwedishSwissSyrianTaiwaneseThaiTlingit-HaidaTohono O'OdhamTonganTrinidadian and TobagonianTurkishU.S. Virgin IslanderUkrainianUruguayanUteVenezuelanVietnameseWelshWest IndianYaquiYugoslavianYumanZimbabwean
Ancestry (Percentage)
AfghanAfricanAlaska NativeAlaskan AthabascanAlbanianAlsatianAmericanApacheArabArgentineanArmenianAssyrian / Chaldean / SyriacAustralianAustrianBahamianBangladeshiBarbadianBasqueBelgianBelizeanBhutaneseBlackfeetBolivianBrazilianBritishBritish West IndianBulgarianBurmeseCajunCambodianCanadianCape VerdeanCarpatho RusynCelticCentral AmericanCentral American IndianCherokeeCheyenneChickasawChileanChineseChippewaChoctawColombianColvilleComancheCosta RicanCreeCreekCroatianCubanCypriotCzechCzechoslovakianDanishDelawareDominicanDutchEastern EuropeanEcuadorianEgyptianEnglishEstonianEthiopianEuropeanFilipinoFinnishFrenchFrench American IndianFrench CanadianGermanGerman RussianGhanaianGreekGuamanian / ChamorroGuatemalanGuyaneseHaitianHonduranHopiHungarianIcelanderIndian (Asian)IndonesianIranianIraqiIrishIroquoisIsraeliItalianJamaicanJapaneseJordanianKenyanKiowaKoreanLaotianLatvianLebaneseLiberianLithuanianLumbeeLuxembourgerMacedonianMalaysianMalteseMexicanMexican American IndianMongolianMoroccanNative HawaiianNavajoNew ZealanderNicaraguanNigerianNorthern EuropeanNorwegianOkinawanOsagePaiutePakistaniPalestinianPanamanianParaguayanPennsylvania GermanPeruvianPimaPolishPortuguesePotawatomiPuebloPuerto RicanPuget Sound SalishRomanianRussianSalvadoranSamoanScandinavianScotch-IrishScottishSeminoleSenegaleseSerbianShoshoneSierra LeoneanSiouxSlavicSlovakSloveneSomaliSouth AfricanSouth AmericanSouth American IndianSoviet UnionSpaniardSpanishSpanish AmericanSpanish American IndianSri LankanSubsaharan AfricanSudaneseSwedishSwissSyrianTaiwaneseThaiTlingit-HaidaTohono O'OdhamTonganTrinidadian and TobagonianTurkishU.S. Virgin IslanderUkrainianUruguayanUteVenezuelanVietnameseWelshWest IndianYaquiYugoslavianYumanZimbabwean
Immigrant Origin (Total)
AfghanistanAfricaArgentinaArmeniaAsiaAustraliaAustriaAzoresBahamasBangladeshBarbadosBelarusBelgiumBelizeBoliviaBosnia and HerzegovinaBrazilBulgariaBurma / MyanmarCambodiaCameroonCanadaCaribbeanCentral AmericaChileChinaColombiaCongoCosta RicaCroatiaCubaCzechoslovakiaDenmarkDominicaDominican RepublicEastern AfricaEastern AsiaEastern EuropeEcuadorEgyptEl SalvadorEnglandEritreaEthiopiaEuropeFijiFranceGermanyGhanaGreeceGrenadaGuatemalaGuyanaHaitiHondurasHong KongHungaryIndiaIndonesiaIranIraqIrelandIsraelItalyJamaicaJapanJordanKazakhstanKenyaKoreaKuwaitLaosLatin AmericaLatviaLebanonLiberiaLithuaniaMalaysiaMexicoMicronesiaMiddle AfricaMoldovaMoroccoNepalNetherlandsNicaraguaNigeriaNorthern AfricaNorthern EuropeNorwayOceaniaPakistanPanamaPeruPhilippinesPolandPortugalRomaniaRussiaSaudi ArabiaScotlandSenegalSerbiaSierra LeoneSingaporeSouth AfricaSouth AmericaSouth Central AsiaSouth Eastern AsiaSouthern EuropeSpainSri LankaSt. Vincent and the GrenadinesSudanSwedenSwitzerlandSyriaTaiwanThailandTrinidad and TobagoTurkeyUgandaUkraineUruguayUzbekistanVenezuelaVietnamWest IndiesWestern AfricaWestern AsiaWestern EuropeZaireZimbabwe
Immigrant Origin (Percentage)
AfghanistanAfricaArgentinaArmeniaAsiaAustraliaAustriaAzoresBahamasBangladeshBarbadosBelarusBelgiumBelizeBoliviaBosnia and HerzegovinaBrazilBulgariaBurma / MyanmarCambodiaCameroonCanadaCaribbeanCentral AmericaChileChinaColombiaCongoCosta RicaCroatiaCubaCzechoslovakiaDenmarkDominicaDominican RepublicEastern AfricaEastern AsiaEastern EuropeEcuadorEgyptEl SalvadorEnglandEritreaEthiopiaEuropeFijiFranceGermanyGhanaGreeceGrenadaGuatemalaGuyanaHaitiHondurasHong KongHungaryIndiaIndonesiaIranIraqIrelandIsraelItalyJamaicaJapanJordanKazakhstanKenyaKoreaKuwaitLaosLatin AmericaLatviaLebanonLiberiaLithuaniaMalaysiaMexicoMicronesiaMiddle AfricaMoldovaMoroccoNepalNetherlandsNicaraguaNigeriaNorthern AfricaNorthern EuropeNorwayOceaniaPakistanPanamaPeruPhilippinesPolandPortugalRomaniaRussiaSaudi ArabiaScotlandSenegalSerbiaSierra LeoneSingaporeSouth AfricaSouth AmericaSouth Central AsiaSouth Eastern AsiaSouthern EuropeSpainSri LankaSt. Vincent and the GrenadinesSudanSwedenSwitzerlandSyriaTaiwanThailandTrinidad and TobagoTurkeyUgandaUkraineUruguayUzbekistanVenezuelaVietnamWest IndiesWestern AfricaWestern AsiaWestern EuropeZaireZimbabwe
Income
Income (Families)
Income (Households)
Poverty
Poverty (Families)
Unemployment
Employment Occupations
Employment Industries
Employer Class
Commute Time
Commute Means
School Enrollment
Education by Degree Field
Occupancy
Finances
Physical Characteristics
Los Angeles
States
California Cities
AlamedaAlhambraAnaheimAntiochApple ValleyArcadiaAuburnBakersfieldBerkeleyBeverly HillsBreaBuena ParkBurbankCamarilloCanoga ParkCanyon CountryCarlsbadCarsonCastro ValleyChicoChinoChula VistaCitrus HeightsClovisComptonConcordCoronaCosta MesaCovinaCulver CityDaly CityDanvilleDavisDesert Hot SpringsDowneyDuarteEl CajonEl MonteElk GroveEncinoEscondidoEurekaFairfieldFontanaFremontFresnoFullertonGarden GroveGardenaGlendaleGlendoraGrass ValleyHaywardHemetHesperiaHuntington BeachIndioInglewoodIrvineLa MesaLa PuenteLake ElsinoreLakewoodLancasterLivermoreLodiLong BeachLos AltosLos AngelesLos GatosMaderaMantecaMenifeeMercedMission ViejoModestoMontereyMonterey ParkMoragaMoreno ValleyMountain ViewMurrietaNapaNewport BeachNorth HollywoodNorthridgeNovatoOaklandOceansideOntarioOrangeOrovilleOxnardPalm DesertPalm SpringsPalmdalePalo AltoPasadenaPerrisPetalumaPleasantonPomonaPortervilleRancho CordovaRancho CucamongaRancho Santa FeReddingRedlandsRedondo BeachRedwood CityRialtoRichmondRiversideRocklinRosevilleSacramentoSalinasSan BernardinoSan ClementeSan DiegoSan FranciscoSan GabrielSan JacintoSan JoseSan LeandroSan Luis ObispoSan MarcosSan MateoSan PedroSan RafaelSan RamonSanta AnaSanta BarbaraSanta ClaraSanta ClaritaSanta CruzSanta MariaSanta MonicaSanta RosaSherman OaksSimi ValleySpring ValleyStocktonSunnyvaleTemeculaThousand OaksTorranceTrabuco CanyonTracyTurlockTustinUplandVacavilleValenciaVallejoVan NuysVenturaVictorvilleVisaliaVistaWalnut CreekWest CovinaWest SacramentoWhittierWoodlandWoodland HillsYorba LindaYuba City
Compare Zip Codes
Comparison Subject

Map of Zip Codes with the Highest Poverty Level Among Seniors Over the Age of 65 in Los Angeles

2.3%
100.0%
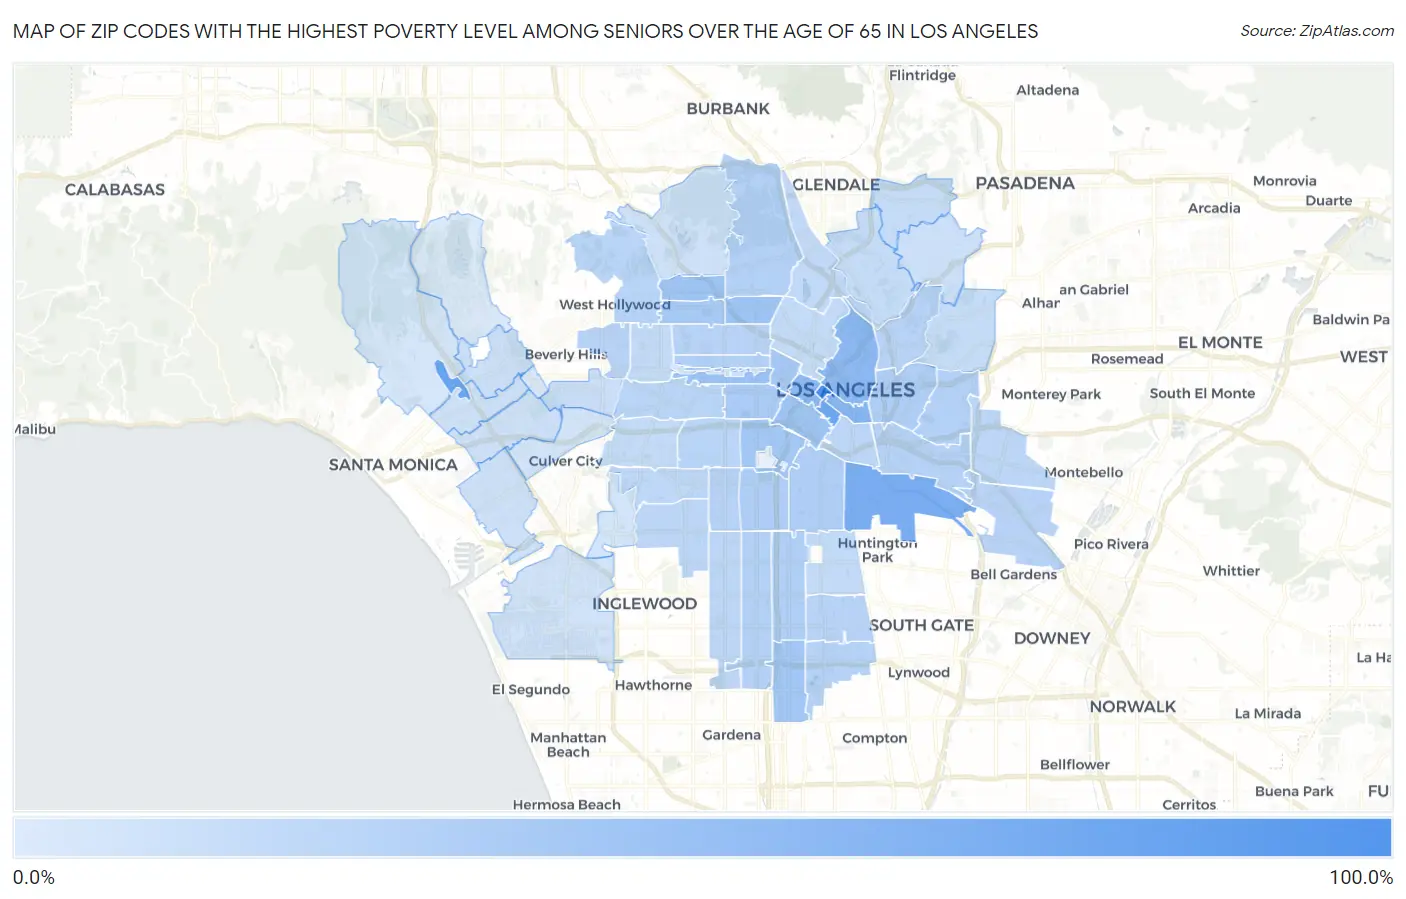
Zip Codes with the Highest Poverty Level Among Seniors Over the Age of 65 in Los Angeles Map

Zip Codes with the Highest Poverty Level Among Seniors Over the Age of 65 in Los Angeles, CA

Zip Code Senior Poverty vs State vs National
1. 90071 100.0% 11.0% (+89.0)#3 10.0% (+90.0)#28
2. 90073 71.5% 11.0% (+60.5)#14 10.0% (+61.5)#199
3. 90014 68.3% 11.0% (+57.3)#15 10.0% (+58.3)#226
4. 90058 60.2% 11.0% (+49.1)#19 10.0% (+50.2)#298
5. 90013 49.8% 11.0% (+38.8)#37 10.0% (+39.8)#470
6. 90017 46.7% 11.0% (+35.7)#41 10.0% (+36.8)#541
7. 90012 46.1% 11.0% (+35.1)#44 10.0% (+36.2)#567
8. 90005 36.8% 11.0% (+25.7)#71 10.0% (+26.8)#995
9. 90028 35.4% 11.0% (+24.4)#73 10.0% (+25.4)#1,059
10. 90029 35.3% 11.0% (+24.3)#74 10.0% (+25.4)#1,060
11. 90015 34.9% 11.0% (+23.8)#75 10.0% (+24.9)#1,088
12. 90007 32.0% 11.0% (+21.0)#91 10.0% (+22.0)#1,344
13. 90061 31.9% 11.0% (+20.9)#93 10.0% (+21.9)#1,348
14. 90057 31.0% 11.0% (+20.0)#99 10.0% (+21.0)#1,436
15. 90038 29.4% 11.0% (+18.4)#106 10.0% (+19.5)#1,580
16. 90006 28.5% 11.0% (+17.5)#116 10.0% (+18.5)#1,711
17. 90011 26.3% 11.0% (+15.3)#134 10.0% (+16.3)#2,054
18. 90033 25.5% 11.0% (+14.5)#141 10.0% (+15.5)#2,193
19. 90037 25.3% 11.0% (+14.3)#143 10.0% (+15.4)#2,220
20. 90003 24.6% 11.0% (+13.5)#153 10.0% (+14.6)#2,405
21. 90044 23.4% 11.0% (+12.3)#167 10.0% (+13.4)#2,677
22. 90027 23.3% 11.0% (+12.2)#170 10.0% (+13.3)#2,705
23. 90020 23.2% 11.0% (+12.2)#171 10.0% (+13.3)#2,713
24. 90063 23.0% 11.0% (+12.0)#176 10.0% (+13.0)#2,782
25. 90023 21.5% 11.0% (+10.5)#198 10.0% (+11.5)#3,198
26. 90059 21.3% 11.0% (+10.3)#202 10.0% (+11.4)#3,251
27. 90004 20.9% 11.0% (+9.88)#213 10.0% (+10.9)#3,387
28. 90002 20.4% 11.0% (+9.43)#221 10.0% (+10.5)#3,545
29. 90048 20.2% 11.0% (+9.20)#225 10.0% (+10.3)#3,625
30. 90040 20.2% 11.0% (+9.17)#228 10.0% (+10.2)#3,639
31. 90031 20.2% 11.0% (+9.14)#229 10.0% (+10.2)#3,644
32. 90062 20.2% 11.0% (+9.14)#230 10.0% (+10.2)#3,645
33. 90046 19.5% 11.0% (+8.53)#245 10.0% (+9.59)#3,915
34. 90018 19.4% 11.0% (+8.38)#249 10.0% (+9.44)#3,992
35. 90019 19.1% 11.0% (+8.12)#256 10.0% (+9.18)#4,085
36. 90047 18.6% 11.0% (+7.63)#264 10.0% (+8.69)#4,297
37. 90021 18.0% 11.0% (+7.03)#280 10.0% (+8.09)#4,565
38. 90022 18.0% 11.0% (+6.94)#282 10.0% (+8.00)#4,607
39. 90043 17.9% 11.0% (+6.91)#286 10.0% (+7.97)#4,626
40. 90008 17.1% 11.0% (+6.09)#318 10.0% (+7.15)#5,104
41. 90039 15.8% 11.0% (+4.82)#368 10.0% (+5.88)#5,946
42. 90001 15.1% 11.0% (+4.05)#396 10.0% (+5.11)#6,507
43. 90036 14.9% 11.0% (+3.85)#414 10.0% (+4.91)#6,657
44. 90026 14.7% 11.0% (+3.66)#422 10.0% (+4.72)#6,832
45. 90016 14.0% 11.0% (+2.95)#454 10.0% (+4.01)#7,438
46. 90041 13.8% 11.0% (+2.82)#462 10.0% (+3.88)#7,571
47. 90065 13.8% 11.0% (+2.78)#466 10.0% (+3.84)#7,613
48. 90032 12.9% 11.0% (+1.93)#518 10.0% (+2.99)#8,441
49. 90035 10.5% 11.0% (-0.505)#728 10.0% (+0.555)#11,571
50. 90042 10.3% 11.0% (-0.749)#746 10.0% (+0.312)#11,976
51. 90024 10.2% 11.0% (-0.828)#754 10.0% (+0.233)#12,100
52. 90064 8.7% 11.0% (-2.36)#934 10.0% (-1.30)#14,753
53. 90025 8.6% 11.0% (-2.41)#939 10.0% (-1.35)#14,849
54. 90066 8.6% 11.0% (-2.44)#941 10.0% (-1.38)#14,891
55. 90068 8.3% 11.0% (-2.72)#967 10.0% (-1.66)#15,422
56. 90045 7.4% 11.0% (-3.66)#1,068 10.0% (-2.60)#17,305
57. 90056 7.0% 11.0% (-4.01)#1,116 10.0% (-2.95)#18,065
58. 90010 6.9% 11.0% (-4.16)#1,132 10.0% (-3.09)#18,369
59. 90034 6.3% 11.0% (-4.75)#1,192 10.0% (-3.69)#19,576
60. 90049 5.5% 11.0% (-5.51)#1,282 10.0% (-4.45)#21,293
61. 90067 4.2% 11.0% (-6.80)#1,406 10.0% (-5.74)#23,918
62. 90077 2.3% 11.0% (-8.76)#1,498 10.0% (-7.70)#26,878

Common Questions

What are the Top 10 Zip Codes with the Highest Poverty Level Among Seniors Over the Age of 65 in Los Angeles, CA?
Top 10 Zip Codes with the Highest Poverty Level Among Seniors Over the Age of 65 in Los Angeles, CA are:
#1
100.0%
#2
71.5%
#3
68.3%
#4
60.2%
#5
49.8%
#6
46.7%
#7
46.1%
#8
36.8%
#9
35.4%
#10
35.3%
What zip code has the Highest Poverty Level Among Seniors Over the Age of 65 in Los Angeles, CA?
90071 has the Highest Poverty Level Among Seniors Over the Age of 65 in Los Angeles, CA with 100.0%.
What is the Poverty Level Among Seniors Over the Age of 65 in Los Angeles, CA?
Poverty Level Among Seniors Over the Age of 65 in Los Angeles is 16.8%.
What is the Poverty Level Among Seniors Over the Age of 65 in California?
Poverty Level Among Seniors Over the Age of 65 in California is 11.0%.
What is the Poverty Level Among Seniors Over the Age of 65 in the United States?
Poverty Level Among Seniors Over the Age of 65 in the United States is 10.0%.