Cities with the Highest Poverty Level Among Seniors Over the Age of 65 in Indiana
RELATED REPORTS & OPTIONS
Highest Poverty | Seniors 65+
Indiana
Compare Cities
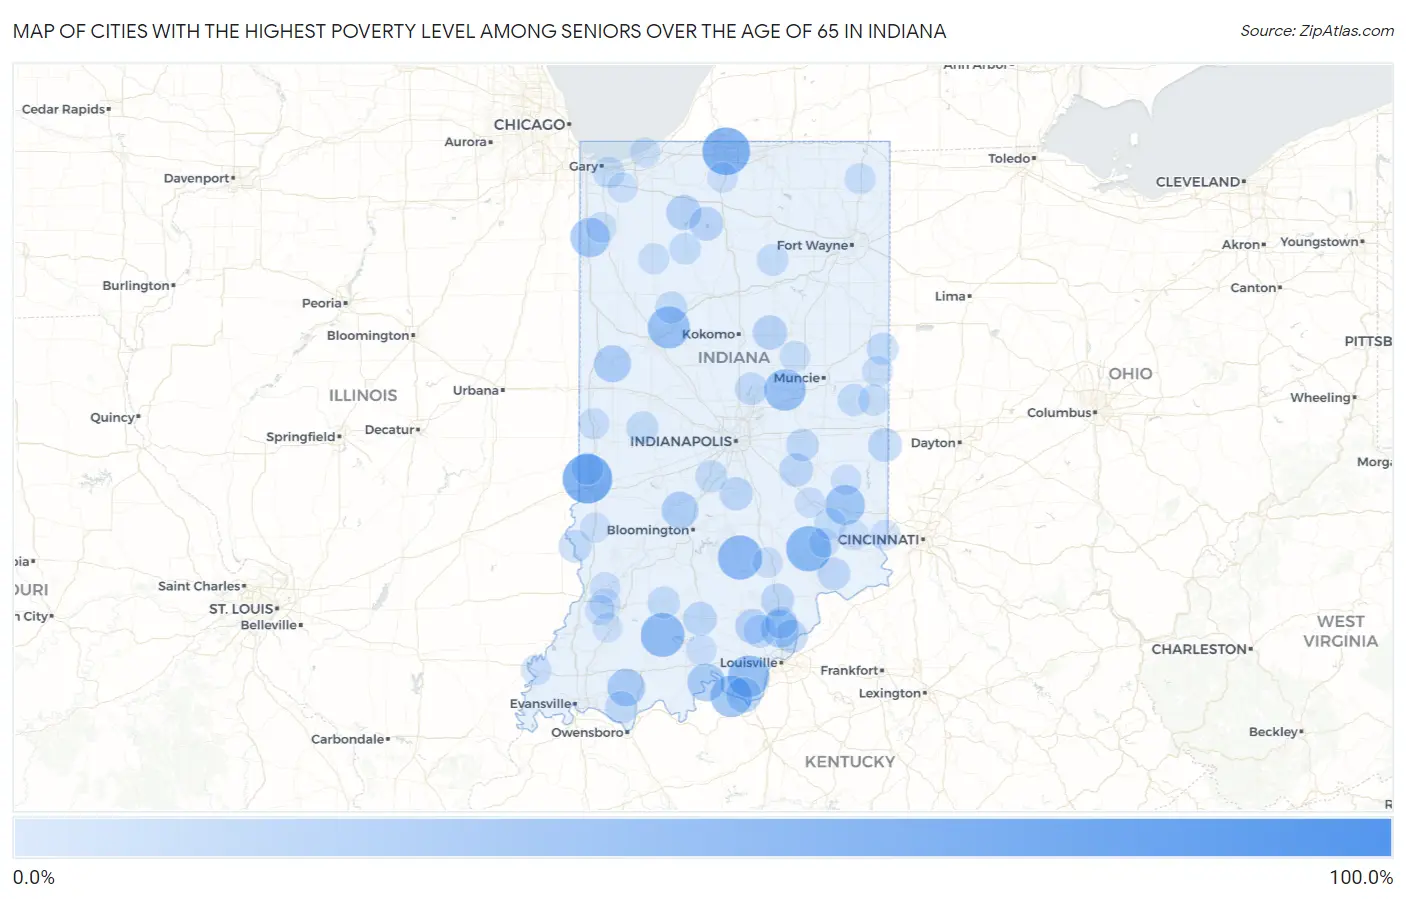
Map of Cities with the Highest Poverty Level Among Seniors Over the Age of 65 in Indiana
0.0%
100.0%
Cities with the Highest Poverty Level Among Seniors Over the Age of 65 in Indiana
| City | Senior Poverty | vs State | vs National | |
| 1. | Hartz Lake | 100.0% | 8.1%(+91.9)#1 | 10.0%(+90.0)#55 |
| 2. | Bippus | 100.0% | 8.1%(+91.9)#2 | 10.0%(+90.0)#117 |
| 3. | Penntown | 100.0% | 8.1%(+91.9)#3 | 10.0%(+90.0)#130 |
| 4. | Paris Crossing | 100.0% | 8.1%(+91.9)#4 | 10.0%(+90.0)#197 |
| 5. | Eckerty | 81.0% | 8.1%(+72.8)#5 | 10.0%(+71.0)#272 |
| 6. | Celestine | 80.5% | 8.1%(+72.3)#6 | 10.0%(+70.5)#273 |
| 7. | Andersonville | 73.2% | 8.1%(+65.0)#7 | 10.0%(+63.2)#337 |
| 8. | St Mary Of The Woods | 71.5% | 8.1%(+63.3)#8 | 10.0%(+61.5)#344 |
| 9. | Groverton | 70.3% | 8.1%(+62.1)#9 | 10.0%(+60.3)#360 |
| 10. | Notre Dame | 66.3% | 8.1%(+58.2)#10 | 10.0%(+56.4)#425 |
| 11. | Butlerville | 59.7% | 8.1%(+51.6)#11 | 10.0%(+49.8)#519 |
| 12. | Cass | 58.3% | 8.1%(+50.2)#12 | 10.0%(+48.4)#540 |
| 13. | Freetown | 57.1% | 8.1%(+49.0)#13 | 10.0%(+47.2)#553 |
| 14. | Dubois | 56.2% | 8.1%(+48.1)#14 | 10.0%(+46.3)#584 |
| 15. | Paxton | 53.7% | 8.1%(+45.6)#15 | 10.0%(+43.8)#648 |
| 16. | Holiday Woods | 52.6% | 8.1%(+44.5)#16 | 10.0%(+42.7)#675 |
| 17. | Americus | 50.9% | 8.1%(+42.7)#17 | 10.0%(+40.9)#728 |
| 18. | New Middletown | 50.0% | 8.1%(+41.9)#18 | 10.0%(+40.0)#790 |
| 19. | Mauckport | 50.0% | 8.1%(+41.9)#19 | 10.0%(+40.0)#796 |
| 20. | River Forest | 50.0% | 8.1%(+41.9)#20 | 10.0%(+40.0)#807 |
| 21. | Oldenburg | 45.4% | 8.1%(+37.3)#21 | 10.0%(+35.5)#967 |
| 22. | Forest | 44.3% | 8.1%(+36.1)#22 | 10.0%(+34.3)#1,011 |
| 23. | Lake Village | 44.0% | 8.1%(+35.8)#23 | 10.0%(+34.0)#1,022 |
| 24. | Willow Branch | 43.8% | 8.1%(+35.6)#24 | 10.0%(+33.8)#1,037 |
| 25. | Adams | 42.3% | 8.1%(+34.2)#25 | 10.0%(+32.4)#1,105 |
| 26. | Alton | 40.0% | 8.1%(+31.9)#26 | 10.0%(+30.0)#1,264 |
| 27. | Memphis | 39.5% | 8.1%(+31.3)#27 | 10.0%(+29.5)#1,279 |
| 28. | Tennyson | 39.3% | 8.1%(+31.1)#28 | 10.0%(+29.3)#1,297 |
| 29. | Thayer | 38.7% | 8.1%(+30.6)#29 | 10.0%(+28.8)#1,333 |
| 30. | Nyona Lake | 38.6% | 8.1%(+30.4)#30 | 10.0%(+28.6)#1,342 |
| 31. | Attica | 37.9% | 8.1%(+29.8)#31 | 10.0%(+28.0)#1,383 |
| 32. | Cree Lake | 37.5% | 8.1%(+29.4)#32 | 10.0%(+27.5)#1,413 |
| 33. | Stinesville | 36.8% | 8.1%(+28.7)#33 | 10.0%(+26.9)#1,472 |
| 34. | Bowling Green | 36.6% | 8.1%(+28.5)#34 | 10.0%(+26.7)#1,495 |
| 35. | Eugene | 36.4% | 8.1%(+28.2)#35 | 10.0%(+26.4)#1,516 |
| 36. | Amity | 35.7% | 8.1%(+27.6)#36 | 10.0%(+25.8)#1,574 |
| 37. | Newbern | 35.7% | 8.1%(+27.6)#37 | 10.0%(+25.8)#1,578 |
| 38. | Gilmer Park | 35.2% | 8.1%(+27.0)#38 | 10.0%(+25.2)#1,624 |
| 39. | Laconia | 33.3% | 8.1%(+25.2)#39 | 10.0%(+23.4)#1,819 |
| 40. | St. Wendel | 32.9% | 8.1%(+24.7)#40 | 10.0%(+22.9)#1,856 |
| 41. | Knox | 32.6% | 8.1%(+24.4)#41 | 10.0%(+22.6)#1,882 |
| 42. | New Pekin | 31.7% | 8.1%(+23.5)#42 | 10.0%(+21.7)#1,988 |
| 43. | Sims | 31.0% | 8.1%(+22.8)#43 | 10.0%(+21.0)#2,080 |
| 44. | Culver | 29.7% | 8.1%(+21.5)#44 | 10.0%(+19.7)#2,262 |
| 45. | Miami | 29.6% | 8.1%(+21.5)#45 | 10.0%(+19.7)#2,269 |
| 46. | Boston | 29.4% | 8.1%(+21.3)#46 | 10.0%(+19.5)#2,296 |
| 47. | Wadesville | 29.1% | 8.1%(+20.9)#47 | 10.0%(+19.1)#2,337 |
| 48. | Rockfield | 28.9% | 8.1%(+20.8)#48 | 10.0%(+19.0)#2,363 |
| 49. | Paoli | 28.9% | 8.1%(+20.7)#49 | 10.0%(+18.9)#2,378 |
| 50. | Manilla | 28.8% | 8.1%(+20.7)#50 | 10.0%(+18.9)#2,386 |
| 51. | Trafalgar | 28.1% | 8.1%(+19.9)#51 | 10.0%(+18.1)#2,532 |
| 52. | Charlestown | 27.8% | 8.1%(+19.6)#52 | 10.0%(+17.8)#2,596 |
| 53. | Scottsburg | 27.5% | 8.1%(+19.3)#53 | 10.0%(+17.5)#2,648 |
| 54. | Saugany Lake | 27.0% | 8.1%(+18.8)#54 | 10.0%(+17.0)#2,737 |
| 55. | Borden | 26.8% | 8.1%(+18.6)#55 | 10.0%(+16.8)#2,766 |
| 56. | Merom | 26.7% | 8.1%(+18.5)#56 | 10.0%(+16.7)#2,782 |
| 57. | Canaan | 26.5% | 8.1%(+18.3)#57 | 10.0%(+16.5)#2,830 |
| 58. | Richland | 26.3% | 8.1%(+18.2)#58 | 10.0%(+16.4)#2,854 |
| 59. | Carthage | 26.2% | 8.1%(+18.1)#59 | 10.0%(+16.3)#2,881 |
| 60. | Cicero | 25.8% | 8.1%(+17.6)#60 | 10.0%(+15.8)#2,971 |
| 61. | Russellville | 25.5% | 8.1%(+17.4)#61 | 10.0%(+15.6)#3,029 |
| 62. | Shoals | 25.1% | 8.1%(+17.0)#62 | 10.0%(+15.2)#3,126 |
| 63. | New Goshen | 25.0% | 8.1%(+16.9)#63 | 10.0%(+15.0)#3,154 |
| 64. | Modoc | 25.0% | 8.1%(+16.9)#64 | 10.0%(+15.0)#3,177 |
| 65. | Yeoman | 25.0% | 8.1%(+16.9)#65 | 10.0%(+15.0)#3,185 |
| 66. | Salamonia | 25.0% | 8.1%(+16.9)#66 | 10.0%(+15.0)#3,187 |
| 67. | Grantsburg | 25.0% | 8.1%(+16.9)#67 | 10.0%(+15.0)#3,190 |
| 68. | Bethany | 25.0% | 8.1%(+16.9)#68 | 10.0%(+15.0)#3,227 |
| 69. | Henryville | 24.9% | 8.1%(+16.7)#69 | 10.0%(+14.9)#3,244 |
| 70. | Winamac | 23.6% | 8.1%(+15.4)#70 | 10.0%(+13.6)#3,553 |
| 71. | New Chicago | 23.5% | 8.1%(+15.4)#71 | 10.0%(+13.6)#3,561 |
| 72. | Chain-O-Lakes | 23.5% | 8.1%(+15.4)#72 | 10.0%(+13.6)#3,567 |
| 73. | Laketon | 23.5% | 8.1%(+15.4)#73 | 10.0%(+13.6)#3,570 |
| 74. | Napoleon | 23.4% | 8.1%(+15.3)#74 | 10.0%(+13.5)#3,596 |
| 75. | Royerton | 23.3% | 8.1%(+15.1)#75 | 10.0%(+13.3)#3,652 |
| 76. | Lynn | 22.2% | 8.1%(+14.1)#76 | 10.0%(+12.3)#3,926 |
| 77. | Ashley | 22.1% | 8.1%(+14.0)#77 | 10.0%(+12.2)#3,990 |
| 78. | Newport | 22.0% | 8.1%(+13.9)#78 | 10.0%(+12.1)#4,011 |
| 79. | Francesville | 21.9% | 8.1%(+13.8)#79 | 10.0%(+12.0)#4,040 |
| 80. | Summitville | 21.8% | 8.1%(+13.6)#80 | 10.0%(+11.8)#4,080 |
| 81. | Shelby | 21.3% | 8.1%(+13.1)#81 | 10.0%(+11.3)#4,236 |
| 82. | Hobbs | 21.3% | 8.1%(+13.1)#82 | 10.0%(+11.3)#4,237 |
| 83. | Enchanted Hills | 21.2% | 8.1%(+13.1)#83 | 10.0%(+11.3)#4,244 |
| 84. | Bicknell | 21.2% | 8.1%(+13.1)#84 | 10.0%(+11.3)#4,246 |
| 85. | Wheatland | 21.2% | 8.1%(+13.0)#85 | 10.0%(+11.2)#4,273 |
| 86. | Greendale | 21.1% | 8.1%(+12.9)#86 | 10.0%(+11.1)#4,301 |
| 87. | Saratoga | 21.1% | 8.1%(+12.9)#87 | 10.0%(+11.1)#4,314 |
| 88. | Milan | 21.0% | 8.1%(+12.8)#88 | 10.0%(+11.0)#4,335 |
| 89. | English | 20.8% | 8.1%(+12.7)#89 | 10.0%(+10.9)#4,386 |
| 90. | Griffin | 20.8% | 8.1%(+12.7)#90 | 10.0%(+10.9)#4,400 |
| 91. | Lakeville | 20.8% | 8.1%(+12.6)#91 | 10.0%(+10.8)#4,425 |
| 92. | Laurel | 20.7% | 8.1%(+12.5)#92 | 10.0%(+10.7)#4,445 |
| 93. | Greensburg | 20.4% | 8.1%(+12.2)#93 | 10.0%(+10.4)#4,563 |
| 94. | Seymour | 20.3% | 8.1%(+12.2)#94 | 10.0%(+10.4)#4,591 |
| 95. | Shelburn | 20.2% | 8.1%(+12.1)#95 | 10.0%(+10.3)#4,623 |
| 96. | Monroe City | 19.8% | 8.1%(+11.6)#96 | 10.0%(+9.84)#4,862 |
| 97. | Petersburg | 19.8% | 8.1%(+11.6)#97 | 10.0%(+9.82)#4,872 |
| 98. | Town Of Pines | 19.8% | 8.1%(+11.6)#98 | 10.0%(+9.80)#4,882 |
| 99. | Holton | 19.6% | 8.1%(+11.5)#99 | 10.0%(+9.66)#4,937 |
| 100. | Shorewood Forest | 19.6% | 8.1%(+11.4)#100 | 10.0%(+9.60)#4,954 |
Common Questions
What are the Top 10 Cities with the Highest Poverty Level Among Seniors Over the Age of 65 in Indiana?
Top 10 Cities with the Highest Poverty Level Among Seniors Over the Age of 65 in Indiana are:
#1
71.5%
#2
66.3%
#3
59.7%
#4
57.1%
#5
56.2%
#6
50.9%
#7
50.0%
#8
50.0%
#9
50.0%
#10
45.4%
What city has the Highest Poverty Level Among Seniors Over the Age of 65 in Indiana?
St Mary of the Woods has the Highest Poverty Level Among Seniors Over the Age of 65 in Indiana with 71.5%.
What is the Poverty Level Among Seniors Over the Age of 65 in the State of Indiana?
Poverty Level Among Seniors Over the Age of 65 in Indiana is 8.1%.
What is the Poverty Level Among Seniors Over the Age of 65 in the United States?
Poverty Level Among Seniors Over the Age of 65 in the United States is 10.0%.