Cities with the Highest Poverty Level Among Seniors Over the Age of 65 in New Mexico
RELATED REPORTS & OPTIONS
Highest Poverty | Seniors 65+
New Mexico
Compare Cities
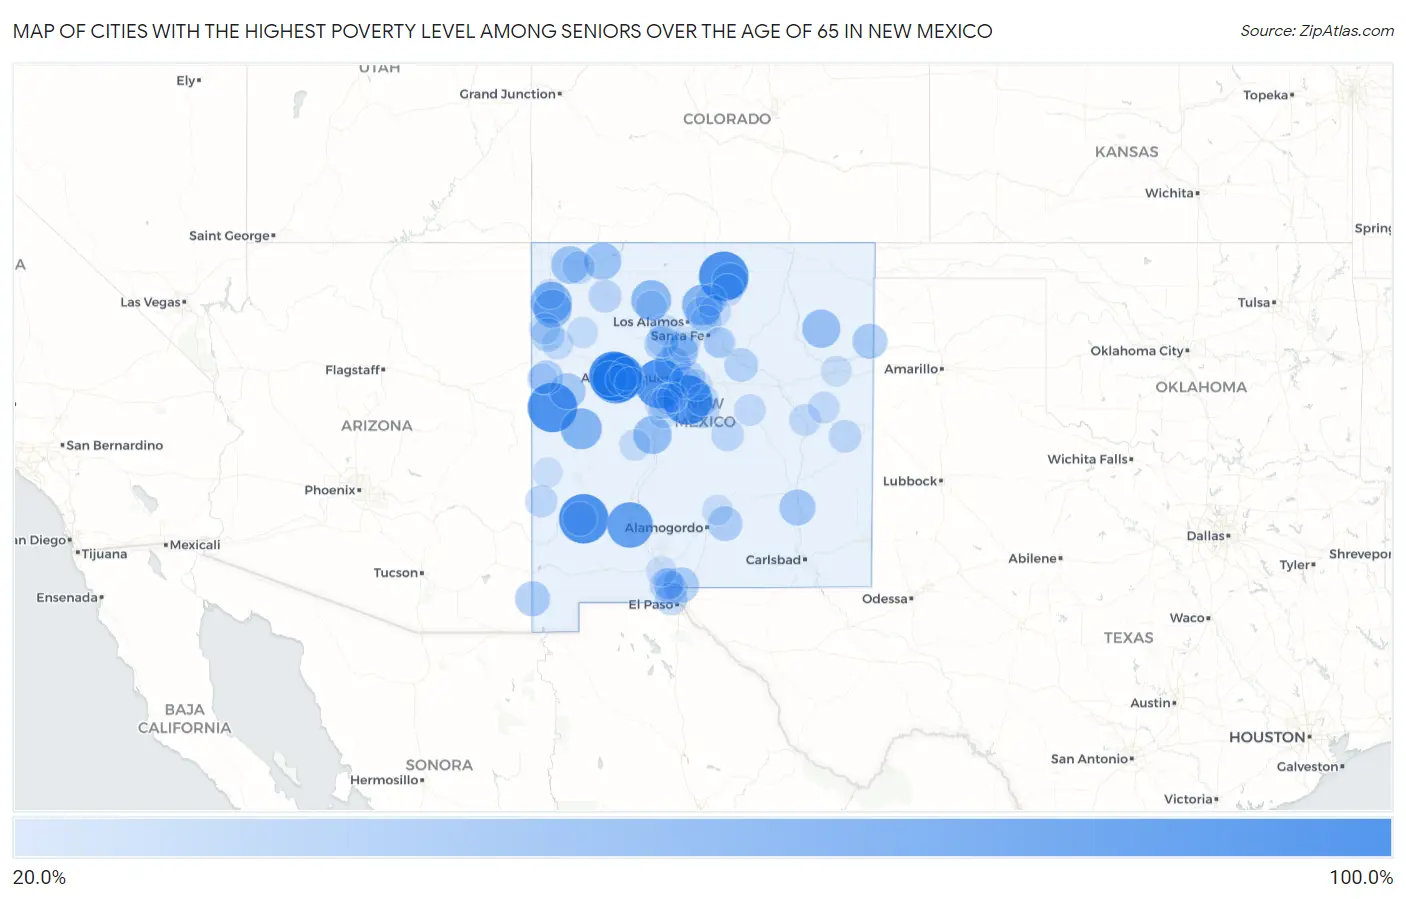
Map of Cities with the Highest Poverty Level Among Seniors Over the Age of 65 in New Mexico
0.0%
100.0%
Cities with the Highest Poverty Level Among Seniors Over the Age of 65 in New Mexico
| City | Senior Poverty | vs State | vs National | |
| 1. | Placitas Cdp Dona Ana County | 100.0% | 12.9%(+87.1)#1 | 10.0%(+90.0)#24 |
| 2. | Lybrook | 100.0% | 12.9%(+87.1)#2 | 10.0%(+90.0)#42 |
| 3. | North Acomita Village | 100.0% | 12.9%(+87.1)#3 | 10.0%(+90.0)#62 |
| 4. | Pajarito Mesa | 100.0% | 12.9%(+87.1)#4 | 10.0%(+90.0)#64 |
| 5. | Crestview | 100.0% | 12.9%(+87.1)#5 | 10.0%(+90.0)#76 |
| 6. | Tajique | 100.0% | 12.9%(+87.1)#6 | 10.0%(+90.0)#81 |
| 7. | Arroyo Hondo | 100.0% | 12.9%(+87.1)#7 | 10.0%(+90.0)#99 |
| 8. | Fence Lake | 100.0% | 12.9%(+87.1)#8 | 10.0%(+90.0)#106 |
| 9. | Cubero | 100.0% | 12.9%(+87.1)#9 | 10.0%(+90.0)#133 |
| 10. | Lake Roberts Heights | 100.0% | 12.9%(+87.1)#10 | 10.0%(+90.0)#193 |
| 11. | La Bajada | 100.0% | 12.9%(+87.1)#11 | 10.0%(+90.0)#204 |
| 12. | San Fidel | 100.0% | 12.9%(+87.1)#12 | 10.0%(+90.0)#222 |
| 13. | Oasis | 84.3% | 12.9%(+71.4)#13 | 10.0%(+74.4)#255 |
| 14. | Pinedale | 80.0% | 12.9%(+67.1)#14 | 10.0%(+70.0)#276 |
| 15. | Sheep Springs | 66.7% | 12.9%(+53.8)#15 | 10.0%(+56.7)#408 |
| 16. | Pie Town | 66.1% | 12.9%(+53.2)#16 | 10.0%(+56.2)#427 |
| 17. | Borrego Pass | 65.0% | 12.9%(+52.1)#17 | 10.0%(+55.0)#443 |
| 18. | Los Luceros | 64.9% | 12.9%(+52.0)#18 | 10.0%(+54.9)#444 |
| 19. | Mount Taylor | 63.2% | 12.9%(+50.2)#19 | 10.0%(+53.2)#465 |
| 20. | Encantado | 62.3% | 12.9%(+49.4)#20 | 10.0%(+52.4)#475 |
| 21. | Regina | 61.5% | 12.9%(+48.6)#21 | 10.0%(+51.6)#483 |
| 22. | Alamillo | 55.1% | 12.9%(+42.2)#22 | 10.0%(+45.2)#611 |
| 23. | Naschitti | 54.9% | 12.9%(+42.0)#23 | 10.0%(+44.9)#617 |
| 24. | Mosquero | 54.5% | 12.9%(+41.6)#24 | 10.0%(+44.6)#628 |
| 25. | Ojo Amarillo | 52.1% | 12.9%(+39.2)#25 | 10.0%(+42.1)#691 |
| 26. | Blanco | 51.4% | 12.9%(+38.5)#26 | 10.0%(+41.4)#712 |
| 27. | Manuelito | 50.0% | 12.9%(+37.1)#27 | 10.0%(+40.0)#798 |
| 28. | Taos Pueblo | 47.4% | 12.9%(+34.5)#28 | 10.0%(+37.4)#882 |
| 29. | Pueblo Of Sandia Village | 47.2% | 12.9%(+34.3)#29 | 10.0%(+37.2)#891 |
| 30. | Dexter | 46.4% | 12.9%(+33.5)#30 | 10.0%(+36.4)#921 |
| 31. | Pinehill | 45.9% | 12.9%(+33.0)#31 | 10.0%(+36.0)#939 |
| 32. | San Felipe Pueblo | 45.3% | 12.9%(+32.3)#32 | 10.0%(+35.3)#972 |
| 33. | Torreon Cdp Sandoval County | 43.8% | 12.9%(+30.8)#33 | 10.0%(+33.8)#1,032 |
| 34. | Chaparral | 43.3% | 12.9%(+30.4)#34 | 10.0%(+33.4)#1,063 |
| 35. | Mccartys Village | 43.0% | 12.9%(+30.1)#35 | 10.0%(+33.1)#1,074 |
| 36. | Nara Visa | 42.4% | 12.9%(+29.5)#36 | 10.0%(+32.5)#1,098 |
| 37. | Rodeo | 42.4% | 12.9%(+29.5)#37 | 10.0%(+32.5)#1,099 |
| 38. | Ojo Sarco | 42.0% | 12.9%(+29.0)#38 | 10.0%(+32.0)#1,126 |
| 39. | Totah Vista | 41.5% | 12.9%(+28.6)#39 | 10.0%(+31.5)#1,155 |
| 40. | Twin Forks | 41.3% | 12.9%(+28.4)#40 | 10.0%(+31.4)#1,161 |
| 41. | Haystack | 40.0% | 12.9%(+27.1)#41 | 10.0%(+30.0)#1,238 |
| 42. | Black Rock | 39.0% | 12.9%(+26.1)#42 | 10.0%(+29.0)#1,316 |
| 43. | Trout Valley | 38.9% | 12.9%(+26.0)#43 | 10.0%(+28.9)#1,328 |
| 44. | Santa Cruz | 38.5% | 12.9%(+25.6)#45 | 10.0%(+28.5)#1,353 |
| 45. | San Ysidro | 38.5% | 12.9%(+25.6)#46 | 10.0%(+28.5)#1,354 |
| 46. | Dona Ana | 37.7% | 12.9%(+24.8)#47 | 10.0%(+27.8)#1,398 |
| 47. | Villanueva | 37.4% | 12.9%(+24.5)#48 | 10.0%(+27.4)#1,431 |
| 48. | Willard | 37.1% | 12.9%(+24.2)#49 | 10.0%(+27.1)#1,448 |
| 49. | Paguate | 36.8% | 12.9%(+23.9)#50 | 10.0%(+26.9)#1,470 |
| 50. | Twin Lakes | 36.6% | 12.9%(+23.7)#51 | 10.0%(+26.7)#1,494 |
| 51. | Chamberino | 35.1% | 12.9%(+22.2)#52 | 10.0%(+25.2)#1,628 |
| 52. | Sedillo | 34.9% | 12.9%(+22.0)#53 | 10.0%(+24.9)#1,645 |
| 53. | Anthony | 34.6% | 12.9%(+21.7)#54 | 10.0%(+24.7)#1,659 |
| 54. | Sunland Park | 34.4% | 12.9%(+21.5)#55 | 10.0%(+24.5)#1,686 |
| 55. | Nageezi | 34.3% | 12.9%(+21.4)#56 | 10.0%(+24.3)#1,692 |
| 56. | Cañoncito | 33.7% | 12.9%(+20.8)#57 | 10.0%(+23.7)#1,731 |
| 57. | Napi Headquarters | 33.3% | 12.9%(+20.4)#58 | 10.0%(+23.4)#1,754 |
| 58. | Corona | 33.3% | 12.9%(+20.4)#59 | 10.0%(+23.4)#1,810 |
| 59. | Floyd | 33.3% | 12.9%(+20.4)#60 | 10.0%(+23.4)#1,812 |
| 60. | Sundance | 32.7% | 12.9%(+19.7)#61 | 10.0%(+22.7)#1,873 |
| 61. | Cedro | 32.3% | 12.9%(+19.4)#62 | 10.0%(+22.4)#1,903 |
| 62. | Estancia | 32.3% | 12.9%(+19.4)#63 | 10.0%(+22.3)#1,908 |
| 63. | Pleasanton | 31.9% | 12.9%(+19.0)#64 | 10.0%(+21.9)#1,958 |
| 64. | Talpa | 31.3% | 12.9%(+18.4)#65 | 10.0%(+21.3)#2,038 |
| 65. | Jemez Pueblo | 30.5% | 12.9%(+17.6)#66 | 10.0%(+20.5)#2,141 |
| 66. | Berino | 30.2% | 12.9%(+17.3)#67 | 10.0%(+20.2)#2,176 |
| 67. | Fort Sumner | 30.1% | 12.9%(+17.2)#68 | 10.0%(+20.2)#2,184 |
| 68. | Truchas | 30.1% | 12.9%(+17.2)#69 | 10.0%(+20.1)#2,189 |
| 69. | House | 30.0% | 12.9%(+17.1)#70 | 10.0%(+20.0)#2,211 |
| 70. | Dixon | 29.9% | 12.9%(+17.0)#71 | 10.0%(+20.0)#2,218 |
| 71. | Vaughn | 29.8% | 12.9%(+16.9)#72 | 10.0%(+19.9)#2,233 |
| 72. | Ojo Encino | 29.2% | 12.9%(+16.3)#73 | 10.0%(+19.2)#2,328 |
| 73. | Madrone | 29.2% | 12.9%(+16.3)#74 | 10.0%(+19.2)#2,334 |
| 74. | Nambe | 29.1% | 12.9%(+16.2)#75 | 10.0%(+19.1)#2,340 |
| 75. | Magdalena | 29.0% | 12.9%(+16.1)#76 | 10.0%(+19.0)#2,354 |
| 76. | Church Rock | 28.9% | 12.9%(+16.0)#77 | 10.0%(+19.0)#2,369 |
| 77. | Nakaibito | 28.9% | 12.9%(+16.0)#78 | 10.0%(+18.9)#2,373 |
| 78. | Indian Hills | 28.8% | 12.9%(+15.9)#79 | 10.0%(+18.8)#2,396 |
| 79. | La Cueva | 28.6% | 12.9%(+15.7)#80 | 10.0%(+18.6)#2,424 |
| 80. | Crownpoint | 28.3% | 12.9%(+15.4)#81 | 10.0%(+18.3)#2,496 |
| 81. | Paraje | 28.2% | 12.9%(+15.3)#82 | 10.0%(+18.2)#2,513 |
| 82. | Las Tusas | 28.1% | 12.9%(+15.2)#83 | 10.0%(+18.2)#2,528 |
| 83. | La Jara | 27.9% | 12.9%(+15.0)#84 | 10.0%(+17.9)#2,565 |
| 84. | Tucumcari | 26.9% | 12.9%(+14.0)#85 | 10.0%(+17.0)#2,747 |
| 85. | Jemez Springs | 26.8% | 12.9%(+13.9)#86 | 10.0%(+16.9)#2,758 |
| 86. | San Jose Cdp Rio Arriba County | 26.8% | 12.9%(+13.9)#87 | 10.0%(+16.9)#2,760 |
| 87. | Zuni Pueblo | 26.0% | 12.9%(+13.1)#88 | 10.0%(+16.1)#2,911 |
| 88. | Mescalero | 26.0% | 12.9%(+13.1)#89 | 10.0%(+16.1)#2,913 |
| 89. | Santo Domingo Pueblo | 26.0% | 12.9%(+13.1)#90 | 10.0%(+16.0)#2,916 |
| 90. | Isleta | 25.8% | 12.9%(+12.9)#91 | 10.0%(+15.8)#2,964 |
| 91. | San Pablo | 25.5% | 12.9%(+12.6)#92 | 10.0%(+15.6)#3,036 |
| 92. | Belen | 25.5% | 12.9%(+12.5)#93 | 10.0%(+15.5)#3,049 |
| 93. | El Cerro Mission | 25.4% | 12.9%(+12.5)#94 | 10.0%(+15.4)#3,079 |
| 94. | Adelino | 25.0% | 12.9%(+12.1)#95 | 10.0%(+15.0)#3,147 |
| 95. | Meadow Lake | 24.7% | 12.9%(+11.8)#96 | 10.0%(+14.7)#3,271 |
| 96. | Mesita | 24.6% | 12.9%(+11.7)#97 | 10.0%(+14.7)#3,277 |
| 97. | Glorieta | 24.5% | 12.9%(+11.6)#98 | 10.0%(+14.6)#3,304 |
| 98. | Newcomb | 24.2% | 12.9%(+11.3)#99 | 10.0%(+14.3)#3,380 |
| 99. | Reserve | 24.1% | 12.9%(+11.1)#100 | 10.0%(+14.1)#3,433 |
| 100. | Cochiti | 24.0% | 12.9%(+11.1)#101 | 10.0%(+14.0)#3,445 |
Common Questions
What are the Top 10 Cities with the Highest Poverty Level Among Seniors Over the Age of 65 in New Mexico?
Top 10 Cities with the Highest Poverty Level Among Seniors Over the Age of 65 in New Mexico are:
#1
100.0%
#2
100.0%
#3
100.0%
#4
100.0%
#5
100.0%
#6
100.0%
#7
100.0%
#8
100.0%
#9
84.3%
#10
66.7%
What city has the Highest Poverty Level Among Seniors Over the Age of 65 in New Mexico?
North Acomita Village has the Highest Poverty Level Among Seniors Over the Age of 65 in New Mexico with 100.0%.
What is the Poverty Level Among Seniors Over the Age of 65 in the State of New Mexico?
Poverty Level Among Seniors Over the Age of 65 in New Mexico is 12.9%.
What is the Poverty Level Among Seniors Over the Age of 65 in the United States?
Poverty Level Among Seniors Over the Age of 65 in the United States is 10.0%.