Cities with the Highest Poverty Level Among Seniors Over the Age of 65 in Wisconsin
RELATED REPORTS & OPTIONS
Highest Poverty | Seniors 65+
Wisconsin
Compare Cities
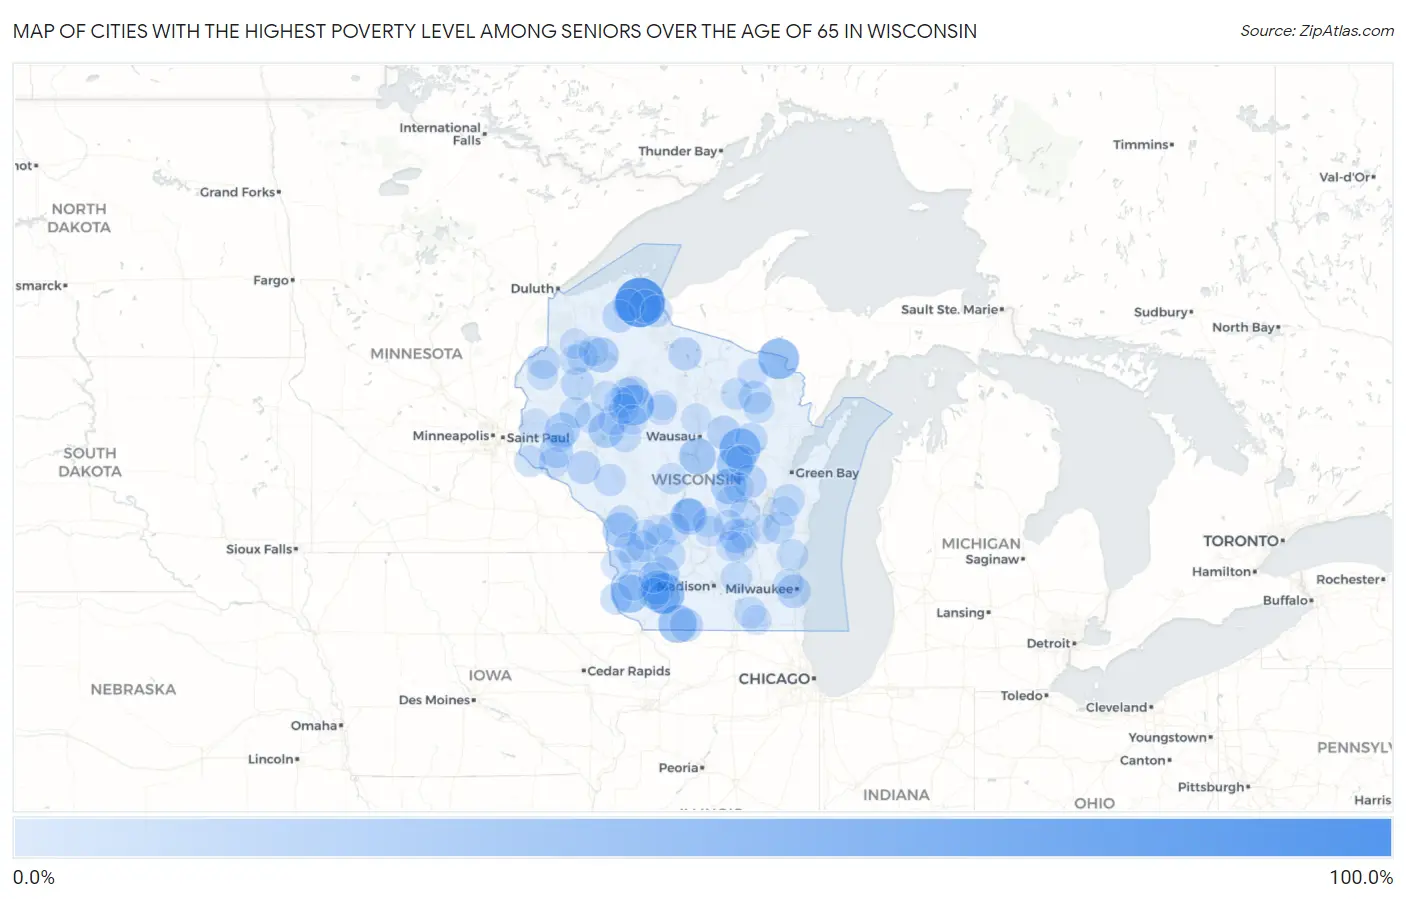
Map of Cities with the Highest Poverty Level Among Seniors Over the Age of 65 in Wisconsin
0.0%
100.0%
Cities with the Highest Poverty Level Among Seniors Over the Age of 65 in Wisconsin
| City | Senior Poverty | vs State | vs National | |
| 1. | Big Foot Prairie | 100.0% | 8.1%(+91.9)#1 | 10.0%(+90.0)#116 |
| 2. | Paac Ciinak | 93.3% | 8.1%(+85.2)#2 | 10.0%(+83.4)#225 |
| 3. | Odanah | 87.5% | 8.1%(+79.4)#3 | 10.0%(+77.5)#239 |
| 4. | Edmund | 56.5% | 8.1%(+48.4)#4 | 10.0%(+46.6)#575 |
| 5. | Florence | 55.6% | 8.1%(+47.4)#5 | 10.0%(+45.6)#599 |
| 6. | Tilleda | 55.6% | 8.1%(+47.4)#6 | 10.0%(+45.6)#603 |
| 7. | Jump River | 54.5% | 8.1%(+46.4)#7 | 10.0%(+44.6)#627 |
| 8. | Dekorra | 50.0% | 8.1%(+41.9)#8 | 10.0%(+40.0)#777 |
| 9. | Gratiot | 46.2% | 8.1%(+38.0)#9 | 10.0%(+36.2)#931 |
| 10. | Mount Hope | 45.8% | 8.1%(+37.7)#10 | 10.0%(+35.9)#943 |
| 11. | Adams | 41.0% | 8.1%(+32.9)#11 | 10.0%(+31.1)#1,186 |
| 12. | Knowlton | 40.9% | 8.1%(+32.8)#12 | 10.0%(+31.0)#1,192 |
| 13. | Big Falls | 40.6% | 8.1%(+32.5)#13 | 10.0%(+30.7)#1,207 |
| 14. | Gotham | 37.9% | 8.1%(+29.8)#14 | 10.0%(+28.0)#1,381 |
| 15. | King | 37.4% | 8.1%(+29.3)#15 | 10.0%(+27.5)#1,426 |
| 16. | Jim Falls | 36.8% | 8.1%(+28.7)#16 | 10.0%(+26.9)#1,475 |
| 17. | Little Round Lake | 35.4% | 8.1%(+27.2)#17 | 10.0%(+25.4)#1,610 |
| 18. | St Joseph | 34.9% | 8.1%(+26.7)#18 | 10.0%(+24.9)#1,647 |
| 19. | Boyceville | 34.4% | 8.1%(+26.3)#19 | 10.0%(+24.5)#1,681 |
| 20. | Highland | 33.7% | 8.1%(+25.5)#20 | 10.0%(+23.7)#1,732 |
| 21. | Aniwa | 30.4% | 8.1%(+22.3)#21 | 10.0%(+20.5)#2,145 |
| 22. | Markesan | 30.3% | 8.1%(+22.2)#22 | 10.0%(+20.4)#2,159 |
| 23. | West Milwaukee | 30.1% | 8.1%(+22.0)#23 | 10.0%(+20.2)#2,178 |
| 24. | Elmwood | 29.8% | 8.1%(+21.6)#24 | 10.0%(+19.8)#2,239 |
| 25. | New London | 29.5% | 8.1%(+21.4)#25 | 10.0%(+19.6)#2,280 |
| 26. | Lac Du Flambeau | 29.2% | 8.1%(+21.0)#26 | 10.0%(+19.2)#2,326 |
| 27. | Mondovi | 29.0% | 8.1%(+20.9)#27 | 10.0%(+19.0)#2,356 |
| 28. | South Wayne | 28.6% | 8.1%(+20.4)#28 | 10.0%(+18.6)#2,431 |
| 29. | Franks Field | 28.6% | 8.1%(+20.4)#29 | 10.0%(+18.6)#2,451 |
| 30. | Wabeno | 27.7% | 8.1%(+19.6)#30 | 10.0%(+17.8)#2,603 |
| 31. | Haugen | 27.4% | 8.1%(+19.3)#31 | 10.0%(+17.5)#2,657 |
| 32. | Friendship | 27.4% | 8.1%(+19.2)#32 | 10.0%(+17.4)#2,661 |
| 33. | Mason | 27.3% | 8.1%(+19.1)#33 | 10.0%(+17.3)#2,689 |
| 34. | Ingram | 26.7% | 8.1%(+18.5)#34 | 10.0%(+16.7)#2,790 |
| 35. | Webster | 26.3% | 8.1%(+18.1)#35 | 10.0%(+16.3)#2,870 |
| 36. | Linden | 26.3% | 8.1%(+18.1)#36 | 10.0%(+16.3)#2,874 |
| 37. | Ashland | 25.6% | 8.1%(+17.5)#37 | 10.0%(+15.6)#3,011 |
| 38. | Middle Village | 25.0% | 8.1%(+16.9)#38 | 10.0%(+15.0)#3,186 |
| 39. | Glen Flora | 25.0% | 8.1%(+16.9)#39 | 10.0%(+15.0)#3,208 |
| 40. | Saxon | 25.0% | 8.1%(+16.9)#40 | 10.0%(+15.0)#3,219 |
| 41. | Mauston | 24.9% | 8.1%(+16.7)#41 | 10.0%(+14.9)#3,241 |
| 42. | Brillion | 24.8% | 8.1%(+16.7)#42 | 10.0%(+14.9)#3,255 |
| 43. | Pigeon Falls | 24.6% | 8.1%(+16.4)#43 | 10.0%(+14.6)#3,287 |
| 44. | Mount Calvary | 24.5% | 8.1%(+16.3)#44 | 10.0%(+14.5)#3,319 |
| 45. | Bangor | 24.4% | 8.1%(+16.3)#45 | 10.0%(+14.5)#3,324 |
| 46. | Bagley | 24.2% | 8.1%(+16.1)#46 | 10.0%(+14.3)#3,382 |
| 47. | Readstown | 24.2% | 8.1%(+16.0)#47 | 10.0%(+14.2)#3,401 |
| 48. | Stanley | 23.8% | 8.1%(+15.7)#48 | 10.0%(+13.9)#3,484 |
| 49. | Hillsboro | 23.3% | 8.1%(+15.2)#49 | 10.0%(+13.4)#3,632 |
| 50. | Waterloo | 23.3% | 8.1%(+15.2)#50 | 10.0%(+13.3)#3,633 |
| 51. | Montfort | 23.3% | 8.1%(+15.1)#51 | 10.0%(+13.3)#3,636 |
| 52. | La Farge | 23.2% | 8.1%(+15.1)#52 | 10.0%(+13.3)#3,660 |
| 53. | Waubeka | 23.2% | 8.1%(+15.1)#53 | 10.0%(+13.3)#3,661 |
| 54. | Mole Lake | 23.2% | 8.1%(+15.0)#54 | 10.0%(+13.2)#3,672 |
| 55. | Lake Lorraine | 23.1% | 8.1%(+14.9)#55 | 10.0%(+13.1)#3,702 |
| 56. | Diamond Bluff | 22.9% | 8.1%(+14.7)#56 | 10.0%(+12.9)#3,774 |
| 57. | Dallas | 22.7% | 8.1%(+14.6)#57 | 10.0%(+12.8)#3,804 |
| 58. | Woodman | 22.2% | 8.1%(+14.1)#58 | 10.0%(+12.3)#3,945 |
| 59. | Townsend | 22.2% | 8.1%(+14.1)#59 | 10.0%(+12.3)#3,957 |
| 60. | Conrath | 22.2% | 8.1%(+14.1)#60 | 10.0%(+12.3)#3,962 |
| 61. | Springbrook | 22.2% | 8.1%(+14.1)#61 | 10.0%(+12.3)#3,964 |
| 62. | Lime Ridge | 21.9% | 8.1%(+13.7)#62 | 10.0%(+11.9)#4,059 |
| 63. | Pine River | 21.6% | 8.1%(+13.5)#63 | 10.0%(+11.7)#4,125 |
| 64. | Pittsville | 21.5% | 8.1%(+13.3)#64 | 10.0%(+11.5)#4,165 |
| 65. | Cornell | 21.3% | 8.1%(+13.2)#65 | 10.0%(+11.4)#4,224 |
| 66. | Fairwater | 21.2% | 8.1%(+13.0)#66 | 10.0%(+11.2)#4,277 |
| 67. | Muscoda | 21.1% | 8.1%(+12.9)#67 | 10.0%(+11.1)#4,304 |
| 68. | New Auburn | 20.9% | 8.1%(+12.8)#68 | 10.0%(+10.9)#4,361 |
| 69. | Bruce | 20.5% | 8.1%(+12.3)#69 | 10.0%(+10.5)#4,540 |
| 70. | Ontario | 20.3% | 8.1%(+12.2)#70 | 10.0%(+10.3)#4,602 |
| 71. | Plum City | 20.2% | 8.1%(+12.1)#71 | 10.0%(+10.3)#4,624 |
| 72. | Fox Lake | 20.2% | 8.1%(+12.0)#72 | 10.0%(+10.2)#4,642 |
| 73. | Mission | 20.0% | 8.1%(+11.9)#73 | 10.0%(+10.0)#4,726 |
| 74. | Eureka | 20.0% | 8.1%(+11.9)#74 | 10.0%(+10.0)#4,731 |
| 75. | Lewis | 20.0% | 8.1%(+11.9)#75 | 10.0%(+10.0)#4,755 |
| 76. | Alto | 20.0% | 8.1%(+11.9)#76 | 10.0%(+10.0)#4,766 |
| 77. | Trego | 20.0% | 8.1%(+11.9)#77 | 10.0%(+10.0)#4,770 |
| 78. | Chelsea | 20.0% | 8.1%(+11.9)#78 | 10.0%(+10.0)#4,774 |
| 79. | Viroqua | 19.9% | 8.1%(+11.8)#79 | 10.0%(+9.98)#4,808 |
| 80. | Minong | 19.8% | 8.1%(+11.7)#80 | 10.0%(+9.85)#4,859 |
| 81. | Packwaukee | 19.6% | 8.1%(+11.5)#81 | 10.0%(+9.67)#4,934 |
| 82. | Princeton | 19.5% | 8.1%(+11.3)#82 | 10.0%(+9.51)#5,004 |
| 83. | Sheldon | 19.4% | 8.1%(+11.3)#83 | 10.0%(+9.49)#5,015 |
| 84. | Merrill | 19.4% | 8.1%(+11.2)#84 | 10.0%(+9.41)#5,051 |
| 85. | Weyauwega | 19.3% | 8.1%(+11.2)#85 | 10.0%(+9.37)#5,074 |
| 86. | Delavan | 19.3% | 8.1%(+11.2)#86 | 10.0%(+9.35)#5,079 |
| 87. | Friesland | 19.0% | 8.1%(+10.9)#87 | 10.0%(+9.10)#5,197 |
| 88. | Ferryville | 19.0% | 8.1%(+10.9)#88 | 10.0%(+9.10)#5,201 |
| 89. | Newald | 19.0% | 8.1%(+10.9)#89 | 10.0%(+9.10)#5,206 |
| 90. | Hayward | 19.0% | 8.1%(+10.9)#90 | 10.0%(+9.05)#5,215 |
| 91. | Marion | 18.9% | 8.1%(+10.7)#91 | 10.0%(+8.91)#5,266 |
| 92. | Butler | 18.7% | 8.1%(+10.5)#92 | 10.0%(+8.72)#5,337 |
| 93. | Westfield | 18.6% | 8.1%(+10.5)#93 | 10.0%(+8.65)#5,363 |
| 94. | Chilton | 18.6% | 8.1%(+10.4)#94 | 10.0%(+8.61)#5,387 |
| 95. | North Fond Du Lac | 18.4% | 8.1%(+10.3)#95 | 10.0%(+8.48)#5,454 |
| 96. | Gilman | 18.3% | 8.1%(+10.1)#96 | 10.0%(+8.32)#5,527 |
| 97. | New Richmond | 18.2% | 8.1%(+10.1)#97 | 10.0%(+8.29)#5,535 |
| 98. | Kendall | 18.2% | 8.1%(+10.0)#98 | 10.0%(+8.23)#5,570 |
| 99. | Westboro | 18.2% | 8.1%(+10.0)#99 | 10.0%(+8.23)#5,576 |
| 100. | Knapp | 17.9% | 8.1%(+9.81)#100 | 10.0%(+8.00)#5,687 |
Common Questions
What are the Top 10 Cities with the Highest Poverty Level Among Seniors Over the Age of 65 in Wisconsin?
Top 10 Cities with the Highest Poverty Level Among Seniors Over the Age of 65 in Wisconsin are:
#1
87.5%
#2
56.5%
#3
55.6%
#4
55.6%
#5
54.5%
#6
46.2%
#7
45.8%
#8
41.0%
#9
40.9%
#10
40.6%
What city has the Highest Poverty Level Among Seniors Over the Age of 65 in Wisconsin?
Odanah has the Highest Poverty Level Among Seniors Over the Age of 65 in Wisconsin with 87.5%.
What is the Poverty Level Among Seniors Over the Age of 65 in the State of Wisconsin?
Poverty Level Among Seniors Over the Age of 65 in Wisconsin is 8.1%.
What is the Poverty Level Among Seniors Over the Age of 65 in the United States?
Poverty Level Among Seniors Over the Age of 65 in the United States is 10.0%.