Cities with the Highest Poverty Level Among Seniors Over the Age of 65 in Tennessee
RELATED REPORTS & OPTIONS
Highest Poverty | Seniors 65+
Tennessee
Compare Cities
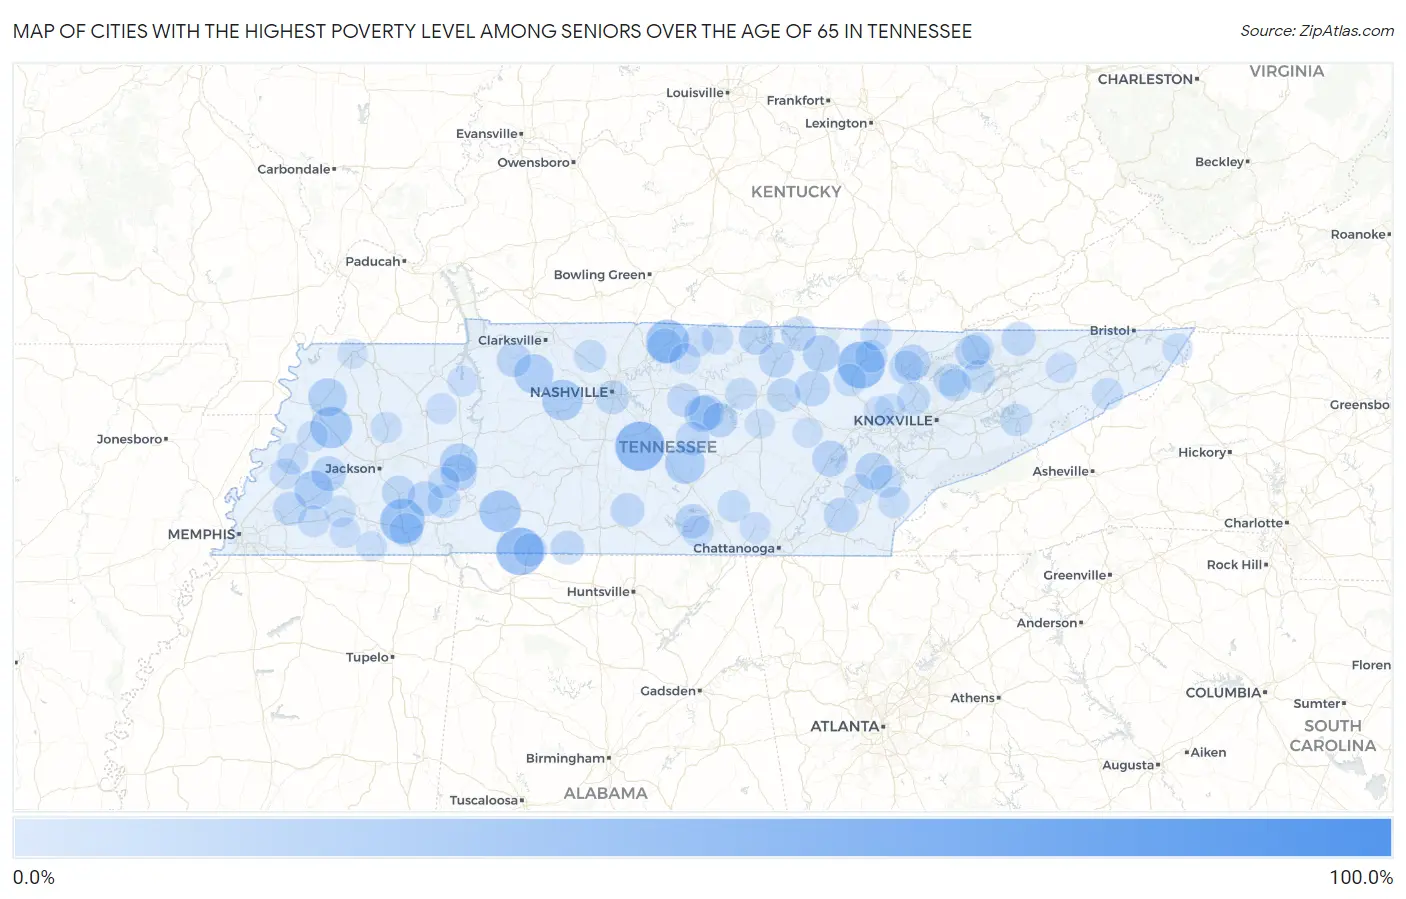
Map of Cities with the Highest Poverty Level Among Seniors Over the Age of 65 in Tennessee
0.0%
100.0%
Cities with the Highest Poverty Level Among Seniors Over the Age of 65 in Tennessee
| City | Senior Poverty | vs State | vs National | |
| 1. | Morris Chapel | 100.0% | 10.1%(+89.9)#1 | 10.0%(+90.0)#67 |
| 2. | Bogota | 100.0% | 10.1%(+89.9)#2 | 10.0%(+90.0)#136 |
| 3. | Tuckers Crossroads | 100.0% | 10.1%(+89.9)#3 | 10.0%(+90.0)#139 |
| 4. | Coker Creek | 100.0% | 10.1%(+89.9)#4 | 10.0%(+90.0)#172 |
| 5. | Greenvale | 79.4% | 10.1%(+69.2)#5 | 10.0%(+69.4)#284 |
| 6. | Briceville | 77.0% | 10.1%(+66.9)#6 | 10.0%(+67.1)#298 |
| 7. | Rockvale | 53.5% | 10.1%(+43.4)#7 | 10.0%(+43.6)#652 |
| 8. | Hilham | 51.5% | 10.1%(+41.4)#8 | 10.0%(+41.6)#708 |
| 9. | Iron City | 50.0% | 10.1%(+39.9)#9 | 10.0%(+40.0)#759 |
| 10. | Robbins | 49.0% | 10.1%(+38.8)#10 | 10.0%(+39.0)#829 |
| 11. | Hickman | 44.7% | 10.1%(+34.6)#11 | 10.0%(+34.8)#989 |
| 12. | Bethel Springs | 44.4% | 10.1%(+34.3)#12 | 10.0%(+34.5)#996 |
| 13. | Bransford | 41.7% | 10.1%(+31.5)#13 | 10.0%(+31.7)#1,139 |
| 14. | Waynesboro | 38.8% | 10.1%(+28.6)#14 | 10.0%(+28.8)#1,331 |
| 15. | Friendship | 38.5% | 10.1%(+28.3)#15 | 10.0%(+28.5)#1,347 |
| 16. | White Bluff | 36.9% | 10.1%(+26.8)#16 | 10.0%(+27.0)#1,464 |
| 17. | Lakewood Park | 35.7% | 10.1%(+25.5)#17 | 10.0%(+25.7)#1,585 |
| 18. | Slayden | 34.4% | 10.1%(+24.2)#18 | 10.0%(+24.4)#1,689 |
| 19. | Finley | 33.3% | 10.1%(+23.2)#19 | 10.0%(+23.4)#1,755 |
| 20. | Stanton | 33.3% | 10.1%(+23.2)#20 | 10.0%(+23.4)#1,756 |
| 21. | Yuma | 32.7% | 10.1%(+22.5)#21 | 10.0%(+22.7)#1,874 |
| 22. | Newbern | 32.6% | 10.1%(+22.4)#22 | 10.0%(+22.6)#1,878 |
| 23. | Parsons | 32.0% | 10.1%(+21.8)#23 | 10.0%(+22.0)#1,945 |
| 24. | Wildersville | 31.0% | 10.1%(+20.8)#24 | 10.0%(+21.0)#2,079 |
| 25. | Sweetwater | 30.1% | 10.1%(+20.0)#25 | 10.0%(+20.2)#2,179 |
| 26. | Jamestown | 30.1% | 10.1%(+20.0)#26 | 10.0%(+20.2)#2,183 |
| 27. | Decaturville | 28.9% | 10.1%(+18.7)#27 | 10.0%(+18.9)#2,381 |
| 28. | Liberty | 28.4% | 10.1%(+18.2)#28 | 10.0%(+18.4)#2,479 |
| 29. | Spring City | 28.0% | 10.1%(+17.9)#29 | 10.0%(+18.1)#2,540 |
| 30. | La Follette | 27.7% | 10.1%(+17.6)#30 | 10.0%(+17.8)#2,601 |
| 31. | Dowelltown | 27.4% | 10.1%(+17.3)#31 | 10.0%(+17.5)#2,656 |
| 32. | Bethpage | 27.1% | 10.1%(+16.9)#32 | 10.0%(+17.1)#2,717 |
| 33. | Rocky Top | 26.6% | 10.1%(+16.4)#33 | 10.0%(+16.6)#2,800 |
| 34. | Livingston | 26.5% | 10.1%(+16.4)#34 | 10.0%(+16.6)#2,811 |
| 35. | Clarkrange | 26.3% | 10.1%(+16.1)#35 | 10.0%(+16.3)#2,875 |
| 36. | Brownsville | 26.2% | 10.1%(+16.1)#36 | 10.0%(+16.3)#2,883 |
| 37. | Enville | 26.2% | 10.1%(+16.0)#37 | 10.0%(+16.2)#2,891 |
| 38. | Charleston | 26.1% | 10.1%(+15.9)#38 | 10.0%(+16.1)#2,905 |
| 39. | Byrdstown | 25.9% | 10.1%(+15.7)#39 | 10.0%(+15.9)#2,943 |
| 40. | Celina | 25.7% | 10.1%(+15.6)#40 | 10.0%(+15.8)#2,973 |
| 41. | New Tazewell | 25.7% | 10.1%(+15.5)#41 | 10.0%(+15.7)#2,989 |
| 42. | Decherd | 25.6% | 10.1%(+15.4)#42 | 10.0%(+15.6)#3,015 |
| 43. | Smithville | 25.5% | 10.1%(+15.3)#43 | 10.0%(+15.5)#3,045 |
| 44. | John Sevier | 25.3% | 10.1%(+15.1)#44 | 10.0%(+15.3)#3,100 |
| 45. | Cumberland City | 25.0% | 10.1%(+14.9)#45 | 10.0%(+15.0)#3,166 |
| 46. | Woodbury | 24.5% | 10.1%(+14.3)#46 | 10.0%(+14.5)#3,318 |
| 47. | Sneedville | 24.5% | 10.1%(+14.3)#47 | 10.0%(+14.5)#3,320 |
| 48. | Petersburg | 24.4% | 10.1%(+14.2)#48 | 10.0%(+14.4)#3,339 |
| 49. | Jacksboro | 24.3% | 10.1%(+14.1)#49 | 10.0%(+14.3)#3,366 |
| 50. | Gallaway | 24.1% | 10.1%(+14.0)#50 | 10.0%(+14.2)#3,409 |
| 51. | Henderson | 23.9% | 10.1%(+13.8)#51 | 10.0%(+14.0)#3,463 |
| 52. | Minor Hill | 23.9% | 10.1%(+13.8)#52 | 10.0%(+14.0)#3,467 |
| 53. | Berry Hill | 23.8% | 10.1%(+13.7)#53 | 10.0%(+13.9)#3,487 |
| 54. | Selmer | 23.6% | 10.1%(+13.5)#54 | 10.0%(+13.7)#3,537 |
| 55. | Watertown | 23.6% | 10.1%(+13.5)#55 | 10.0%(+13.7)#3,538 |
| 56. | Monterey | 23.6% | 10.1%(+13.5)#56 | 10.0%(+13.6)#3,548 |
| 57. | St Joseph | 23.4% | 10.1%(+13.3)#57 | 10.0%(+13.5)#3,594 |
| 58. | Clinton | 23.0% | 10.1%(+12.8)#58 | 10.0%(+13.0)#3,738 |
| 59. | Saltillo | 23.0% | 10.1%(+12.8)#59 | 10.0%(+13.0)#3,742 |
| 60. | Maynardville | 22.1% | 10.1%(+12.0)#60 | 10.0%(+12.2)#3,987 |
| 61. | Huntsville | 22.1% | 10.1%(+11.9)#61 | 10.0%(+12.1)#3,998 |
| 62. | Rutledge | 21.9% | 10.1%(+11.8)#62 | 10.0%(+12.0)#4,039 |
| 63. | Madisonville | 21.9% | 10.1%(+11.8)#63 | 10.0%(+12.0)#4,044 |
| 64. | Coopertown | 21.7% | 10.1%(+11.6)#64 | 10.0%(+11.8)#4,100 |
| 65. | Tazewell | 21.7% | 10.1%(+11.6)#65 | 10.0%(+11.8)#4,101 |
| 66. | Luttrell | 21.6% | 10.1%(+11.5)#66 | 10.0%(+11.7)#4,116 |
| 67. | Newport | 21.5% | 10.1%(+11.3)#67 | 10.0%(+11.5)#4,167 |
| 68. | Sunbright | 21.4% | 10.1%(+11.3)#68 | 10.0%(+11.5)#4,175 |
| 69. | Coalmont | 21.3% | 10.1%(+11.2)#69 | 10.0%(+11.4)#4,221 |
| 70. | Chewalla | 20.8% | 10.1%(+10.7)#70 | 10.0%(+10.9)#4,398 |
| 71. | Oak Grove Cdp Sumner County | 20.7% | 10.1%(+10.5)#71 | 10.0%(+10.7)#4,456 |
| 72. | Cowan | 20.4% | 10.1%(+10.3)#72 | 10.0%(+10.5)#4,553 |
| 73. | Baxter | 20.3% | 10.1%(+10.2)#73 | 10.0%(+10.4)#4,586 |
| 74. | Sullivan Gardens | 20.2% | 10.1%(+10.1)#74 | 10.0%(+10.3)#4,626 |
| 75. | Red Boiling Springs | 20.1% | 10.1%(+10.0)#75 | 10.0%(+10.2)#4,652 |
| 76. | Somerville | 20.1% | 10.1%(+9.95)#76 | 10.0%(+10.1)#4,674 |
| 77. | Henning | 20.0% | 10.1%(+9.85)#77 | 10.0%(+10.0)#4,701 |
| 78. | Erwin | 19.9% | 10.1%(+9.72)#78 | 10.0%(+9.92)#4,832 |
| 79. | Scotts Hill | 19.8% | 10.1%(+9.66)#79 | 10.0%(+9.86)#4,856 |
| 80. | Whiteville | 19.8% | 10.1%(+9.61)#80 | 10.0%(+9.81)#4,878 |
| 81. | Tellico Plains | 19.5% | 10.1%(+9.39)#81 | 10.0%(+9.59)#4,962 |
| 82. | Milan | 19.5% | 10.1%(+9.31)#82 | 10.0%(+9.51)#5,002 |
| 83. | Lafayette | 19.4% | 10.1%(+9.26)#83 | 10.0%(+9.46)#5,037 |
| 84. | Hollow Rock | 19.2% | 10.1%(+9.08)#84 | 10.0%(+9.28)#5,105 |
| 85. | Gates | 19.1% | 10.1%(+9.00)#85 | 10.0%(+9.20)#5,147 |
| 86. | Hartsville Trousdale County | 19.0% | 10.1%(+8.82)#86 | 10.0%(+9.01)#5,225 |
| 87. | Whitwell | 18.8% | 10.1%(+8.70)#87 | 10.0%(+8.90)#5,268 |
| 88. | Baileyton | 18.8% | 10.1%(+8.60)#88 | 10.0%(+8.80)#5,304 |
| 89. | Covington | 18.7% | 10.1%(+8.57)#89 | 10.0%(+8.76)#5,326 |
| 90. | Winfield | 18.5% | 10.1%(+8.40)#90 | 10.0%(+8.60)#5,393 |
| 91. | Hickory Valley | 18.5% | 10.1%(+8.37)#91 | 10.0%(+8.57)#5,414 |
| 92. | Mountain City | 18.5% | 10.1%(+8.32)#92 | 10.0%(+8.52)#5,436 |
| 93. | Big Sandy | 18.4% | 10.1%(+8.22)#93 | 10.0%(+8.42)#5,481 |
| 94. | Middleton | 17.9% | 10.1%(+7.75)#94 | 10.0%(+7.94)#5,713 |
| 95. | Oliver Springs | 17.8% | 10.1%(+7.67)#95 | 10.0%(+7.87)#5,751 |
| 96. | Coalfield | 17.8% | 10.1%(+7.65)#96 | 10.0%(+7.85)#5,759 |
| 97. | Lake Tansi | 17.7% | 10.1%(+7.54)#97 | 10.0%(+7.73)#5,820 |
| 98. | Athens | 17.6% | 10.1%(+7.49)#98 | 10.0%(+7.69)#5,862 |
| 99. | Union City | 17.5% | 10.1%(+7.33)#99 | 10.0%(+7.53)#5,945 |
| 100. | Sparta | 17.2% | 10.1%(+7.06)#100 | 10.0%(+7.26)#6,102 |
Common Questions
What are the Top 10 Cities with the Highest Poverty Level Among Seniors Over the Age of 65 in Tennessee?
Top 10 Cities with the Highest Poverty Level Among Seniors Over the Age of 65 in Tennessee are:
#1
53.5%
#2
50.0%
#3
49.0%
#4
44.4%
#5
41.7%
#6
38.8%
#7
38.5%
#8
36.9%
#9
35.7%
#10
34.4%
What city has the Highest Poverty Level Among Seniors Over the Age of 65 in Tennessee?
Rockvale has the Highest Poverty Level Among Seniors Over the Age of 65 in Tennessee with 53.5%.
What is the Poverty Level Among Seniors Over the Age of 65 in the State of Tennessee?
Poverty Level Among Seniors Over the Age of 65 in Tennessee is 10.1%.
What is the Poverty Level Among Seniors Over the Age of 65 in the United States?
Poverty Level Among Seniors Over the Age of 65 in the United States is 10.0%.