Cities with the Highest Poverty Level Among Seniors Over the Age of 65 in West Virginia
RELATED REPORTS & OPTIONS
Highest Poverty | Seniors 65+
West Virginia
Compare Cities
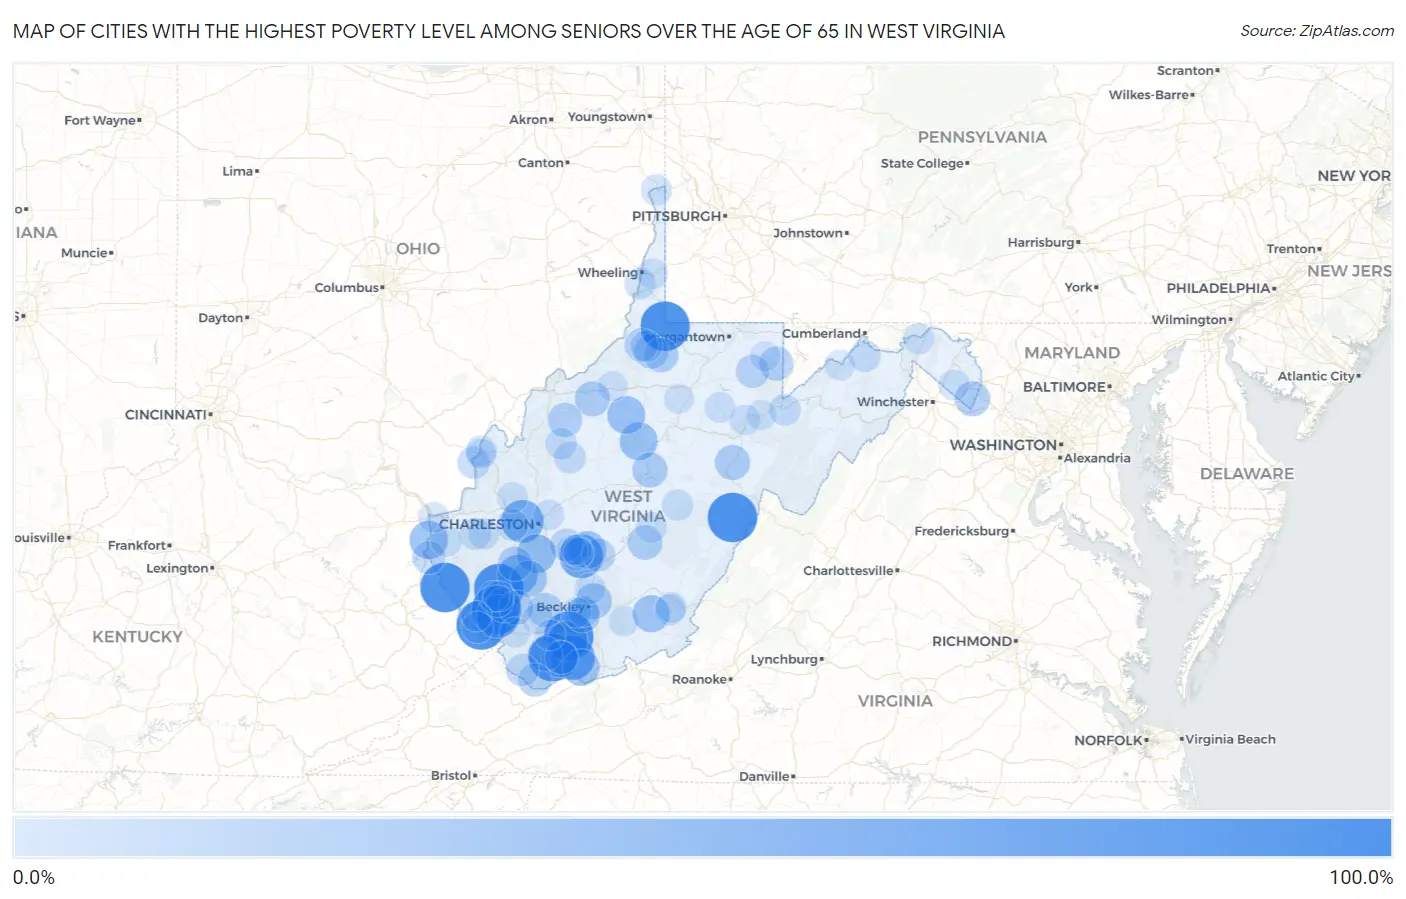
Map of Cities with the Highest Poverty Level Among Seniors Over the Age of 65 in West Virginia
0.0%
100.0%
Cities with the Highest Poverty Level Among Seniors Over the Age of 65 in West Virginia
| City | Senior Poverty | vs State | vs National | |
| 1. | Red Jacket | 100.0% | 10.6%(+89.4)#1 | 10.0%(+90.0)#27 |
| 2. | Henlawson | 100.0% | 10.6%(+89.4)#2 | 10.0%(+90.0)#44 |
| 3. | Corinne | 100.0% | 10.6%(+89.4)#3 | 10.0%(+90.0)#46 |
| 4. | Omar | 100.0% | 10.6%(+89.4)#4 | 10.0%(+90.0)#59 |
| 5. | Crum | 100.0% | 10.6%(+89.4)#5 | 10.0%(+90.0)#94 |
| 6. | Littleton | 100.0% | 10.6%(+89.4)#6 | 10.0%(+90.0)#118 |
| 7. | Osage | 100.0% | 10.6%(+89.4)#7 | 10.0%(+90.0)#174 |
| 8. | Cass | 100.0% | 10.6%(+89.4)#8 | 10.0%(+90.0)#206 |
| 9. | Kimball | 92.6% | 10.6%(+82.0)#9 | 10.0%(+82.7)#226 |
| 10. | Crumpler | 79.4% | 10.6%(+68.7)#10 | 10.0%(+69.4)#283 |
| 11. | Deep Water | 75.0% | 10.6%(+64.4)#11 | 10.0%(+65.0)#315 |
| 12. | Sarah Ann | 72.9% | 10.6%(+62.3)#12 | 10.0%(+63.0)#338 |
| 13. | Jefferson | 69.7% | 10.6%(+59.1)#13 | 10.0%(+59.7)#367 |
| 14. | Bud | 60.6% | 10.6%(+49.9)#14 | 10.0%(+50.6)#500 |
| 15. | Greenview | 59.2% | 10.6%(+48.5)#15 | 10.0%(+49.2)#525 |
| 16. | Racine | 54.5% | 10.6%(+43.9)#16 | 10.0%(+44.6)#623 |
| 17. | Prichard | 52.1% | 10.6%(+41.5)#17 | 10.0%(+42.2)#690 |
| 18. | Sand Fork | 50.0% | 10.6%(+39.4)#18 | 10.0%(+40.0)#776 |
| 19. | Auburn | 50.0% | 10.6%(+39.4)#19 | 10.0%(+40.0)#800 |
| 20. | Gauley Bridge | 48.6% | 10.6%(+38.0)#20 | 10.0%(+38.7)#839 |
| 21. | Keystone | 47.1% | 10.6%(+36.4)#21 | 10.0%(+37.1)#894 |
| 22. | Alderson | 47.0% | 10.6%(+36.3)#22 | 10.0%(+37.0)#897 |
| 23. | Montcalm | 45.7% | 10.6%(+35.1)#23 | 10.0%(+35.8)#949 |
| 24. | Eskdale | 45.1% | 10.6%(+34.4)#24 | 10.0%(+35.1)#975 |
| 25. | Van | 43.8% | 10.6%(+33.1)#25 | 10.0%(+33.8)#1,035 |
| 26. | Stanaford | 42.7% | 10.6%(+32.0)#26 | 10.0%(+32.7)#1,092 |
| 27. | Shannondale | 38.6% | 10.6%(+28.0)#27 | 10.0%(+28.7)#1,337 |
| 28. | Flatwoods | 38.6% | 10.6%(+28.0)#28 | 10.0%(+28.7)#1,340 |
| 29. | Valley Bend | 38.5% | 10.6%(+27.8)#29 | 10.0%(+28.5)#1,348 |
| 30. | Cairo | 38.1% | 10.6%(+27.5)#30 | 10.0%(+28.1)#1,375 |
| 31. | Sophia | 38.1% | 10.6%(+27.4)#31 | 10.0%(+28.1)#1,377 |
| 32. | Neibert | 37.5% | 10.6%(+26.9)#32 | 10.0%(+27.5)#1,410 |
| 33. | Welch | 36.8% | 10.6%(+26.2)#33 | 10.0%(+26.9)#1,479 |
| 34. | Nettie | 36.5% | 10.6%(+25.9)#34 | 10.0%(+26.6)#1,500 |
| 35. | Jacksonburg | 36.1% | 10.6%(+25.5)#35 | 10.0%(+26.2)#1,536 |
| 36. | Smithfield | 35.7% | 10.6%(+25.1)#36 | 10.0%(+25.8)#1,579 |
| 37. | Kopperston | 35.6% | 10.6%(+24.9)#37 | 10.0%(+25.6)#1,593 |
| 38. | Accoville | 35.4% | 10.6%(+24.8)#38 | 10.0%(+25.5)#1,604 |
| 39. | Elizabeth | 35.0% | 10.6%(+24.4)#39 | 10.0%(+25.0)#1,637 |
| 40. | Danville | 34.8% | 10.6%(+24.2)#40 | 10.0%(+24.9)#1,649 |
| 41. | Terra Alta | 34.4% | 10.6%(+23.8)#41 | 10.0%(+24.5)#1,678 |
| 42. | Hansford | 33.3% | 10.6%(+22.7)#42 | 10.0%(+23.4)#1,799 |
| 43. | Reader | 31.7% | 10.6%(+21.1)#43 | 10.0%(+21.8)#1,977 |
| 44. | Berwind | 31.2% | 10.6%(+20.6)#44 | 10.0%(+21.3)#2,046 |
| 45. | Kimberly | 31.2% | 10.6%(+20.5)#45 | 10.0%(+21.2)#2,054 |
| 46. | West Dunbar | 31.1% | 10.6%(+20.5)#46 | 10.0%(+21.2)#2,059 |
| 47. | Tunnelton | 31.1% | 10.6%(+20.5)#47 | 10.0%(+21.2)#2,060 |
| 48. | Northfork | 29.8% | 10.6%(+19.1)#48 | 10.0%(+19.8)#2,235 |
| 49. | Ansted | 29.4% | 10.6%(+18.7)#49 | 10.0%(+19.4)#2,302 |
| 50. | Fort Gay | 29.2% | 10.6%(+18.6)#50 | 10.0%(+19.3)#2,318 |
| 51. | Pratt | 28.8% | 10.6%(+18.2)#51 | 10.0%(+18.9)#2,385 |
| 52. | Raysal | 27.7% | 10.6%(+17.0)#52 | 10.0%(+17.7)#2,612 |
| 53. | Gallipolis Ferry | 27.2% | 10.6%(+16.6)#53 | 10.0%(+17.3)#2,699 |
| 54. | West Hamlin | 25.4% | 10.6%(+14.7)#54 | 10.0%(+15.4)#3,076 |
| 55. | Pine Grove | 25.0% | 10.6%(+14.4)#55 | 10.0%(+15.0)#3,178 |
| 56. | Justice Addition | 24.6% | 10.6%(+13.9)#56 | 10.0%(+14.6)#3,293 |
| 57. | Fort Ashby | 24.5% | 10.6%(+13.8)#57 | 10.0%(+14.5)#3,315 |
| 58. | Monaville | 24.4% | 10.6%(+13.8)#58 | 10.0%(+14.5)#3,329 |
| 59. | Spencer | 24.4% | 10.6%(+13.7)#59 | 10.0%(+14.4)#3,335 |
| 60. | Tornado | 24.2% | 10.6%(+13.6)#60 | 10.0%(+14.3)#3,377 |
| 61. | Davis | 24.2% | 10.6%(+13.5)#61 | 10.0%(+14.2)#3,393 |
| 62. | Matewan | 23.5% | 10.6%(+12.9)#62 | 10.0%(+13.6)#3,568 |
| 63. | Mcmechen | 23.5% | 10.6%(+12.8)#63 | 10.0%(+13.5)#3,581 |
| 64. | Crab Orchard | 23.4% | 10.6%(+12.7)#64 | 10.0%(+13.4)#3,615 |
| 65. | Reedy | 23.3% | 10.6%(+12.7)#65 | 10.0%(+13.4)#3,624 |
| 66. | Point Pleasant | 22.7% | 10.6%(+12.0)#66 | 10.0%(+12.7)#3,825 |
| 67. | Addison Webster Springs | 22.6% | 10.6%(+11.9)#67 | 10.0%(+12.6)#3,839 |
| 68. | Hamlin | 22.3% | 10.6%(+11.7)#68 | 10.0%(+12.4)#3,907 |
| 69. | Great Cacapon | 22.2% | 10.6%(+11.6)#69 | 10.0%(+12.3)#3,929 |
| 70. | Newell | 22.0% | 10.6%(+11.3)#70 | 10.0%(+12.0)#4,027 |
| 71. | Mount Hope | 21.6% | 10.6%(+11.0)#71 | 10.0%(+11.7)#4,118 |
| 72. | Ronceverte | 21.5% | 10.6%(+10.9)#72 | 10.0%(+11.6)#4,159 |
| 73. | Wayne | 21.3% | 10.6%(+10.7)#73 | 10.0%(+11.4)#4,231 |
| 74. | Hometown | 21.3% | 10.6%(+10.6)#74 | 10.0%(+11.3)#4,233 |
| 75. | Mount Gay Shamrock | 21.2% | 10.6%(+10.6)#75 | 10.0%(+11.3)#4,249 |
| 76. | Craigsville | 20.9% | 10.6%(+10.3)#76 | 10.0%(+11.0)#4,343 |
| 77. | Montgomery | 20.9% | 10.6%(+10.3)#77 | 10.0%(+10.9)#4,359 |
| 78. | Ceredo | 20.8% | 10.6%(+10.1)#78 | 10.0%(+10.8)#4,424 |
| 79. | Oceana | 20.7% | 10.6%(+10.1)#79 | 10.0%(+10.8)#4,433 |
| 80. | Middleway | 20.4% | 10.6%(+9.73)#80 | 10.0%(+10.4)#4,571 |
| 81. | Triadelphia | 20.4% | 10.6%(+9.71)#81 | 10.0%(+10.4)#4,578 |
| 82. | Fairlea | 20.3% | 10.6%(+9.63)#82 | 10.0%(+10.3)#4,611 |
| 83. | Smithers | 20.2% | 10.6%(+9.56)#83 | 10.0%(+10.3)#4,632 |
| 84. | Philippi | 20.2% | 10.6%(+9.54)#84 | 10.0%(+10.2)#4,640 |
| 85. | Big Chimney | 20.1% | 10.6%(+9.49)#85 | 10.0%(+10.2)#4,665 |
| 86. | Montrose | 20.0% | 10.6%(+9.36)#86 | 10.0%(+10.0)#4,727 |
| 87. | Pineville | 19.9% | 10.6%(+9.28)#87 | 10.0%(+9.97)#4,814 |
| 88. | Keyser | 19.8% | 10.6%(+9.13)#88 | 10.0%(+9.82)#4,871 |
| 89. | Garten | 19.6% | 10.6%(+8.96)#89 | 10.0%(+9.66)#4,940 |
| 90. | Justice | 19.5% | 10.6%(+8.90)#90 | 10.0%(+9.59)#4,966 |
| 91. | Henderson | 19.2% | 10.6%(+8.59)#91 | 10.0%(+9.28)#5,112 |
| 92. | Delbarton | 19.2% | 10.6%(+8.56)#92 | 10.0%(+9.25)#5,132 |
| 93. | Hinton | 18.9% | 10.6%(+8.30)#93 | 10.0%(+9.00)#5,236 |
| 94. | Boomer | 18.8% | 10.6%(+8.17)#94 | 10.0%(+8.86)#5,280 |
| 95. | Logan | 18.8% | 10.6%(+8.11)#95 | 10.0%(+8.80)#5,297 |
| 96. | Lester | 18.7% | 10.6%(+8.05)#96 | 10.0%(+8.74)#5,331 |
| 97. | Albright | 18.4% | 10.6%(+7.78)#97 | 10.0%(+8.47)#5,461 |
| 98. | Parsons | 18.2% | 10.6%(+7.54)#98 | 10.0%(+8.23)#5,556 |
| 99. | Pennsboro | 18.0% | 10.6%(+7.36)#99 | 10.0%(+8.05)#5,661 |
| 100. | West Milford | 17.9% | 10.6%(+7.30)#100 | 10.0%(+8.00)#5,688 |
Common Questions
What are the Top 10 Cities with the Highest Poverty Level Among Seniors Over the Age of 65 in West Virginia?
Top 10 Cities with the Highest Poverty Level Among Seniors Over the Age of 65 in West Virginia are:
#1
100.0%
#2
100.0%
#3
100.0%
#4
100.0%
#5
100.0%
#6
100.0%
#7
100.0%
#8
92.6%
#9
79.4%
#10
75.0%
What city has the Highest Poverty Level Among Seniors Over the Age of 65 in West Virginia?
Red Jacket has the Highest Poverty Level Among Seniors Over the Age of 65 in West Virginia with 100.0%.
What is the Poverty Level Among Seniors Over the Age of 65 in the State of West Virginia?
Poverty Level Among Seniors Over the Age of 65 in West Virginia is 10.6%.
What is the Poverty Level Among Seniors Over the Age of 65 in the United States?
Poverty Level Among Seniors Over the Age of 65 in the United States is 10.0%.