Cities with the Highest Poverty Level Among Seniors Over the Age of 65 in Utah
RELATED REPORTS & OPTIONS
Highest Poverty | Seniors 65+
Utah
Compare Cities
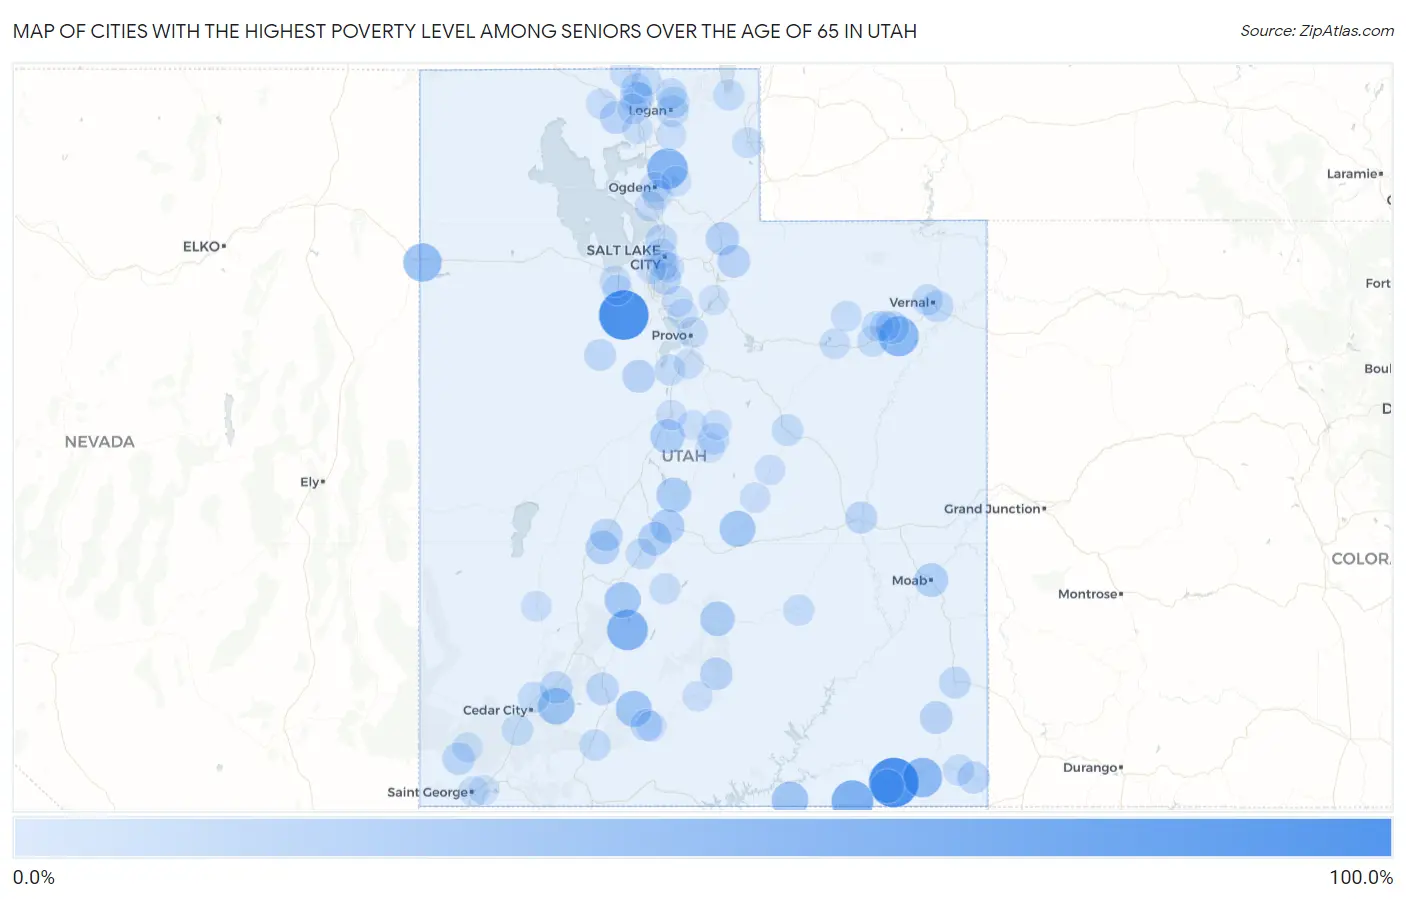
Map of Cities with the Highest Poverty Level Among Seniors Over the Age of 65 in Utah
0.0%
100.0%
Cities with the Highest Poverty Level Among Seniors Over the Age of 65 in Utah
| City | Senior Poverty | vs State | vs National | |
| 1. | Ophir | 100.0% | 6.6%(+93.4)#1 | 10.0%(+90.0)#178 |
| 2. | Mexican Hat | 100.0% | 6.6%(+93.4)#2 | 10.0%(+90.0)#194 |
| 3. | Oljato Monument Valley | 62.1% | 6.6%(+55.6)#3 | 10.0%(+52.2)#476 |
| 4. | Junction | 57.1% | 6.6%(+50.6)#4 | 10.0%(+47.2)#552 |
| 5. | Liberty | 56.3% | 6.6%(+49.7)#5 | 10.0%(+46.4)#578 |
| 6. | Randlett | 53.3% | 6.6%(+46.8)#6 | 10.0%(+43.4)#660 |
| 7. | Tselakai Dezza | 50.0% | 6.6%(+43.4)#7 | 10.0%(+40.0)#781 |
| 8. | Wendover | 46.0% | 6.6%(+39.5)#8 | 10.0%(+36.1)#934 |
| 9. | Navajo Mountain | 37.5% | 6.6%(+30.9)#9 | 10.0%(+27.5)#1,407 |
| 10. | Brian Head | 37.5% | 6.6%(+30.9)#10 | 10.0%(+27.5)#1,419 |
| 11. | Bryce Canyon City | 34.6% | 6.6%(+28.1)#11 | 10.0%(+24.7)#1,664 |
| 12. | Emery | 34.3% | 6.6%(+27.8)#12 | 10.0%(+24.4)#1,690 |
| 13. | Marysvale | 34.1% | 6.6%(+27.6)#13 | 10.0%(+24.2)#1,707 |
| 14. | Gunnison | 28.3% | 6.6%(+21.7)#14 | 10.0%(+18.3)#2,493 |
| 15. | Levan | 26.8% | 6.6%(+20.3)#15 | 10.0%(+16.9)#2,753 |
| 16. | Torrey | 26.8% | 6.6%(+20.2)#16 | 10.0%(+16.8)#2,768 |
| 17. | Salina | 25.5% | 6.6%(+19.0)#17 | 10.0%(+15.6)#3,024 |
| 18. | Halchita | 25.0% | 6.6%(+18.4)#18 | 10.0%(+15.0)#3,173 |
| 19. | Moab | 24.4% | 6.6%(+17.8)#19 | 10.0%(+14.4)#3,347 |
| 20. | Sigurd | 23.7% | 6.6%(+17.1)#20 | 10.0%(+13.7)#3,519 |
| 21. | Kanosh | 23.5% | 6.6%(+17.0)#21 | 10.0%(+13.6)#3,565 |
| 22. | Hobble Creek | 22.9% | 6.6%(+16.3)#22 | 10.0%(+12.9)#3,773 |
| 23. | Hoytsville | 22.3% | 6.6%(+15.7)#23 | 10.0%(+12.3)#3,913 |
| 24. | Fort Duchesne | 20.7% | 6.6%(+14.1)#24 | 10.0%(+10.7)#4,448 |
| 25. | Eureka | 19.7% | 6.6%(+13.2)#25 | 10.0%(+9.78)#4,892 |
| 26. | Thatcher | 19.4% | 6.6%(+12.9)#26 | 10.0%(+9.49)#5,009 |
| 27. | Oakley | 19.3% | 6.6%(+12.8)#27 | 10.0%(+9.39)#5,070 |
| 28. | Blanding | 19.2% | 6.6%(+12.7)#28 | 10.0%(+9.26)#5,125 |
| 29. | Boulder | 19.1% | 6.6%(+12.5)#29 | 10.0%(+9.13)#5,181 |
| 30. | Meadow | 18.9% | 6.6%(+12.3)#30 | 10.0%(+8.92)#5,262 |
| 31. | Veyo | 18.8% | 6.6%(+12.3)#31 | 10.0%(+8.86)#5,281 |
| 32. | Parowan | 18.7% | 6.6%(+12.1)#32 | 10.0%(+8.72)#5,339 |
| 33. | Panguitch | 18.6% | 6.6%(+12.1)#33 | 10.0%(+8.66)#5,360 |
| 34. | Aneth | 17.2% | 6.6%(+10.7)#34 | 10.0%(+7.29)#6,082 |
| 35. | Riverside | 16.9% | 6.6%(+10.4)#35 | 10.0%(+6.96)#6,278 |
| 36. | Green River | 16.3% | 6.6%(+9.77)#36 | 10.0%(+6.37)#6,639 |
| 37. | Cannonville | 16.1% | 6.6%(+9.57)#37 | 10.0%(+6.18)#6,754 |
| 38. | Midvale | 16.1% | 6.6%(+9.56)#38 | 10.0%(+6.17)#6,764 |
| 39. | Naples | 15.7% | 6.6%(+9.12)#39 | 10.0%(+5.73)#7,038 |
| 40. | River Heights | 15.6% | 6.6%(+9.02)#40 | 10.0%(+5.63)#7,102 |
| 41. | Monticello | 15.4% | 6.6%(+8.85)#41 | 10.0%(+5.46)#7,208 |
| 42. | Vernon | 15.3% | 6.6%(+8.69)#42 | 10.0%(+5.30)#7,320 |
| 43. | Woods Cross | 15.0% | 6.6%(+8.45)#43 | 10.0%(+5.06)#7,480 |
| 44. | Price | 14.4% | 6.6%(+7.84)#44 | 10.0%(+4.45)#7,915 |
| 45. | Mount Pleasant | 13.7% | 6.6%(+7.17)#45 | 10.0%(+3.77)#8,507 |
| 46. | North Logan | 13.6% | 6.6%(+7.08)#46 | 10.0%(+3.69)#8,582 |
| 47. | Enoch | 13.6% | 6.6%(+7.01)#47 | 10.0%(+3.62)#8,650 |
| 48. | Alton | 13.2% | 6.6%(+6.60)#48 | 10.0%(+3.21)#9,031 |
| 49. | Maeser | 13.1% | 6.6%(+6.51)#49 | 10.0%(+3.12)#9,111 |
| 50. | Kanarraville | 12.8% | 6.6%(+6.26)#50 | 10.0%(+2.87)#9,327 |
| 51. | Plymouth | 12.8% | 6.6%(+6.21)#51 | 10.0%(+2.81)#9,383 |
| 52. | Montezuma Creek | 12.5% | 6.6%(+5.94)#52 | 10.0%(+2.55)#9,641 |
| 53. | Erda | 12.4% | 6.6%(+5.86)#53 | 10.0%(+2.47)#9,733 |
| 54. | Laketown | 12.2% | 6.6%(+5.64)#54 | 10.0%(+2.24)#9,940 |
| 55. | Genola | 12.1% | 6.6%(+5.51)#55 | 10.0%(+2.12)#10,075 |
| 56. | Myton | 11.8% | 6.6%(+5.28)#56 | 10.0%(+1.89)#10,305 |
| 57. | Hanksville | 11.8% | 6.6%(+5.21)#57 | 10.0%(+1.81)#10,400 |
| 58. | Roosevelt | 11.7% | 6.6%(+5.18)#58 | 10.0%(+1.79)#10,445 |
| 59. | East Basin | 11.7% | 6.6%(+5.13)#59 | 10.0%(+1.74)#10,497 |
| 60. | Ogden | 11.6% | 6.6%(+5.06)#60 | 10.0%(+1.67)#10,578 |
| 61. | Richfield | 11.4% | 6.6%(+4.88)#61 | 10.0%(+1.49)#10,740 |
| 62. | Smithfield | 11.4% | 6.6%(+4.86)#62 | 10.0%(+1.47)#10,764 |
| 63. | Koosharem | 11.1% | 6.6%(+4.55)#63 | 10.0%(+1.16)#11,119 |
| 64. | Duchesne | 10.8% | 6.6%(+4.24)#64 | 10.0%(+0.844)#11,484 |
| 65. | Altamont | 10.7% | 6.6%(+4.15)#65 | 10.0%(+0.763)#11,581 |
| 66. | White | 10.6% | 6.6%(+4.08)#66 | 10.0%(+0.689)#11,661 |
| 67. | Provo | 10.6% | 6.6%(+4.01)#67 | 10.0%(+0.617)#11,740 |
| 68. | Portage | 10.5% | 6.6%(+3.97)#68 | 10.0%(+0.575)#11,799 |
| 69. | Alpine | 10.5% | 6.6%(+3.92)#69 | 10.0%(+0.531)#11,852 |
| 70. | Ballard | 10.3% | 6.6%(+3.74)#70 | 10.0%(+0.351)#12,083 |
| 71. | Howell | 10.2% | 6.6%(+3.67)#71 | 10.0%(+0.276)#12,181 |
| 72. | Fielding | 10.0% | 6.6%(+3.44)#72 | 10.0%(+0.048)#12,448 |
| 73. | Woodruff | 10.0% | 6.6%(+3.44)#73 | 10.0%(+0.048)#12,478 |
| 74. | Salt Lake City | 10.0% | 6.6%(+3.43)#74 | 10.0%(+0.041)#12,530 |
| 75. | Henrieville | 9.8% | 6.6%(+3.20)#75 | 10.0%(-0.196)#12,823 |
| 76. | Milford | 9.6% | 6.6%(+3.09)#76 | 10.0%(-0.303)#12,963 |
| 77. | Garland | 9.5% | 6.6%(+2.95)#77 | 10.0%(-0.446)#13,164 |
| 78. | South Salt Lake | 9.5% | 6.6%(+2.90)#78 | 10.0%(-0.488)#13,206 |
| 79. | Millcreek | 9.4% | 6.6%(+2.88)#79 | 10.0%(-0.516)#13,235 |
| 80. | Nephi | 9.4% | 6.6%(+2.87)#80 | 10.0%(-0.521)#13,246 |
| 81. | Clearfield | 9.4% | 6.6%(+2.82)#81 | 10.0%(-0.568)#13,292 |
| 82. | Huntington | 9.1% | 6.6%(+2.53)#82 | 10.0%(-0.861)#13,627 |
| 83. | Clawson | 9.1% | 6.6%(+2.53)#83 | 10.0%(-0.861)#13,699 |
| 84. | South Ogden | 9.1% | 6.6%(+2.51)#84 | 10.0%(-0.880)#13,717 |
| 85. | Tooele | 9.0% | 6.6%(+2.48)#85 | 10.0%(-0.908)#13,733 |
| 86. | Escalante | 8.7% | 6.6%(+2.14)#86 | 10.0%(-1.26)#14,174 |
| 87. | Bear River City | 8.7% | 6.6%(+2.10)#87 | 10.0%(-1.29)#14,226 |
| 88. | Huntsville | 8.4% | 6.6%(+1.85)#88 | 10.0%(-1.54)#14,580 |
| 89. | Paradise | 8.1% | 6.6%(+1.52)#89 | 10.0%(-1.87)#15,031 |
| 90. | Spring City | 8.1% | 6.6%(+1.51)#90 | 10.0%(-1.88)#15,048 |
| 91. | Charleston | 7.9% | 6.6%(+1.31)#91 | 10.0%(-2.09)#15,353 |
| 92. | West Valley City | 7.8% | 6.6%(+1.28)#92 | 10.0%(-2.11)#15,396 |
| 93. | St George | 7.8% | 6.6%(+1.23)#93 | 10.0%(-2.16)#15,457 |
| 94. | Fountain Green | 7.7% | 6.6%(+1.18)#94 | 10.0%(-2.21)#15,520 |
| 95. | Fairview | 7.7% | 6.6%(+1.13)#95 | 10.0%(-2.26)#15,578 |
| 96. | Washington | 7.7% | 6.6%(+1.09)#96 | 10.0%(-2.30)#15,691 |
| 97. | Clarkston | 7.6% | 6.6%(+1.08)#97 | 10.0%(-2.31)#15,703 |
| 98. | Central | 7.5% | 6.6%(+0.980)#98 | 10.0%(-2.41)#15,844 |
| 99. | Pleasant Grove | 7.5% | 6.6%(+0.952)#99 | 10.0%(-2.44)#15,881 |
| 100. | Salem | 7.5% | 6.6%(+0.896)#100 | 10.0%(-2.50)#15,954 |
Common Questions
What are the Top 10 Cities with the Highest Poverty Level Among Seniors Over the Age of 65 in Utah?
Top 10 Cities with the Highest Poverty Level Among Seniors Over the Age of 65 in Utah are:
#1
100.0%
#2
100.0%
#3
62.1%
#4
57.1%
#5
56.3%
#6
53.3%
#7
50.0%
#8
46.0%
#9
37.5%
#10
37.5%
What city has the Highest Poverty Level Among Seniors Over the Age of 65 in Utah?
Ophir has the Highest Poverty Level Among Seniors Over the Age of 65 in Utah with 100.0%.
What is the Poverty Level Among Seniors Over the Age of 65 in the State of Utah?
Poverty Level Among Seniors Over the Age of 65 in Utah is 6.6%.
What is the Poverty Level Among Seniors Over the Age of 65 in the United States?
Poverty Level Among Seniors Over the Age of 65 in the United States is 10.0%.