Cities with the Highest Poverty Level Among Seniors Over the Age of 65 in Alabama
RELATED REPORTS & OPTIONS
Highest Poverty | Seniors 65+
Alabama
Compare Cities
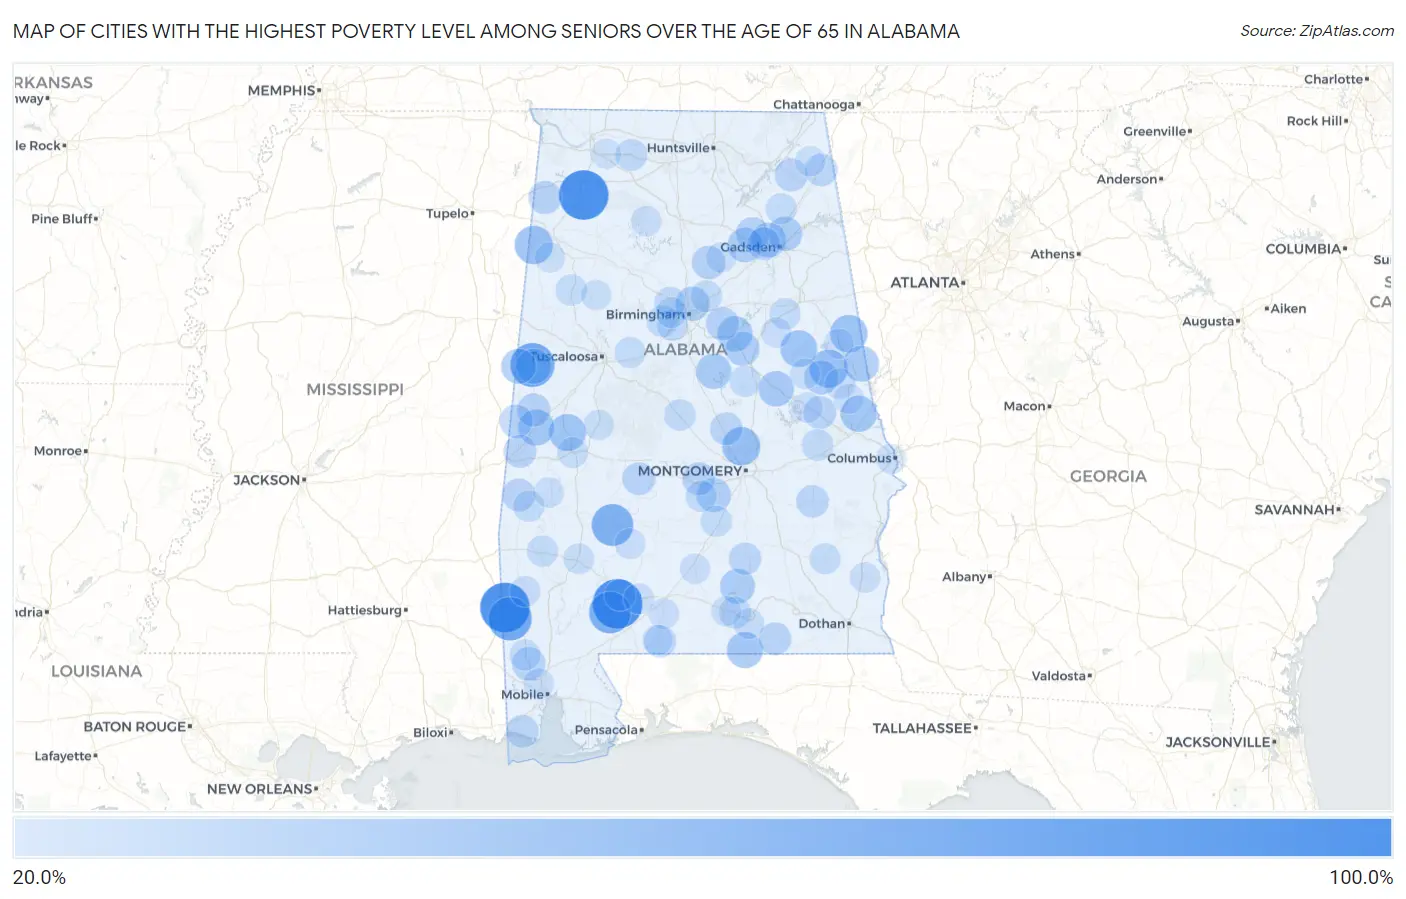
Map of Cities with the Highest Poverty Level Among Seniors Over the Age of 65 in Alabama
0.0%
100.0%
Cities with the Highest Poverty Level Among Seniors Over the Age of 65 in Alabama
| City | Senior Poverty | vs State | vs National | |
| 1. | Fruitdale | 100.0% | 11.0%(+89.0)#1 | 10.0%(+90.0)#102 |
| 2. | Spruce Pine | 100.0% | 11.0%(+89.0)#2 | 10.0%(+90.0)#109 |
| 3. | Megargel | 100.0% | 11.0%(+89.0)#3 | 10.0%(+90.0)#218 |
| 4. | Mcmullen | 76.5% | 11.0%(+65.5)#4 | 10.0%(+66.5)#304 |
| 5. | Vinegar Bend | 74.4% | 11.0%(+63.4)#5 | 10.0%(+64.4)#323 |
| 6. | Uriah | 68.2% | 11.0%(+57.2)#6 | 10.0%(+58.2)#386 |
| 7. | Yellow Bluff | 67.3% | 11.0%(+56.3)#7 | 10.0%(+57.3)#399 |
| 8. | Elmore | 53.0% | 11.0%(+42.0)#8 | 10.0%(+43.1)#666 |
| 9. | Detroit | 52.6% | 11.0%(+41.7)#9 | 10.0%(+42.7)#674 |
| 10. | Wadley | 52.1% | 11.0%(+41.2)#10 | 10.0%(+42.2)#689 |
| 11. | Woodland | 50.0% | 11.0%(+39.0)#11 | 10.0%(+40.0)#742 |
| 12. | Mount Olive Cdp Coosa County | 48.6% | 11.0%(+37.7)#12 | 10.0%(+38.7)#840 |
| 13. | Forkland | 47.8% | 11.0%(+36.8)#13 | 10.0%(+37.8)#868 |
| 14. | Ashland | 47.4% | 11.0%(+36.4)#14 | 10.0%(+37.4)#880 |
| 15. | Florala | 44.7% | 11.0%(+33.8)#15 | 10.0%(+34.8)#990 |
| 16. | Epes | 44.4% | 11.0%(+33.5)#16 | 10.0%(+34.5)#997 |
| 17. | Cusseta | 44.4% | 11.0%(+33.5)#17 | 10.0%(+34.5)#1,001 |
| 18. | Rock Mills | 42.4% | 11.0%(+31.4)#18 | 10.0%(+32.4)#1,100 |
| 19. | Kellyton | 41.7% | 11.0%(+30.7)#19 | 10.0%(+31.7)#1,137 |
| 20. | Shelby | 41.1% | 11.0%(+30.1)#20 | 10.0%(+31.1)#1,181 |
| 21. | Vincent | 40.6% | 11.0%(+29.6)#21 | 10.0%(+30.6)#1,209 |
| 22. | Aliceville | 40.2% | 11.0%(+29.2)#22 | 10.0%(+30.3)#1,227 |
| 23. | Memphis | 40.0% | 11.0%(+29.0)#23 | 10.0%(+30.0)#1,261 |
| 24. | Dozier | 39.4% | 11.0%(+28.5)#24 | 10.0%(+29.5)#1,286 |
| 25. | Ridgeville | 39.3% | 11.0%(+28.3)#25 | 10.0%(+29.3)#1,298 |
| 26. | Altoona | 39.0% | 11.0%(+28.0)#26 | 10.0%(+29.0)#1,314 |
| 27. | Lookout Mountain | 37.5% | 11.0%(+26.6)#27 | 10.0%(+27.6)#1,404 |
| 28. | Daviston | 37.0% | 11.0%(+26.1)#28 | 10.0%(+27.1)#1,455 |
| 29. | Bon Air | 36.8% | 11.0%(+25.9)#29 | 10.0%(+26.9)#1,476 |
| 30. | Hayneville | 36.6% | 11.0%(+25.7)#30 | 10.0%(+26.7)#1,492 |
| 31. | Tarrant | 36.6% | 11.0%(+25.7)#31 | 10.0%(+26.7)#1,493 |
| 32. | Locust Fork | 34.4% | 11.0%(+23.5)#32 | 10.0%(+24.5)#1,680 |
| 33. | Gainesville | 33.3% | 11.0%(+22.4)#33 | 10.0%(+23.4)#1,774 |
| 34. | Bristow Cove | 33.3% | 11.0%(+22.4)#34 | 10.0%(+23.4)#1,783 |
| 35. | Chunchula | 33.3% | 11.0%(+22.4)#35 | 10.0%(+23.4)#1,793 |
| 36. | Emelle | 33.3% | 11.0%(+22.4)#36 | 10.0%(+23.4)#1,814 |
| 37. | Vina | 32.7% | 11.0%(+21.8)#37 | 10.0%(+22.8)#1,866 |
| 38. | Vandiver | 32.2% | 11.0%(+21.2)#38 | 10.0%(+22.2)#1,920 |
| 39. | York | 31.9% | 11.0%(+20.9)#39 | 10.0%(+21.9)#1,960 |
| 40. | Camp Hill | 31.6% | 11.0%(+20.6)#40 | 10.0%(+21.6)#1,995 |
| 41. | Lisman | 31.5% | 11.0%(+20.6)#41 | 10.0%(+21.6)#2,011 |
| 42. | Powell | 31.5% | 11.0%(+20.5)#42 | 10.0%(+21.6)#2,014 |
| 43. | Ivalee | 31.5% | 11.0%(+20.5)#43 | 10.0%(+21.6)#2,015 |
| 44. | White Hall | 31.4% | 11.0%(+20.4)#44 | 10.0%(+21.4)#2,029 |
| 45. | Samson | 31.0% | 11.0%(+20.0)#45 | 10.0%(+21.0)#2,077 |
| 46. | Orrville | 30.9% | 11.0%(+19.9)#46 | 10.0%(+21.0)#2,084 |
| 47. | Marbury | 30.6% | 11.0%(+19.6)#47 | 10.0%(+20.6)#2,128 |
| 48. | Bayou La Batre | 30.5% | 11.0%(+19.5)#48 | 10.0%(+20.5)#2,139 |
| 49. | Hammondville | 30.2% | 11.0%(+19.2)#49 | 10.0%(+20.3)#2,175 |
| 50. | Union Springs | 30.1% | 11.0%(+19.1)#50 | 10.0%(+20.1)#2,186 |
| 51. | Rutledge | 29.4% | 11.0%(+18.4)#51 | 10.0%(+19.5)#2,295 |
| 52. | East Brewton | 28.9% | 11.0%(+17.9)#52 | 10.0%(+18.9)#2,376 |
| 53. | Sanford | 28.0% | 11.0%(+17.0)#53 | 10.0%(+18.0)#2,543 |
| 54. | North Courtland | 27.2% | 11.0%(+16.2)#54 | 10.0%(+17.2)#2,702 |
| 55. | Concord | 26.6% | 11.0%(+15.6)#55 | 10.0%(+16.6)#2,805 |
| 56. | Notasulga | 26.5% | 11.0%(+15.5)#56 | 10.0%(+16.5)#2,823 |
| 57. | Maplesville | 26.4% | 11.0%(+15.4)#57 | 10.0%(+16.4)#2,847 |
| 58. | Grayson Valley | 26.3% | 11.0%(+15.3)#58 | 10.0%(+16.3)#2,868 |
| 59. | Frisco City | 26.1% | 11.0%(+15.2)#59 | 10.0%(+16.2)#2,897 |
| 60. | Brighton | 25.6% | 11.0%(+14.7)#60 | 10.0%(+15.7)#3,000 |
| 61. | Adamsville | 25.5% | 11.0%(+14.5)#61 | 10.0%(+15.5)#3,048 |
| 62. | Coffeeville | 25.4% | 11.0%(+14.4)#62 | 10.0%(+15.4)#3,078 |
| 63. | Fayette | 25.3% | 11.0%(+14.4)#63 | 10.0%(+15.4)#3,091 |
| 64. | Fort Deposit | 25.3% | 11.0%(+14.3)#64 | 10.0%(+15.3)#3,099 |
| 65. | Mosses | 25.3% | 11.0%(+14.3)#65 | 10.0%(+15.3)#3,103 |
| 66. | Butler | 25.2% | 11.0%(+14.2)#66 | 10.0%(+15.2)#3,117 |
| 67. | Munford | 25.2% | 11.0%(+14.2)#67 | 10.0%(+15.2)#3,118 |
| 68. | Weogufka | 24.5% | 11.0%(+13.6)#68 | 10.0%(+14.6)#3,299 |
| 69. | Clio | 24.3% | 11.0%(+13.3)#69 | 10.0%(+14.3)#3,371 |
| 70. | Crossville | 24.2% | 11.0%(+13.2)#70 | 10.0%(+14.2)#3,398 |
| 71. | Gulfcrest | 24.1% | 11.0%(+13.2)#71 | 10.0%(+14.2)#3,421 |
| 72. | Brookwood | 24.1% | 11.0%(+13.2)#72 | 10.0%(+14.2)#3,424 |
| 73. | Edgewater | 23.9% | 11.0%(+13.0)#73 | 10.0%(+14.0)#3,462 |
| 74. | Demopolis | 23.7% | 11.0%(+12.8)#74 | 10.0%(+13.8)#3,505 |
| 75. | Onycha | 23.3% | 11.0%(+12.4)#75 | 10.0%(+13.4)#3,623 |
| 76. | Penton | 23.3% | 11.0%(+12.3)#76 | 10.0%(+13.3)#3,654 |
| 77. | Chatom | 23.2% | 11.0%(+12.2)#77 | 10.0%(+13.2)#3,671 |
| 78. | Grove Hill | 23.1% | 11.0%(+12.1)#78 | 10.0%(+13.1)#3,694 |
| 79. | Vredenburgh | 22.7% | 11.0%(+11.8)#79 | 10.0%(+12.8)#3,813 |
| 80. | Repton | 22.5% | 11.0%(+11.5)#80 | 10.0%(+12.5)#3,873 |
| 81. | Prichard | 22.4% | 11.0%(+11.4)#81 | 10.0%(+12.5)#3,888 |
| 82. | Addison | 22.2% | 11.0%(+11.2)#82 | 10.0%(+12.3)#3,931 |
| 83. | Abbeville | 22.2% | 11.0%(+11.2)#83 | 10.0%(+12.3)#3,973 |
| 84. | Pennington | 22.1% | 11.0%(+11.1)#84 | 10.0%(+12.1)#3,999 |
| 85. | Castleberry | 22.0% | 11.0%(+11.0)#85 | 10.0%(+12.0)#4,034 |
| 86. | Berry | 21.9% | 11.0%(+10.9)#86 | 10.0%(+11.9)#4,061 |
| 87. | Greensboro | 21.8% | 11.0%(+10.8)#87 | 10.0%(+11.8)#4,076 |
| 88. | Waldo | 21.6% | 11.0%(+10.6)#88 | 10.0%(+11.7)#4,122 |
| 89. | Dadeville | 21.6% | 11.0%(+10.6)#89 | 10.0%(+11.7)#4,128 |
| 90. | Georgiana | 21.5% | 11.0%(+10.6)#90 | 10.0%(+11.6)#4,149 |
| 91. | Beaverton | 21.4% | 11.0%(+10.5)#91 | 10.0%(+11.5)#4,187 |
| 92. | Goldville | 21.4% | 11.0%(+10.5)#92 | 10.0%(+11.5)#4,194 |
| 93. | Brewton | 21.4% | 11.0%(+10.4)#93 | 10.0%(+11.5)#4,201 |
| 94. | Leighton | 21.3% | 11.0%(+10.4)#94 | 10.0%(+11.4)#4,218 |
| 95. | Henagar | 21.3% | 11.0%(+10.3)#95 | 10.0%(+11.4)#4,226 |
| 96. | La Fayette | 21.3% | 11.0%(+10.3)#96 | 10.0%(+11.4)#4,229 |
| 97. | Oneonta | 21.3% | 11.0%(+10.3)#97 | 10.0%(+11.3)#4,234 |
| 98. | Andalusia | 21.1% | 11.0%(+10.1)#98 | 10.0%(+11.1)#4,297 |
| 99. | Wedowee | 20.9% | 11.0%(+9.91)#99 | 10.0%(+10.9)#4,370 |
| 100. | Phenix City | 20.8% | 11.0%(+9.84)#100 | 10.0%(+10.9)#4,405 |
Common Questions
What are the Top 10 Cities with the Highest Poverty Level Among Seniors Over the Age of 65 in Alabama?
Top 10 Cities with the Highest Poverty Level Among Seniors Over the Age of 65 in Alabama are:
#1
100.0%
#2
100.0%
#3
100.0%
#4
76.5%
#5
74.4%
#6
68.2%
#7
67.3%
#8
53.0%
#9
52.6%
#10
52.1%
What city has the Highest Poverty Level Among Seniors Over the Age of 65 in Alabama?
Fruitdale has the Highest Poverty Level Among Seniors Over the Age of 65 in Alabama with 100.0%.
What is the Poverty Level Among Seniors Over the Age of 65 in the State of Alabama?
Poverty Level Among Seniors Over the Age of 65 in Alabama is 11.0%.
What is the Poverty Level Among Seniors Over the Age of 65 in the United States?
Poverty Level Among Seniors Over the Age of 65 in the United States is 10.0%.