Cities with the Highest Poverty Level Among Seniors Over the Age of 65 in Georgia
RELATED REPORTS & OPTIONS
Highest Poverty | Seniors 65+
Georgia
Compare Cities
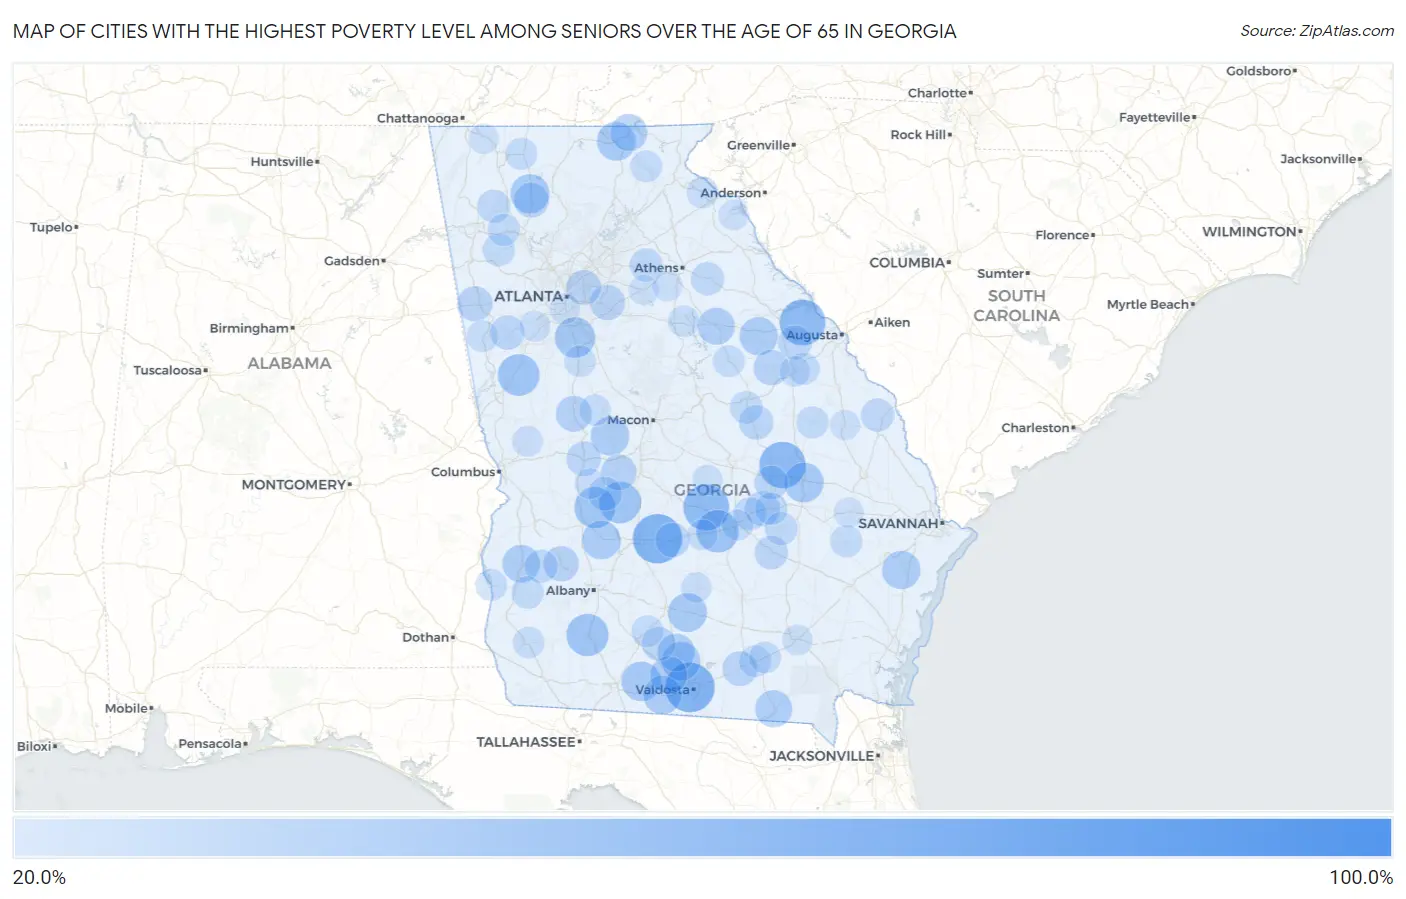
Map of Cities with the Highest Poverty Level Among Seniors Over the Age of 65 in Georgia
0.0%
100.0%
Cities with the Highest Poverty Level Among Seniors Over the Age of 65 in Georgia
| City | Senior Poverty | vs State | vs National | |
| 1. | Gough | 100.0% | 10.3%(+89.7)#1 | 10.0%(+90.0)#107 |
| 2. | Everett | 100.0% | 10.3%(+89.7)#2 | 10.0%(+90.0)#152 |
| 3. | Remerton | 66.7% | 10.3%(+56.3)#3 | 10.0%(+56.7)#404 |
| 4. | Seville | 66.7% | 10.3%(+56.3)#4 | 10.0%(+56.7)#418 |
| 5. | Norristown | 60.0% | 10.3%(+49.7)#5 | 10.0%(+50.0)#516 |
| 6. | Eastman | 59.0% | 10.3%(+48.7)#6 | 10.0%(+49.1)#529 |
| 7. | Appling | 58.8% | 10.3%(+48.4)#7 | 10.0%(+48.8)#532 |
| 8. | Bristol | 55.0% | 10.3%(+44.7)#8 | 10.0%(+45.0)#614 |
| 9. | Piney Grove | 54.9% | 10.3%(+44.6)#9 | 10.0%(+44.9)#616 |
| 10. | Milan | 51.9% | 10.3%(+41.5)#10 | 10.0%(+41.9)#695 |
| 11. | Camilla | 50.9% | 10.3%(+40.6)#11 | 10.0%(+40.9)#727 |
| 12. | Lone Oak | 50.0% | 10.3%(+39.7)#12 | 10.0%(+40.0)#760 |
| 13. | Dooling | 50.0% | 10.3%(+39.7)#13 | 10.0%(+40.0)#799 |
| 14. | Andersonville | 49.1% | 10.3%(+38.8)#14 | 10.0%(+39.1)#823 |
| 15. | Lovejoy | 47.2% | 10.3%(+36.9)#15 | 10.0%(+37.2)#890 |
| 16. | Oak Park | 45.8% | 10.3%(+35.5)#16 | 10.0%(+35.9)#942 |
| 17. | Barwick | 45.3% | 10.3%(+35.0)#17 | 10.0%(+35.4)#970 |
| 18. | Dixie | 44.8% | 10.3%(+34.5)#18 | 10.0%(+34.9)#982 |
| 19. | Ranger | 44.4% | 10.3%(+34.1)#19 | 10.0%(+34.5)#1,003 |
| 20. | Enigma | 44.3% | 10.3%(+34.0)#20 | 10.0%(+34.4)#1,008 |
| 21. | Blairsville | 43.8% | 10.3%(+33.4)#21 | 10.0%(+33.8)#1,031 |
| 22. | Roberta | 43.3% | 10.3%(+33.0)#22 | 10.0%(+33.4)#1,061 |
| 23. | Leslie | 43.3% | 10.3%(+33.0)#23 | 10.0%(+33.3)#1,065 |
| 24. | Cecil | 43.3% | 10.3%(+33.0)#24 | 10.0%(+33.3)#1,066 |
| 25. | Riceboro | 43.0% | 10.3%(+32.7)#25 | 10.0%(+33.1)#1,071 |
| 26. | Norwood | 43.0% | 10.3%(+32.7)#26 | 10.0%(+33.1)#1,073 |
| 27. | Quitman | 42.9% | 10.3%(+32.5)#27 | 10.0%(+32.9)#1,077 |
| 28. | Adel | 41.6% | 10.3%(+31.3)#28 | 10.0%(+31.7)#1,142 |
| 29. | Cuthbert | 41.6% | 10.3%(+31.3)#29 | 10.0%(+31.7)#1,144 |
| 30. | Box Springs | 41.2% | 10.3%(+30.9)#30 | 10.0%(+31.3)#1,165 |
| 31. | Morven | 40.9% | 10.3%(+30.6)#31 | 10.0%(+31.0)#1,191 |
| 32. | Fargo | 40.3% | 10.3%(+30.0)#32 | 10.0%(+30.4)#1,219 |
| 33. | Siloam | 40.3% | 10.3%(+29.9)#33 | 10.0%(+30.3)#1,221 |
| 34. | Young Harris | 40.2% | 10.3%(+29.9)#34 | 10.0%(+30.3)#1,224 |
| 35. | Marshallville | 37.7% | 10.3%(+27.4)#35 | 10.0%(+27.7)#1,399 |
| 36. | Thomaston | 37.6% | 10.3%(+27.3)#36 | 10.0%(+27.6)#1,402 |
| 37. | Dawson | 36.8% | 10.3%(+26.5)#37 | 10.0%(+26.9)#1,477 |
| 38. | Gibson | 36.8% | 10.3%(+26.4)#38 | 10.0%(+26.8)#1,483 |
| 39. | Waco | 36.3% | 10.3%(+26.0)#39 | 10.0%(+26.3)#1,521 |
| 40. | Fairmount | 36.2% | 10.3%(+25.9)#40 | 10.0%(+26.3)#1,523 |
| 41. | Crescent | 36.2% | 10.3%(+25.9)#41 | 10.0%(+26.3)#1,525 |
| 42. | Lakeview Estates | 36.2% | 10.3%(+25.9)#42 | 10.0%(+26.3)#1,527 |
| 43. | Glenwood | 35.9% | 10.3%(+25.5)#43 | 10.0%(+25.9)#1,555 |
| 44. | Clarkston | 35.9% | 10.3%(+25.5)#44 | 10.0%(+25.9)#1,558 |
| 45. | Du Pont | 35.5% | 10.3%(+25.2)#45 | 10.0%(+25.5)#1,602 |
| 46. | Butler | 35.0% | 10.3%(+24.7)#46 | 10.0%(+25.1)#1,636 |
| 47. | Rochelle | 34.8% | 10.3%(+24.4)#47 | 10.0%(+24.8)#1,653 |
| 48. | Harrison | 34.4% | 10.3%(+24.1)#48 | 10.0%(+24.5)#1,683 |
| 49. | Whitesburg | 34.2% | 10.3%(+23.9)#49 | 10.0%(+24.3)#1,695 |
| 50. | Dearing | 33.8% | 10.3%(+23.5)#50 | 10.0%(+23.9)#1,723 |
| 51. | Eulonia | 33.7% | 10.3%(+23.3)#51 | 10.0%(+23.7)#1,733 |
| 52. | Ellenton | 33.3% | 10.3%(+23.0)#52 | 10.0%(+23.4)#1,773 |
| 53. | Oglethorpe | 33.2% | 10.3%(+22.9)#53 | 10.0%(+23.3)#1,840 |
| 54. | Soperton | 33.1% | 10.3%(+22.7)#54 | 10.0%(+23.1)#1,848 |
| 55. | Hazlehurst | 32.6% | 10.3%(+22.3)#55 | 10.0%(+22.7)#1,875 |
| 56. | Crawford | 32.5% | 10.3%(+22.2)#56 | 10.0%(+22.6)#1,887 |
| 57. | Hiltonia | 32.3% | 10.3%(+21.9)#57 | 10.0%(+22.3)#1,910 |
| 58. | Russell | 32.2% | 10.3%(+21.9)#58 | 10.0%(+22.3)#1,914 |
| 59. | Plainville | 32.0% | 10.3%(+21.7)#59 | 10.0%(+22.0)#1,936 |
| 60. | Shellman | 31.9% | 10.3%(+21.6)#60 | 10.0%(+22.0)#1,952 |
| 61. | Waverly | 31.8% | 10.3%(+21.5)#61 | 10.0%(+21.9)#1,969 |
| 62. | Alamo | 31.6% | 10.3%(+21.3)#62 | 10.0%(+21.6)#1,994 |
| 63. | Uvalda | 31.5% | 10.3%(+21.2)#63 | 10.0%(+21.6)#2,013 |
| 64. | Tennille | 31.3% | 10.3%(+21.0)#64 | 10.0%(+21.4)#2,034 |
| 65. | Taylorsville | 30.8% | 10.3%(+20.5)#65 | 10.0%(+20.9)#2,091 |
| 66. | Edison | 30.6% | 10.3%(+20.3)#66 | 10.0%(+20.6)#2,129 |
| 67. | Midville | 30.4% | 10.3%(+20.0)#67 | 10.0%(+20.4)#2,154 |
| 68. | Kingston | 30.3% | 10.3%(+20.0)#68 | 10.0%(+20.4)#2,155 |
| 69. | Mount Vernon | 30.3% | 10.3%(+20.0)#69 | 10.0%(+20.4)#2,157 |
| 70. | Glennville | 29.9% | 10.3%(+19.6)#70 | 10.0%(+20.0)#2,219 |
| 71. | Matthews | 29.8% | 10.3%(+19.5)#71 | 10.0%(+19.8)#2,237 |
| 72. | Norman Park | 29.7% | 10.3%(+19.4)#72 | 10.0%(+19.8)#2,245 |
| 73. | Chatsworth | 29.6% | 10.3%(+19.3)#73 | 10.0%(+19.7)#2,263 |
| 74. | Homerville | 29.4% | 10.3%(+19.1)#74 | 10.0%(+19.5)#2,290 |
| 75. | Sautee Nacoochee | 29.2% | 10.3%(+18.9)#75 | 10.0%(+19.3)#2,319 |
| 76. | Sparta | 29.2% | 10.3%(+18.9)#76 | 10.0%(+19.3)#2,321 |
| 77. | Argyle | 29.0% | 10.3%(+18.7)#77 | 10.0%(+19.1)#2,344 |
| 78. | Fort Gaines | 28.9% | 10.3%(+18.6)#78 | 10.0%(+19.0)#2,365 |
| 79. | Avalon | 28.8% | 10.3%(+18.5)#79 | 10.0%(+18.9)#2,387 |
| 80. | Experiment | 28.8% | 10.3%(+18.5)#80 | 10.0%(+18.9)#2,391 |
| 81. | Colquitt | 28.6% | 10.3%(+18.3)#81 | 10.0%(+18.7)#2,414 |
| 82. | Roopville | 28.6% | 10.3%(+18.2)#82 | 10.0%(+18.6)#2,430 |
| 83. | Buckhead | 28.6% | 10.3%(+18.2)#83 | 10.0%(+18.6)#2,442 |
| 84. | Yatesville | 28.2% | 10.3%(+17.8)#84 | 10.0%(+18.2)#2,515 |
| 85. | Mcrae Helena | 28.0% | 10.3%(+17.7)#85 | 10.0%(+18.1)#2,536 |
| 86. | Waverly Hall | 27.5% | 10.3%(+17.1)#86 | 10.0%(+17.5)#2,649 |
| 87. | Palmetto | 27.4% | 10.3%(+17.1)#87 | 10.0%(+17.4)#2,659 |
| 88. | Waycross | 26.7% | 10.3%(+16.4)#88 | 10.0%(+16.8)#2,772 |
| 89. | Rhine | 26.6% | 10.3%(+16.3)#89 | 10.0%(+16.6)#2,798 |
| 90. | Wrens | 26.6% | 10.3%(+16.3)#90 | 10.0%(+16.6)#2,799 |
| 91. | Ideal | 26.6% | 10.3%(+16.3)#91 | 10.0%(+16.6)#2,801 |
| 92. | Ocilla | 26.6% | 10.3%(+16.2)#92 | 10.0%(+16.6)#2,809 |
| 93. | Chester | 26.5% | 10.3%(+16.2)#93 | 10.0%(+16.6)#2,814 |
| 94. | Claxton | 26.2% | 10.3%(+15.9)#94 | 10.0%(+16.3)#2,882 |
| 95. | Hartwell | 26.2% | 10.3%(+15.8)#95 | 10.0%(+16.2)#2,894 |
| 96. | Hapeville | 26.1% | 10.3%(+15.8)#96 | 10.0%(+16.2)#2,896 |
| 97. | Monroe | 26.1% | 10.3%(+15.8)#97 | 10.0%(+16.2)#2,902 |
| 98. | Millen | 25.9% | 10.3%(+15.6)#98 | 10.0%(+15.9)#2,938 |
| 99. | Ringgold | 25.8% | 10.3%(+15.5)#99 | 10.0%(+15.9)#2,956 |
| 100. | North High Shoals | 25.8% | 10.3%(+15.5)#100 | 10.0%(+15.9)#2,959 |
Common Questions
What are the Top 10 Cities with the Highest Poverty Level Among Seniors Over the Age of 65 in Georgia?
Top 10 Cities with the Highest Poverty Level Among Seniors Over the Age of 65 in Georgia are:
#1
66.7%
#2
66.7%
#3
60.0%
#4
59.0%
#5
58.8%
#6
51.9%
#7
50.9%
#8
50.0%
#9
50.0%
#10
49.1%
What city has the Highest Poverty Level Among Seniors Over the Age of 65 in Georgia?
Remerton has the Highest Poverty Level Among Seniors Over the Age of 65 in Georgia with 66.7%.
What is the Poverty Level Among Seniors Over the Age of 65 in the State of Georgia?
Poverty Level Among Seniors Over the Age of 65 in Georgia is 10.3%.
What is the Poverty Level Among Seniors Over the Age of 65 in the United States?
Poverty Level Among Seniors Over the Age of 65 in the United States is 10.0%.