South Creek, WA Map & Demographics
South Creek Map
South Creek Overview
$45,197
PER CAPITA INCOME
$105,707
AVG FAMILY INCOME
$91,833
AVG HOUSEHOLD INCOME
52.4%
WAGE / INCOME GAP [ % ]
47.6¢/ $1
WAGE / INCOME GAP [ $ ]
0.40
INEQUALITY / GINI INDEX
2,346
TOTAL POPULATION
1,201
MALE POPULATION
1,145
FEMALE POPULATION
104.89
MALES / 100 FEMALES
95.34
FEMALES / 100 MALES
50.9
MEDIAN AGE
2.8
AVG FAMILY SIZE
2.5
AVG HOUSEHOLD SIZE
1,018
LABOR FORCE [ PEOPLE ]
53.8%
PERCENT IN LABOR FORCE
6.2%
UNEMPLOYMENT RATE
Income in South Creek
Income Overview in South Creek
Per Capita Income in South Creek is $45,197, while median incomes of families and households are $105,707 and $91,833 respectively.
| Characteristic | Number | Measure |
| Per Capita Income | 2,346 | $45,197 |
| Median Family Income | 761 | $105,707 |
| Mean Family Income | 761 | $123,534 |
| Median Household Income | 916 | $91,833 |
| Mean Household Income | 916 | $115,524 |
| Income Deficit | 761 | $0 |
| Wage / Income Gap (%) | 2,346 | 52.37% |
| Wage / Income Gap ($) | 2,346 | 47.63¢ per $1 |
| Gini / Inequality Index | 2,346 | 0.40 |
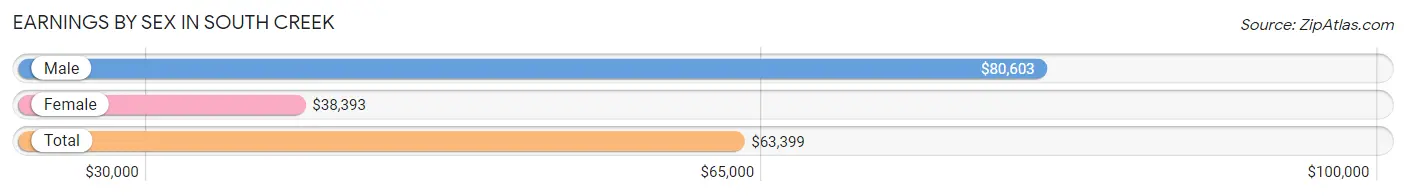
Earnings by Sex in South Creek
Average Earnings in South Creek are $63,399, $80,603 for men and $38,393 for women, a difference of 52.4%.
| Sex | Number | Average Earnings |
| Male | 588 (50.9%) | $80,603 |
| Female | 568 (49.1%) | $38,393 |
| Total | 1,156 (100.0%) | $63,399 |
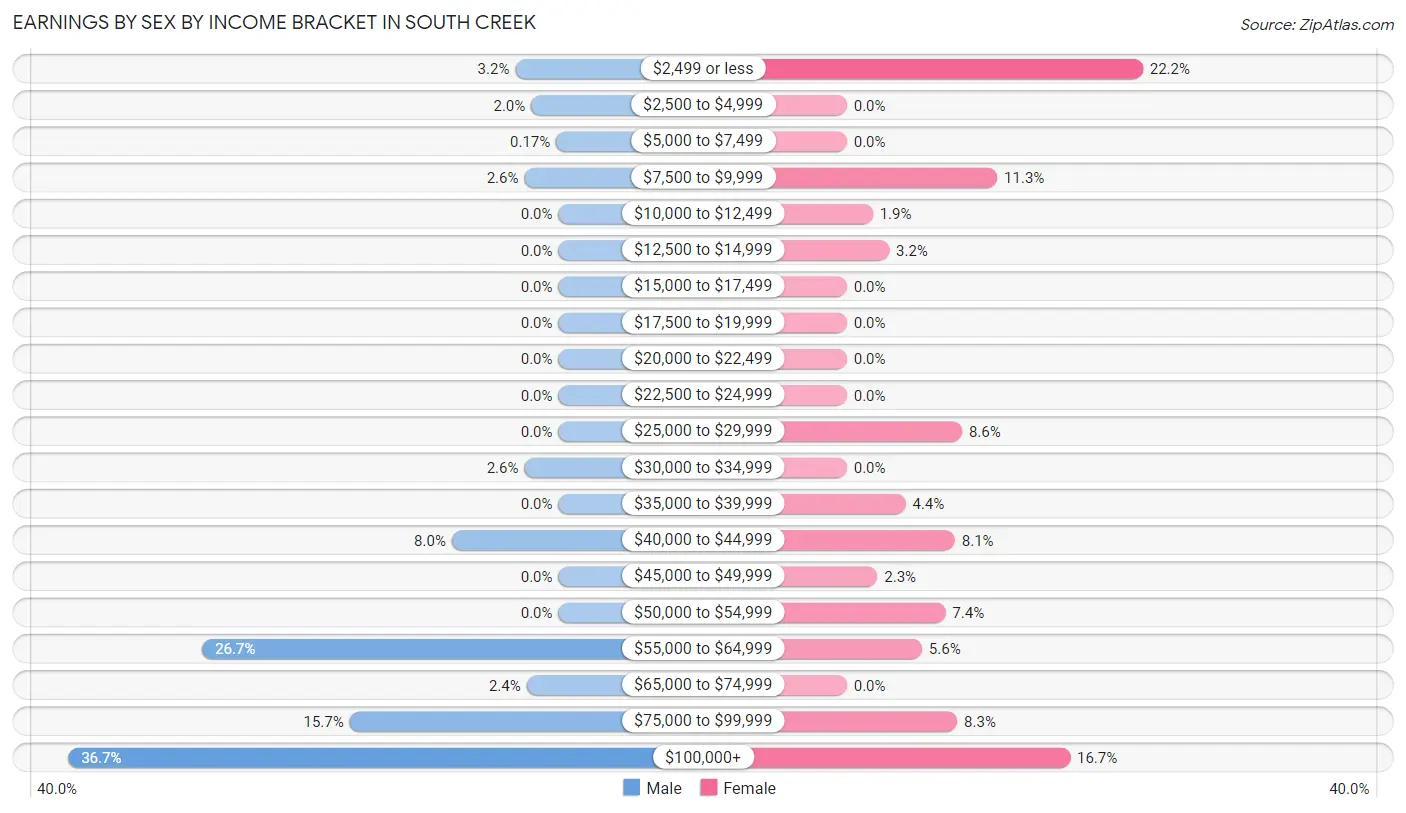
Earnings by Sex by Income Bracket in South Creek
The most common earnings brackets in South Creek are $100,000+ for men (216 | 36.7%) and $2,499 or less for women (126 | 22.2%).
| Income | Male | Female |
| $2,499 or less | 19 (3.2%) | 126 (22.2%) |
| $2,500 to $4,999 | 12 (2.0%) | 0 (0.0%) |
| $5,000 to $7,499 | 1 (0.2%) | 0 (0.0%) |
| $7,500 to $9,999 | 15 (2.5%) | 64 (11.3%) |
| $10,000 to $12,499 | 0 (0.0%) | 11 (1.9%) |
| $12,500 to $14,999 | 0 (0.0%) | 18 (3.2%) |
| $15,000 to $17,499 | 0 (0.0%) | 0 (0.0%) |
| $17,500 to $19,999 | 0 (0.0%) | 0 (0.0%) |
| $20,000 to $22,499 | 0 (0.0%) | 0 (0.0%) |
| $22,500 to $24,999 | 0 (0.0%) | 0 (0.0%) |
| $25,000 to $29,999 | 0 (0.0%) | 49 (8.6%) |
| $30,000 to $34,999 | 15 (2.5%) | 0 (0.0%) |
| $35,000 to $39,999 | 0 (0.0%) | 25 (4.4%) |
| $40,000 to $44,999 | 47 (8.0%) | 46 (8.1%) |
| $45,000 to $49,999 | 0 (0.0%) | 13 (2.3%) |
| $50,000 to $54,999 | 0 (0.0%) | 42 (7.4%) |
| $55,000 to $64,999 | 157 (26.7%) | 32 (5.6%) |
| $65,000 to $74,999 | 14 (2.4%) | 0 (0.0%) |
| $75,000 to $99,999 | 92 (15.7%) | 47 (8.3%) |
| $100,000+ | 216 (36.7%) | 95 (16.7%) |
| Total | 588 (100.0%) | 568 (100.0%) |
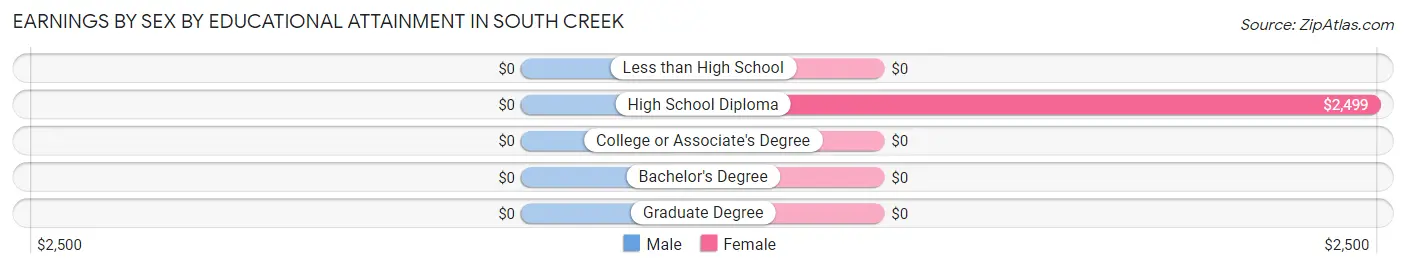
Earnings by Sex by Educational Attainment in South Creek
| Educational Attainment | Male Income | Female Income |
| Less than High School | - | - |
| High School Diploma | - | - |
| College or Associate's Degree | - | - |
| Bachelor's Degree | - | - |
| Graduate Degree | - | - |
| Total | $81,552 | $0 |
Family Income in South Creek
Family Income Brackets in South Creek
According to the South Creek family income data, there are 179 families falling into the $75,000 to $99,999 income range, which is the most common income bracket and makes up 23.5% of all families.
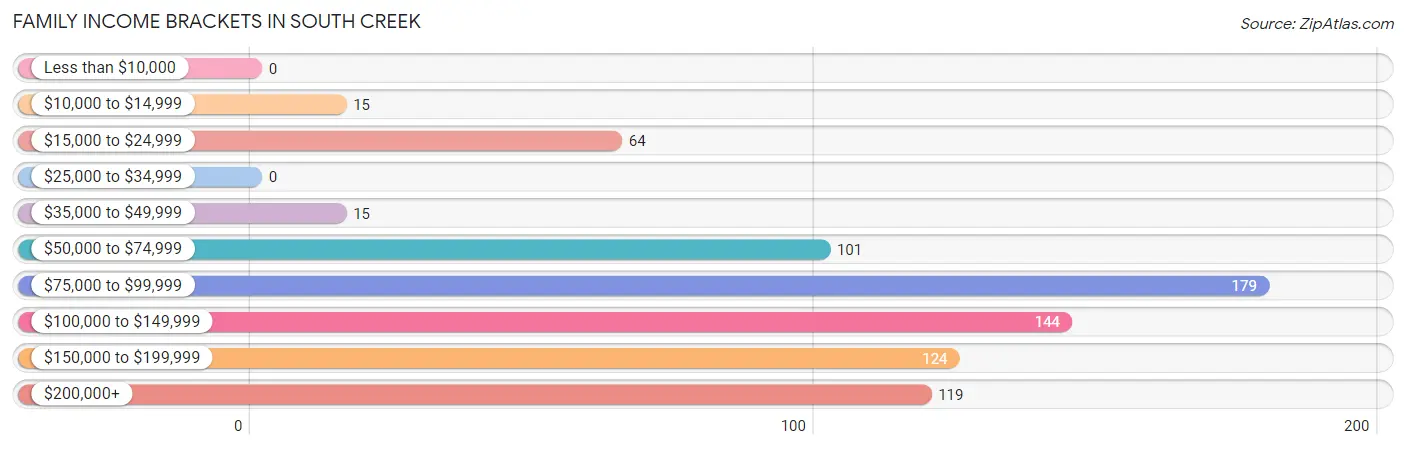
| Income Bracket | # Families | % Families |
| Less than $10,000 | 0 | 0.0% |
| $10,000 to $14,999 | 15 | 2.0% |
| $15,000 to $24,999 | 64 | 8.4% |
| $25,000 to $34,999 | 0 | 0.0% |
| $35,000 to $49,999 | 15 | 2.0% |
| $50,000 to $74,999 | 101 | 13.3% |
| $75,000 to $99,999 | 179 | 23.5% |
| $100,000 to $149,999 | 144 | 18.9% |
| $150,000 to $199,999 | 124 | 16.3% |
| $200,000+ | 119 | 15.6% |
Family Income by Famaliy Size in South Creek
3-person families (131 | 17.2%) account for the highest median family income in South Creek with $114,609 per family, while 2-person families (487 | 64.0%) have the highest median income of $45,292 per family member.
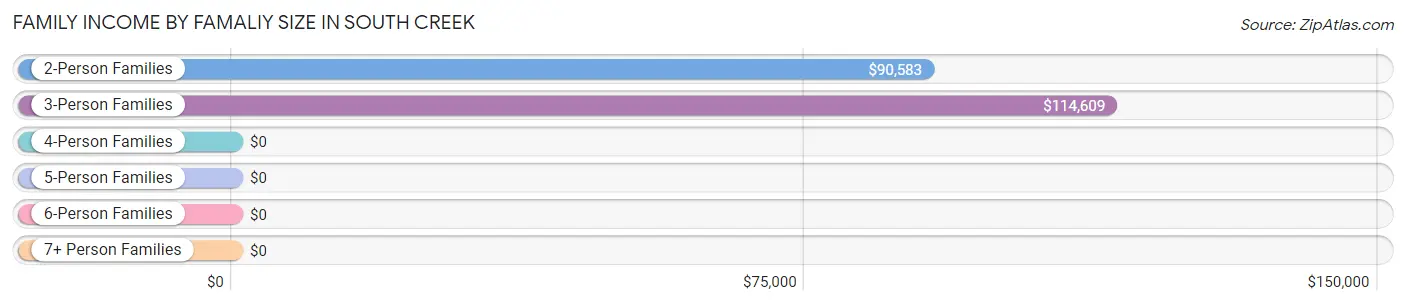
| Income Bracket | # Families | Median Income |
| 2-Person Families | 487 (64.0%) | $90,583 |
| 3-Person Families | 131 (17.2%) | $114,609 |
| 4-Person Families | 108 (14.2%) | $0 |
| 5-Person Families | 14 (1.8%) | $0 |
| 6-Person Families | 0 (0.0%) | $0 |
| 7+ Person Families | 21 (2.8%) | $0 |
| Total | 761 (100.0%) | $105,707 |
Family Income by Number of Earners in South Creek
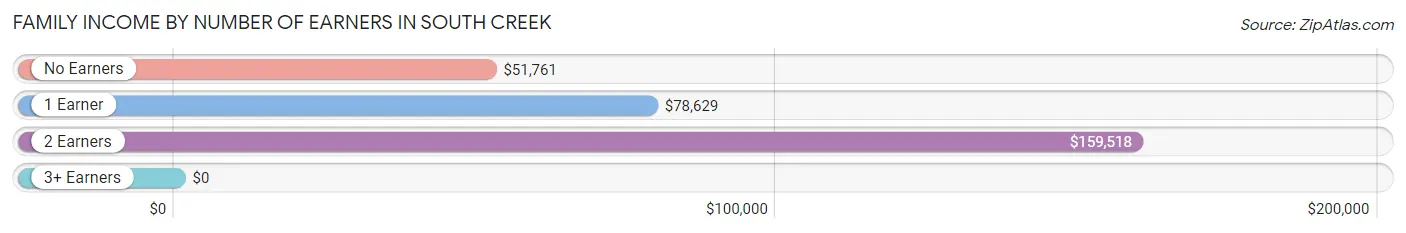
| Number of Earners | # Families | Median Income |
| No Earners | 153 (20.1%) | $51,761 |
| 1 Earner | 249 (32.7%) | $78,629 |
| 2 Earners | 324 (42.6%) | $159,518 |
| 3+ Earners | 35 (4.6%) | $0 |
| Total | 761 (100.0%) | $105,707 |
Household Income in South Creek
Household Income Brackets in South Creek
With 224 households falling in the category, the $75,000 to $99,999 income range is the most frequent in South Creek, accounting for 24.4% of all households.
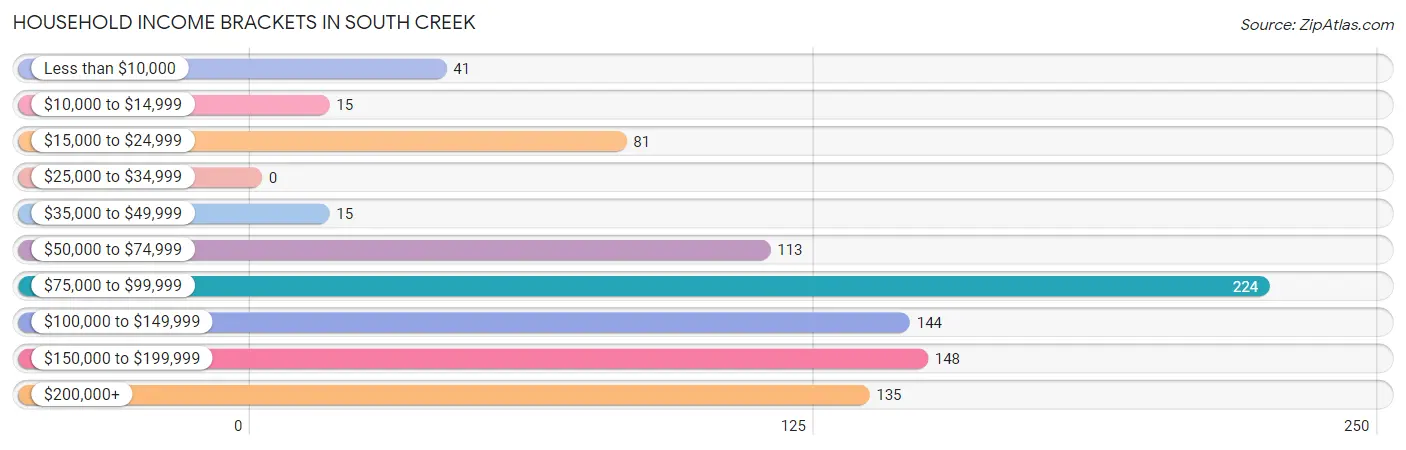
| Income Bracket | # Households | % Households |
| Less than $10,000 | 41 | 4.5% |
| $10,000 to $14,999 | 15 | 1.6% |
| $15,000 to $24,999 | 81 | 8.8% |
| $25,000 to $34,999 | 0 | 0.0% |
| $35,000 to $49,999 | 15 | 1.6% |
| $50,000 to $74,999 | 113 | 12.3% |
| $75,000 to $99,999 | 224 | 24.5% |
| $100,000 to $149,999 | 144 | 15.7% |
| $150,000 to $199,999 | 148 | 16.2% |
| $200,000+ | 135 | 14.7% |
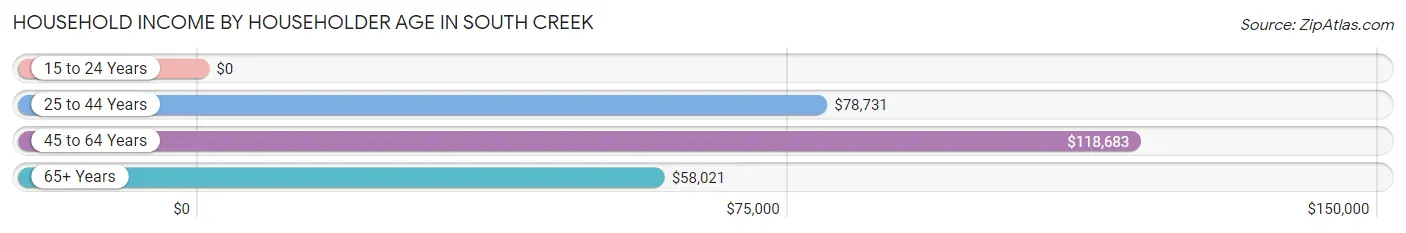
Household Income by Householder Age in South Creek
The median household income in South Creek is $91,833, with the highest median household income of $118,683 found in the 45 to 64 years age bracket for the primary householder. A total of 501 households (54.7%) fall into this category.
| Income Bracket | # Households | Median Income |
| 15 to 24 Years | 0 (0.0%) | $0 |
| 25 to 44 Years | 288 (31.4%) | $78,731 |
| 45 to 64 Years | 501 (54.7%) | $118,683 |
| 65+ Years | 127 (13.9%) | $58,021 |
| Total | 916 (100.0%) | $91,833 |
Poverty in South Creek
Income Below Poverty by Sex and Age in South Creek
With 18.4% poverty level for males and 12.6% for females among the residents of South Creek, 5 year old males and 25 to 34 year old females are the most vulnerable to poverty, with 67 males (100.0%) and 64 females (52.5%) in their respective age groups living below the poverty level.
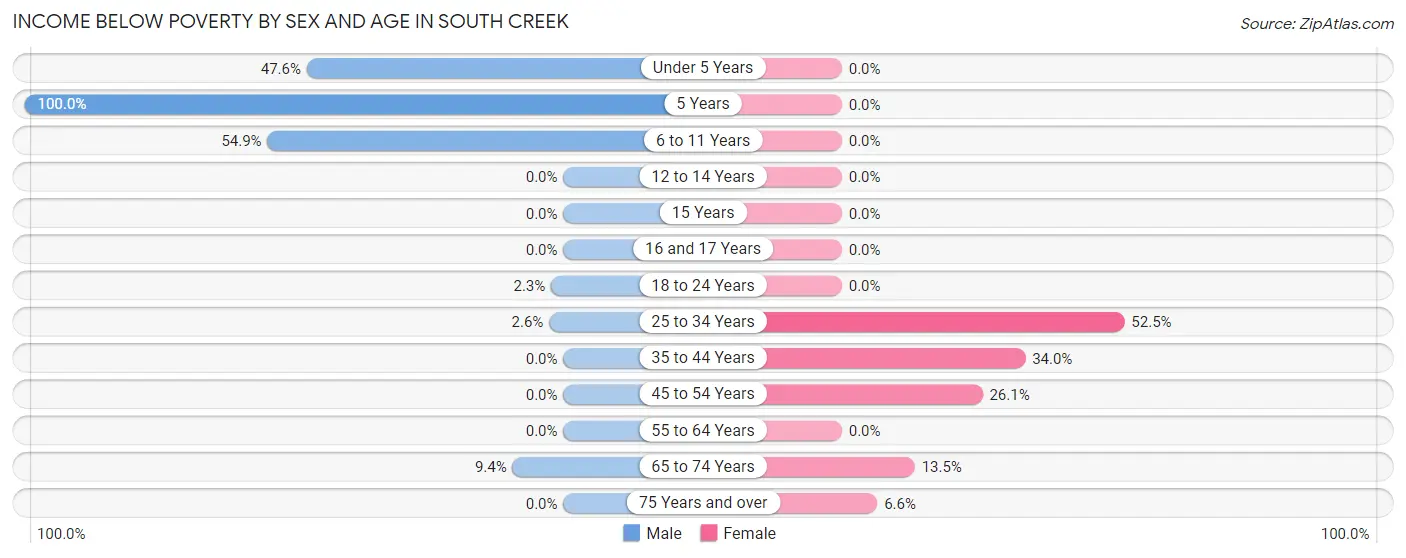
| Age Bracket | Male | Female |
| Under 5 Years | 70 (47.6%) | 0 (0.0%) |
| 5 Years | 67 (100.0%) | 0 (0.0%) |
| 6 to 11 Years | 67 (54.9%) | 0 (0.0%) |
| 12 to 14 Years | 0 (0.0%) | 0 (0.0%) |
| 15 Years | 0 (0.0%) | 0 (0.0%) |
| 16 and 17 Years | 0 (0.0%) | 0 (0.0%) |
| 18 to 24 Years | 1 (2.3%) | 0 (0.0%) |
| 25 to 34 Years | 1 (2.6%) | 64 (52.5%) |
| 35 to 44 Years | 0 (0.0%) | 16 (34.0%) |
| 45 to 54 Years | 0 (0.0%) | 41 (26.1%) |
| 55 to 64 Years | 0 (0.0%) | 0 (0.0%) |
| 65 to 74 Years | 15 (9.4%) | 18 (13.5%) |
| 75 Years and over | 0 (0.0%) | 5 (6.6%) |
| Total | 221 (18.4%) | 144 (12.6%) |
Income Above Poverty by Sex and Age in South Creek
According to the poverty statistics in South Creek, males aged 12 to 14 years and females aged under 5 years are the age groups that are most secure financially, with 100.0% of males and 100.0% of females in these age groups living above the poverty line.
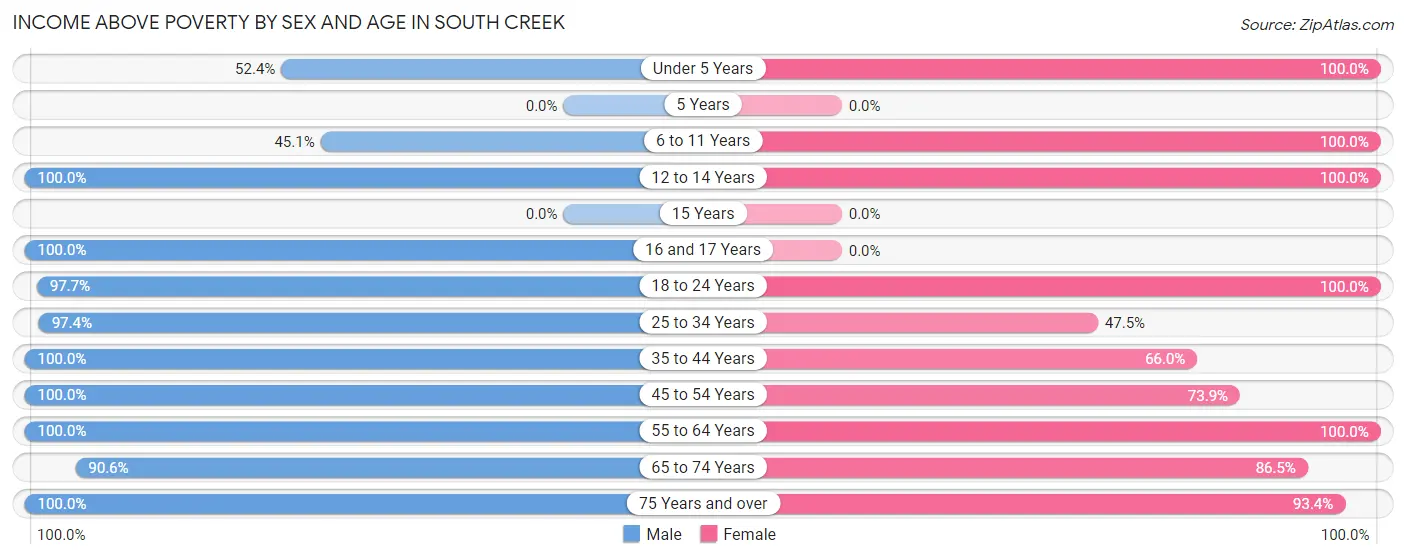
| Age Bracket | Male | Female |
| Under 5 Years | 77 (52.4%) | 21 (100.0%) |
| 5 Years | 0 (0.0%) | 0 (0.0%) |
| 6 to 11 Years | 55 (45.1%) | 22 (100.0%) |
| 12 to 14 Years | 29 (100.0%) | 46 (100.0%) |
| 15 Years | 0 (0.0%) | 0 (0.0%) |
| 16 and 17 Years | 27 (100.0%) | 0 (0.0%) |
| 18 to 24 Years | 43 (97.7%) | 82 (100.0%) |
| 25 to 34 Years | 37 (97.4%) | 58 (47.5%) |
| 35 to 44 Years | 227 (100.0%) | 31 (66.0%) |
| 45 to 54 Years | 113 (100.0%) | 116 (73.9%) |
| 55 to 64 Years | 207 (100.0%) | 439 (100.0%) |
| 65 to 74 Years | 144 (90.6%) | 115 (86.5%) |
| 75 Years and over | 21 (100.0%) | 71 (93.4%) |
| Total | 980 (81.6%) | 1,001 (87.4%) |
Income Below Poverty Among Married-Couple Families in South Creek
The poverty statistics for married-couple families in South Creek show that 3.0% or 15 of the total 493 families live below the poverty line. Families with no children have the highest poverty rate of 3.8%, comprising of 15 families. On the other hand, families with 1 or 2 children have the lowest poverty rate of 0.0%, which includes 0 families.
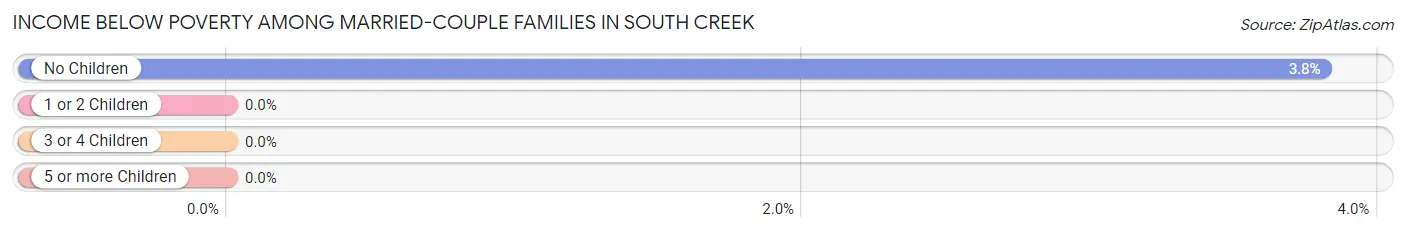
| Children | Above Poverty | Below Poverty |
| No Children | 379 (96.2%) | 15 (3.8%) |
| 1 or 2 Children | 78 (100.0%) | 0 (0.0%) |
| 3 or 4 Children | 21 (100.0%) | 0 (0.0%) |
| 5 or more Children | 0 (0.0%) | 0 (0.0%) |
| Total | 478 (97.0%) | 15 (3.0%) |
Income Below Poverty Among Single-Parent Households in South Creek
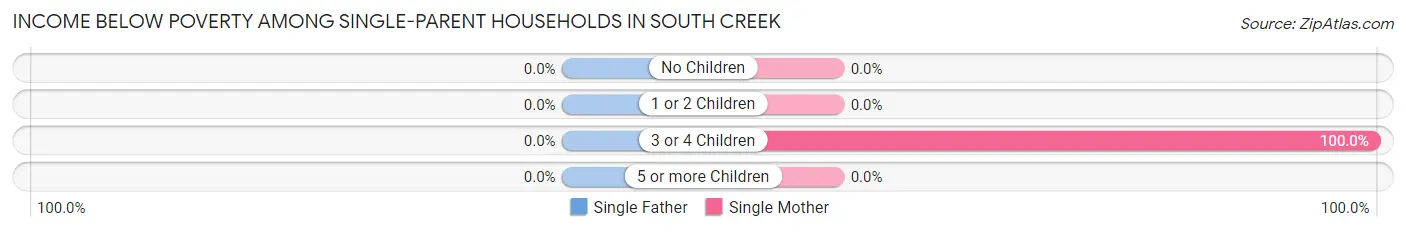
| Children | Single Father | Single Mother |
| No Children | 0 (0.0%) | 0 (0.0%) |
| 1 or 2 Children | 0 (0.0%) | 0 (0.0%) |
| 3 or 4 Children | 0 (0.0%) | 64 (100.0%) |
| 5 or more Children | 0 (0.0%) | 0 (0.0%) |
| Total | 0 (0.0%) | 64 (47.8%) |
Income Below Poverty Among Married-Couple vs Single-Parent Households in South Creek
The poverty data for South Creek shows that 15 of the married-couple family households (3.0%) and 64 of the single-parent households (23.9%) are living below the poverty level. Within the married-couple family households, those with no children have the highest poverty rate, with 15 households (3.8%) falling below the poverty line. Among the single-parent households, those with 3 or 4 children have the highest poverty rate, with 64 household (100.0%) living below poverty.
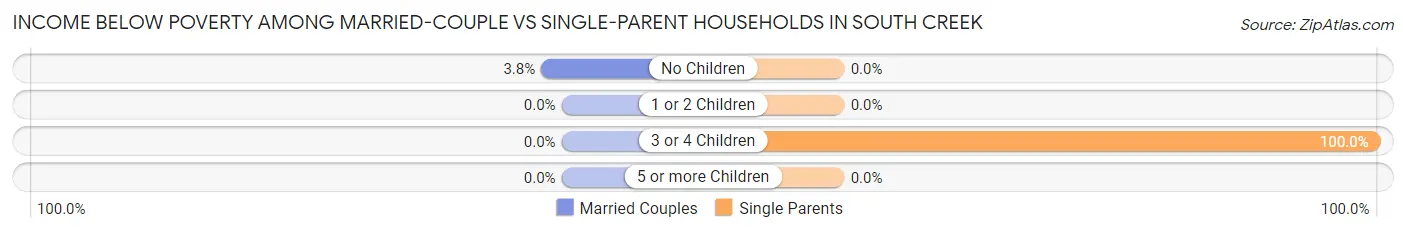
| Children | Married-Couple Families | Single-Parent Households |
| No Children | 15 (3.8%) | 0 (0.0%) |
| 1 or 2 Children | 0 (0.0%) | 0 (0.0%) |
| 3 or 4 Children | 0 (0.0%) | 64 (100.0%) |
| 5 or more Children | 0 (0.0%) | 0 (0.0%) |
| Total | 15 (3.0%) | 64 (23.9%) |
Race in South Creek
The most populous races in South Creek are White / Caucasian (1,747 | 74.5%), Two or more Races (482 | 20.5%), and Hispanic or Latino (127 | 5.4%).
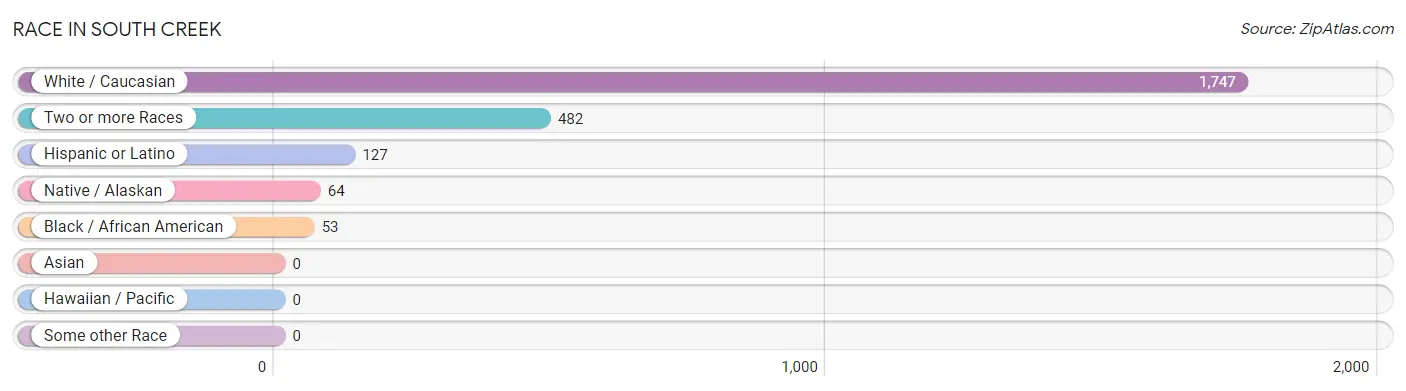
| Race | # Population | % Population |
| Asian | 0 | 0.0% |
| Black / African American | 53 | 2.3% |
| Hawaiian / Pacific | 0 | 0.0% |
| Hispanic or Latino | 127 | 5.4% |
| Native / Alaskan | 64 | 2.7% |
| White / Caucasian | 1,747 | 74.5% |
| Two or more Races | 482 | 20.5% |
| Some other Race | 0 | 0.0% |
| Total | 2,346 | 100.0% |
Ancestry in South Creek
The most populous ancestries reported in South Creek are Bhutanese (293 | 12.5%), French (293 | 12.5%), German (245 | 10.4%), English (222 | 9.5%), and American (195 | 8.3%), together accounting for 53.2% of all South Creek residents.
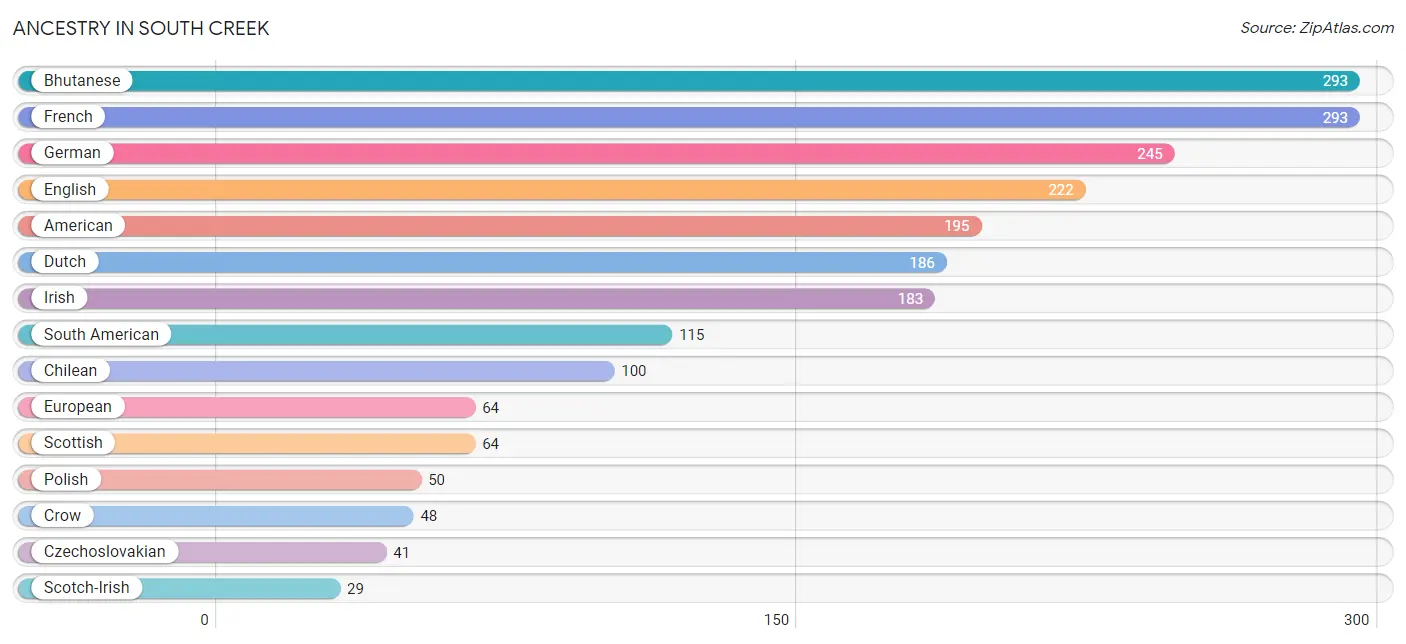
| Ancestry | # Population | % Population |
| American | 195 | 8.3% |
| Argentinean | 15 | 0.6% |
| Bhutanese | 293 | 12.5% |
| Blackfeet | 11 | 0.5% |
| British | 13 | 0.5% |
| Cheyenne | 8 | 0.3% |
| Chilean | 100 | 4.3% |
| Crow | 48 | 2.1% |
| Czechoslovakian | 41 | 1.8% |
| Dutch | 186 | 7.9% |
| English | 222 | 9.5% |
| European | 64 | 2.7% |
| French | 293 | 12.5% |
| French Canadian | 11 | 0.5% |
| German | 245 | 10.4% |
| Irish | 183 | 7.8% |
| Italian | 14 | 0.6% |
| Mexican | 12 | 0.5% |
| Norwegian | 14 | 0.6% |
| Polish | 50 | 2.1% |
| Scotch-Irish | 29 | 1.2% |
| Scottish | 64 | 2.7% |
| South American | 115 | 4.9% |
| Swedish | 25 | 1.1% |
| Welsh | 16 | 0.7% | View All 25 Rows |
Immigrants in South Creek
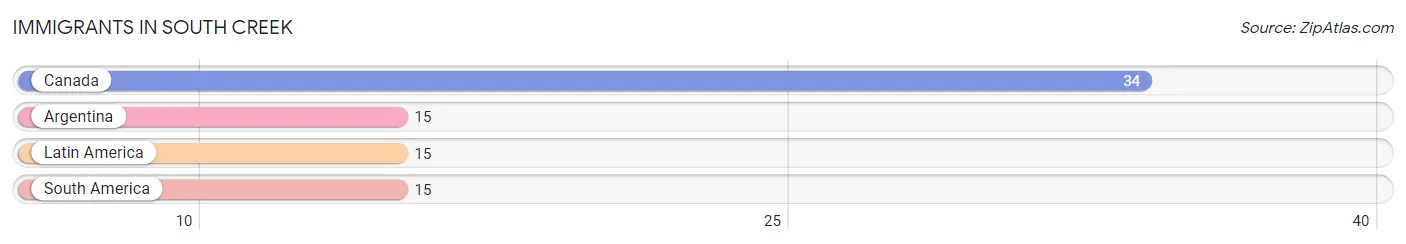
The most numerous immigrant groups reported in South Creek came from Canada (34 | 1.5%), Argentina (15 | 0.6%), Latin America (15 | 0.6%), and South America (15 | 0.6%), together accounting for 3.4% of all South Creek residents.
| Immigration Origin | # Population | % Population |
| Argentina | 15 | 0.6% |
| Canada | 34 | 1.5% |
| Latin America | 15 | 0.6% |
| South America | 15 | 0.6% | View All 4 Rows |
Sex and Age in South Creek
Sex and Age in South Creek
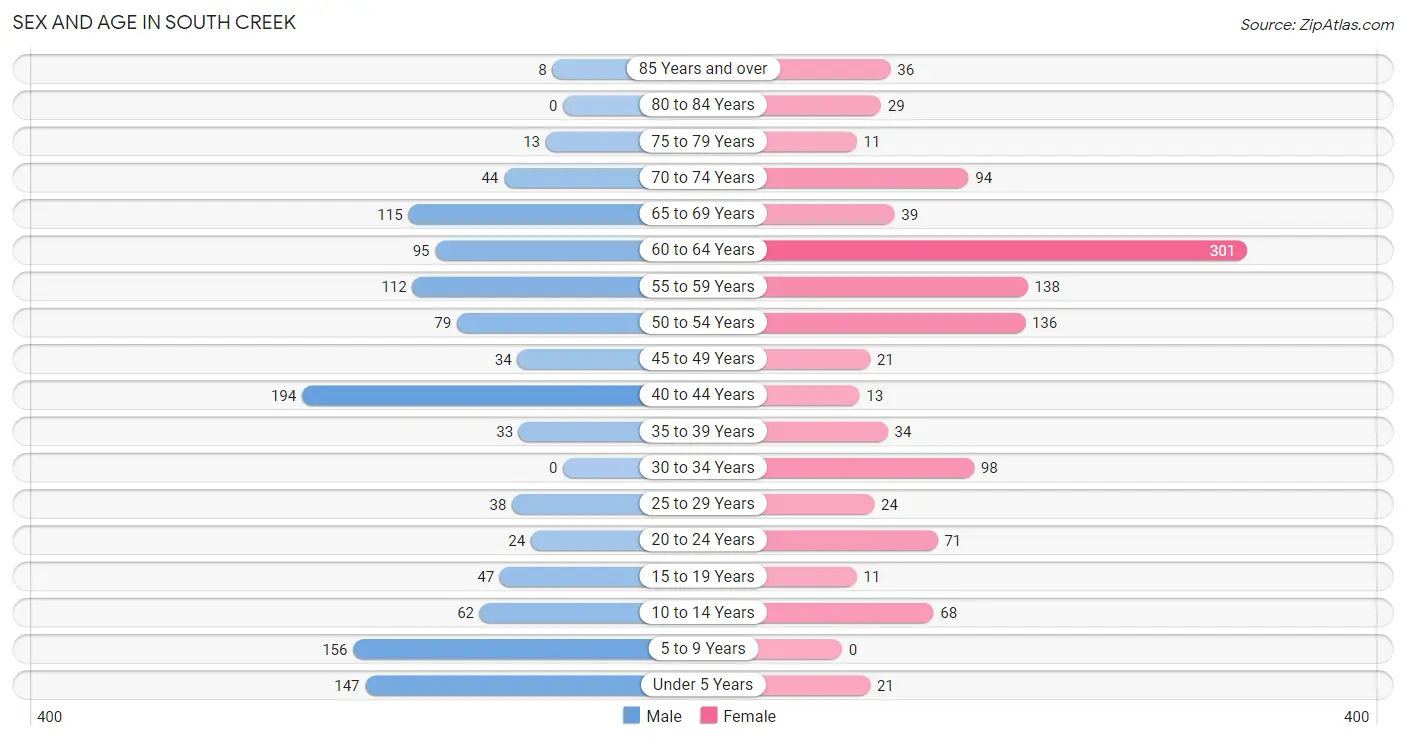
The most populous age groups in South Creek are 40 to 44 Years (194 | 16.2%) for men and 60 to 64 Years (301 | 26.3%) for women.
| Age Bracket | Male | Female |
| Under 5 Years | 147 (12.2%) | 21 (1.8%) |
| 5 to 9 Years | 156 (13.0%) | 0 (0.0%) |
| 10 to 14 Years | 62 (5.2%) | 68 (5.9%) |
| 15 to 19 Years | 47 (3.9%) | 11 (1.0%) |
| 20 to 24 Years | 24 (2.0%) | 71 (6.2%) |
| 25 to 29 Years | 38 (3.2%) | 24 (2.1%) |
| 30 to 34 Years | 0 (0.0%) | 98 (8.6%) |
| 35 to 39 Years | 33 (2.8%) | 34 (3.0%) |
| 40 to 44 Years | 194 (16.2%) | 13 (1.1%) |
| 45 to 49 Years | 34 (2.8%) | 21 (1.8%) |
| 50 to 54 Years | 79 (6.6%) | 136 (11.9%) |
| 55 to 59 Years | 112 (9.3%) | 138 (12.0%) |
| 60 to 64 Years | 95 (7.9%) | 301 (26.3%) |
| 65 to 69 Years | 115 (9.6%) | 39 (3.4%) |
| 70 to 74 Years | 44 (3.7%) | 94 (8.2%) |
| 75 to 79 Years | 13 (1.1%) | 11 (1.0%) |
| 80 to 84 Years | 0 (0.0%) | 29 (2.5%) |
| 85 Years and over | 8 (0.7%) | 36 (3.1%) |
| Total | 1,201 (100.0%) | 1,145 (100.0%) |
Families and Households in South Creek
Median Family Size in South Creek
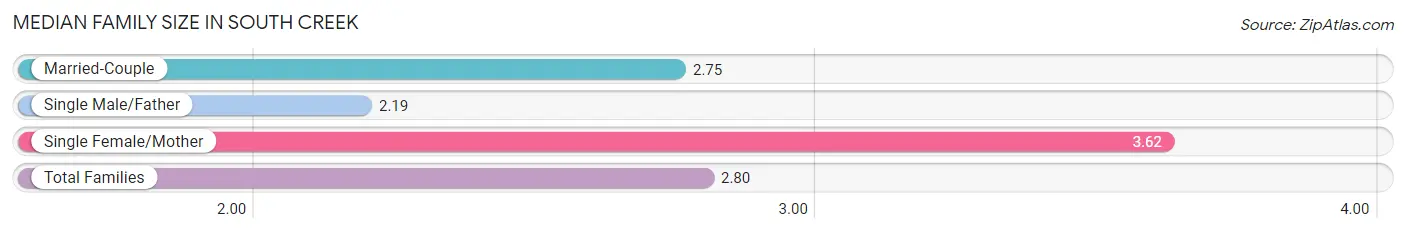
The median family size in South Creek is 2.80 persons per family, with single female/mother families (134 | 17.6%) accounting for the largest median family size of 3.62 persons per family. On the other hand, single male/father families (134 | 17.6%) represent the smallest median family size with 2.19 persons per family.
| Family Type | # Families | Family Size |
| Married-Couple | 493 (64.8%) | 2.75 |
| Single Male/Father | 134 (17.6%) | 2.19 |
| Single Female/Mother | 134 (17.6%) | 3.62 |
| Total Families | 761 (100.0%) | 2.80 |
Median Household Size in South Creek
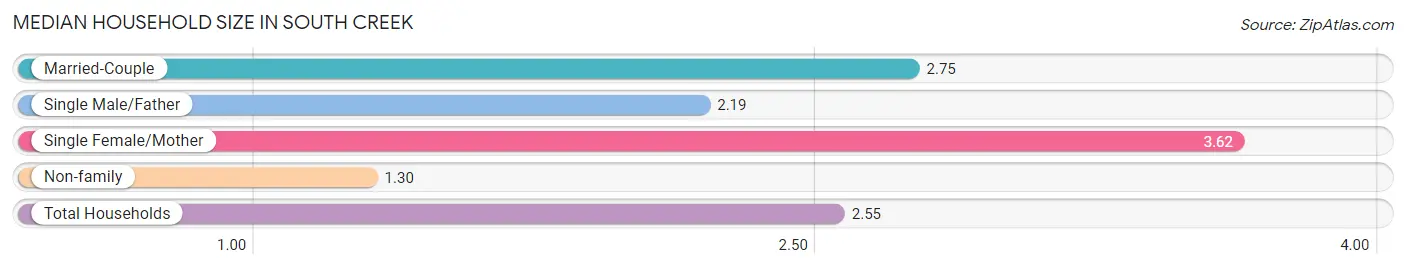
The median household size in South Creek is 2.55 persons per household, with single female/mother households (134 | 14.6%) accounting for the largest median household size of 3.62 persons per household. non-family households (155 | 16.9%) represent the smallest median household size with 1.30 persons per household.
| Household Type | # Households | Household Size |
| Married-Couple | 493 (53.8%) | 2.75 |
| Single Male/Father | 134 (14.6%) | 2.19 |
| Single Female/Mother | 134 (14.6%) | 3.62 |
| Non-family | 155 (16.9%) | 1.30 |
| Total Households | 916 (100.0%) | 2.55 |
Household Size by Marriage Status in South Creek
Out of a total of 916 households in South Creek, 761 (83.1%) are family households, while 155 (16.9%) are nonfamily households. The most numerous type of family households are 2-person households, comprising 487, and the most common type of nonfamily households are 1-person households, comprising 108.
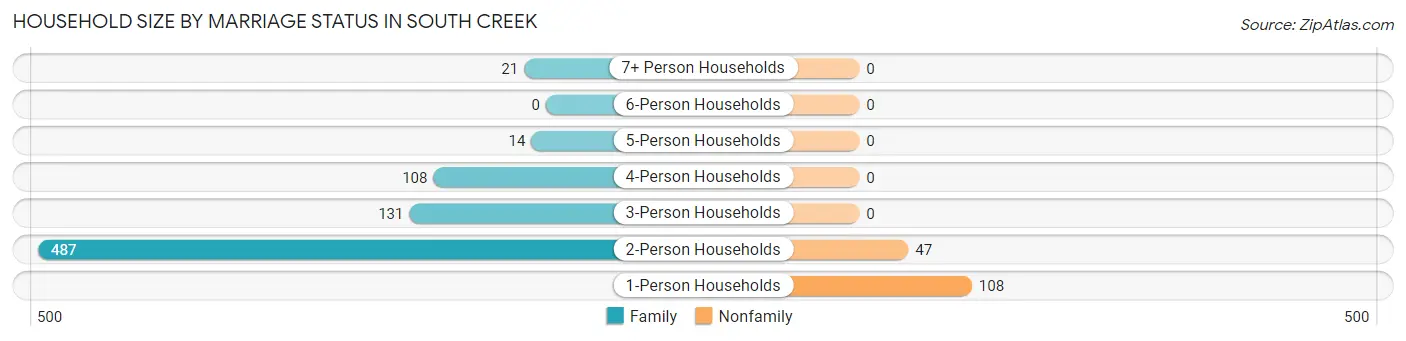
| Household Size | Family Households | Nonfamily Households |
| 1-Person Households | - | 108 (11.8%) |
| 2-Person Households | 487 (53.2%) | 47 (5.1%) |
| 3-Person Households | 131 (14.3%) | 0 (0.0%) |
| 4-Person Households | 108 (11.8%) | 0 (0.0%) |
| 5-Person Households | 14 (1.5%) | 0 (0.0%) |
| 6-Person Households | 0 (0.0%) | 0 (0.0%) |
| 7+ Person Households | 21 (2.3%) | 0 (0.0%) |
| Total | 761 (83.1%) | 155 (16.9%) |
Female Fertility in South Creek
Fertility by Age in South Creek
| Age Bracket | Women with Births | Births / 1,000 Women |
| 15 to 19 years | 0 (0.0%) | 0.0 |
| 20 to 34 years | 0 (0.0%) | 0.0 |
| 35 to 50 years | 0 (0.0%) | 0.0 |
| Total | 0 (0.0%) | 0.0 |
Fertility by Age by Marriage Status in South Creek
| Age Bracket | Married | Unmarried |
| 15 to 19 years | 0 (0.0%) | 0 (0.0%) |
| 20 to 34 years | 0 (0.0%) | 0 (0.0%) |
| 35 to 50 years | 0 (0.0%) | 0 (0.0%) |
| Total | 0 (0.0%) | 0 (0.0%) |
Fertility by Education in South Creek
| Educational Attainment | Women with Births | Births / 1,000 Women |
| Less than High School | 0 (0.0%) | 0.0 |
| High School Diploma | 0 (0.0%) | 0.0 |
| College or Associate's Degree | 0 (0.0%) | 0.0 |
| Bachelor's Degree | 0 (0.0%) | 0.0 |
| Graduate Degree | 0 (0.0%) | 0.0 |
| Total | 0 (0.0%) | 0.0 |
Fertility by Education by Marriage Status in South Creek
| Educational Attainment | Married | Unmarried |
| Less than High School | 0 (0.0%) | 0 (0.0%) |
| High School Diploma | 0 (0.0%) | 0 (0.0%) |
| College or Associate's Degree | 0 (0.0%) | 0 (0.0%) |
| Bachelor's Degree | 0 (0.0%) | 0 (0.0%) |
| Graduate Degree | 0 (0.0%) | 0 (0.0%) |
| Total | 0 (0.0%) | 0 (0.0%) |
Employment Characteristics in South Creek
Employment by Class of Employer in South Creek
Among the 862 employed individuals in South Creek, private company employees (741 | 86.0%), self-employed (not incorporated) (62 | 7.2%), and local government employees (50 | 5.8%) make up the most common classes of employment.
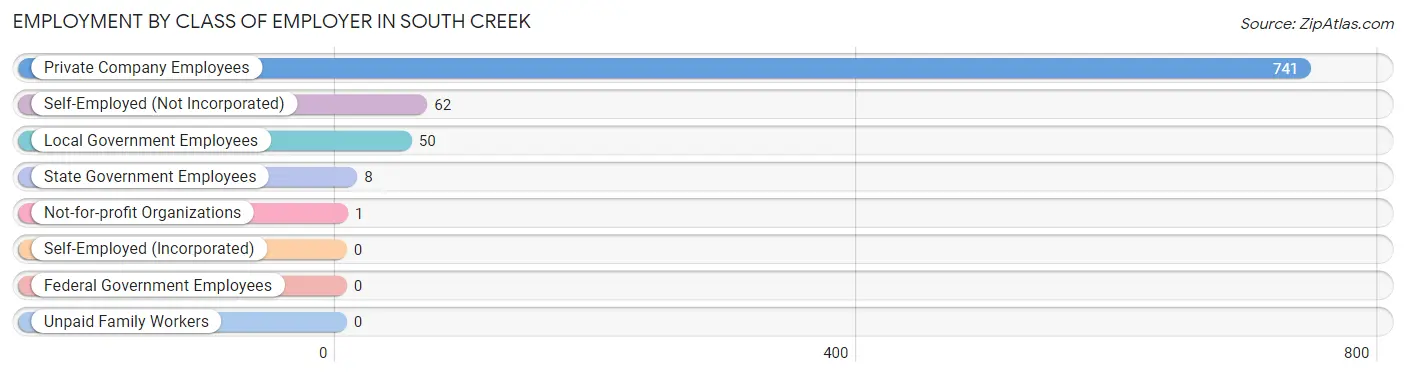
| Employer Class | # Employees | % Employees |
| Private Company Employees | 741 | 86.0% |
| Self-Employed (Incorporated) | 0 | 0.0% |
| Self-Employed (Not Incorporated) | 62 | 7.2% |
| Not-for-profit Organizations | 1 | 0.1% |
| Local Government Employees | 50 | 5.8% |
| State Government Employees | 8 | 0.9% |
| Federal Government Employees | 0 | 0.0% |
| Unpaid Family Workers | 0 | 0.0% |
| Total | 862 | 100.0% |
Employment Status by Age in South Creek
According to the labor force statistics for South Creek, out of the total population over 16 years of age (1,892), 53.8% or 1,018 individuals are in the labor force, with 6.2% or 63 of them unemployed. The age group with the highest labor force participation rate is 20 to 24 years, with 100.0% or 95 individuals in the labor force. Within the labor force, the 20 to 24 years age range has the highest percentage of unemployed individuals, with 51.6% or 49 of them being unemployed.
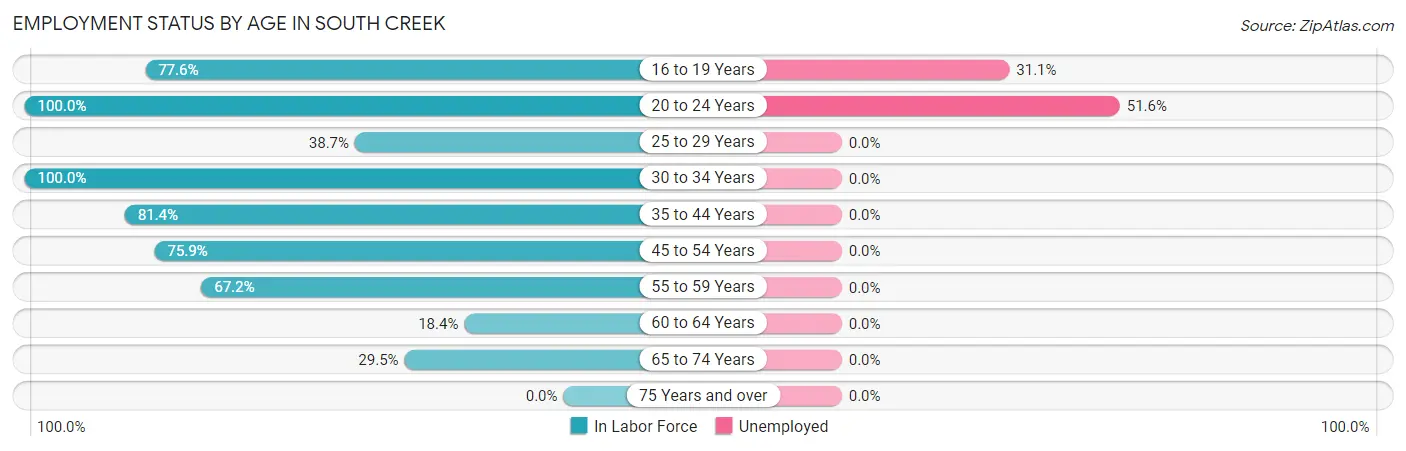
| Age Bracket | In Labor Force | Unemployed |
| 16 to 19 Years | 45 (77.6%) | 14 (31.1%) |
| 20 to 24 Years | 95 (100.0%) | 49 (51.6%) |
| 25 to 29 Years | 24 (38.7%) | 0 (0.0%) |
| 30 to 34 Years | 98 (100.0%) | 0 (0.0%) |
| 35 to 44 Years | 223 (81.4%) | 0 (0.0%) |
| 45 to 54 Years | 205 (75.9%) | 0 (0.0%) |
| 55 to 59 Years | 168 (67.2%) | 0 (0.0%) |
| 60 to 64 Years | 73 (18.4%) | 0 (0.0%) |
| 65 to 74 Years | 86 (29.5%) | 0 (0.0%) |
| 75 Years and over | 0 (0.0%) | 0 (0.0%) |
| Total | 1,018 (53.8%) | 63 (6.2%) |
Employment Status by Educational Attainment in South Creek
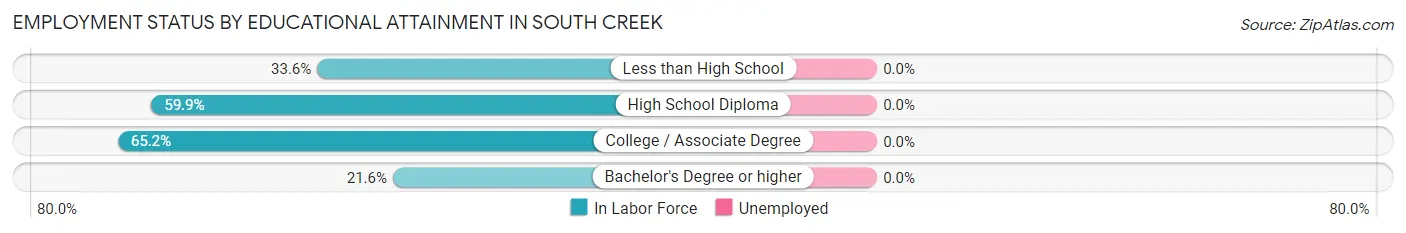
| Educational Attainment | In Labor Force | Unemployed |
| Less than High School | 44 (33.6%) | 0 (0.0%) |
| High School Diploma | 362 (59.9%) | 0 (0.0%) |
| College / Associate Degree | 377 (65.2%) | 0 (0.0%) |
| Bachelor's Degree or higher | 8 (21.6%) | 0 (0.0%) |
| Total | 791 (58.6%) | 0 (0.0%) |
Employment Occupations by Sex in South Creek
Management, Business, Science and Arts Occupations
The most common Management, Business, Science and Arts occupations in South Creek are Management (136 | 14.3%), Computers, Engineering & Science (13 | 1.4%), and Architecture & Engineering (13 | 1.4%).
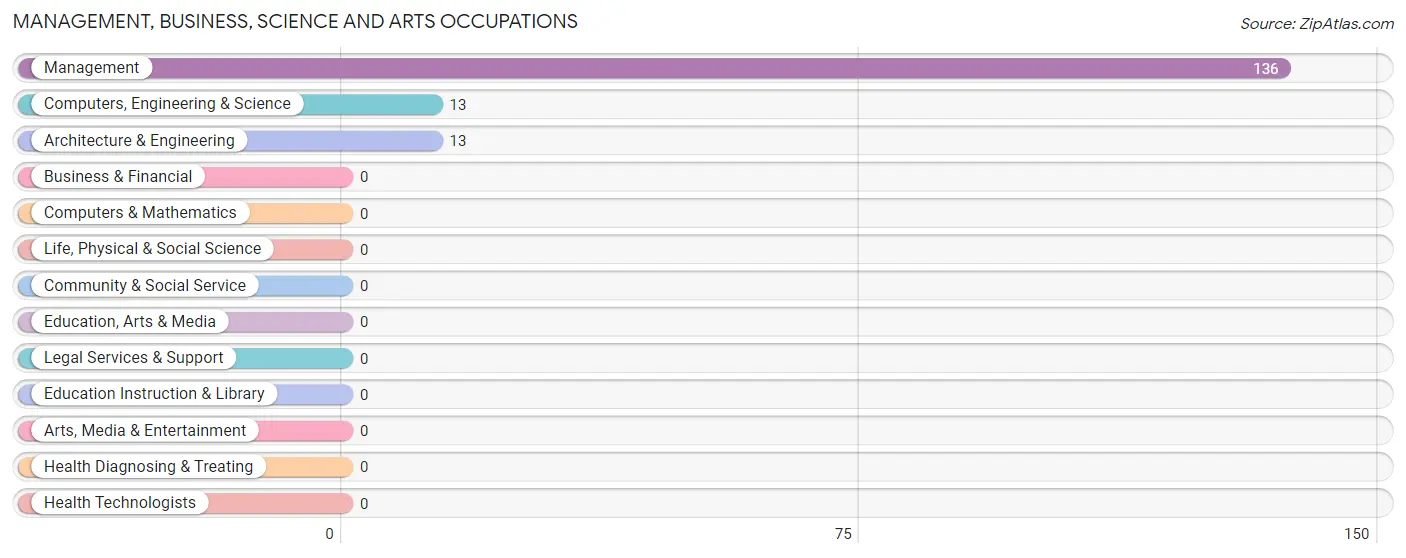
Management, Business, Science and Arts Occupations by Sex
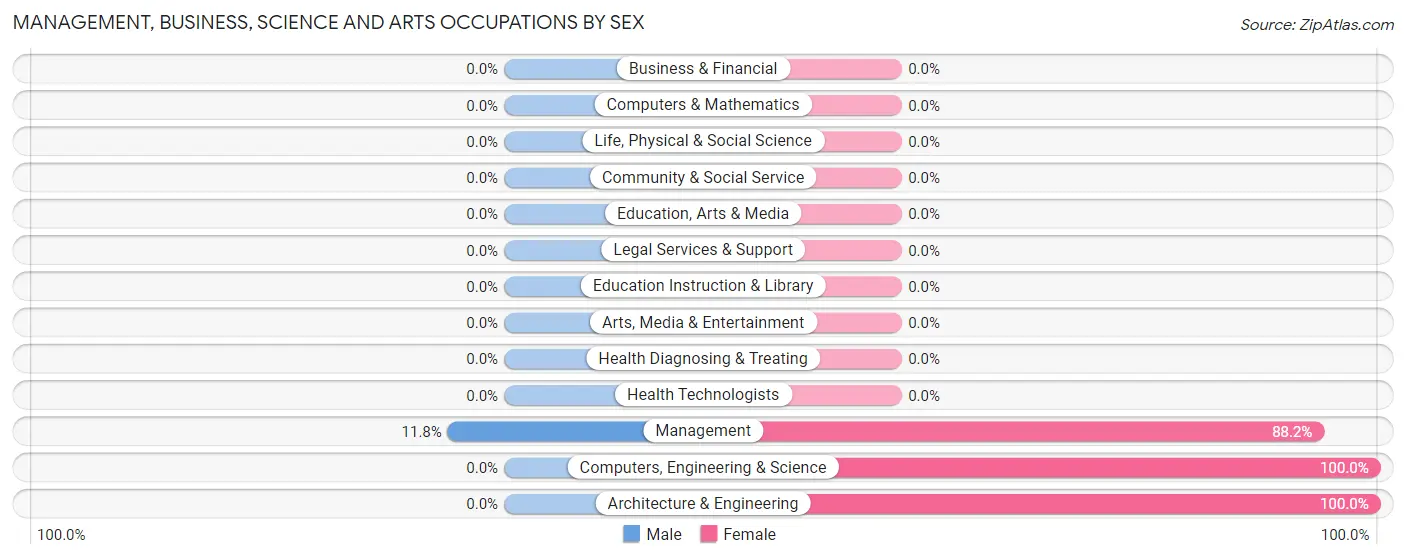
| Occupation | Male | Female |
| Management | 16 (11.8%) | 120 (88.2%) |
| Business & Financial | 0 (0.0%) | 0 (0.0%) |
| Computers, Engineering & Science | 0 (0.0%) | 13 (100.0%) |
| Computers & Mathematics | 0 (0.0%) | 0 (0.0%) |
| Architecture & Engineering | 0 (0.0%) | 13 (100.0%) |
| Life, Physical & Social Science | 0 (0.0%) | 0 (0.0%) |
| Community & Social Service | 0 (0.0%) | 0 (0.0%) |
| Education, Arts & Media | 0 (0.0%) | 0 (0.0%) |
| Legal Services & Support | 0 (0.0%) | 0 (0.0%) |
| Education Instruction & Library | 0 (0.0%) | 0 (0.0%) |
| Arts, Media & Entertainment | 0 (0.0%) | 0 (0.0%) |
| Health Diagnosing & Treating | 0 (0.0%) | 0 (0.0%) |
| Health Technologists | 0 (0.0%) | 0 (0.0%) |
| Total (Category) | 16 (10.7%) | 133 (89.3%) |
| Total (Overall) | 561 (58.8%) | 393 (41.2%) |
Services Occupations
The most common Services occupations in South Creek are Security & Protection (13 | 1.4%), Firefighting & Prevention (13 | 1.4%), and Cleaning & Maintenance (1 | 0.1%).
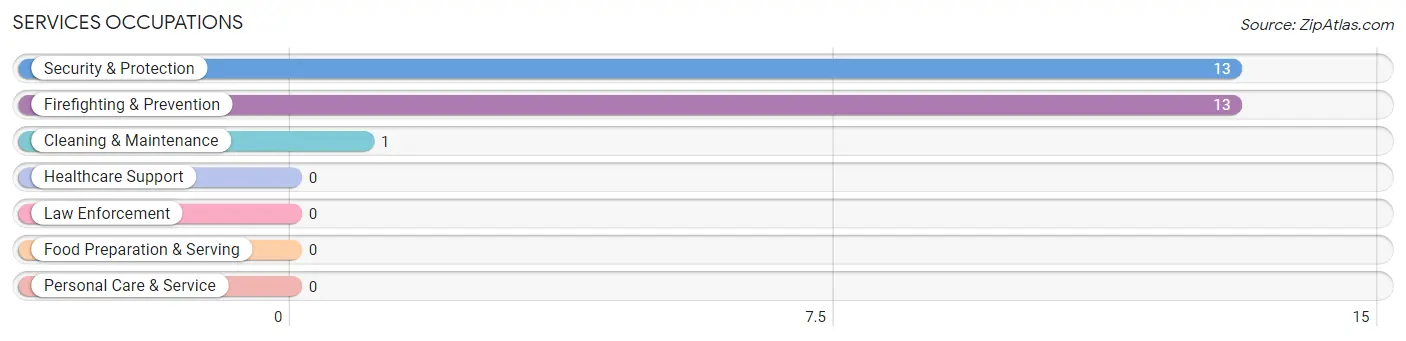
Services Occupations by Sex
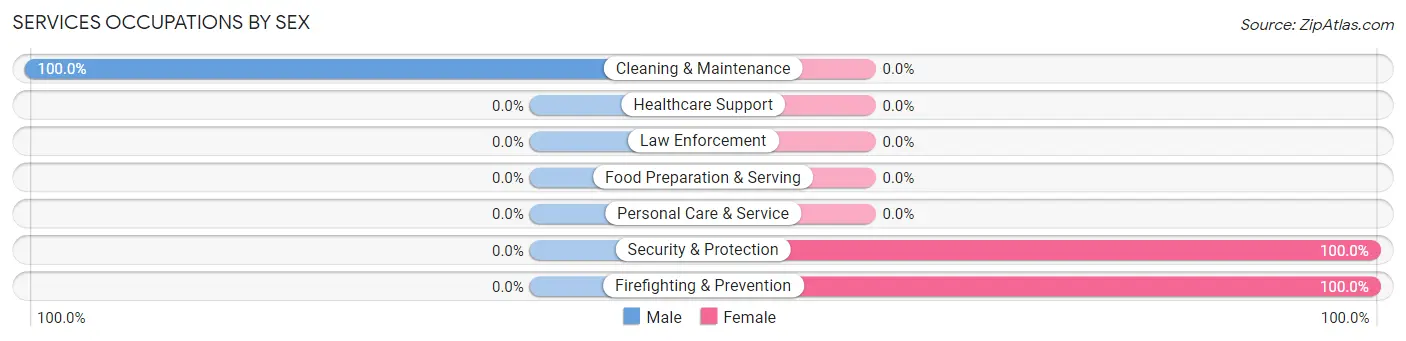
| Occupation | Male | Female |
| Healthcare Support | 0 (0.0%) | 0 (0.0%) |
| Security & Protection | 0 (0.0%) | 13 (100.0%) |
| Firefighting & Prevention | 0 (0.0%) | 13 (100.0%) |
| Law Enforcement | 0 (0.0%) | 0 (0.0%) |
| Food Preparation & Serving | 0 (0.0%) | 0 (0.0%) |
| Cleaning & Maintenance | 1 (100.0%) | 0 (0.0%) |
| Personal Care & Service | 0 (0.0%) | 0 (0.0%) |
| Total (Category) | 1 (7.1%) | 13 (92.9%) |
| Total (Overall) | 561 (58.8%) | 393 (41.2%) |
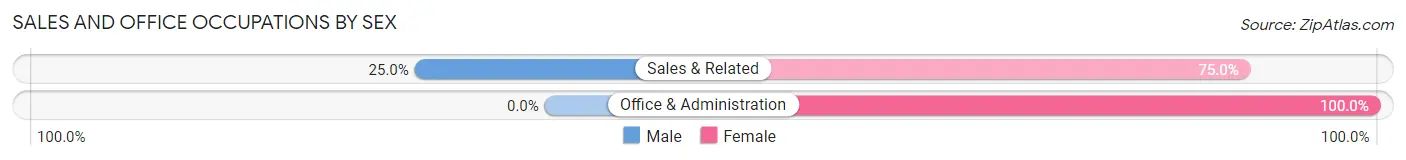
Sales and Office Occupations
The most common Sales and Office occupations in South Creek are Sales & Related (124 | 13.0%), and Office & Administration (72 | 7.5%).
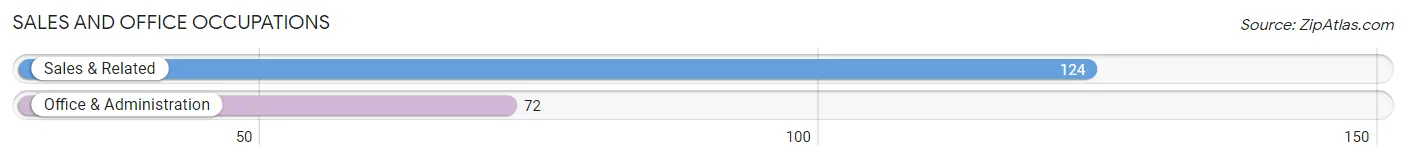
Sales and Office Occupations by Sex
| Occupation | Male | Female |
| Sales & Related | 31 (25.0%) | 93 (75.0%) |
| Office & Administration | 0 (0.0%) | 72 (100.0%) |
| Total (Category) | 31 (15.8%) | 165 (84.2%) |
| Total (Overall) | 561 (58.8%) | 393 (41.2%) |
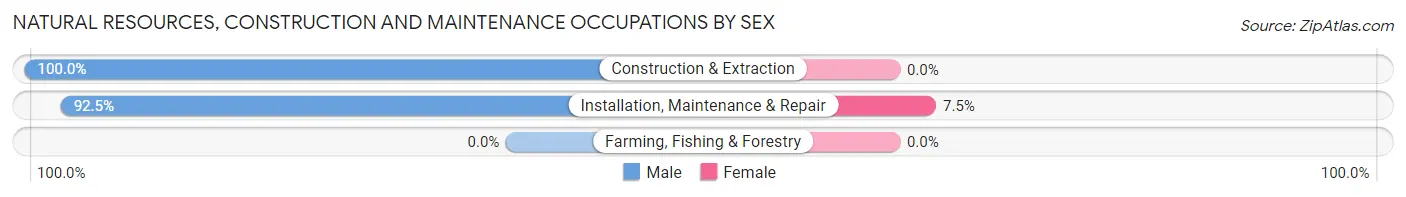
Natural Resources, Construction and Maintenance Occupations
The most common Natural Resources, Construction and Maintenance occupations in South Creek are Construction & Extraction (229 | 24.0%), and Installation, Maintenance & Repair (146 | 15.3%).
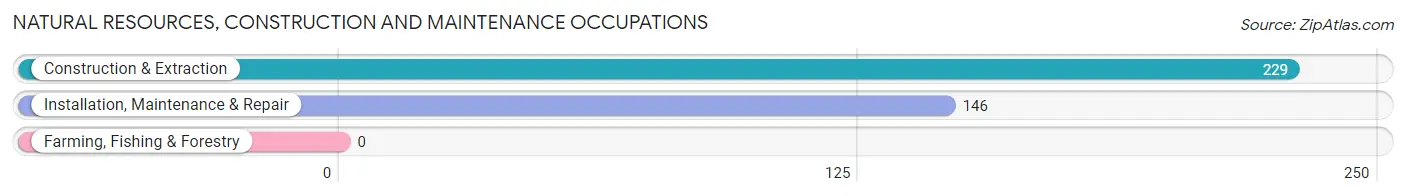
Natural Resources, Construction and Maintenance Occupations by Sex
| Occupation | Male | Female |
| Farming, Fishing & Forestry | 0 (0.0%) | 0 (0.0%) |
| Construction & Extraction | 229 (100.0%) | 0 (0.0%) |
| Installation, Maintenance & Repair | 135 (92.5%) | 11 (7.5%) |
| Total (Category) | 364 (97.1%) | 11 (2.9%) |
| Total (Overall) | 561 (58.8%) | 393 (41.2%) |
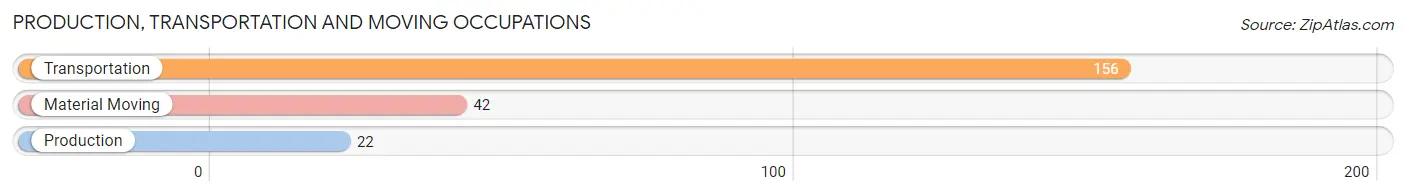
Production, Transportation and Moving Occupations
The most common Production, Transportation and Moving occupations in South Creek are Transportation (156 | 16.4%), Material Moving (42 | 4.4%), and Production (22 | 2.3%).
Production, Transportation and Moving Occupations by Sex
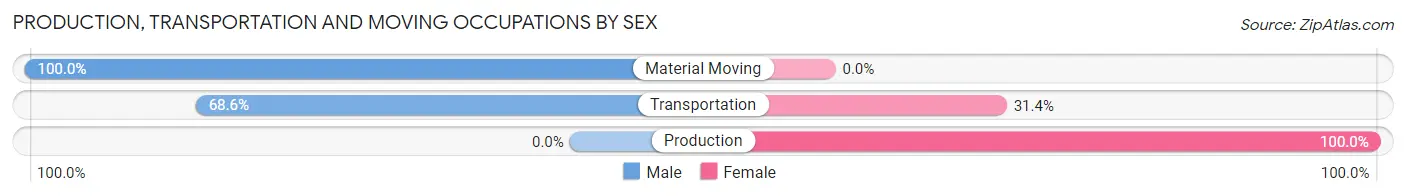
| Occupation | Male | Female |
| Production | 0 (0.0%) | 22 (100.0%) |
| Transportation | 107 (68.6%) | 49 (31.4%) |
| Material Moving | 42 (100.0%) | 0 (0.0%) |
| Total (Category) | 149 (67.7%) | 71 (32.3%) |
| Total (Overall) | 561 (58.8%) | 393 (41.2%) |
Employment Industries by Sex in South Creek
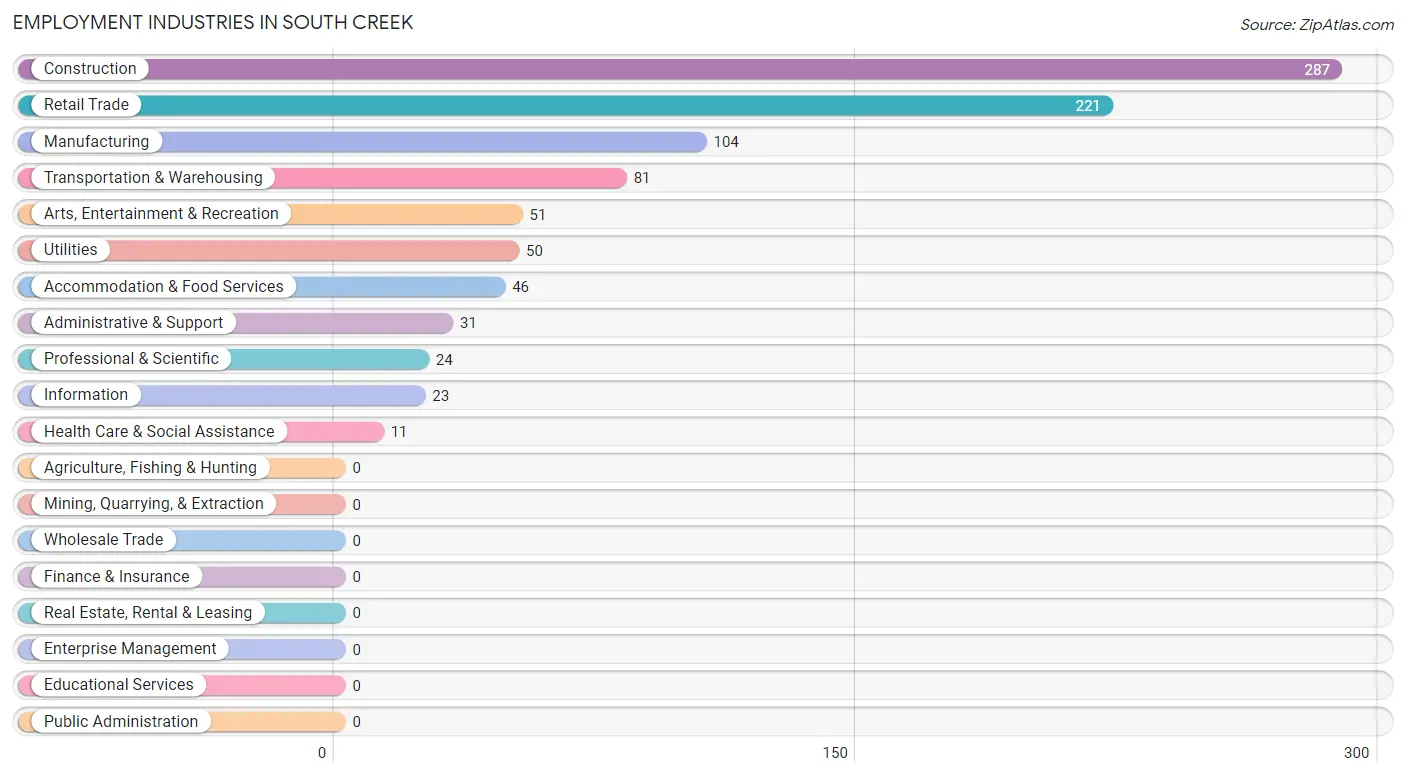
Employment Industries in South Creek
The major employment industries in South Creek include Construction (287 | 30.1%), Retail Trade (221 | 23.2%), Manufacturing (104 | 10.9%), Transportation & Warehousing (81 | 8.5%), and Arts, Entertainment & Recreation (51 | 5.3%).
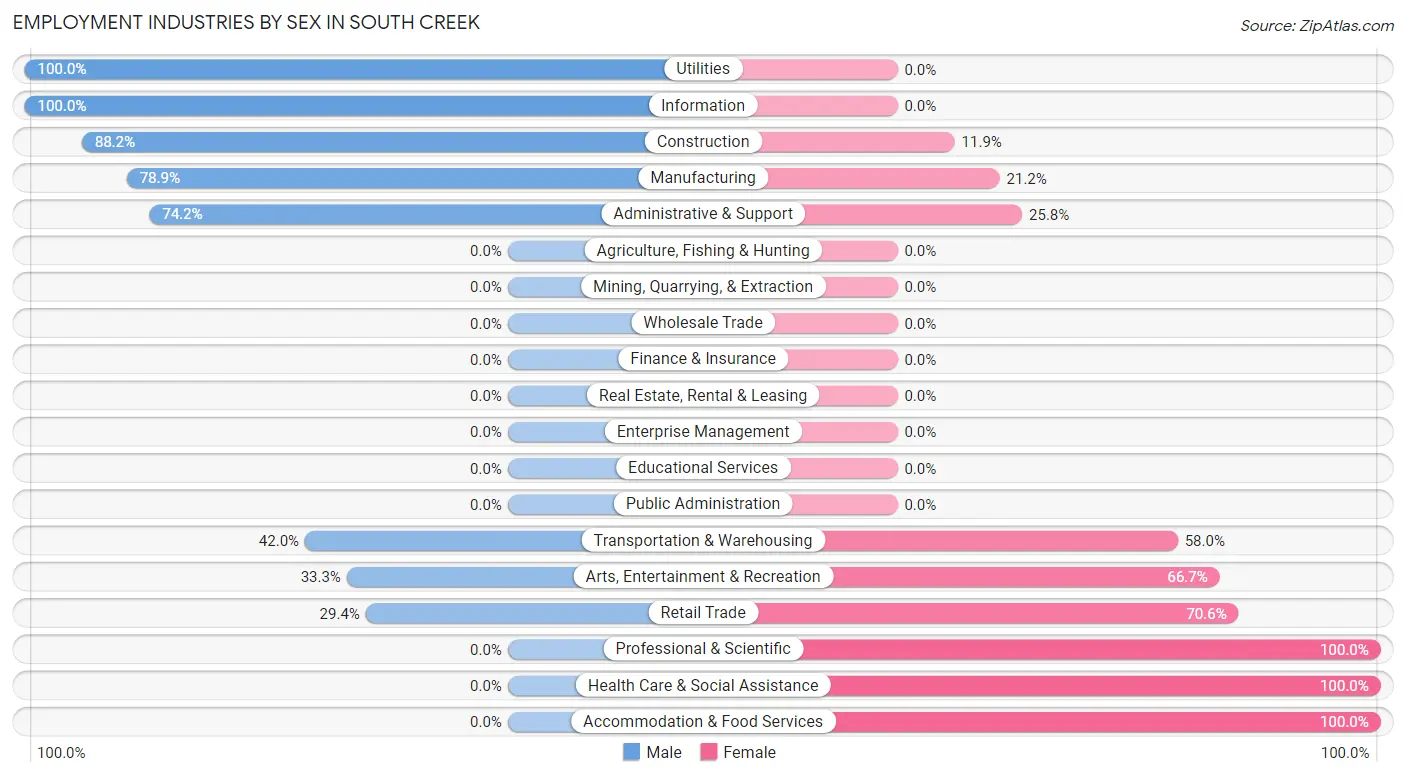
Employment Industries by Sex in South Creek
The South Creek industries that see more men than women are Utilities (100.0%), Information (100.0%), and Construction (88.1%), whereas the industries that tend to have a higher number of women are Professional & Scientific (100.0%), Health Care & Social Assistance (100.0%), and Accommodation & Food Services (100.0%).
| Industry | Male | Female |
| Agriculture, Fishing & Hunting | 0 (0.0%) | 0 (0.0%) |
| Mining, Quarrying, & Extraction | 0 (0.0%) | 0 (0.0%) |
| Construction | 253 (88.1%) | 34 (11.8%) |
| Manufacturing | 82 (78.8%) | 22 (21.1%) |
| Wholesale Trade | 0 (0.0%) | 0 (0.0%) |
| Retail Trade | 65 (29.4%) | 156 (70.6%) |
| Transportation & Warehousing | 34 (42.0%) | 47 (58.0%) |
| Utilities | 50 (100.0%) | 0 (0.0%) |
| Information | 23 (100.0%) | 0 (0.0%) |
| Finance & Insurance | 0 (0.0%) | 0 (0.0%) |
| Real Estate, Rental & Leasing | 0 (0.0%) | 0 (0.0%) |
| Professional & Scientific | 0 (0.0%) | 24 (100.0%) |
| Enterprise Management | 0 (0.0%) | 0 (0.0%) |
| Administrative & Support | 23 (74.2%) | 8 (25.8%) |
| Educational Services | 0 (0.0%) | 0 (0.0%) |
| Health Care & Social Assistance | 0 (0.0%) | 11 (100.0%) |
| Arts, Entertainment & Recreation | 17 (33.3%) | 34 (66.7%) |
| Accommodation & Food Services | 0 (0.0%) | 46 (100.0%) |
| Public Administration | 0 (0.0%) | 0 (0.0%) |
| Total | 561 (58.8%) | 393 (41.2%) |
Education in South Creek
School Enrollment in South Creek
The most common levels of schooling among the 418 students in South Creek are elementary school (122 | 29.2%), middle school (97 | 23.2%), and nursery / preschool (88 | 21.0%).
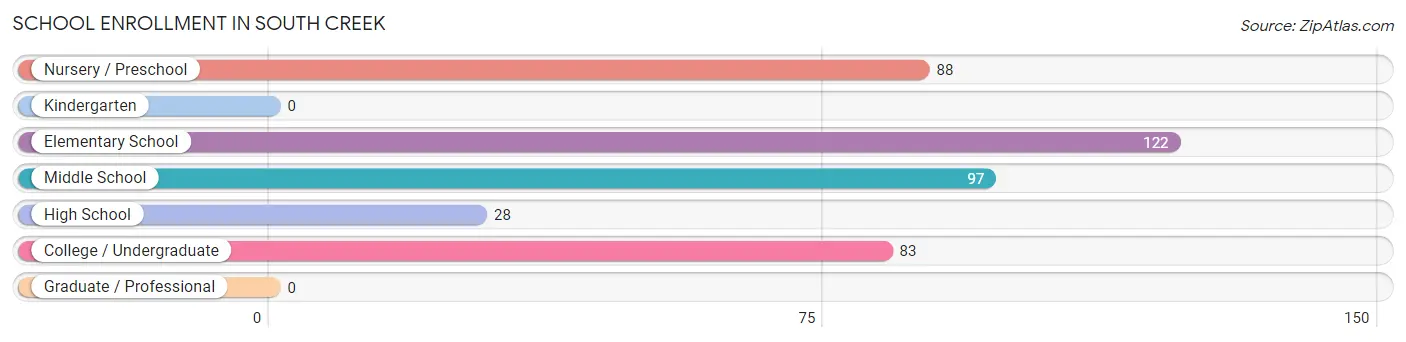
| School Level | # Students | % Students |
| Nursery / Preschool | 88 | 21.0% |
| Kindergarten | 0 | 0.0% |
| Elementary School | 122 | 29.2% |
| Middle School | 97 | 23.2% |
| High School | 28 | 6.7% |
| College / Undergraduate | 83 | 19.9% |
| Graduate / Professional | 0 | 0.0% |
| Total | 418 | 100.0% |
School Enrollment by Age by Funding Source in South Creek
Out of a total of 418 students who are enrolled in schools in South Creek, 18 (4.3%) attend a private institution, while the remaining 400 (95.7%) are enrolled in public schools. The age group of 10 to 14 year olds has the highest likelihood of being enrolled in private schools, with 18 (13.9% in the age bracket) enrolled. Conversely, the age group of 3 to 4 year olds has the lowest likelihood of being enrolled in a private school, with 21 (100.0% in the age bracket) attending a public institution.
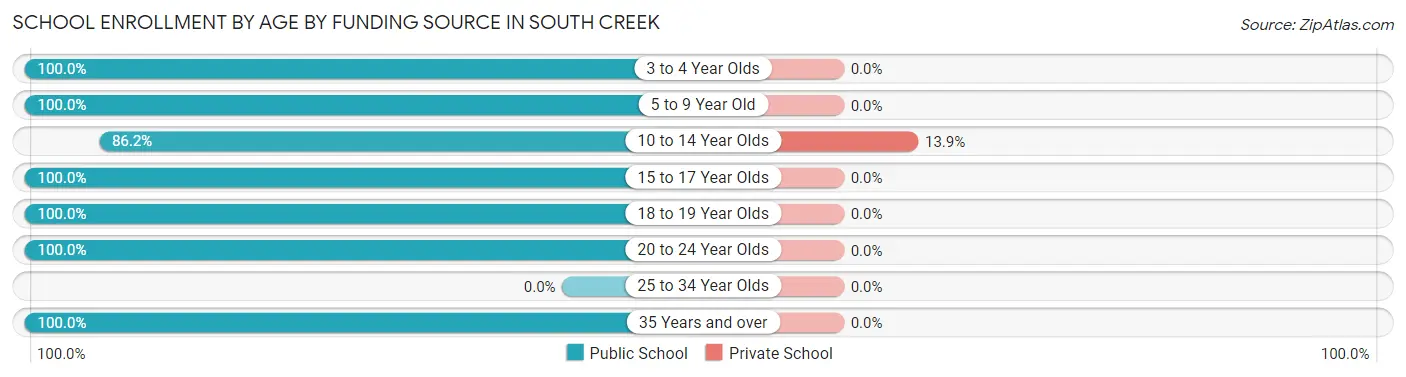
| Age Bracket | Public School | Private School |
| 3 to 4 Year Olds | 21 (100.0%) | 0 (0.0%) |
| 5 to 9 Year Old | 156 (100.0%) | 0 (0.0%) |
| 10 to 14 Year Olds | 112 (86.2%) | 18 (13.9%) |
| 15 to 17 Year Olds | 27 (100.0%) | 0 (0.0%) |
| 18 to 19 Year Olds | 20 (100.0%) | 0 (0.0%) |
| 20 to 24 Year Olds | 49 (100.0%) | 0 (0.0%) |
| 25 to 34 Year Olds | 0 (0.0%) | 0 (0.0%) |
| 35 Years and over | 15 (100.0%) | 0 (0.0%) |
| Total | 400 (95.7%) | 18 (4.3%) |
Educational Attainment by Field of Study in South Creek
Education (56 | 52.3%), business (37 | 34.6%), liberal arts & history (13 | 12.1%), and psychology (1 | 0.9%) are the most common fields of study among 107 individuals in South Creek who have obtained a bachelor's degree or higher.
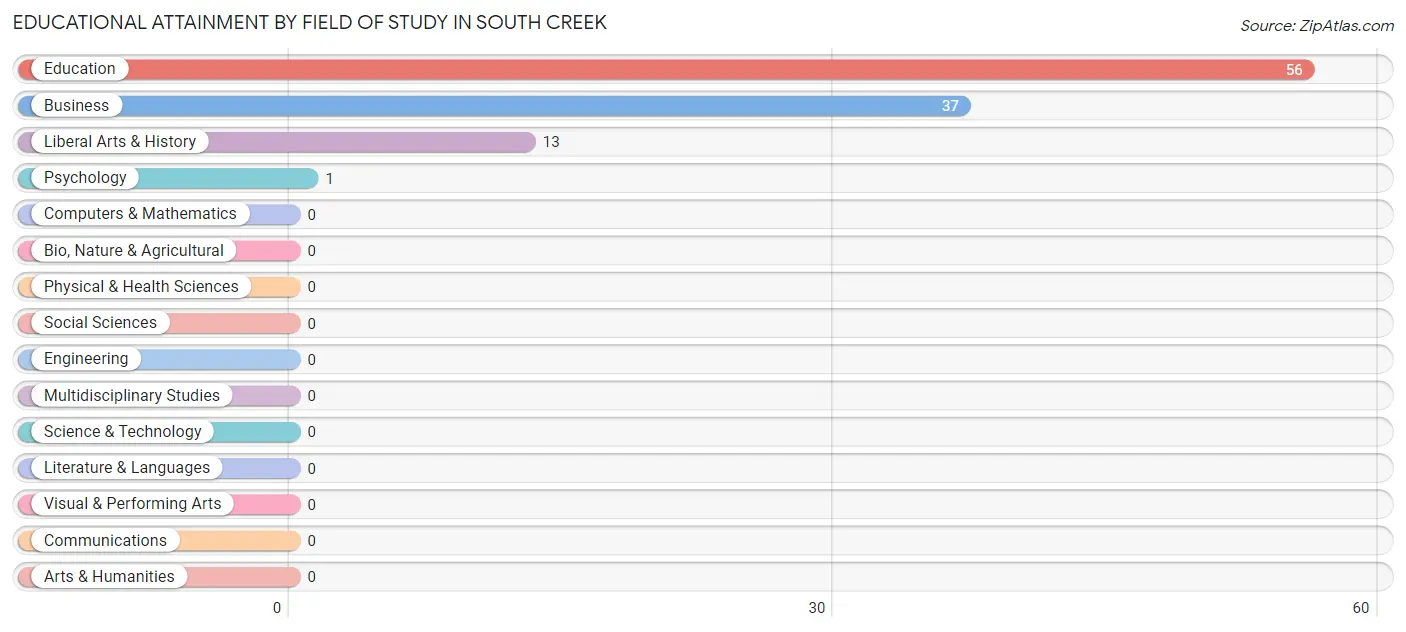
| Field of Study | # Graduates | % Graduates |
| Computers & Mathematics | 0 | 0.0% |
| Bio, Nature & Agricultural | 0 | 0.0% |
| Physical & Health Sciences | 0 | 0.0% |
| Psychology | 1 | 0.9% |
| Social Sciences | 0 | 0.0% |
| Engineering | 0 | 0.0% |
| Multidisciplinary Studies | 0 | 0.0% |
| Science & Technology | 0 | 0.0% |
| Business | 37 | 34.6% |
| Education | 56 | 52.3% |
| Literature & Languages | 0 | 0.0% |
| Liberal Arts & History | 13 | 12.1% |
| Visual & Performing Arts | 0 | 0.0% |
| Communications | 0 | 0.0% |
| Arts & Humanities | 0 | 0.0% |
| Total | 107 | 100.0% |
Transportation & Commute in South Creek
Vehicle Availability by Sex in South Creek
The most prevalent vehicle ownership categories in South Creek are males with 2 vehicles (245, accounting for 48.8%) and females with 2 vehicles (119, making up 68.2%).
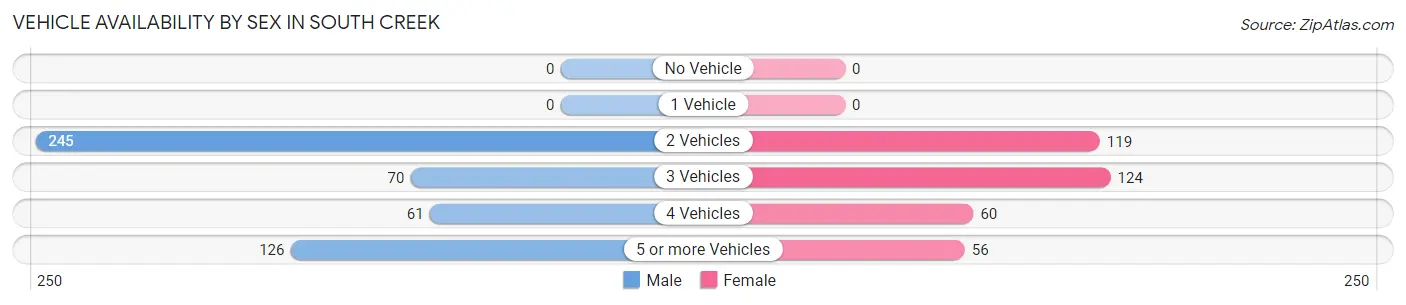
| Vehicles Available | Male | Female |
| No Vehicle | 0 (0.0%) | 0 (0.0%) |
| 1 Vehicle | 0 (0.0%) | 0 (0.0%) |
| 2 Vehicles | 245 (48.8%) | 119 (33.2%) |
| 3 Vehicles | 70 (13.9%) | 124 (34.5%) |
| 4 Vehicles | 61 (12.1%) | 60 (16.7%) |
| 5 or more Vehicles | 126 (25.1%) | 56 (15.6%) |
| Total | 502 (100.0%) | 359 (100.0%) |
Commute Time in South Creek
The most frequently occuring commute durations in South Creek are 90 or more minutes (209 commuters, 25.5%), 45 to 59 minutes (103 commuters, 12.6%), and 30 to 34 minutes (95 commuters, 11.6%).
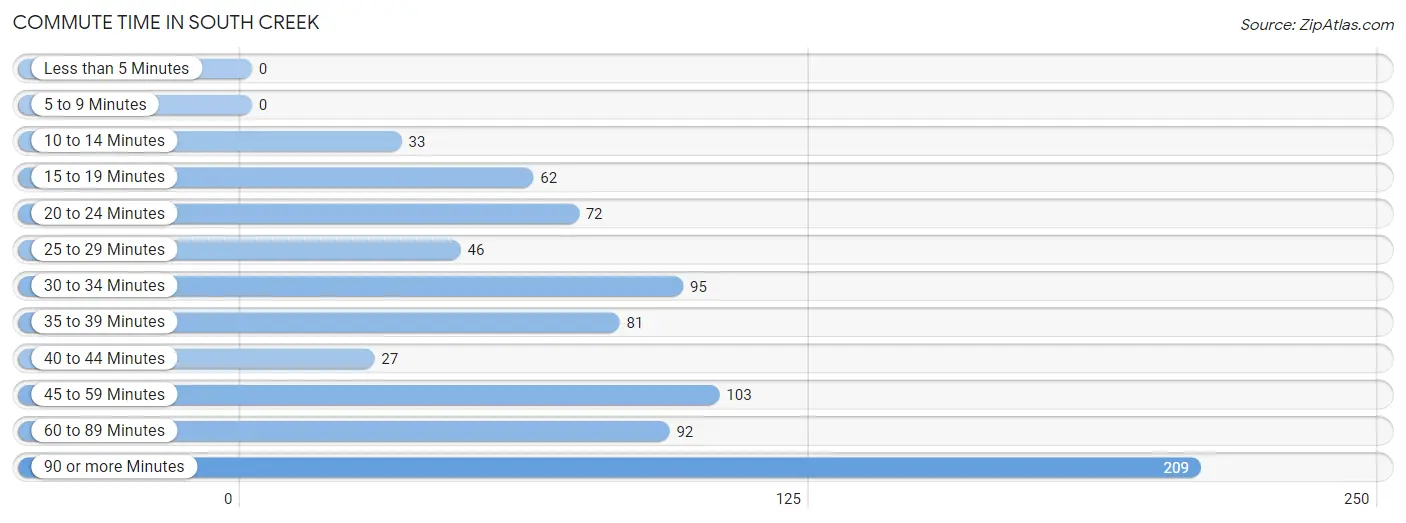
| Commute Time | # Commuters | % Commuters |
| Less than 5 Minutes | 0 | 0.0% |
| 5 to 9 Minutes | 0 | 0.0% |
| 10 to 14 Minutes | 33 | 4.0% |
| 15 to 19 Minutes | 62 | 7.6% |
| 20 to 24 Minutes | 72 | 8.8% |
| 25 to 29 Minutes | 46 | 5.6% |
| 30 to 34 Minutes | 95 | 11.6% |
| 35 to 39 Minutes | 81 | 9.9% |
| 40 to 44 Minutes | 27 | 3.3% |
| 45 to 59 Minutes | 103 | 12.6% |
| 60 to 89 Minutes | 92 | 11.2% |
| 90 or more Minutes | 209 | 25.5% |
Commute Time by Sex in South Creek
The most common commute times in South Creek are 90 or more minutes (145 commuters, 28.8%) for males and 35 to 39 minutes (67 commuters, 21.1%) for females.
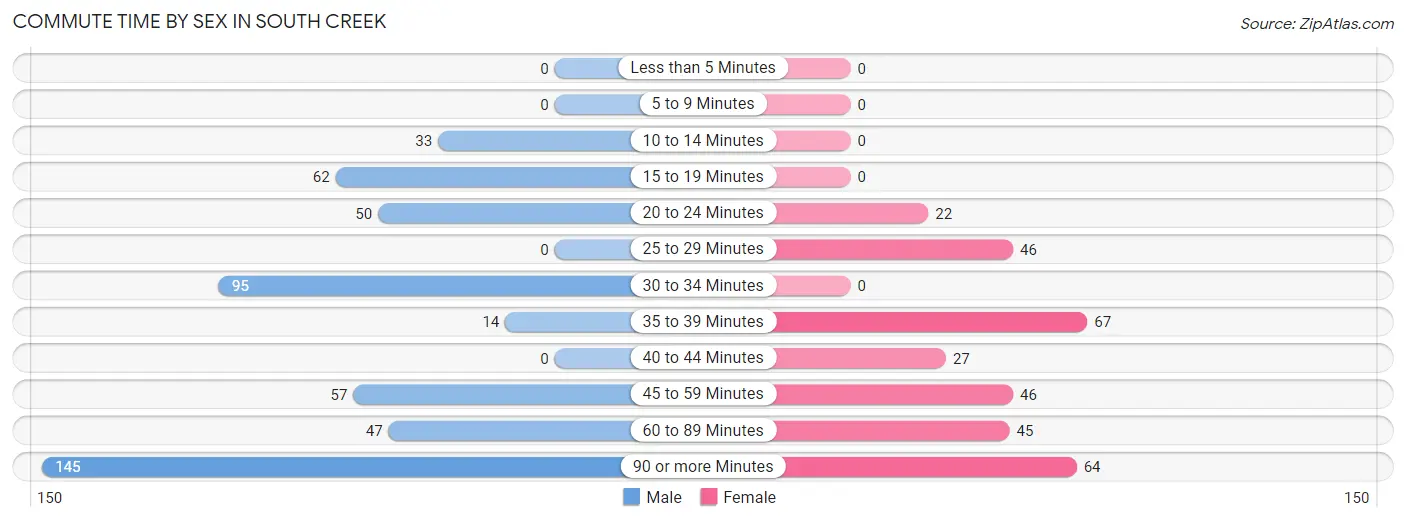
| Commute Time | Male | Female |
| Less than 5 Minutes | 0 (0.0%) | 0 (0.0%) |
| 5 to 9 Minutes | 0 (0.0%) | 0 (0.0%) |
| 10 to 14 Minutes | 33 (6.6%) | 0 (0.0%) |
| 15 to 19 Minutes | 62 (12.3%) | 0 (0.0%) |
| 20 to 24 Minutes | 50 (9.9%) | 22 (6.9%) |
| 25 to 29 Minutes | 0 (0.0%) | 46 (14.5%) |
| 30 to 34 Minutes | 95 (18.9%) | 0 (0.0%) |
| 35 to 39 Minutes | 14 (2.8%) | 67 (21.1%) |
| 40 to 44 Minutes | 0 (0.0%) | 27 (8.5%) |
| 45 to 59 Minutes | 57 (11.3%) | 46 (14.5%) |
| 60 to 89 Minutes | 47 (9.3%) | 45 (14.2%) |
| 90 or more Minutes | 145 (28.8%) | 64 (20.2%) |
Time of Departure to Work by Sex in South Creek
The most frequent times of departure to work in South Creek are 4:00 PM to 11:59 PM (145, 28.8%) for males and 6:00 AM to 6:29 AM (109, 34.4%) for females.
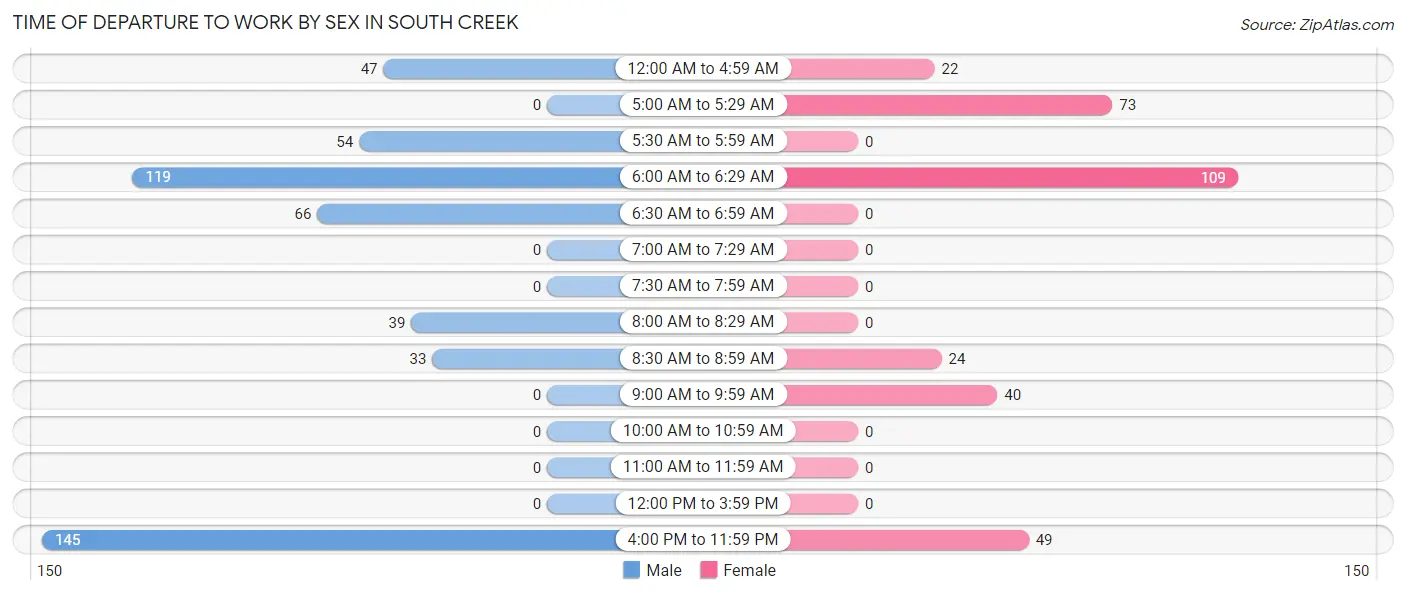
| Time of Departure | Male | Female |
| 12:00 AM to 4:59 AM | 47 (9.3%) | 22 (6.9%) |
| 5:00 AM to 5:29 AM | 0 (0.0%) | 73 (23.0%) |
| 5:30 AM to 5:59 AM | 54 (10.7%) | 0 (0.0%) |
| 6:00 AM to 6:29 AM | 119 (23.7%) | 109 (34.4%) |
| 6:30 AM to 6:59 AM | 66 (13.1%) | 0 (0.0%) |
| 7:00 AM to 7:29 AM | 0 (0.0%) | 0 (0.0%) |
| 7:30 AM to 7:59 AM | 0 (0.0%) | 0 (0.0%) |
| 8:00 AM to 8:29 AM | 39 (7.7%) | 0 (0.0%) |
| 8:30 AM to 8:59 AM | 33 (6.6%) | 24 (7.6%) |
| 9:00 AM to 9:59 AM | 0 (0.0%) | 40 (12.6%) |
| 10:00 AM to 10:59 AM | 0 (0.0%) | 0 (0.0%) |
| 11:00 AM to 11:59 AM | 0 (0.0%) | 0 (0.0%) |
| 12:00 PM to 3:59 PM | 0 (0.0%) | 0 (0.0%) |
| 4:00 PM to 11:59 PM | 145 (28.8%) | 49 (15.5%) |
| Total | 503 (100.0%) | 317 (100.0%) |
Housing Occupancy in South Creek
Occupancy by Ownership in South Creek
Of the total 916 dwellings in South Creek, owner-occupied units account for 664 (72.5%), while renter-occupied units make up 252 (27.5%).
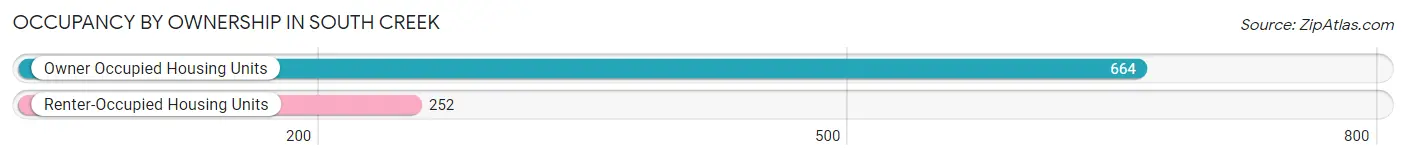
| Occupancy | # Housing Units | % Housing Units |
| Owner Occupied Housing Units | 664 | 72.5% |
| Renter-Occupied Housing Units | 252 | 27.5% |
| Total Occupied Housing Units | 916 | 100.0% |
Occupancy by Household Size in South Creek
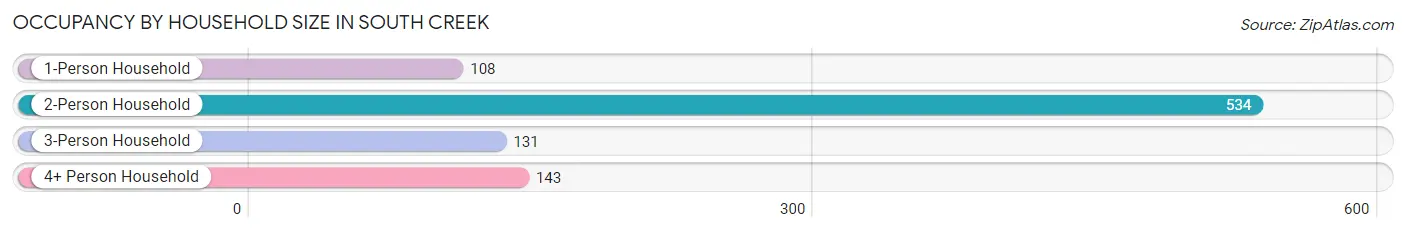
| Household Size | # Housing Units | % Housing Units |
| 1-Person Household | 108 | 11.8% |
| 2-Person Household | 534 | 58.3% |
| 3-Person Household | 131 | 14.3% |
| 4+ Person Household | 143 | 15.6% |
| Total Housing Units | 916 | 100.0% |
Occupancy by Ownership by Household Size in South Creek
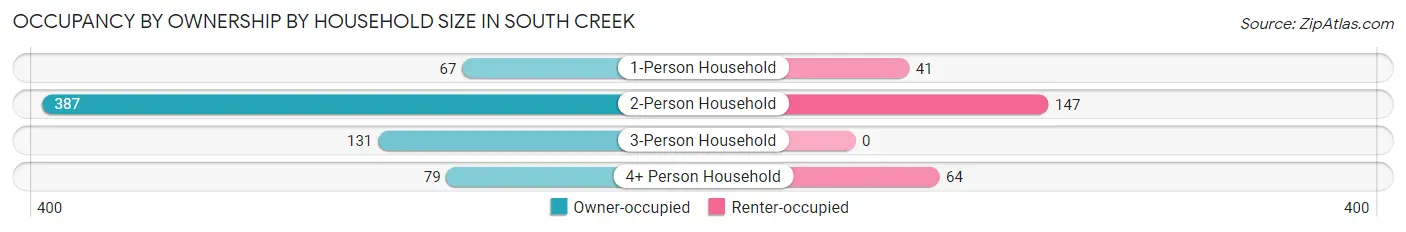
| Household Size | Owner-occupied | Renter-occupied |
| 1-Person Household | 67 (62.0%) | 41 (38.0%) |
| 2-Person Household | 387 (72.5%) | 147 (27.5%) |
| 3-Person Household | 131 (100.0%) | 0 (0.0%) |
| 4+ Person Household | 79 (55.2%) | 64 (44.8%) |
| Total Housing Units | 664 (72.5%) | 252 (27.5%) |
Occupancy by Educational Attainment in South Creek
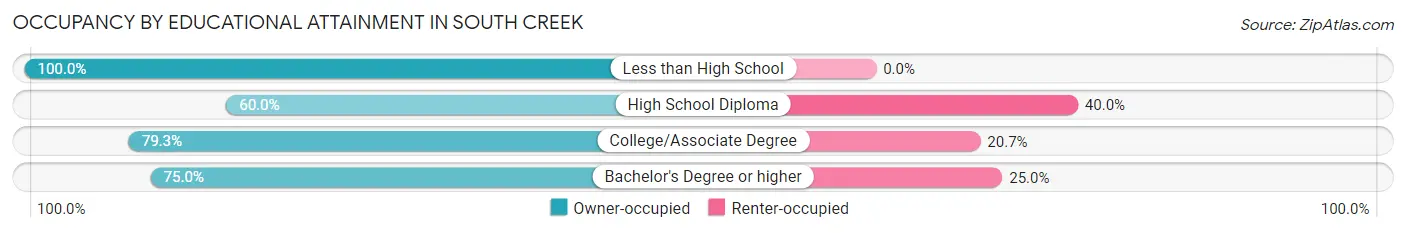
| Household Size | Owner-occupied | Renter-occupied |
| Less than High School | 21 (100.0%) | 0 (0.0%) |
| High School Diploma | 201 (60.0%) | 134 (40.0%) |
| College/Associate Degree | 403 (79.3%) | 105 (20.7%) |
| Bachelor's Degree or higher | 39 (75.0%) | 13 (25.0%) |
Occupancy by Age of Householder in South Creek
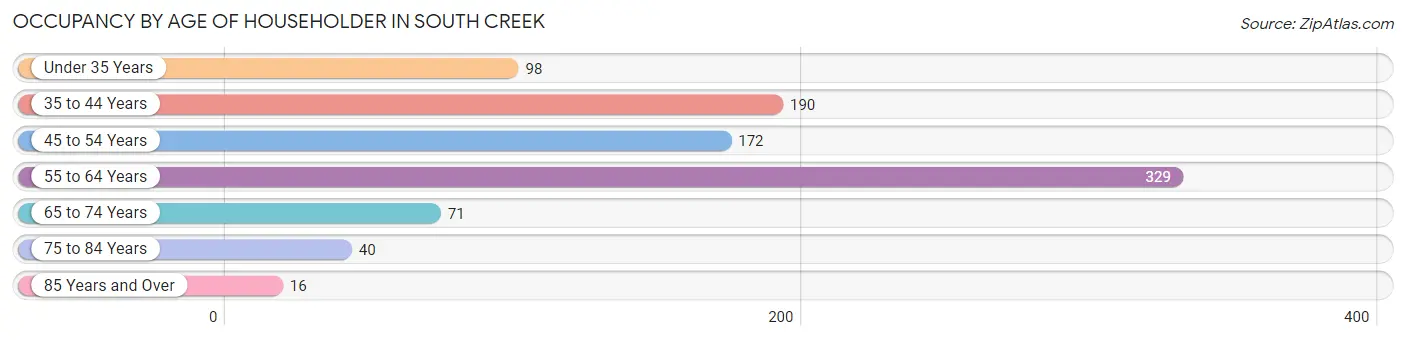
| Age Bracket | # Households | % Households |
| Under 35 Years | 98 | 10.7% |
| 35 to 44 Years | 190 | 20.7% |
| 45 to 54 Years | 172 | 18.8% |
| 55 to 64 Years | 329 | 35.9% |
| 65 to 74 Years | 71 | 7.7% |
| 75 to 84 Years | 40 | 4.4% |
| 85 Years and Over | 16 | 1.8% |
| Total | 916 | 100.0% |
Housing Finances in South Creek
Median Income by Occupancy in South Creek
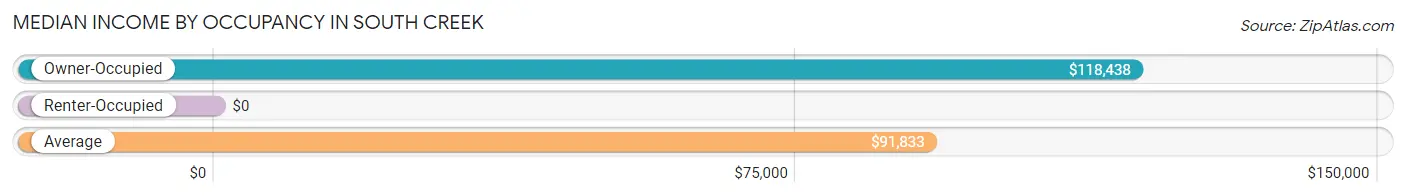
| Occupancy Type | # Households | Median Income |
| Owner-Occupied | 664 (72.5%) | $118,438 |
| Renter-Occupied | 252 (27.5%) | $0 |
| Average | 916 (100.0%) | $91,833 |
Occupancy by Householder Income Bracket in South Creek
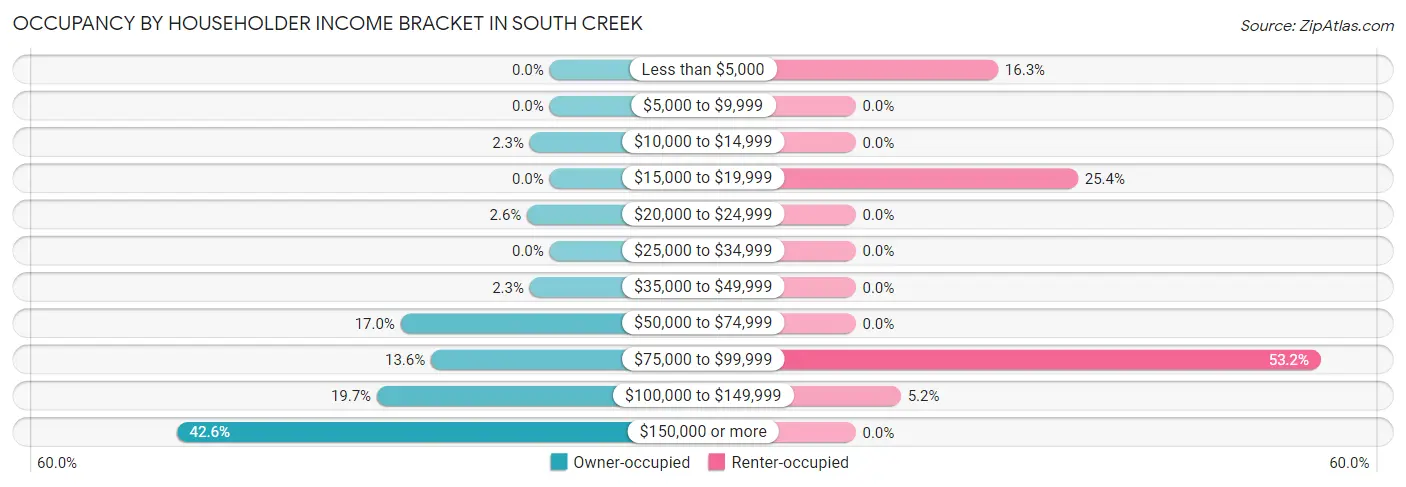
| Income Bracket | Owner-occupied | Renter-occupied |
| Less than $5,000 | 0 (0.0%) | 41 (16.3%) |
| $5,000 to $9,999 | 0 (0.0%) | 0 (0.0%) |
| $10,000 to $14,999 | 15 (2.3%) | 0 (0.0%) |
| $15,000 to $19,999 | 0 (0.0%) | 64 (25.4%) |
| $20,000 to $24,999 | 17 (2.6%) | 0 (0.0%) |
| $25,000 to $34,999 | 0 (0.0%) | 0 (0.0%) |
| $35,000 to $49,999 | 15 (2.3%) | 0 (0.0%) |
| $50,000 to $74,999 | 113 (17.0%) | 0 (0.0%) |
| $75,000 to $99,999 | 90 (13.6%) | 134 (53.2%) |
| $100,000 to $149,999 | 131 (19.7%) | 13 (5.2%) |
| $150,000 or more | 283 (42.6%) | 0 (0.0%) |
| Total | 664 (100.0%) | 252 (100.0%) |
Monthly Housing Cost Tiers in South Creek
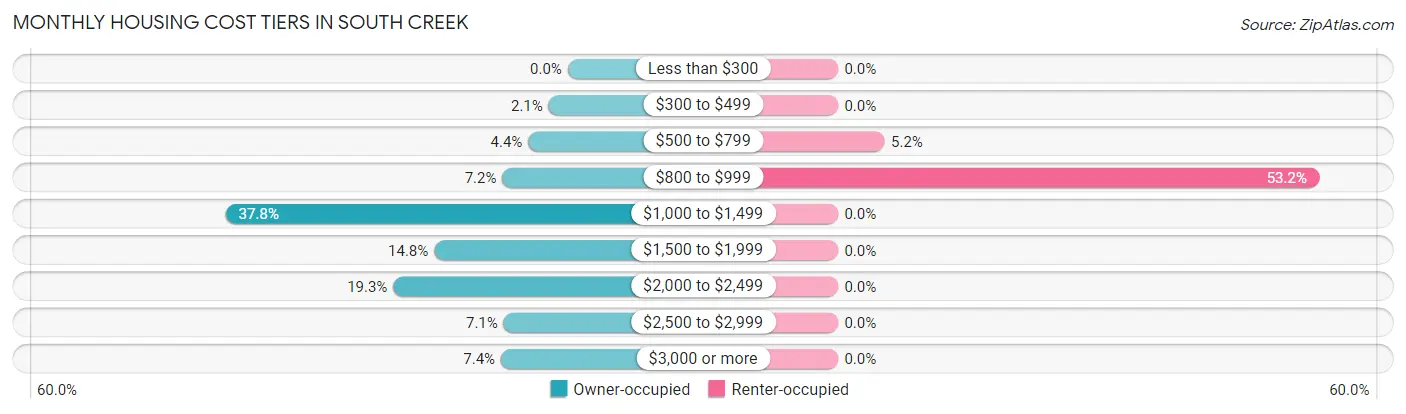
| Monthly Cost | Owner-occupied | Renter-occupied |
| Less than $300 | 0 (0.0%) | 0 (0.0%) |
| $300 to $499 | 14 (2.1%) | 0 (0.0%) |
| $500 to $799 | 29 (4.4%) | 13 (5.2%) |
| $800 to $999 | 48 (7.2%) | 134 (53.2%) |
| $1,000 to $1,499 | 251 (37.8%) | 0 (0.0%) |
| $1,500 to $1,999 | 98 (14.8%) | 0 (0.0%) |
| $2,000 to $2,499 | 128 (19.3%) | 0 (0.0%) |
| $2,500 to $2,999 | 47 (7.1%) | 0 (0.0%) |
| $3,000 or more | 49 (7.4%) | 0 (0.0%) |
| Total | 664 (100.0%) | 252 (100.0%) |
Physical Housing Characteristics in South Creek
Housing Structures in South Creek
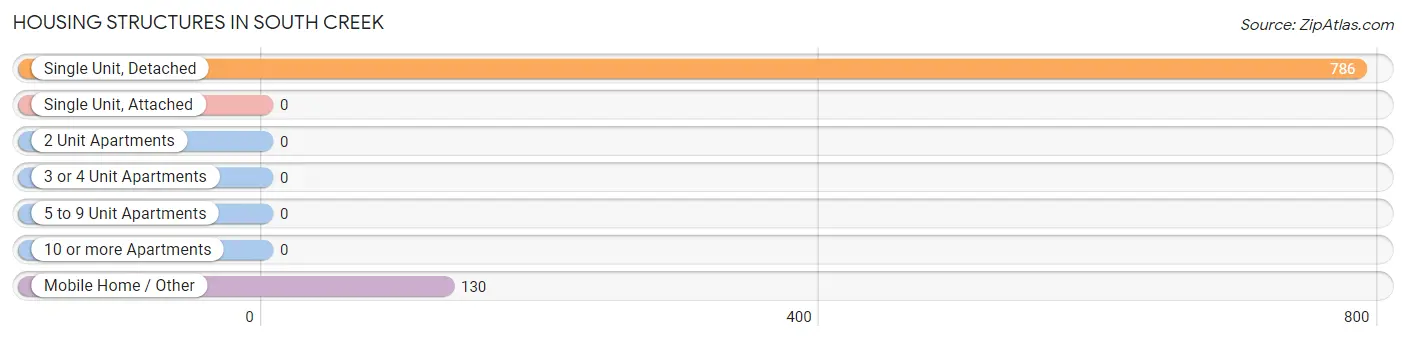
| Structure Type | # Housing Units | % Housing Units |
| Single Unit, Detached | 786 | 85.8% |
| Single Unit, Attached | 0 | 0.0% |
| 2 Unit Apartments | 0 | 0.0% |
| 3 or 4 Unit Apartments | 0 | 0.0% |
| 5 to 9 Unit Apartments | 0 | 0.0% |
| 10 or more Apartments | 0 | 0.0% |
| Mobile Home / Other | 130 | 14.2% |
| Total | 916 | 100.0% |
Housing Structures by Occupancy in South Creek
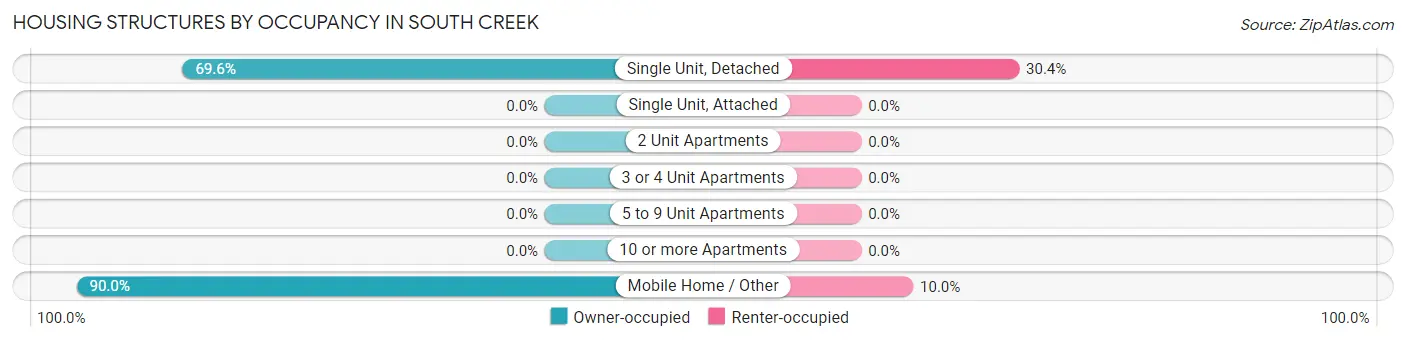
| Structure Type | Owner-occupied | Renter-occupied |
| Single Unit, Detached | 547 (69.6%) | 239 (30.4%) |
| Single Unit, Attached | 0 (0.0%) | 0 (0.0%) |
| 2 Unit Apartments | 0 (0.0%) | 0 (0.0%) |
| 3 or 4 Unit Apartments | 0 (0.0%) | 0 (0.0%) |
| 5 to 9 Unit Apartments | 0 (0.0%) | 0 (0.0%) |
| 10 or more Apartments | 0 (0.0%) | 0 (0.0%) |
| Mobile Home / Other | 117 (90.0%) | 13 (10.0%) |
| Total | 664 (72.5%) | 252 (27.5%) |
Housing Structures by Number of Rooms in South Creek
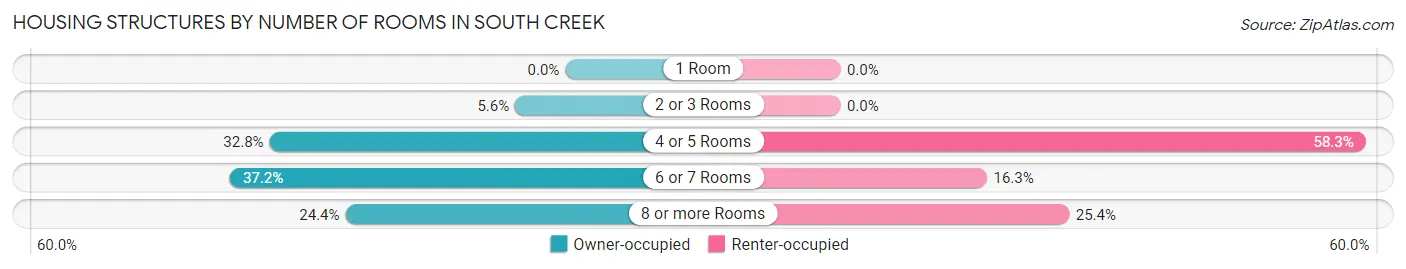
| Number of Rooms | Owner-occupied | Renter-occupied |
| 1 Room | 0 (0.0%) | 0 (0.0%) |
| 2 or 3 Rooms | 37 (5.6%) | 0 (0.0%) |
| 4 or 5 Rooms | 218 (32.8%) | 147 (58.3%) |
| 6 or 7 Rooms | 247 (37.2%) | 41 (16.3%) |
| 8 or more Rooms | 162 (24.4%) | 64 (25.4%) |
| Total | 664 (100.0%) | 252 (100.0%) |
Housing Structure by Heating Type in South Creek
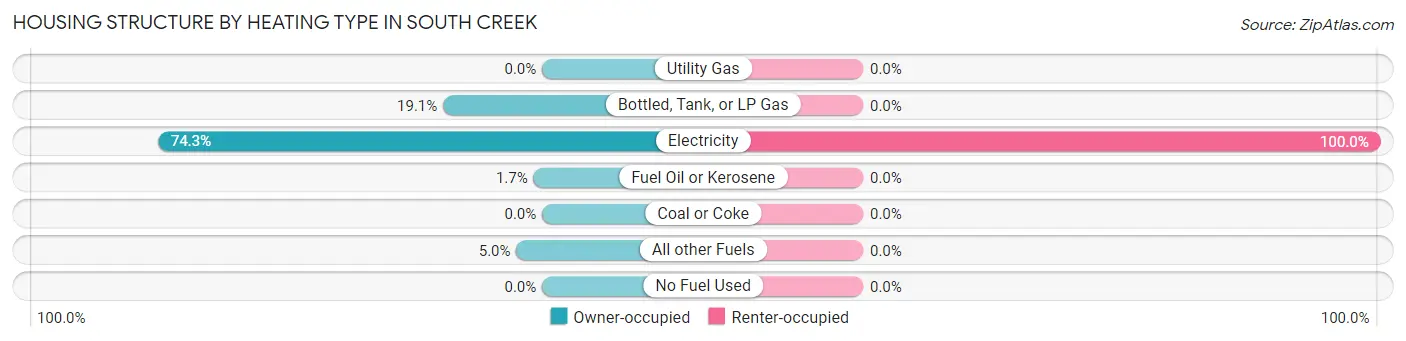
| Heating Type | Owner-occupied | Renter-occupied |
| Utility Gas | 0 (0.0%) | 0 (0.0%) |
| Bottled, Tank, or LP Gas | 127 (19.1%) | 0 (0.0%) |
| Electricity | 493 (74.3%) | 252 (100.0%) |
| Fuel Oil or Kerosene | 11 (1.7%) | 0 (0.0%) |
| Coal or Coke | 0 (0.0%) | 0 (0.0%) |
| All other Fuels | 33 (5.0%) | 0 (0.0%) |
| No Fuel Used | 0 (0.0%) | 0 (0.0%) |
| Total | 664 (100.0%) | 252 (100.0%) |
Household Vehicle Usage in South Creek
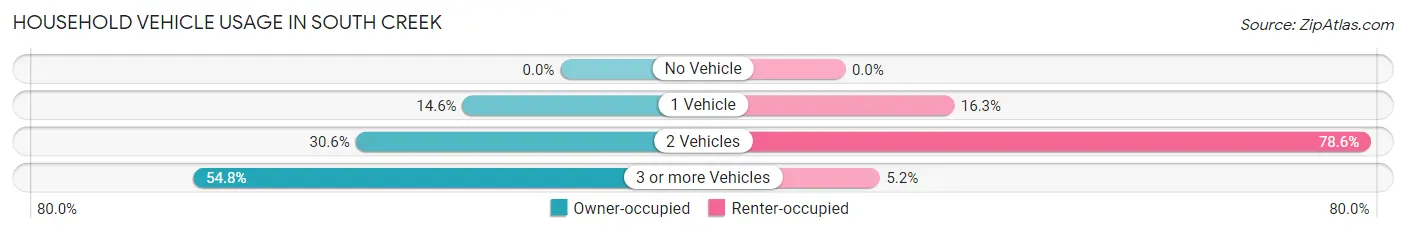
| Vehicles per Household | Owner-occupied | Renter-occupied |
| No Vehicle | 0 (0.0%) | 0 (0.0%) |
| 1 Vehicle | 97 (14.6%) | 41 (16.3%) |
| 2 Vehicles | 203 (30.6%) | 198 (78.6%) |
| 3 or more Vehicles | 364 (54.8%) | 13 (5.2%) |
| Total | 664 (100.0%) | 252 (100.0%) |
Real Estate & Mortgages in South Creek
Real Estate and Mortgage Overview in South Creek
| Characteristic | Without Mortgage | With Mortgage |
| Housing Units | 209 | 455 |
| Median Property Value | $592,800 | $395,700 |
| Median Household Income | - | - |
| Monthly Housing Costs | $1,129 | $49 |
| Real Estate Taxes | $8,034 | $23 |
Property Value by Mortgage Status in South Creek
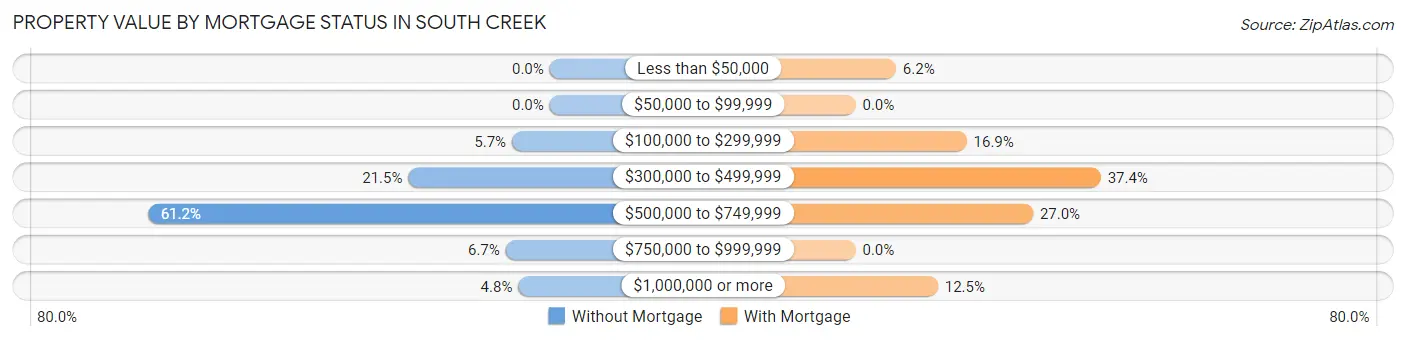
| Property Value | Without Mortgage | With Mortgage |
| Less than $50,000 | 0 (0.0%) | 28 (6.1%) |
| $50,000 to $99,999 | 0 (0.0%) | 0 (0.0%) |
| $100,000 to $299,999 | 12 (5.7%) | 77 (16.9%) |
| $300,000 to $499,999 | 45 (21.5%) | 170 (37.4%) |
| $500,000 to $749,999 | 128 (61.2%) | 123 (27.0%) |
| $750,000 to $999,999 | 14 (6.7%) | 0 (0.0%) |
| $1,000,000 or more | 10 (4.8%) | 57 (12.5%) |
| Total | 209 (100.0%) | 455 (100.0%) |
Household Income by Mortgage Status in South Creek
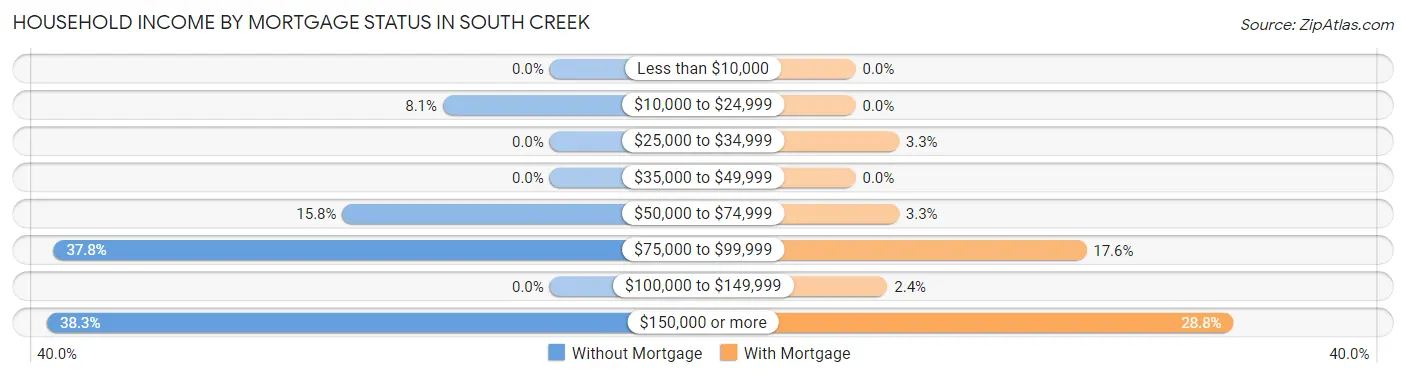
| Household Income | Without Mortgage | With Mortgage |
| Less than $10,000 | 0 (0.0%) | 0 (0.0%) |
| $10,000 to $24,999 | 17 (8.1%) | 0 (0.0%) |
| $25,000 to $34,999 | 0 (0.0%) | 15 (3.3%) |
| $35,000 to $49,999 | 0 (0.0%) | 0 (0.0%) |
| $50,000 to $74,999 | 33 (15.8%) | 15 (3.3%) |
| $75,000 to $99,999 | 79 (37.8%) | 80 (17.6%) |
| $100,000 to $149,999 | 0 (0.0%) | 11 (2.4%) |
| $150,000 or more | 80 (38.3%) | 131 (28.8%) |
| Total | 209 (100.0%) | 455 (100.0%) |
Property Value to Household Income Ratio in South Creek
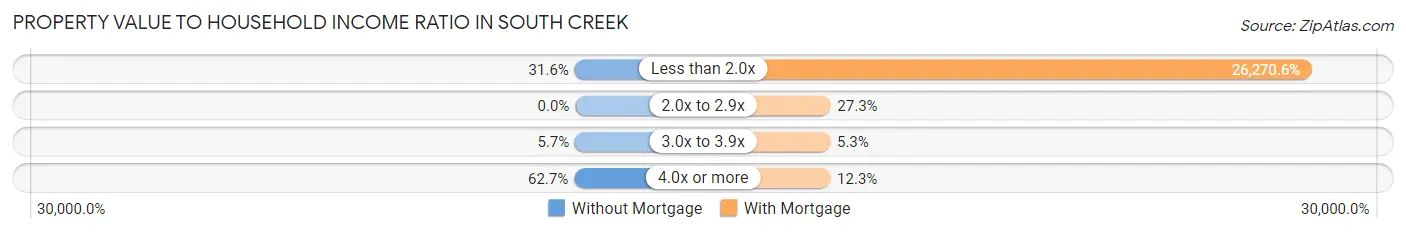
| Value-to-Income Ratio | Without Mortgage | With Mortgage |
| Less than 2.0x | 66 (31.6%) | 119,531 (26,270.5%) |
| 2.0x to 2.9x | 0 (0.0%) | 124 (27.3%) |
| 3.0x to 3.9x | 12 (5.7%) | 24 (5.3%) |
| 4.0x or more | 131 (62.7%) | 56 (12.3%) |
| Total | 209 (100.0%) | 455 (100.0%) |
Real Estate Taxes by Mortgage Status in South Creek
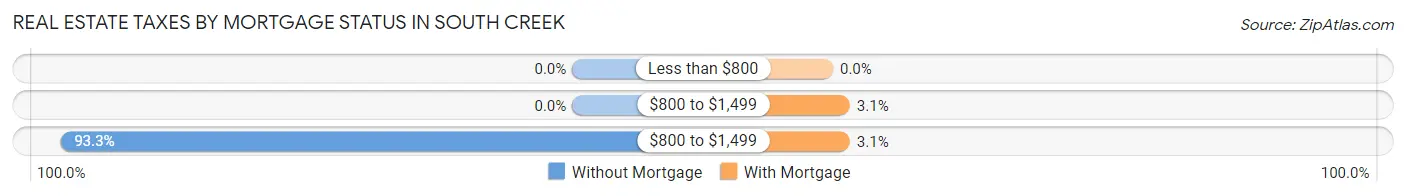
| Property Taxes | Without Mortgage | With Mortgage |
| Less than $800 | 0 (0.0%) | 0 (0.0%) |
| $800 to $1,499 | 0 (0.0%) | 14 (3.1%) |
| $800 to $1,499 | 195 (93.3%) | 14 (3.1%) |
| Total | 209 (100.0%) | 455 (100.0%) |
Health & Disability in South Creek
Health Insurance Coverage by Age in South Creek
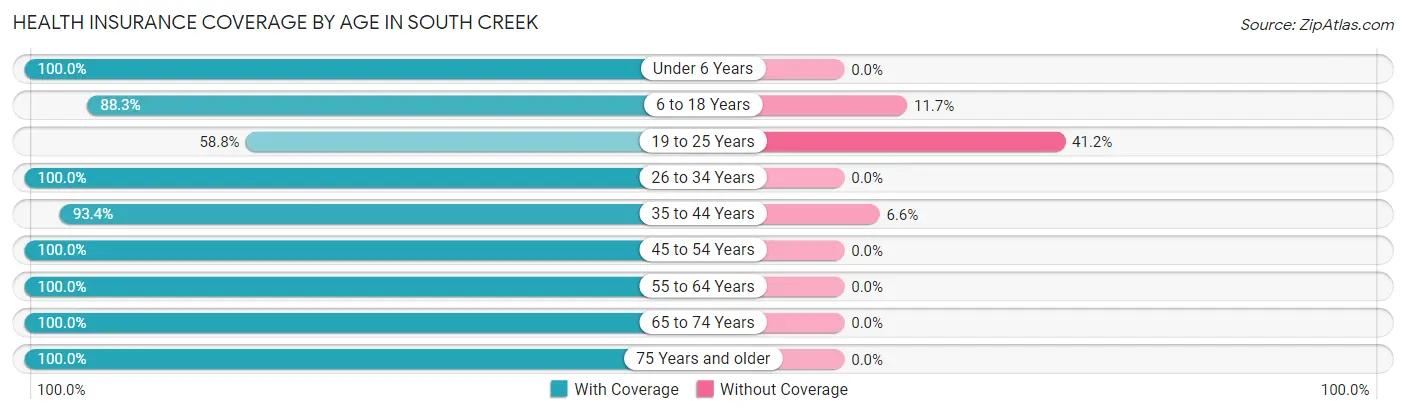
| Age Bracket | With Coverage | Without Coverage |
| Under 6 Years | 235 (100.0%) | 0 (0.0%) |
| 6 to 18 Years | 234 (88.3%) | 31 (11.7%) |
| 19 to 25 Years | 70 (58.8%) | 49 (41.2%) |
| 26 to 34 Years | 148 (100.0%) | 0 (0.0%) |
| 35 to 44 Years | 256 (93.4%) | 18 (6.6%) |
| 45 to 54 Years | 270 (100.0%) | 0 (0.0%) |
| 55 to 64 Years | 646 (100.0%) | 0 (0.0%) |
| 65 to 74 Years | 292 (100.0%) | 0 (0.0%) |
| 75 Years and older | 97 (100.0%) | 0 (0.0%) |
| Total | 2,248 (95.8%) | 98 (4.2%) |
Health Insurance Coverage by Citizenship Status in South Creek
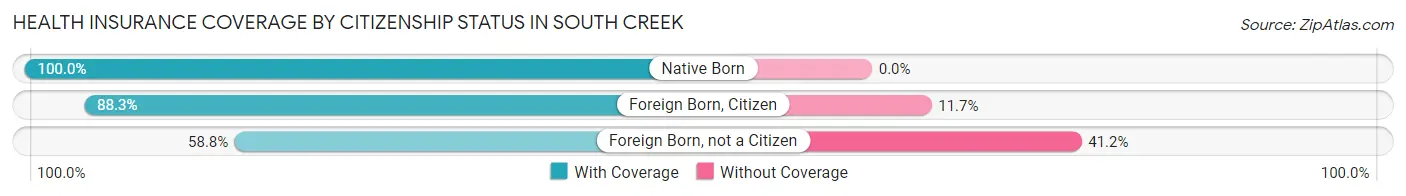
| Citizenship Status | With Coverage | Without Coverage |
| Native Born | 235 (100.0%) | 0 (0.0%) |
| Foreign Born, Citizen | 234 (88.3%) | 31 (11.7%) |
| Foreign Born, not a Citizen | 70 (58.8%) | 49 (41.2%) |
Health Insurance Coverage by Household Income in South Creek
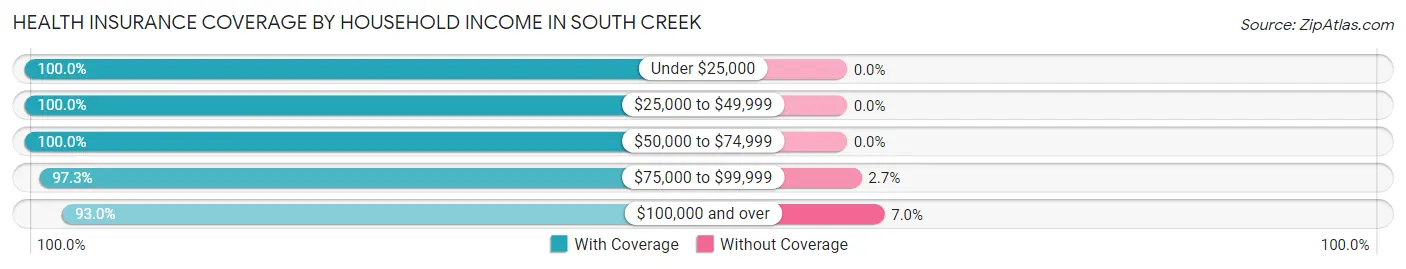
| Household Income | With Coverage | Without Coverage |
| Under $25,000 | 371 (100.0%) | 0 (0.0%) |
| $25,000 to $49,999 | 29 (100.0%) | 0 (0.0%) |
| $50,000 to $74,999 | 247 (100.0%) | 0 (0.0%) |
| $75,000 to $99,999 | 462 (97.3%) | 13 (2.7%) |
| $100,000 and over | 1,126 (93.0%) | 85 (7.0%) |
Public vs Private Health Insurance Coverage by Age in South Creek
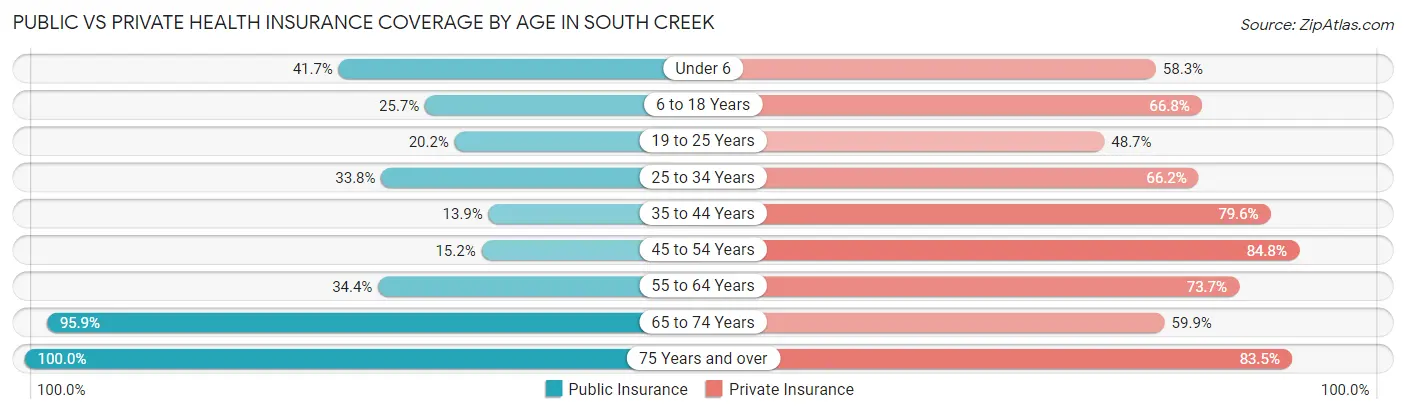
| Age Bracket | Public Insurance | Private Insurance |
| Under 6 | 98 (41.7%) | 137 (58.3%) |
| 6 to 18 Years | 68 (25.7%) | 177 (66.8%) |
| 19 to 25 Years | 24 (20.2%) | 58 (48.7%) |
| 25 to 34 Years | 50 (33.8%) | 98 (66.2%) |
| 35 to 44 Years | 38 (13.9%) | 218 (79.6%) |
| 45 to 54 Years | 41 (15.2%) | 229 (84.8%) |
| 55 to 64 Years | 222 (34.4%) | 476 (73.7%) |
| 65 to 74 Years | 280 (95.9%) | 175 (59.9%) |
| 75 Years and over | 97 (100.0%) | 81 (83.5%) |
| Total | 918 (39.1%) | 1,649 (70.3%) |
Disability Status by Sex by Age in South Creek
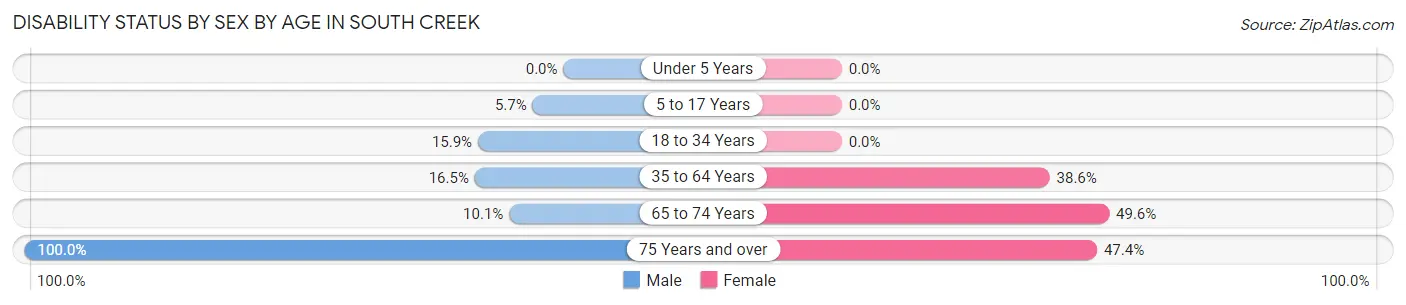
| Age Bracket | Male | Female |
| Under 5 Years | 0 (0.0%) | 0 (0.0%) |
| 5 to 17 Years | 14 (5.7%) | 0 (0.0%) |
| 18 to 34 Years | 13 (15.9%) | 0 (0.0%) |
| 35 to 64 Years | 90 (16.5%) | 248 (38.6%) |
| 65 to 74 Years | 16 (10.1%) | 66 (49.6%) |
| 75 Years and over | 21 (100.0%) | 36 (47.4%) |
Disability Class by Sex by Age in South Creek
Disability Class: Hearing Difficulty
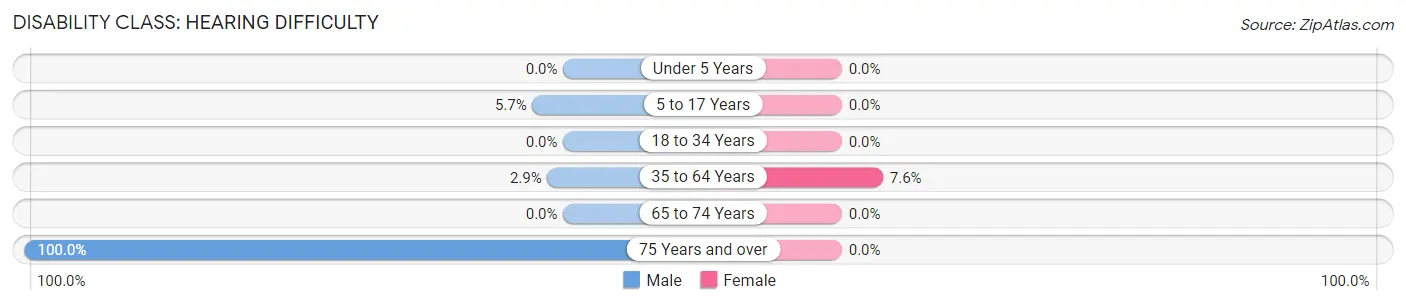
| Age Bracket | Male | Female |
| Under 5 Years | 0 (0.0%) | 0 (0.0%) |
| 5 to 17 Years | 14 (5.7%) | 0 (0.0%) |
| 18 to 34 Years | 0 (0.0%) | 0 (0.0%) |
| 35 to 64 Years | 16 (2.9%) | 49 (7.6%) |
| 65 to 74 Years | 0 (0.0%) | 0 (0.0%) |
| 75 Years and over | 21 (100.0%) | 0 (0.0%) |
Disability Class: Vision Difficulty
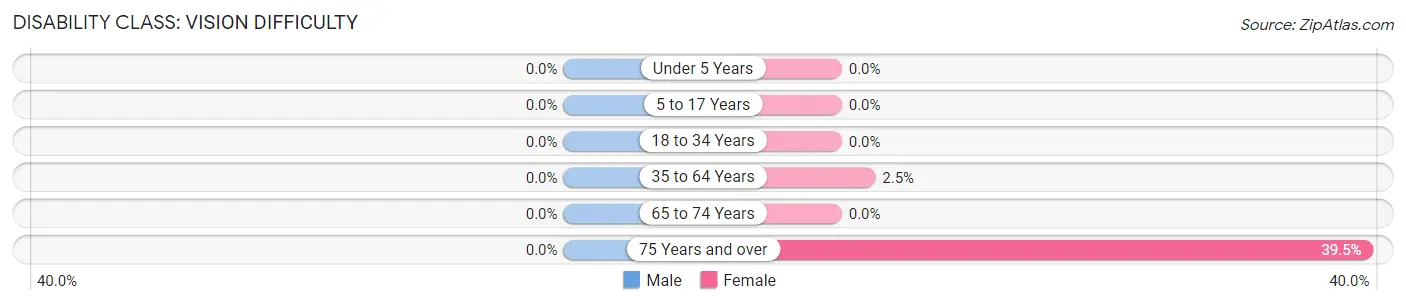
| Age Bracket | Male | Female |
| Under 5 Years | 0 (0.0%) | 0 (0.0%) |
| 5 to 17 Years | 0 (0.0%) | 0 (0.0%) |
| 18 to 34 Years | 0 (0.0%) | 0 (0.0%) |
| 35 to 64 Years | 0 (0.0%) | 16 (2.5%) |
| 65 to 74 Years | 0 (0.0%) | 0 (0.0%) |
| 75 Years and over | 0 (0.0%) | 30 (39.5%) |
Disability Class: Cognitive Difficulty
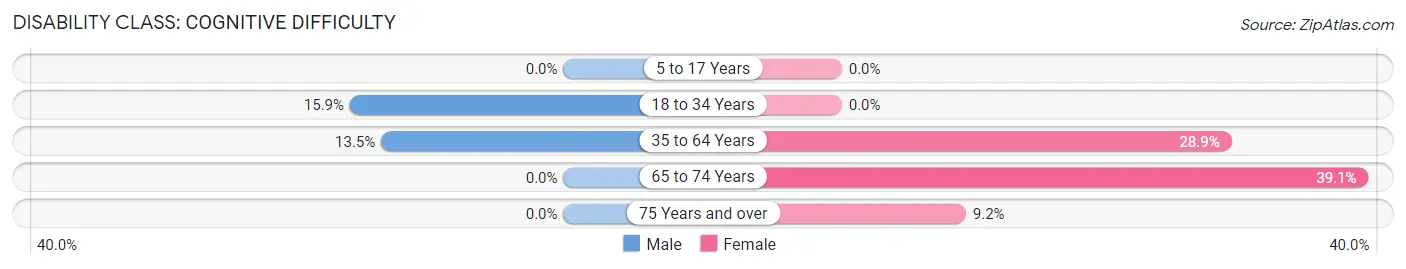
| Age Bracket | Male | Female |
| 5 to 17 Years | 0 (0.0%) | 0 (0.0%) |
| 18 to 34 Years | 13 (15.9%) | 0 (0.0%) |
| 35 to 64 Years | 74 (13.5%) | 186 (28.9%) |
| 65 to 74 Years | 0 (0.0%) | 52 (39.1%) |
| 75 Years and over | 0 (0.0%) | 7 (9.2%) |
Disability Class: Ambulatory Difficulty
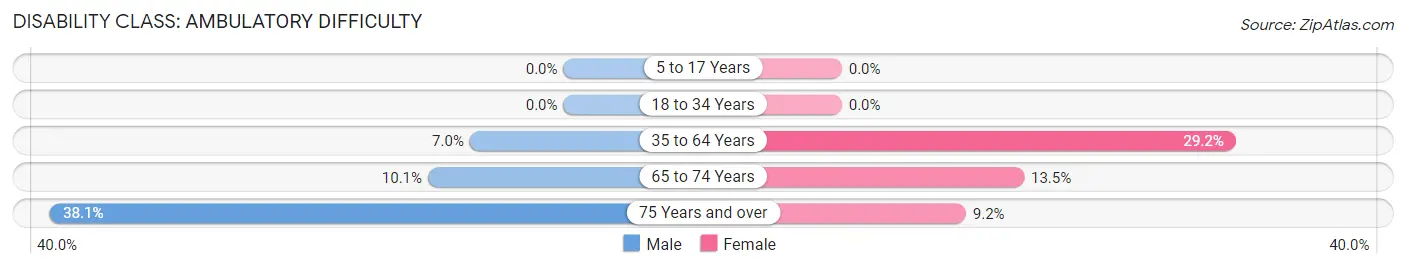
| Age Bracket | Male | Female |
| 5 to 17 Years | 0 (0.0%) | 0 (0.0%) |
| 18 to 34 Years | 0 (0.0%) | 0 (0.0%) |
| 35 to 64 Years | 38 (7.0%) | 188 (29.2%) |
| 65 to 74 Years | 16 (10.1%) | 18 (13.5%) |
| 75 Years and over | 8 (38.1%) | 7 (9.2%) |
Disability Class: Self-Care Difficulty
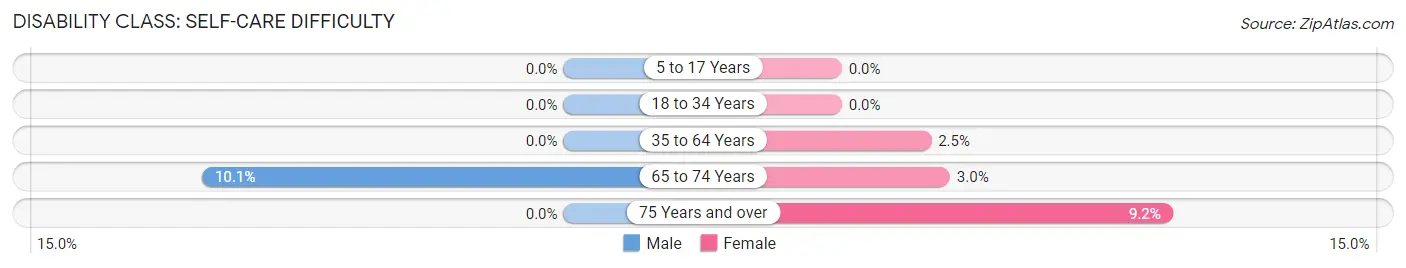
| Age Bracket | Male | Female |
| 5 to 17 Years | 0 (0.0%) | 0 (0.0%) |
| 18 to 34 Years | 0 (0.0%) | 0 (0.0%) |
| 35 to 64 Years | 0 (0.0%) | 16 (2.5%) |
| 65 to 74 Years | 16 (10.1%) | 4 (3.0%) |
| 75 Years and over | 0 (0.0%) | 7 (9.2%) |
Technology Access in South Creek
Computing Device Access in South Creek
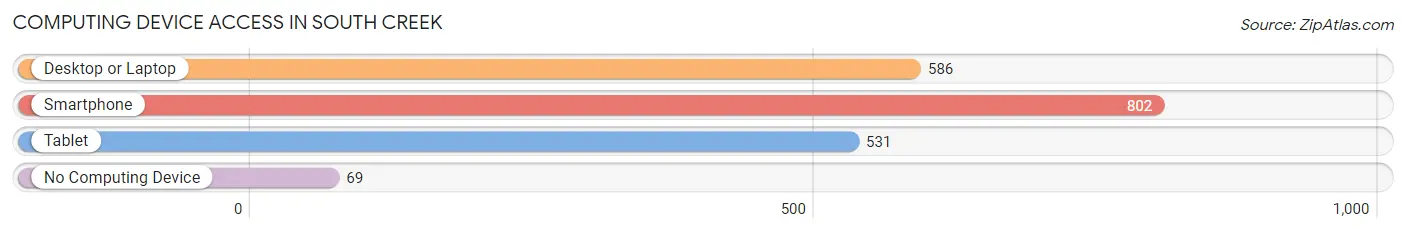
| Device Type | # Households | % Households |
| Desktop or Laptop | 586 | 64.0% |
| Smartphone | 802 | 87.5% |
| Tablet | 531 | 58.0% |
| No Computing Device | 69 | 7.5% |
| Total | 916 | 100.0% |
Internet Access in South Creek
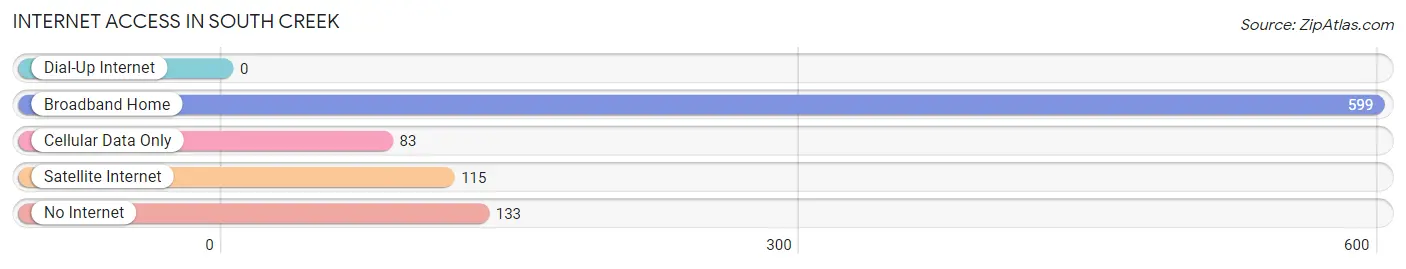
| Internet Type | # Households | % Households |
| Dial-Up Internet | 0 | 0.0% |
| Broadband Home | 599 | 65.4% |
| Cellular Data Only | 83 | 9.1% |
| Satellite Internet | 115 | 12.6% |
| No Internet | 133 | 14.5% |
| Total | 916 | 100.0% |
South Creek Summary
Introduction
South Creek is a small unincorporated community located in the state of Washington, United States. It is situated in the foothills of the Cascade Mountains, approximately 25 miles east of Seattle. The community is home to a population of approximately 1,000 people and is known for its rural charm and natural beauty.
History
South Creek was first settled in the late 1800s by a group of homesteaders who were drawn to the area by its abundance of natural resources. The first settlers were primarily farmers and loggers, and the community quickly grew to include a post office, a general store, and a school.
In the early 1900s, the area experienced a period of rapid growth as the logging industry expanded and the population increased. The town was incorporated in 1910 and the first mayor was elected in 1911.
In the 1920s, the town experienced a period of decline as the logging industry began to decline and the population began to decrease. The Great Depression of the 1930s further exacerbated the situation, and the town was eventually disincorporated in 1940.
Since then, the town has experienced a slow but steady growth, and today it is home to a population of approximately 1,000 people.
Geography
South Creek is located in the foothills of the Cascade Mountains, approximately 25 miles east of Seattle. The town is situated at an elevation of 1,000 feet and is surrounded by lush forests and rolling hills.
The climate in South Creek is mild and temperate, with warm summers and cool winters. The average annual temperature is around 50 degrees Fahrenheit, and the average annual precipitation is around 40 inches.
Economy
The economy of South Creek is largely based on agriculture and forestry. The town is home to several small farms and ranches, and the surrounding forests provide an abundance of timber for the local logging industry.
In addition, the town is home to several small businesses, including a general store, a post office, and a few restaurants.
Demographics
As of the 2010 census, the population of South Creek was 1,000 people. The racial makeup of the town was 95.2% White, 0.7% African American, 0.7% Native American, 0.7% Asian, 0.7% from other races, and 2.1% from two or more races.
The median household income in South Creek was $45,000, and the median family income was $50,000. The per capita income was $20,000.
Conclusion
South Creek is a small unincorporated community located in the state of Washington, United States. It is situated in the foothills of the Cascade Mountains, approximately 25 miles east of Seattle. The community is home to a population of approximately 1,000 people and is known for its rural charm and natural beauty. The economy of South Creek is largely based on agriculture and forestry, and the town is home to several small businesses. As of the 2010 census, the population of South Creek was 1,000 people, and the median household income was $45,000.
Common Questions
What is Per Capita Income in South Creek?
Per Capita income in South Creek is $45,197.
What is the Median Family Income in South Creek?
Median Family Income in South Creek is $105,707.
What is the Median Household income in South Creek?
Median Household Income in South Creek is $91,833.
What is Income or Wage Gap in South Creek?
Income or Wage Gap in South Creek is 52.4%.
Women in South Creek earn 47.6 cents for every dollar earned by a man.
What is Inequality or Gini Index in South Creek?
Inequality or Gini Index in South Creek is 0.40.
What is the Total Population of South Creek?
Total Population of South Creek is 2,346.
What is the Total Male Population of South Creek?
Total Male Population of South Creek is 1,201.
What is the Total Female Population of South Creek?
Total Female Population of South Creek is 1,145.
What is the Ratio of Males per 100 Females in South Creek?
There are 104.89 Males per 100 Females in South Creek.
What is the Ratio of Females per 100 Males in South Creek?
There are 95.34 Females per 100 Males in South Creek.
What is the Median Population Age in South Creek?
Median Population Age in South Creek is 50.9 Years.
What is the Average Family Size in South Creek
Average Family Size in South Creek is 2.8 People.
What is the Average Household Size in South Creek
Average Household Size in South Creek is 2.5 People.
How Large is the Labor Force in South Creek?
There are 1,018 People in the Labor Forcein in South Creek.
What is the Percentage of People in the Labor Force in South Creek?
53.8% of People are in the Labor Force in South Creek.
What is the Unemployment Rate in South Creek?
Unemployment Rate in South Creek is 6.2%.