Peaceful Valley, WA Map & Demographics
Peaceful Valley Map
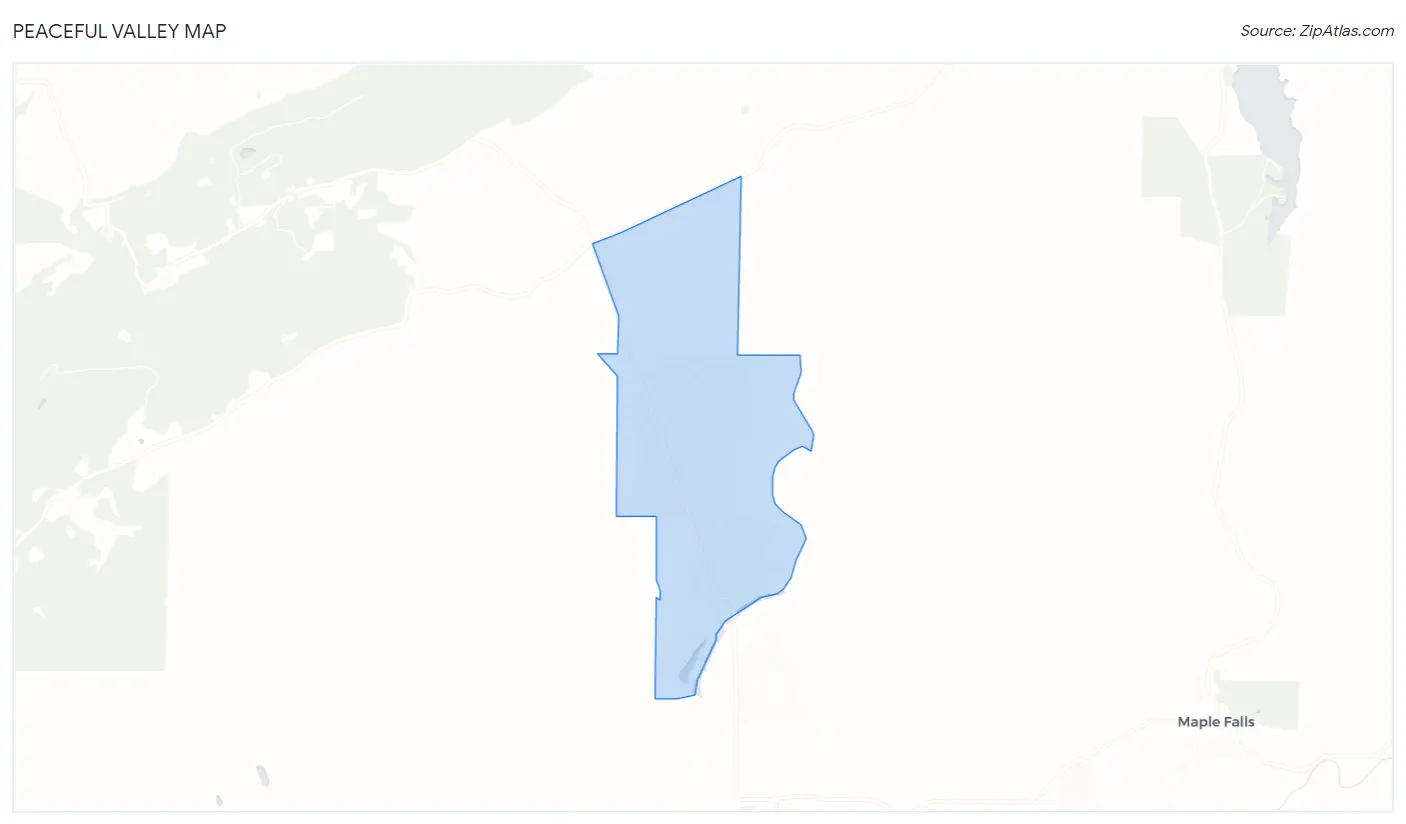
Peaceful Valley Overview
$22,107
PER CAPITA INCOME
$49,831
AVG FAMILY INCOME
$50,845
AVG HOUSEHOLD INCOME
10.6%
WAGE / INCOME GAP [ % ]
89.4¢/ $1
WAGE / INCOME GAP [ $ ]
$8,992
FAMILY INCOME DEFICIT
0.41
INEQUALITY / GINI INDEX
2,715
TOTAL POPULATION
1,602
MALE POPULATION
1,113
FEMALE POPULATION
143.94
MALES / 100 FEMALES
69.48
FEMALES / 100 MALES
41.4
MEDIAN AGE
3.1
AVG FAMILY SIZE
2.6
AVG HOUSEHOLD SIZE
963
LABOR FORCE [ PEOPLE ]
42.2%
PERCENT IN LABOR FORCE
5.2%
UNEMPLOYMENT RATE
Income in Peaceful Valley
Income Overview in Peaceful Valley
Per Capita Income in Peaceful Valley is $22,107, while median incomes of families and households are $49,831 and $50,845 respectively.
| Characteristic | Number | Measure |
| Per Capita Income | 2,715 | $22,107 |
| Median Family Income | 622 | $49,831 |
| Mean Family Income | 622 | $68,529 |
| Median Household Income | 1,036 | $50,845 |
| Mean Household Income | 1,036 | $59,790 |
| Income Deficit | 622 | $8,992 |
| Wage / Income Gap (%) | 2,715 | 10.62% |
| Wage / Income Gap ($) | 2,715 | 89.38¢ per $1 |
| Gini / Inequality Index | 2,715 | 0.41 |
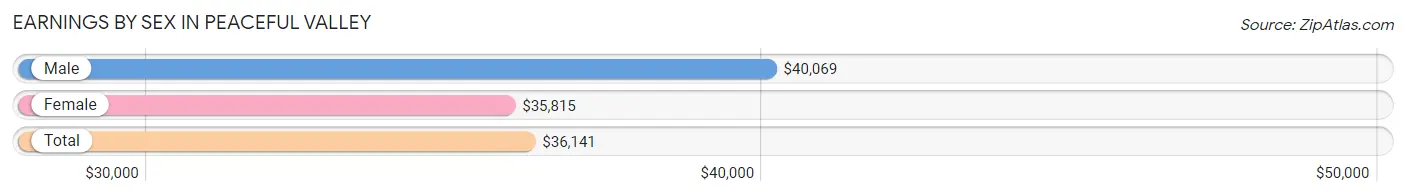
Earnings by Sex in Peaceful Valley
Average Earnings in Peaceful Valley are $36,141, $40,069 for men and $35,815 for women, a difference of 10.6%.
| Sex | Number | Average Earnings |
| Male | 650 (64.7%) | $40,069 |
| Female | 355 (35.3%) | $35,815 |
| Total | 1,005 (100.0%) | $36,141 |
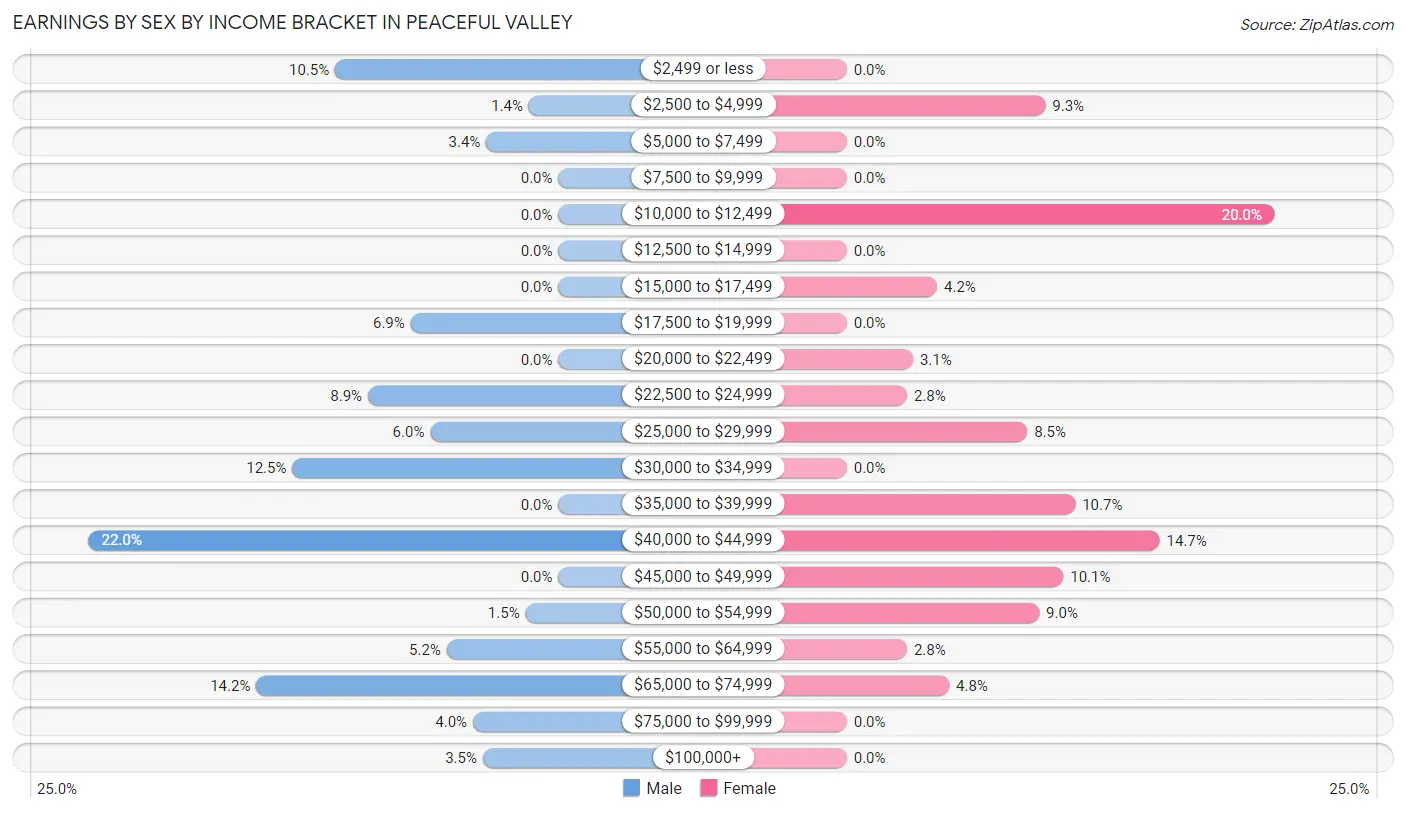
Earnings by Sex by Income Bracket in Peaceful Valley
The most common earnings brackets in Peaceful Valley are $40,000 to $44,999 for men (143 | 22.0%) and $10,000 to $12,499 for women (71 | 20.0%).
| Income | Male | Female |
| $2,499 or less | 68 (10.5%) | 0 (0.0%) |
| $2,500 to $4,999 | 9 (1.4%) | 33 (9.3%) |
| $5,000 to $7,499 | 22 (3.4%) | 0 (0.0%) |
| $7,500 to $9,999 | 0 (0.0%) | 0 (0.0%) |
| $10,000 to $12,499 | 0 (0.0%) | 71 (20.0%) |
| $12,500 to $14,999 | 0 (0.0%) | 0 (0.0%) |
| $15,000 to $17,499 | 0 (0.0%) | 15 (4.2%) |
| $17,500 to $19,999 | 45 (6.9%) | 0 (0.0%) |
| $20,000 to $22,499 | 0 (0.0%) | 11 (3.1%) |
| $22,500 to $24,999 | 58 (8.9%) | 10 (2.8%) |
| $25,000 to $29,999 | 39 (6.0%) | 30 (8.5%) |
| $30,000 to $34,999 | 81 (12.5%) | 0 (0.0%) |
| $35,000 to $39,999 | 0 (0.0%) | 38 (10.7%) |
| $40,000 to $44,999 | 143 (22.0%) | 52 (14.6%) |
| $45,000 to $49,999 | 0 (0.0%) | 36 (10.1%) |
| $50,000 to $54,999 | 10 (1.5%) | 32 (9.0%) |
| $55,000 to $64,999 | 34 (5.2%) | 10 (2.8%) |
| $65,000 to $74,999 | 92 (14.1%) | 17 (4.8%) |
| $75,000 to $99,999 | 26 (4.0%) | 0 (0.0%) |
| $100,000+ | 23 (3.5%) | 0 (0.0%) |
| Total | 650 (100.0%) | 355 (100.0%) |
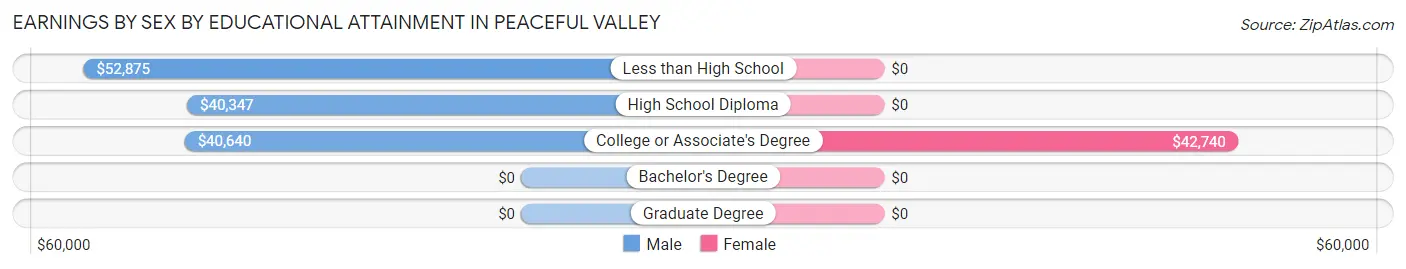
Earnings by Sex by Educational Attainment in Peaceful Valley
Average earnings in Peaceful Valley are $40,861 for men and $42,740 for women, a difference of 4.4%. Men with an educational attainment of less than high school enjoy the highest average annual earnings of $52,875, while those with high school diploma education earn the least with $40,347. Women with an educational attainment of college or associate's degree earn the most with the average annual earnings of $42,740, while those with college or associate's degree education have the smallest earnings of $42,740.
| Educational Attainment | Male Income | Female Income |
| Less than High School | $52,875 | $0 |
| High School Diploma | $40,347 | $0 |
| College or Associate's Degree | $40,640 | $42,740 |
| Bachelor's Degree | - | - |
| Graduate Degree | - | - |
| Total | $40,861 | $42,740 |
Family Income in Peaceful Valley
Family Income Brackets in Peaceful Valley
According to the Peaceful Valley family income data, there are 163 families falling into the $100,000 to $149,999 income range, which is the most common income bracket and makes up 26.2% of all families.
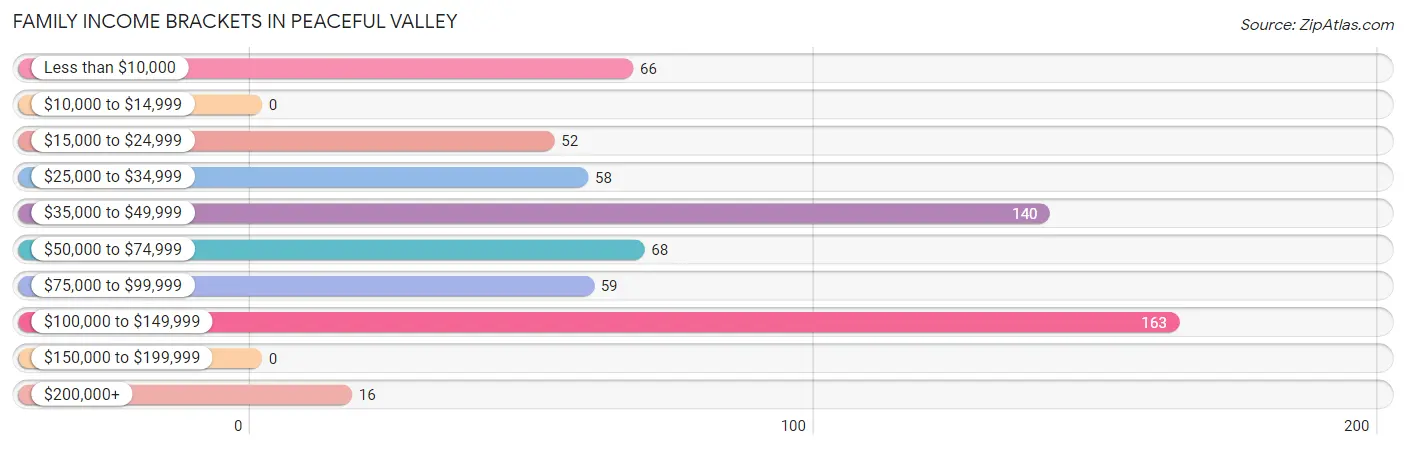
| Income Bracket | # Families | % Families |
| Less than $10,000 | 66 | 10.6% |
| $10,000 to $14,999 | 0 | 0.0% |
| $15,000 to $24,999 | 52 | 8.4% |
| $25,000 to $34,999 | 58 | 9.3% |
| $35,000 to $49,999 | 140 | 22.5% |
| $50,000 to $74,999 | 68 | 10.9% |
| $75,000 to $99,999 | 59 | 9.5% |
| $100,000 to $149,999 | 163 | 26.2% |
| $150,000 to $199,999 | 0 | 0.0% |
| $200,000+ | 16 | 2.6% |
Family Income by Famaliy Size in Peaceful Valley
4-person families (73 | 11.7%) account for the highest median family income in Peaceful Valley with $111,736 per family, while 4-person families (73 | 11.7%) have the highest median income of $27,934 per family member.
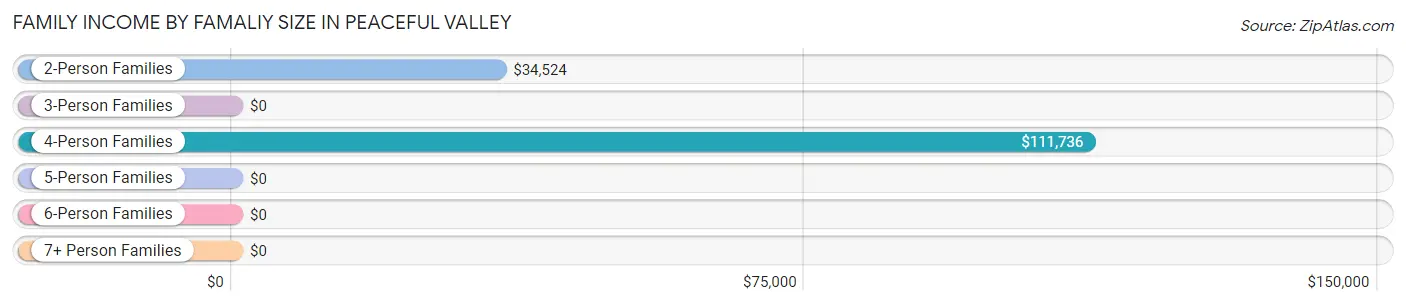
| Income Bracket | # Families | Median Income |
| 2-Person Families | 270 (43.4%) | $34,524 |
| 3-Person Families | 161 (25.9%) | $0 |
| 4-Person Families | 73 (11.7%) | $111,736 |
| 5-Person Families | 102 (16.4%) | $0 |
| 6-Person Families | 16 (2.6%) | $0 |
| 7+ Person Families | 0 (0.0%) | $0 |
| Total | 622 (100.0%) | $49,831 |
Family Income by Number of Earners in Peaceful Valley
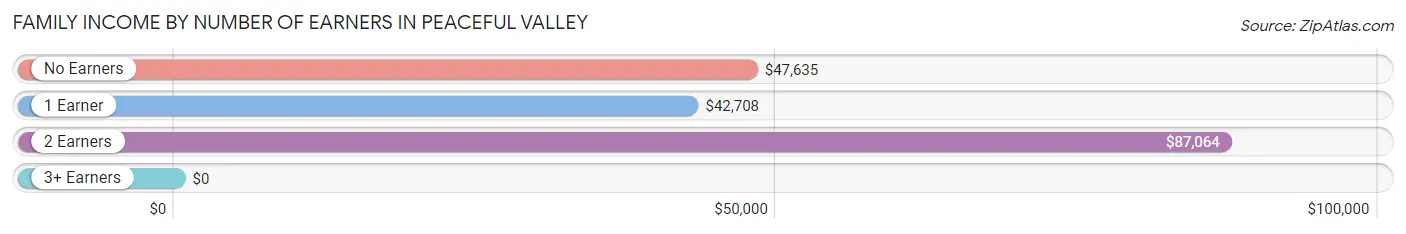
| Number of Earners | # Families | Median Income |
| No Earners | 254 (40.8%) | $47,635 |
| 1 Earner | 174 (28.0%) | $42,708 |
| 2 Earners | 115 (18.5%) | $87,064 |
| 3+ Earners | 79 (12.7%) | $0 |
| Total | 622 (100.0%) | $49,831 |
Household Income in Peaceful Valley
Household Income Brackets in Peaceful Valley
With 215 households falling in the category, the $50,000 to $74,999 income range is the most frequent in Peaceful Valley, accounting for 20.7% of all households.
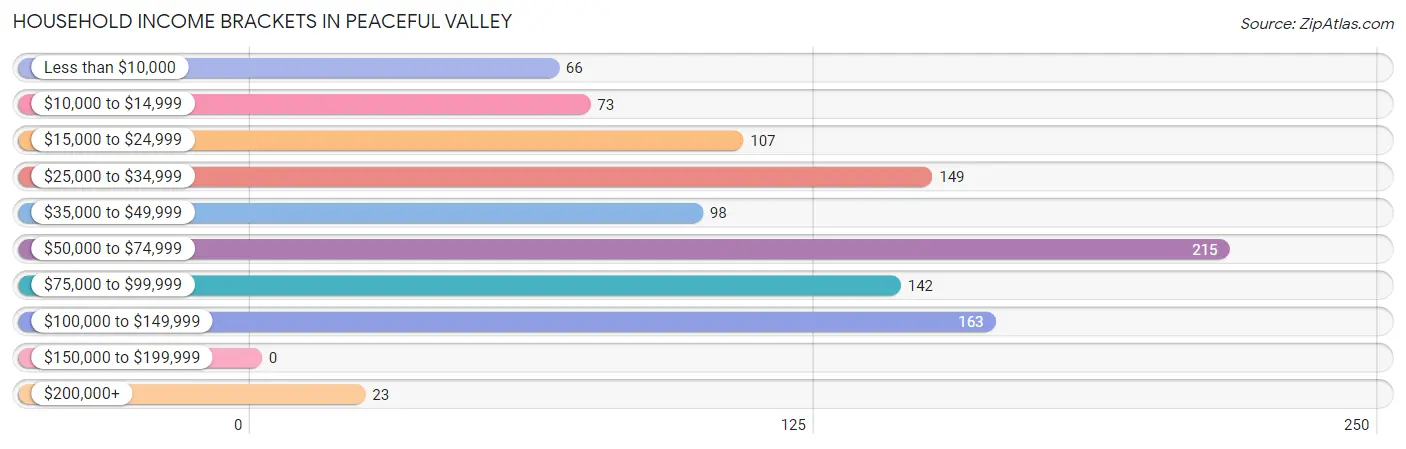
| Income Bracket | # Households | % Households |
| Less than $10,000 | 66 | 6.4% |
| $10,000 to $14,999 | 73 | 7.0% |
| $15,000 to $24,999 | 107 | 10.3% |
| $25,000 to $34,999 | 149 | 14.4% |
| $35,000 to $49,999 | 98 | 9.5% |
| $50,000 to $74,999 | 215 | 20.8% |
| $75,000 to $99,999 | 142 | 13.7% |
| $100,000 to $149,999 | 163 | 15.7% |
| $150,000 to $199,999 | 0 | 0.0% |
| $200,000+ | 23 | 2.2% |
Household Income by Householder Age in Peaceful Valley
The median household income in Peaceful Valley is $50,845, with the highest median household income of $86,453 found in the 25 to 44 years age bracket for the primary householder. A total of 310 households (29.9%) fall into this category. Meanwhile, the 15 to 24 years age bracket for the primary householder has the lowest median household income of $0, with 82 households (7.9%) in this group.
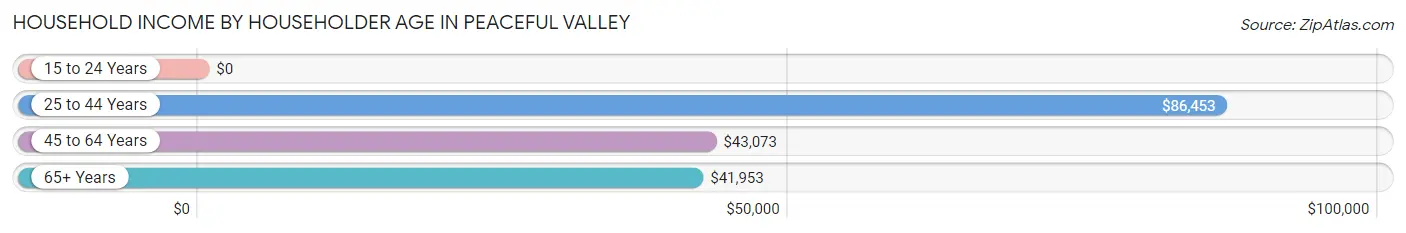
| Income Bracket | # Households | Median Income |
| 15 to 24 Years | 82 (7.9%) | $0 |
| 25 to 44 Years | 310 (29.9%) | $86,453 |
| 45 to 64 Years | 287 (27.7%) | $43,073 |
| 65+ Years | 357 (34.5%) | $41,953 |
| Total | 1,036 (100.0%) | $50,845 |
Poverty in Peaceful Valley
Income Below Poverty by Sex and Age in Peaceful Valley
With 23.6% poverty level for males and 33.2% for females among the residents of Peaceful Valley, 12 to 14 year old males and 75 year old and over females are the most vulnerable to poverty, with 30 males (73.2%) and 35 females (71.4%) in their respective age groups living below the poverty level.
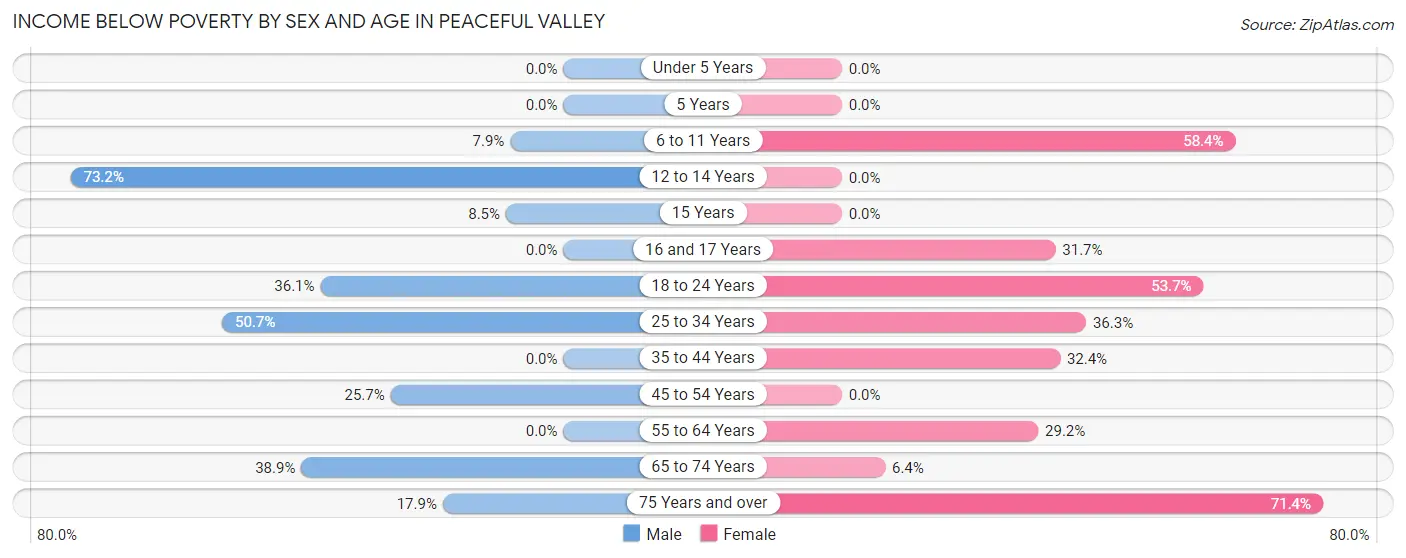
| Age Bracket | Male | Female |
| Under 5 Years | 0 (0.0%) | 0 (0.0%) |
| 5 Years | 0 (0.0%) | 0 (0.0%) |
| 6 to 11 Years | 9 (7.9%) | 59 (58.4%) |
| 12 to 14 Years | 30 (73.2%) | 0 (0.0%) |
| 15 Years | 7 (8.5%) | 0 (0.0%) |
| 16 and 17 Years | 0 (0.0%) | 13 (31.7%) |
| 18 to 24 Years | 57 (36.1%) | 80 (53.7%) |
| 25 to 34 Years | 113 (50.7%) | 33 (36.3%) |
| 35 to 44 Years | 0 (0.0%) | 80 (32.4%) |
| 45 to 54 Years | 68 (25.7%) | 0 (0.0%) |
| 55 to 64 Years | 0 (0.0%) | 58 (29.1%) |
| 65 to 74 Years | 79 (38.9%) | 12 (6.4%) |
| 75 Years and over | 12 (17.9%) | 35 (71.4%) |
| Total | 375 (23.6%) | 370 (33.2%) |
Income Above Poverty by Sex and Age in Peaceful Valley
According to the poverty statistics in Peaceful Valley, males aged under 5 years and females aged 12 to 14 years are the age groups that are most secure financially, with 100.0% of males and 100.0% of females in these age groups living above the poverty line.
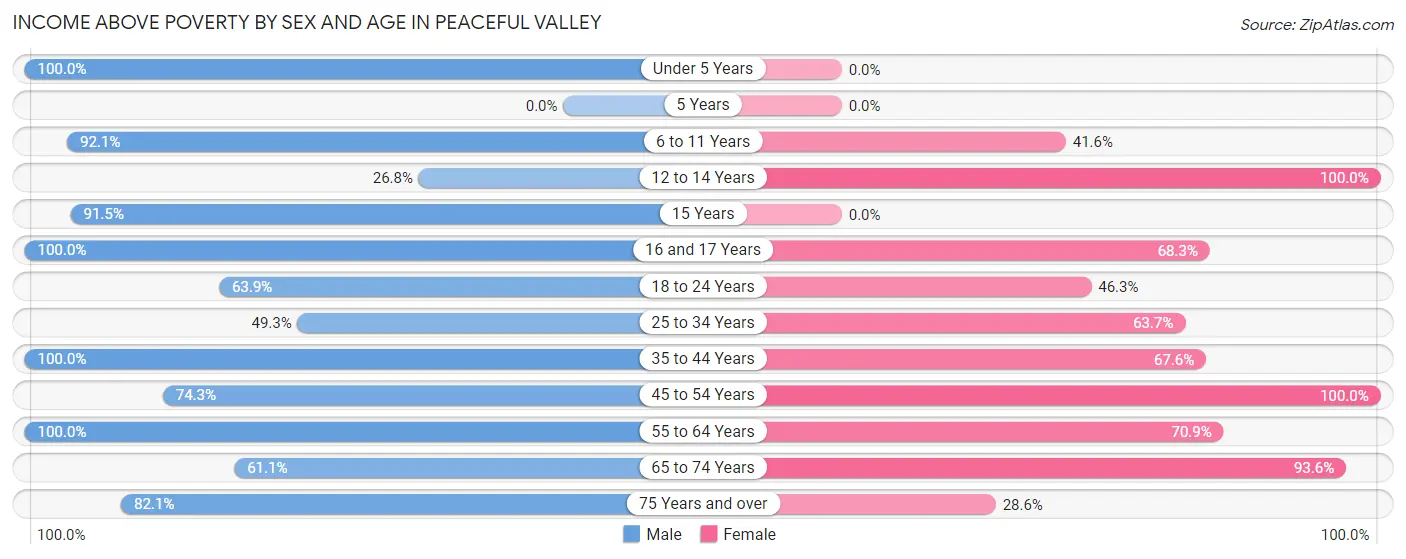
| Age Bracket | Male | Female |
| Under 5 Years | 73 (100.0%) | 0 (0.0%) |
| 5 Years | 0 (0.0%) | 0 (0.0%) |
| 6 to 11 Years | 105 (92.1%) | 42 (41.6%) |
| 12 to 14 Years | 11 (26.8%) | 11 (100.0%) |
| 15 Years | 75 (91.5%) | 0 (0.0%) |
| 16 and 17 Years | 66 (100.0%) | 28 (68.3%) |
| 18 to 24 Years | 101 (63.9%) | 69 (46.3%) |
| 25 to 34 Years | 110 (49.3%) | 58 (63.7%) |
| 35 to 44 Years | 172 (100.0%) | 167 (67.6%) |
| 45 to 54 Years | 197 (74.3%) | 38 (100.0%) |
| 55 to 64 Years | 128 (100.0%) | 141 (70.9%) |
| 65 to 74 Years | 124 (61.1%) | 175 (93.6%) |
| 75 Years and over | 55 (82.1%) | 14 (28.6%) |
| Total | 1,217 (76.4%) | 743 (66.8%) |
Income Below Poverty Among Married-Couple Families in Peaceful Valley
The poverty statistics for married-couple families in Peaceful Valley show that 23.6% or 90 of the total 381 families live below the poverty line. Families with 3 or 4 children have the highest poverty rate of 62.8%, comprising of 27 families. On the other hand, families with 1 or 2 children have the lowest poverty rate of 0.0%, which includes 0 families.
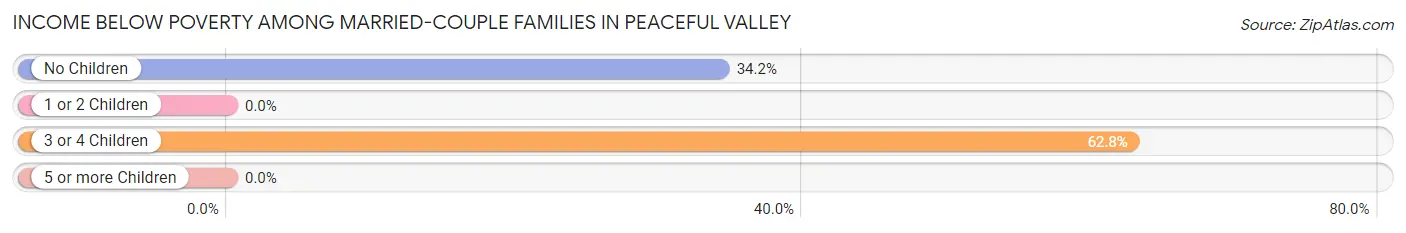
| Children | Above Poverty | Below Poverty |
| No Children | 121 (65.8%) | 63 (34.2%) |
| 1 or 2 Children | 154 (100.0%) | 0 (0.0%) |
| 3 or 4 Children | 16 (37.2%) | 27 (62.8%) |
| 5 or more Children | 0 (0.0%) | 0 (0.0%) |
| Total | 291 (76.4%) | 90 (23.6%) |
Income Below Poverty Among Single-Parent Households in Peaceful Valley
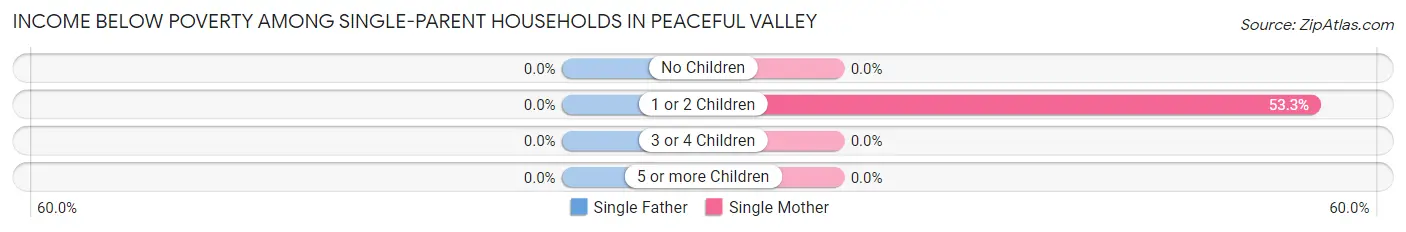
| Children | Single Father | Single Mother |
| No Children | 0 (0.0%) | 0 (0.0%) |
| 1 or 2 Children | 0 (0.0%) | 24 (53.3%) |
| 3 or 4 Children | 0 (0.0%) | 0 (0.0%) |
| 5 or more Children | 0 (0.0%) | 0 (0.0%) |
| Total | 0 (0.0%) | 24 (17.1%) |
Income Below Poverty Among Married-Couple vs Single-Parent Households in Peaceful Valley
The poverty data for Peaceful Valley shows that 90 of the married-couple family households (23.6%) and 24 of the single-parent households (10.0%) are living below the poverty level. Within the married-couple family households, those with 3 or 4 children have the highest poverty rate, with 27 households (62.8%) falling below the poverty line. Among the single-parent households, those with 1 or 2 children have the highest poverty rate, with 24 household (34.3%) living below poverty.
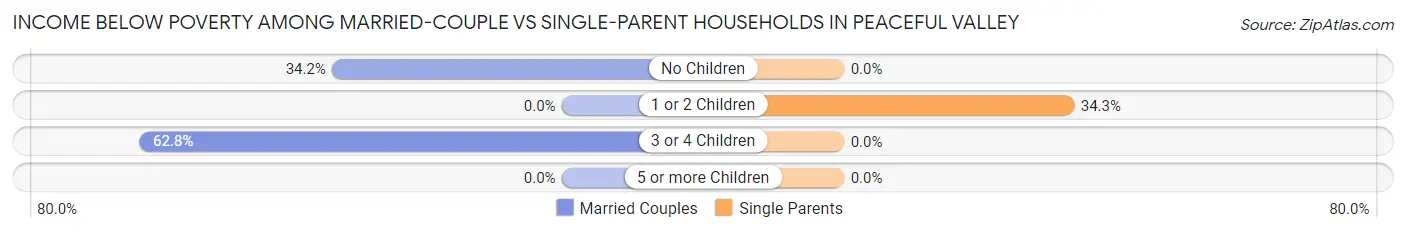
| Children | Married-Couple Families | Single-Parent Households |
| No Children | 63 (34.2%) | 0 (0.0%) |
| 1 or 2 Children | 0 (0.0%) | 24 (34.3%) |
| 3 or 4 Children | 27 (62.8%) | 0 (0.0%) |
| 5 or more Children | 0 (0.0%) | 0 (0.0%) |
| Total | 90 (23.6%) | 24 (10.0%) |
Race in Peaceful Valley
The most populous races in Peaceful Valley are White / Caucasian (2,333 | 85.9%), Two or more Races (152 | 5.6%), and Asian (117 | 4.3%).
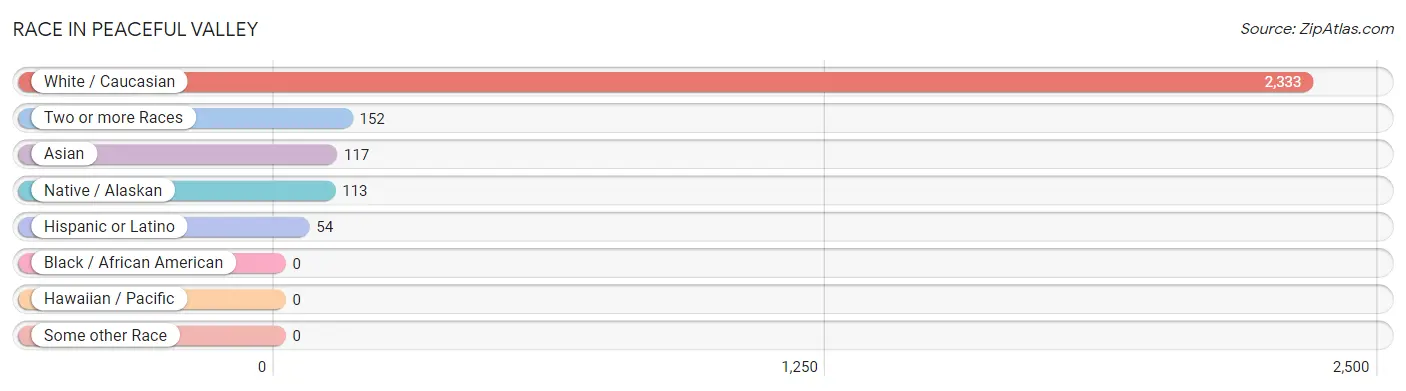
| Race | # Population | % Population |
| Asian | 117 | 4.3% |
| Black / African American | 0 | 0.0% |
| Hawaiian / Pacific | 0 | 0.0% |
| Hispanic or Latino | 54 | 2.0% |
| Native / Alaskan | 113 | 4.2% |
| White / Caucasian | 2,333 | 85.9% |
| Two or more Races | 152 | 5.6% |
| Some other Race | 0 | 0.0% |
| Total | 2,715 | 100.0% |
Ancestry in Peaceful Valley
The most populous ancestries reported in Peaceful Valley are German (498 | 18.3%), Dutch (369 | 13.6%), Irish (307 | 11.3%), English (231 | 8.5%), and European (103 | 3.8%), together accounting for 55.5% of all Peaceful Valley residents.
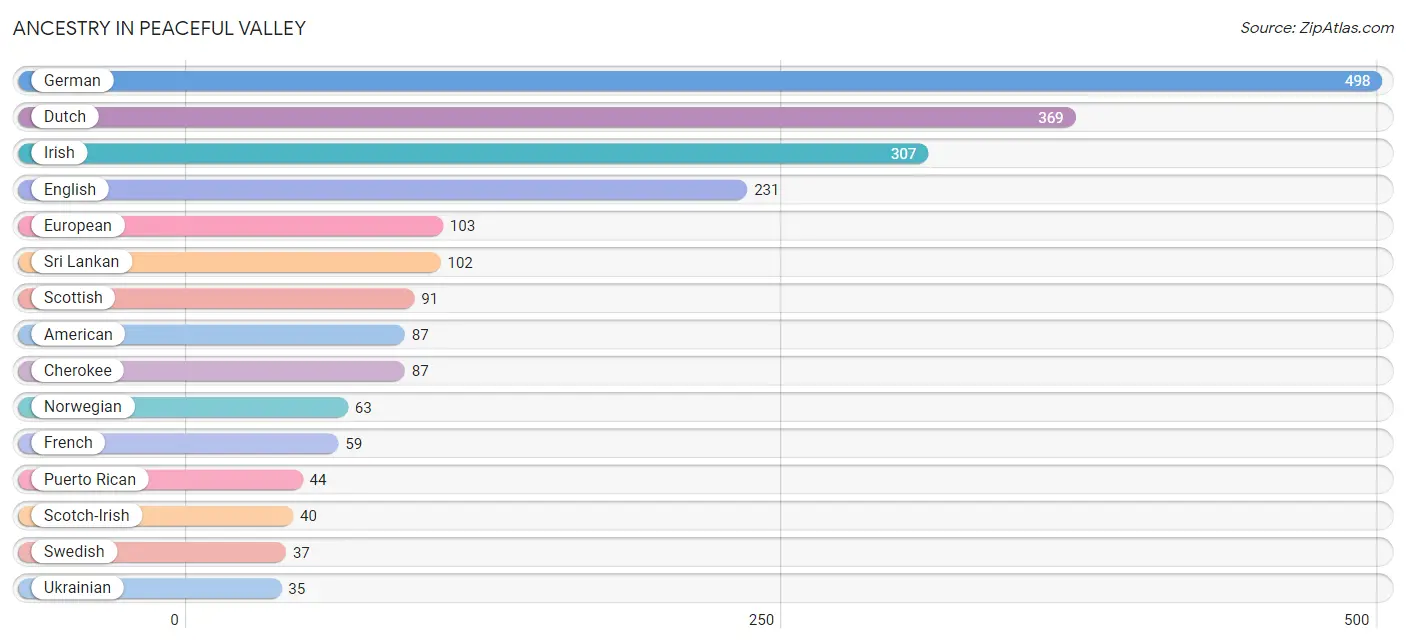
| Ancestry | # Population | % Population |
| Alaskan Athabascan | 9 | 0.3% |
| American | 87 | 3.2% |
| Bhutanese | 10 | 0.4% |
| Blackfeet | 20 | 0.7% |
| British | 23 | 0.9% |
| Cherokee | 87 | 3.2% |
| Chilean | 10 | 0.4% |
| Czechoslovakian | 30 | 1.1% |
| Dutch | 369 | 13.6% |
| English | 231 | 8.5% |
| European | 103 | 3.8% |
| Finnish | 29 | 1.1% |
| French | 59 | 2.2% |
| German | 498 | 18.3% |
| Irish | 307 | 11.3% |
| Italian | 26 | 1.0% |
| Norwegian | 63 | 2.3% |
| Polish | 22 | 0.8% |
| Puerto Rican | 44 | 1.6% |
| Russian | 7 | 0.3% |
| Scotch-Irish | 40 | 1.5% |
| Scottish | 91 | 3.4% |
| South American | 10 | 0.4% |
| Sri Lankan | 102 | 3.8% |
| Swedish | 37 | 1.4% |
| Tlingit-Haida | 15 | 0.5% |
| Ukrainian | 35 | 1.3% | View All 27 Rows |
Immigrants in Peaceful Valley
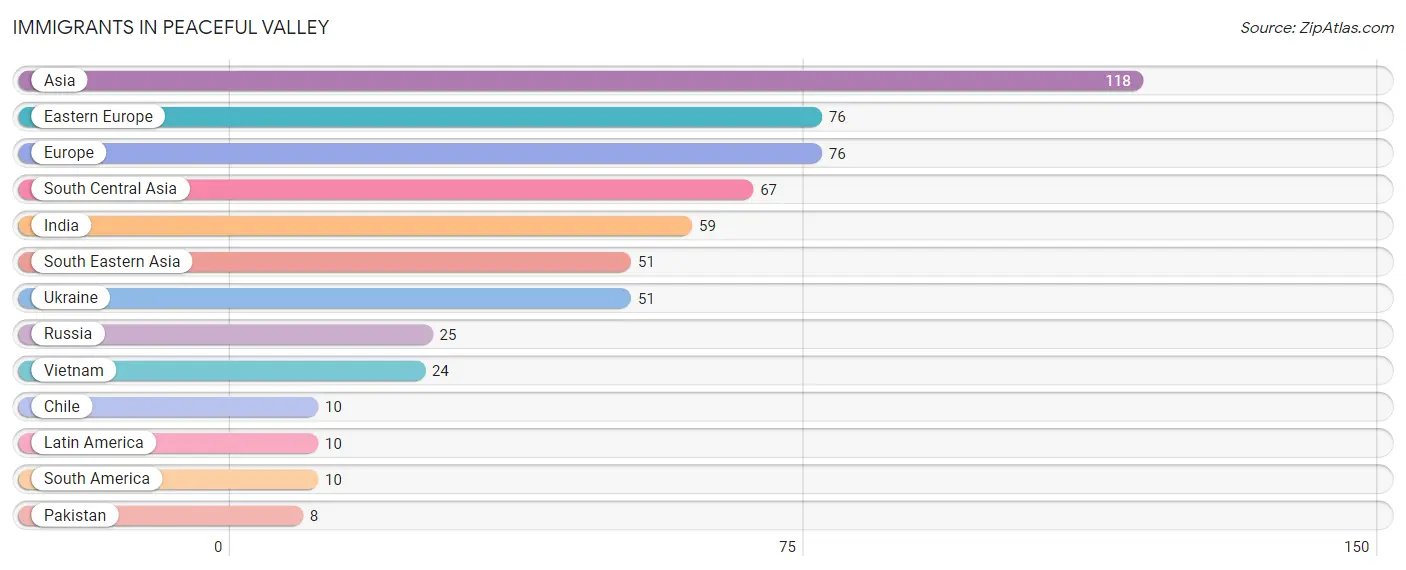
The most numerous immigrant groups reported in Peaceful Valley came from Asia (118 | 4.3%), Eastern Europe (76 | 2.8%), Europe (76 | 2.8%), South Central Asia (67 | 2.5%), and India (59 | 2.2%), together accounting for 14.6% of all Peaceful Valley residents.
| Immigration Origin | # Population | % Population |
| Asia | 118 | 4.3% |
| Chile | 10 | 0.4% |
| Eastern Europe | 76 | 2.8% |
| Europe | 76 | 2.8% |
| India | 59 | 2.2% |
| Latin America | 10 | 0.4% |
| Pakistan | 8 | 0.3% |
| Russia | 25 | 0.9% |
| South America | 10 | 0.4% |
| South Central Asia | 67 | 2.5% |
| South Eastern Asia | 51 | 1.9% |
| Ukraine | 51 | 1.9% |
| Vietnam | 24 | 0.9% | View All 13 Rows |
Sex and Age in Peaceful Valley
Sex and Age in Peaceful Valley
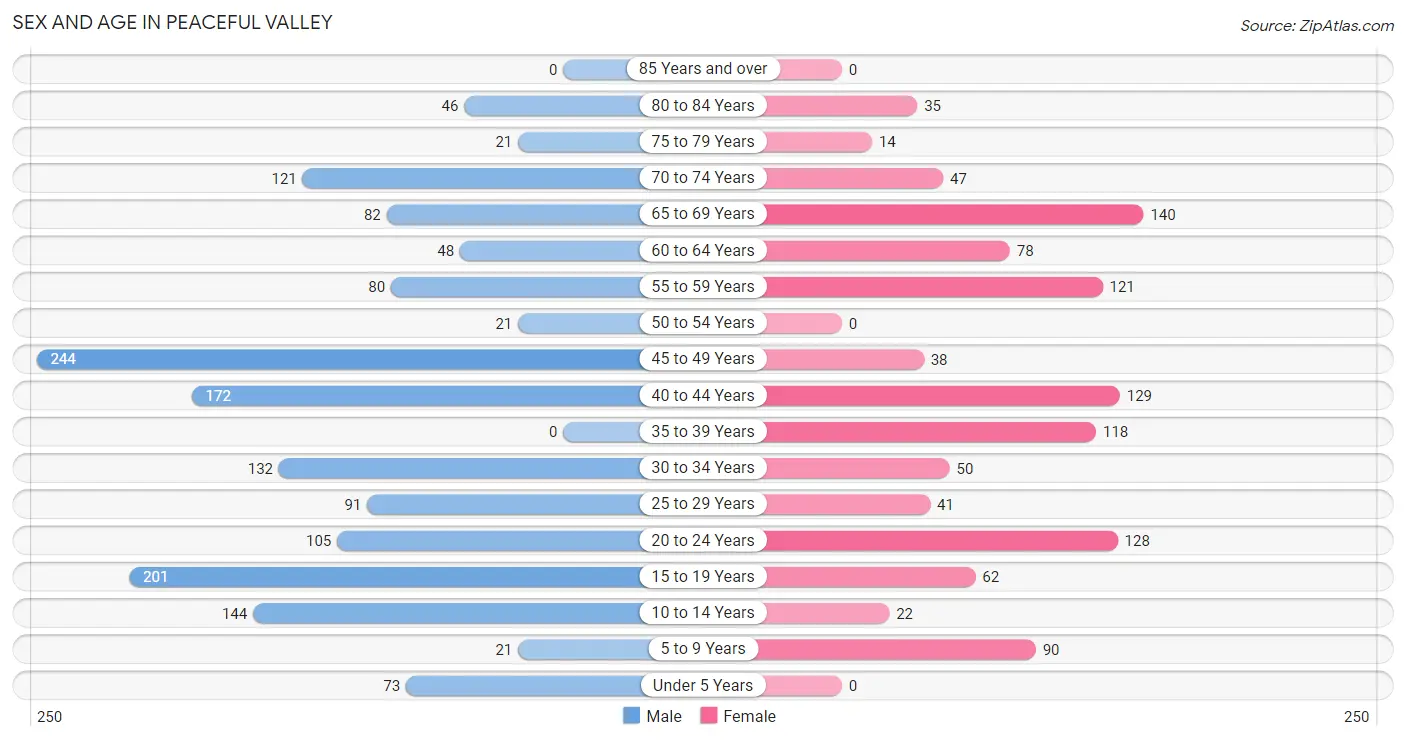
The most populous age groups in Peaceful Valley are 45 to 49 Years (244 | 15.2%) for men and 65 to 69 Years (140 | 12.6%) for women.
| Age Bracket | Male | Female |
| Under 5 Years | 73 (4.6%) | 0 (0.0%) |
| 5 to 9 Years | 21 (1.3%) | 90 (8.1%) |
| 10 to 14 Years | 144 (9.0%) | 22 (2.0%) |
| 15 to 19 Years | 201 (12.6%) | 62 (5.6%) |
| 20 to 24 Years | 105 (6.6%) | 128 (11.5%) |
| 25 to 29 Years | 91 (5.7%) | 41 (3.7%) |
| 30 to 34 Years | 132 (8.2%) | 50 (4.5%) |
| 35 to 39 Years | 0 (0.0%) | 118 (10.6%) |
| 40 to 44 Years | 172 (10.7%) | 129 (11.6%) |
| 45 to 49 Years | 244 (15.2%) | 38 (3.4%) |
| 50 to 54 Years | 21 (1.3%) | 0 (0.0%) |
| 55 to 59 Years | 80 (5.0%) | 121 (10.9%) |
| 60 to 64 Years | 48 (3.0%) | 78 (7.0%) |
| 65 to 69 Years | 82 (5.1%) | 140 (12.6%) |
| 70 to 74 Years | 121 (7.5%) | 47 (4.2%) |
| 75 to 79 Years | 21 (1.3%) | 14 (1.3%) |
| 80 to 84 Years | 46 (2.9%) | 35 (3.1%) |
| 85 Years and over | 0 (0.0%) | 0 (0.0%) |
| Total | 1,602 (100.0%) | 1,113 (100.0%) |
Families and Households in Peaceful Valley
Median Family Size in Peaceful Valley
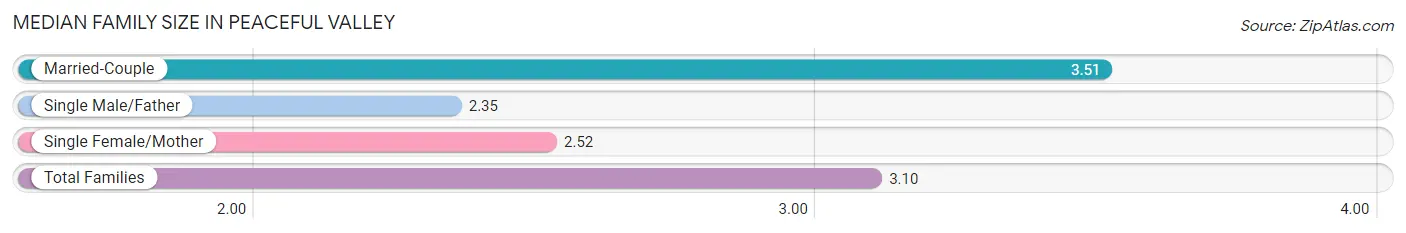
The median family size in Peaceful Valley is 3.10 persons per family, with married-couple families (381 | 61.3%) accounting for the largest median family size of 3.51 persons per family. On the other hand, single male/father families (101 | 16.2%) represent the smallest median family size with 2.35 persons per family.
| Family Type | # Families | Family Size |
| Married-Couple | 381 (61.3%) | 3.51 |
| Single Male/Father | 101 (16.2%) | 2.35 |
| Single Female/Mother | 140 (22.5%) | 2.52 |
| Total Families | 622 (100.0%) | 3.10 |
Median Household Size in Peaceful Valley
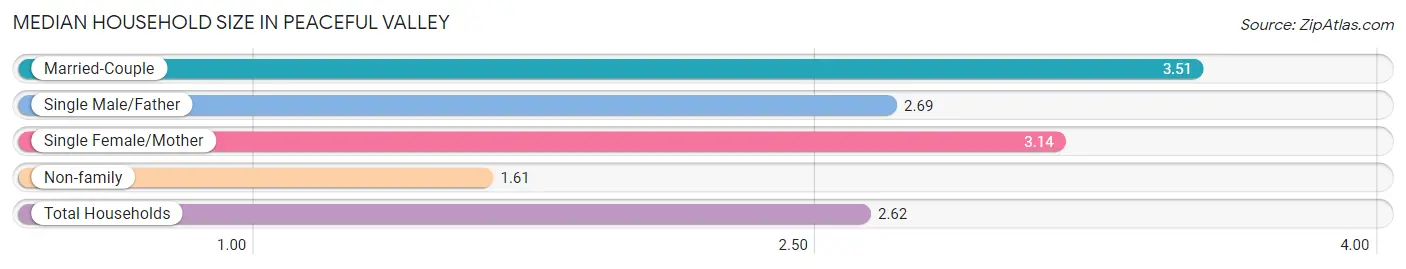
The median household size in Peaceful Valley is 2.62 persons per household, with married-couple households (381 | 36.8%) accounting for the largest median household size of 3.51 persons per household. non-family households (414 | 40.0%) represent the smallest median household size with 1.61 persons per household.
| Household Type | # Households | Household Size |
| Married-Couple | 381 (36.8%) | 3.51 |
| Single Male/Father | 101 (9.8%) | 2.69 |
| Single Female/Mother | 140 (13.5%) | 3.14 |
| Non-family | 414 (40.0%) | 1.61 |
| Total Households | 1,036 (100.0%) | 2.62 |
Household Size by Marriage Status in Peaceful Valley
Out of a total of 1,036 households in Peaceful Valley, 622 (60.0%) are family households, while 414 (40.0%) are nonfamily households. The most numerous type of family households are 2-person households, comprising 234, and the most common type of nonfamily households are 1-person households, comprising 289.
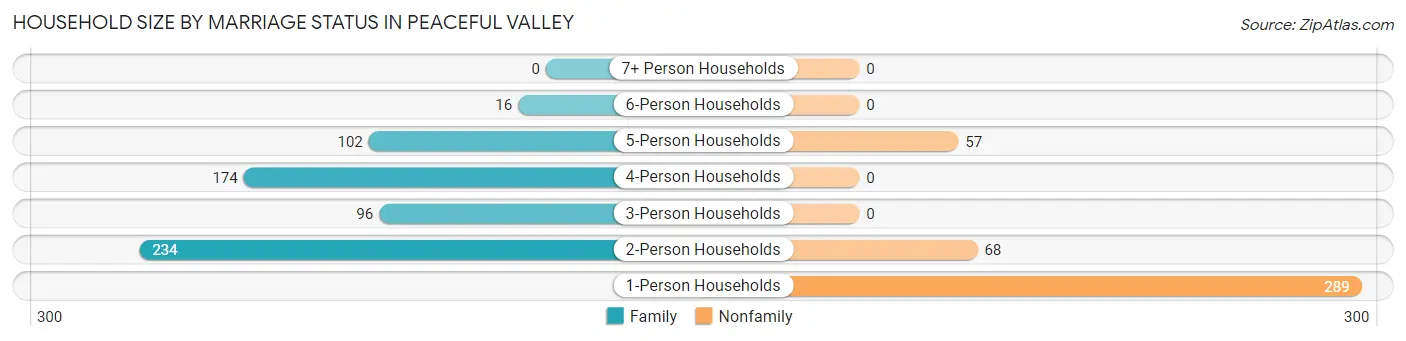
| Household Size | Family Households | Nonfamily Households |
| 1-Person Households | - | 289 (27.9%) |
| 2-Person Households | 234 (22.6%) | 68 (6.6%) |
| 3-Person Households | 96 (9.3%) | 0 (0.0%) |
| 4-Person Households | 174 (16.8%) | 0 (0.0%) |
| 5-Person Households | 102 (9.9%) | 57 (5.5%) |
| 6-Person Households | 16 (1.5%) | 0 (0.0%) |
| 7+ Person Households | 0 (0.0%) | 0 (0.0%) |
| Total | 622 (60.0%) | 414 (40.0%) |
Female Fertility in Peaceful Valley
Fertility by Age in Peaceful Valley
| Age Bracket | Women with Births | Births / 1,000 Women |
| 15 to 19 years | 0 (0.0%) | 0.0 |
| 20 to 34 years | 0 (0.0%) | 0.0 |
| 35 to 50 years | 0 (0.0%) | 0.0 |
| Total | 0 (0.0%) | 0.0 |
Fertility by Age by Marriage Status in Peaceful Valley
| Age Bracket | Married | Unmarried |
| 15 to 19 years | 0 (0.0%) | 0 (0.0%) |
| 20 to 34 years | 0 (0.0%) | 0 (0.0%) |
| 35 to 50 years | 0 (0.0%) | 0 (0.0%) |
| Total | 0 (0.0%) | 0 (0.0%) |
Fertility by Education in Peaceful Valley
| Educational Attainment | Women with Births | Births / 1,000 Women |
| Less than High School | 0 (0.0%) | 0.0 |
| High School Diploma | 0 (0.0%) | 0.0 |
| College or Associate's Degree | 0 (0.0%) | 0.0 |
| Bachelor's Degree | 0 (0.0%) | 0.0 |
| Graduate Degree | 0 (0.0%) | 0.0 |
| Total | 0 (0.0%) | 0.0 |
Fertility by Education by Marriage Status in Peaceful Valley
| Educational Attainment | Married | Unmarried |
| Less than High School | 0 (0.0%) | 0 (0.0%) |
| High School Diploma | 0 (0.0%) | 0 (0.0%) |
| College or Associate's Degree | 0 (0.0%) | 0 (0.0%) |
| Bachelor's Degree | 0 (0.0%) | 0 (0.0%) |
| Graduate Degree | 0 (0.0%) | 0 (0.0%) |
| Total | 0 (0.0%) | 0 (0.0%) |
Employment Characteristics in Peaceful Valley
Employment by Class of Employer in Peaceful Valley
Among the 913 employed individuals in Peaceful Valley, private company employees (687 | 75.2%), not-for-profit organizations (137 | 15.0%), and self-employed (not incorporated) (51 | 5.6%) make up the most common classes of employment.
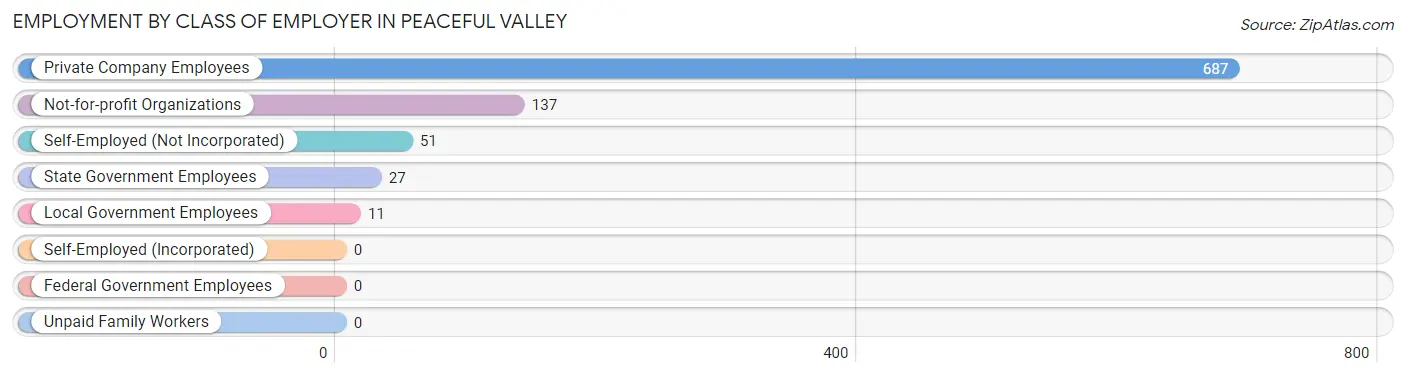
| Employer Class | # Employees | % Employees |
| Private Company Employees | 687 | 75.2% |
| Self-Employed (Incorporated) | 0 | 0.0% |
| Self-Employed (Not Incorporated) | 51 | 5.6% |
| Not-for-profit Organizations | 137 | 15.0% |
| Local Government Employees | 11 | 1.2% |
| State Government Employees | 27 | 3.0% |
| Federal Government Employees | 0 | 0.0% |
| Unpaid Family Workers | 0 | 0.0% |
| Total | 913 | 100.0% |
Employment Status by Age in Peaceful Valley
According to the labor force statistics for Peaceful Valley, out of the total population over 16 years of age (2,283), 42.2% or 963 individuals are in the labor force, with 5.2% or 50 of them unemployed. The age group with the highest labor force participation rate is 25 to 29 years, with 100.0% or 132 individuals in the labor force. Within the labor force, the 16 to 19 years age range has the highest percentage of unemployed individuals, with 48.5% or 50 of them being unemployed.
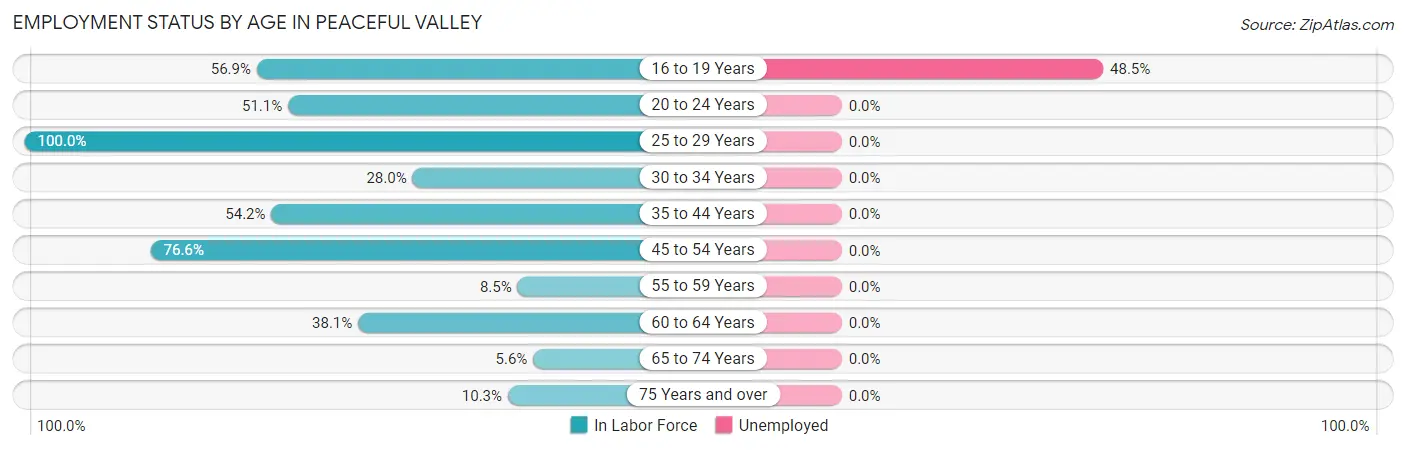
| Age Bracket | In Labor Force | Unemployed |
| 16 to 19 Years | 103 (56.9%) | 50 (48.5%) |
| 20 to 24 Years | 119 (51.1%) | 0 (0.0%) |
| 25 to 29 Years | 132 (100.0%) | 0 (0.0%) |
| 30 to 34 Years | 51 (28.0%) | 0 (0.0%) |
| 35 to 44 Years | 227 (54.2%) | 0 (0.0%) |
| 45 to 54 Years | 232 (76.6%) | 0 (0.0%) |
| 55 to 59 Years | 17 (8.5%) | 0 (0.0%) |
| 60 to 64 Years | 48 (38.1%) | 0 (0.0%) |
| 65 to 74 Years | 22 (5.6%) | 0 (0.0%) |
| 75 Years and over | 12 (10.3%) | 0 (0.0%) |
| Total | 963 (42.2%) | 50 (5.2%) |
Employment Status by Educational Attainment in Peaceful Valley
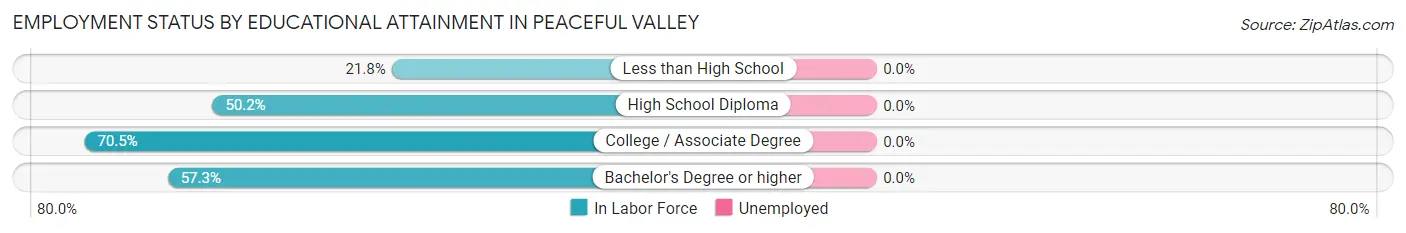
| Educational Attainment | In Labor Force | Unemployed |
| Less than High School | 57 (21.8%) | 0 (0.0%) |
| High School Diploma | 280 (50.2%) | 0 (0.0%) |
| College / Associate Degree | 315 (70.5%) | 0 (0.0%) |
| Bachelor's Degree or higher | 55 (57.3%) | 0 (0.0%) |
| Total | 707 (51.9%) | 0 (0.0%) |
Employment Occupations by Sex in Peaceful Valley
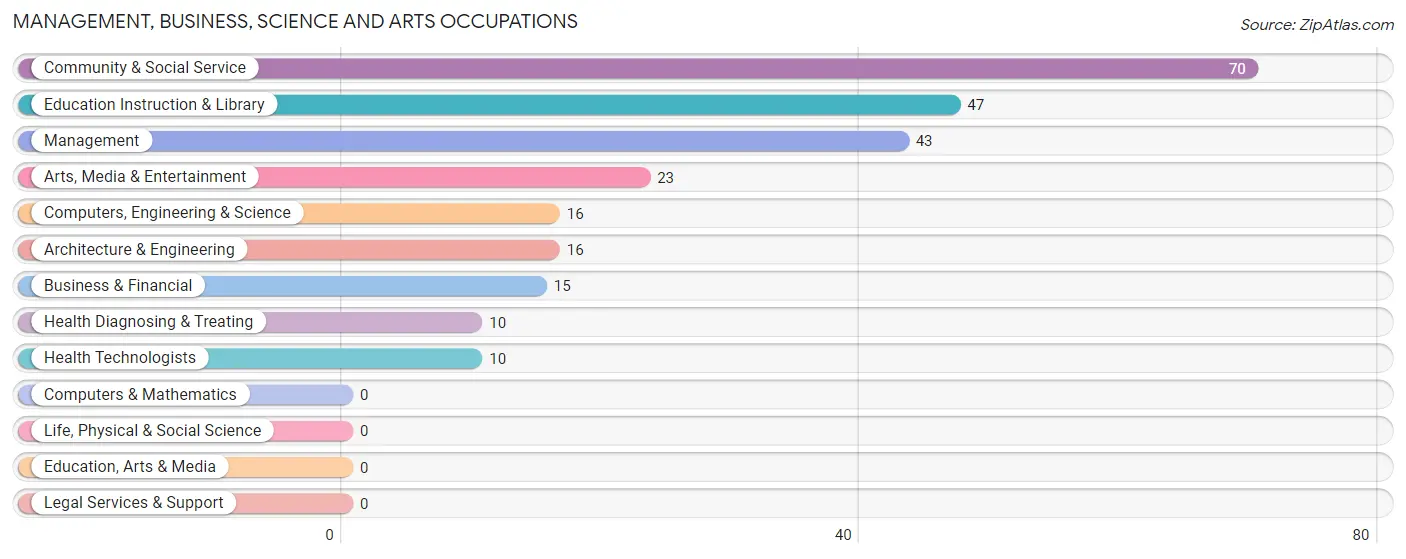
Management, Business, Science and Arts Occupations
The most common Management, Business, Science and Arts occupations in Peaceful Valley are Community & Social Service (70 | 7.7%), Education Instruction & Library (47 | 5.1%), Management (43 | 4.7%), Arts, Media & Entertainment (23 | 2.5%), and Computers, Engineering & Science (16 | 1.8%).
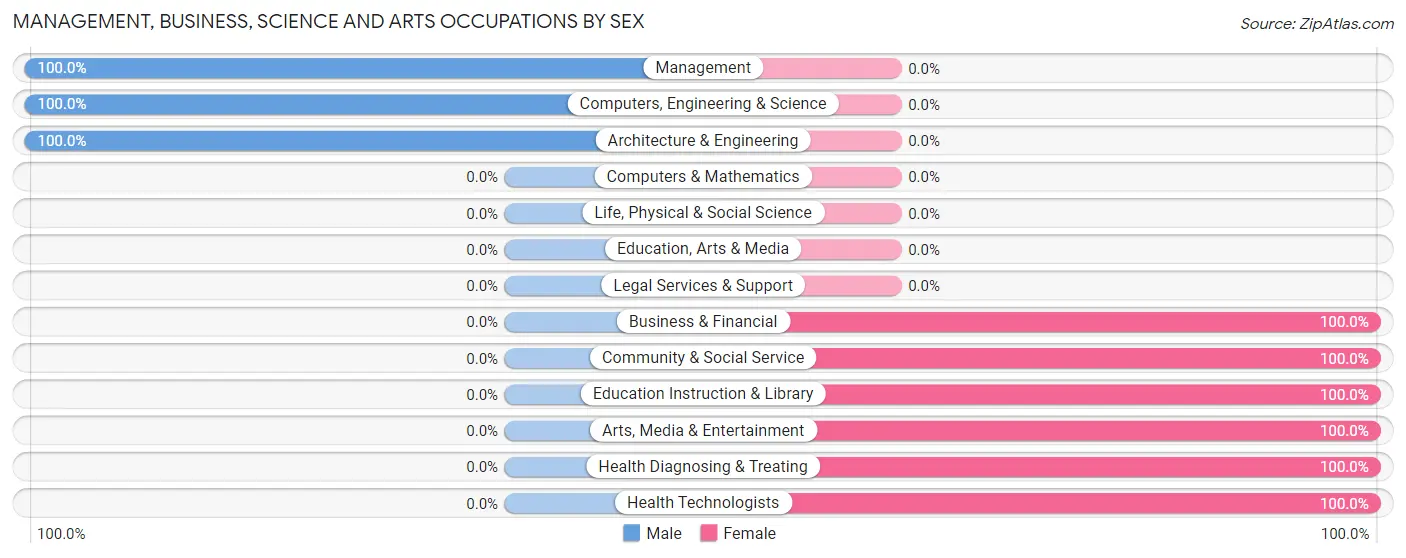
Management, Business, Science and Arts Occupations by Sex
Within the Management, Business, Science and Arts occupations in Peaceful Valley, the most male-oriented occupations are Management (100.0%), Computers, Engineering & Science (100.0%), and Architecture & Engineering (100.0%), while the most female-oriented occupations are Business & Financial (100.0%), Community & Social Service (100.0%), and Education Instruction & Library (100.0%).
| Occupation | Male | Female |
| Management | 43 (100.0%) | 0 (0.0%) |
| Business & Financial | 0 (0.0%) | 15 (100.0%) |
| Computers, Engineering & Science | 16 (100.0%) | 0 (0.0%) |
| Computers & Mathematics | 0 (0.0%) | 0 (0.0%) |
| Architecture & Engineering | 16 (100.0%) | 0 (0.0%) |
| Life, Physical & Social Science | 0 (0.0%) | 0 (0.0%) |
| Community & Social Service | 0 (0.0%) | 70 (100.0%) |
| Education, Arts & Media | 0 (0.0%) | 0 (0.0%) |
| Legal Services & Support | 0 (0.0%) | 0 (0.0%) |
| Education Instruction & Library | 0 (0.0%) | 47 (100.0%) |
| Arts, Media & Entertainment | 0 (0.0%) | 23 (100.0%) |
| Health Diagnosing & Treating | 0 (0.0%) | 10 (100.0%) |
| Health Technologists | 0 (0.0%) | 10 (100.0%) |
| Total (Category) | 59 (38.3%) | 95 (61.7%) |
| Total (Overall) | 591 (64.7%) | 322 (35.3%) |
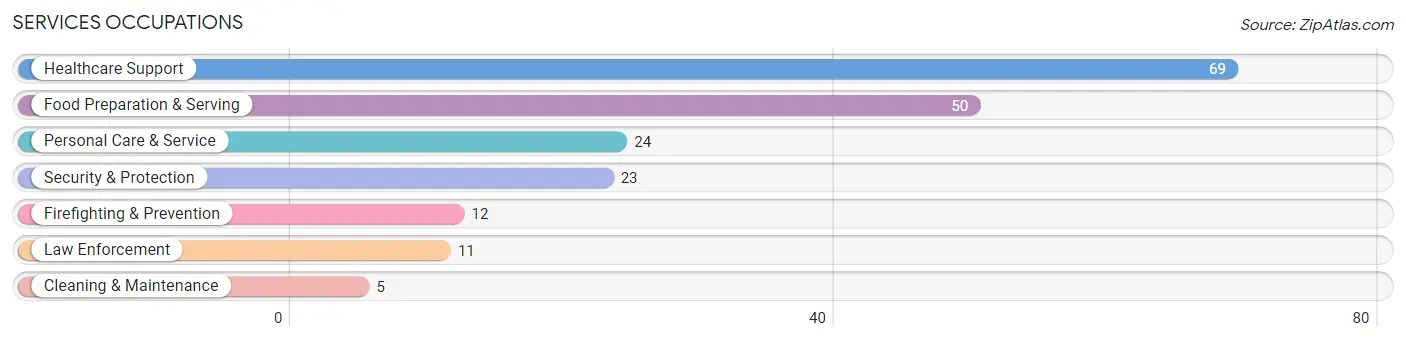
Services Occupations
The most common Services occupations in Peaceful Valley are Healthcare Support (69 | 7.6%), Food Preparation & Serving (50 | 5.5%), Personal Care & Service (24 | 2.6%), Security & Protection (23 | 2.5%), and Firefighting & Prevention (12 | 1.3%).
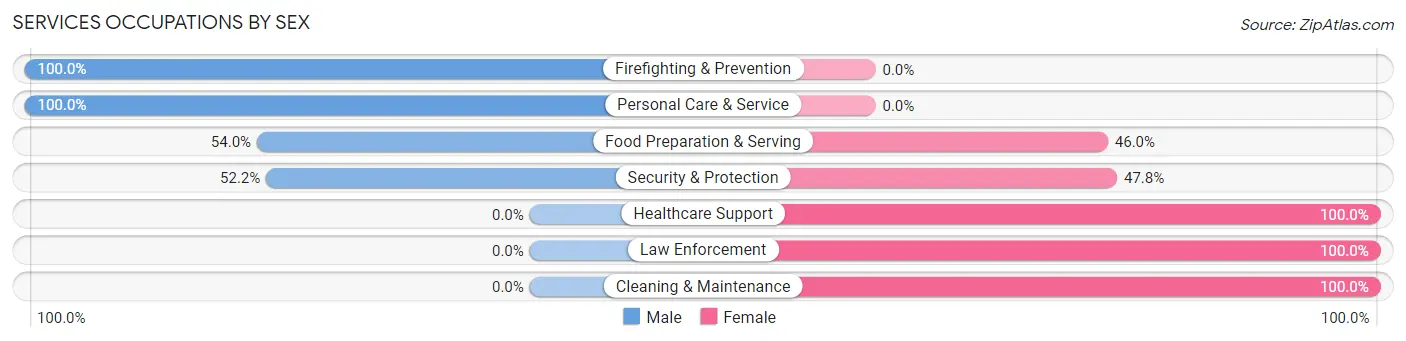
Services Occupations by Sex
Within the Services occupations in Peaceful Valley, the most male-oriented occupations are Firefighting & Prevention (100.0%), Personal Care & Service (100.0%), and Food Preparation & Serving (54.0%), while the most female-oriented occupations are Healthcare Support (100.0%), Law Enforcement (100.0%), and Cleaning & Maintenance (100.0%).
| Occupation | Male | Female |
| Healthcare Support | 0 (0.0%) | 69 (100.0%) |
| Security & Protection | 12 (52.2%) | 11 (47.8%) |
| Firefighting & Prevention | 12 (100.0%) | 0 (0.0%) |
| Law Enforcement | 0 (0.0%) | 11 (100.0%) |
| Food Preparation & Serving | 27 (54.0%) | 23 (46.0%) |
| Cleaning & Maintenance | 0 (0.0%) | 5 (100.0%) |
| Personal Care & Service | 24 (100.0%) | 0 (0.0%) |
| Total (Category) | 63 (36.8%) | 108 (63.2%) |
| Total (Overall) | 591 (64.7%) | 322 (35.3%) |
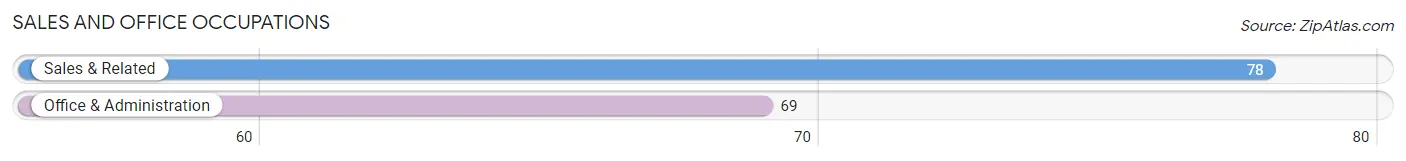
Sales and Office Occupations
The most common Sales and Office occupations in Peaceful Valley are Sales & Related (78 | 8.5%), and Office & Administration (69 | 7.6%).
Sales and Office Occupations by Sex
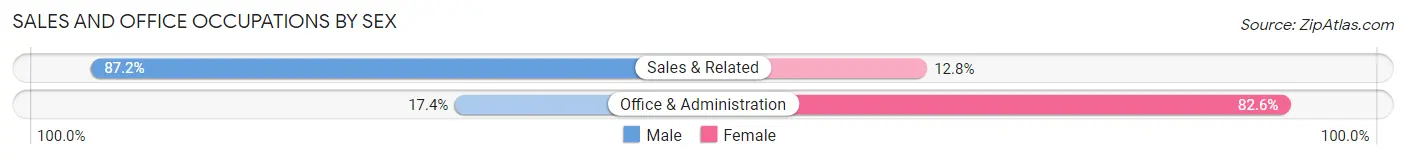
| Occupation | Male | Female |
| Sales & Related | 68 (87.2%) | 10 (12.8%) |
| Office & Administration | 12 (17.4%) | 57 (82.6%) |
| Total (Category) | 80 (54.4%) | 67 (45.6%) |
| Total (Overall) | 591 (64.7%) | 322 (35.3%) |
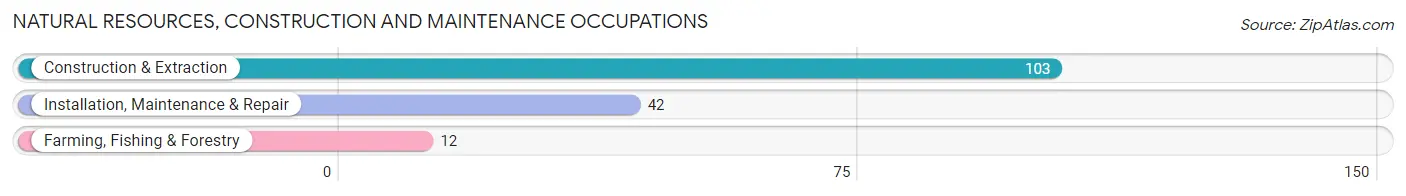
Natural Resources, Construction and Maintenance Occupations
The most common Natural Resources, Construction and Maintenance occupations in Peaceful Valley are Construction & Extraction (103 | 11.3%), Installation, Maintenance & Repair (42 | 4.6%), and Farming, Fishing & Forestry (12 | 1.3%).
Natural Resources, Construction and Maintenance Occupations by Sex
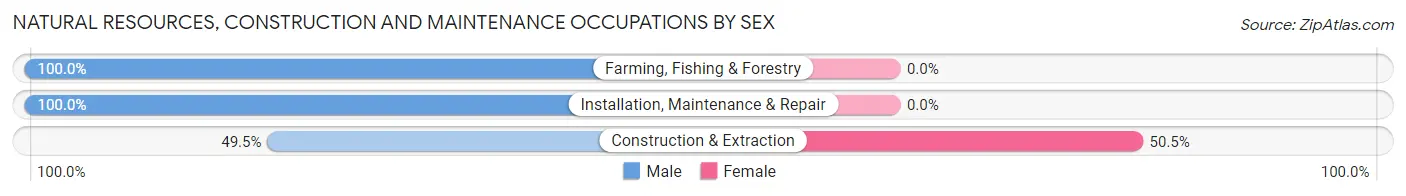
| Occupation | Male | Female |
| Farming, Fishing & Forestry | 12 (100.0%) | 0 (0.0%) |
| Construction & Extraction | 51 (49.5%) | 52 (50.5%) |
| Installation, Maintenance & Repair | 42 (100.0%) | 0 (0.0%) |
| Total (Category) | 105 (66.9%) | 52 (33.1%) |
| Total (Overall) | 591 (64.7%) | 322 (35.3%) |
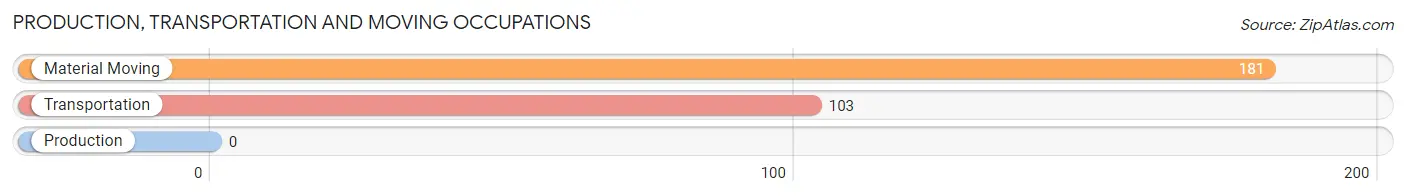
Production, Transportation and Moving Occupations
The most common Production, Transportation and Moving occupations in Peaceful Valley are Material Moving (181 | 19.8%), and Transportation (103 | 11.3%).
Production, Transportation and Moving Occupations by Sex
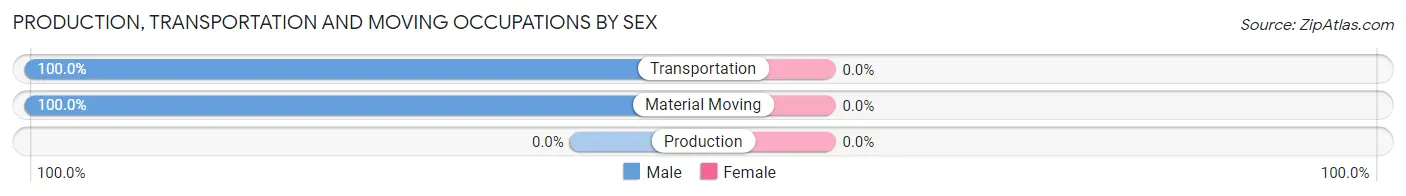
| Occupation | Male | Female |
| Production | 0 (0.0%) | 0 (0.0%) |
| Transportation | 103 (100.0%) | 0 (0.0%) |
| Material Moving | 181 (100.0%) | 0 (0.0%) |
| Total (Category) | 284 (100.0%) | 0 (0.0%) |
| Total (Overall) | 591 (64.7%) | 322 (35.3%) |
Employment Industries by Sex in Peaceful Valley
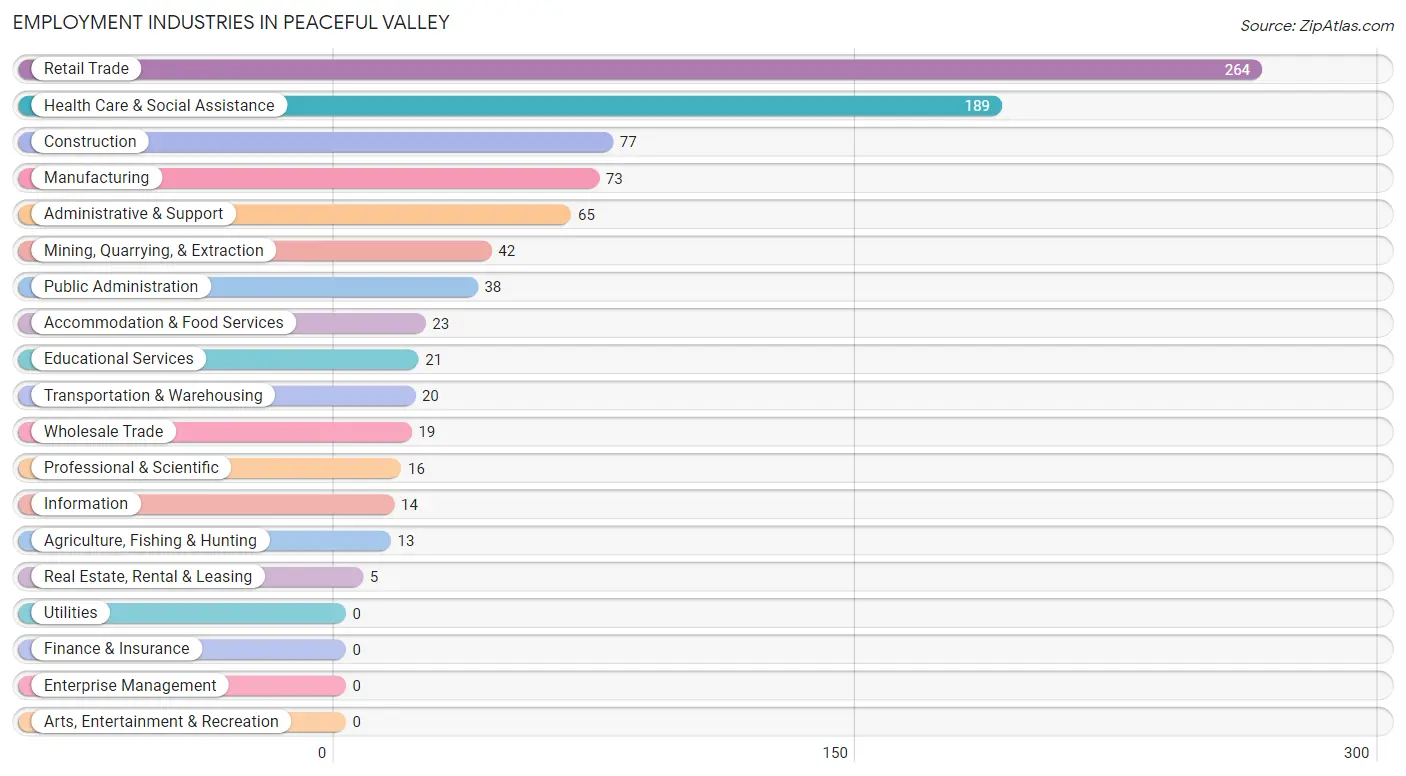
Employment Industries in Peaceful Valley
The major employment industries in Peaceful Valley include Retail Trade (264 | 28.9%), Health Care & Social Assistance (189 | 20.7%), Construction (77 | 8.4%), Manufacturing (73 | 8.0%), and Administrative & Support (65 | 7.1%).
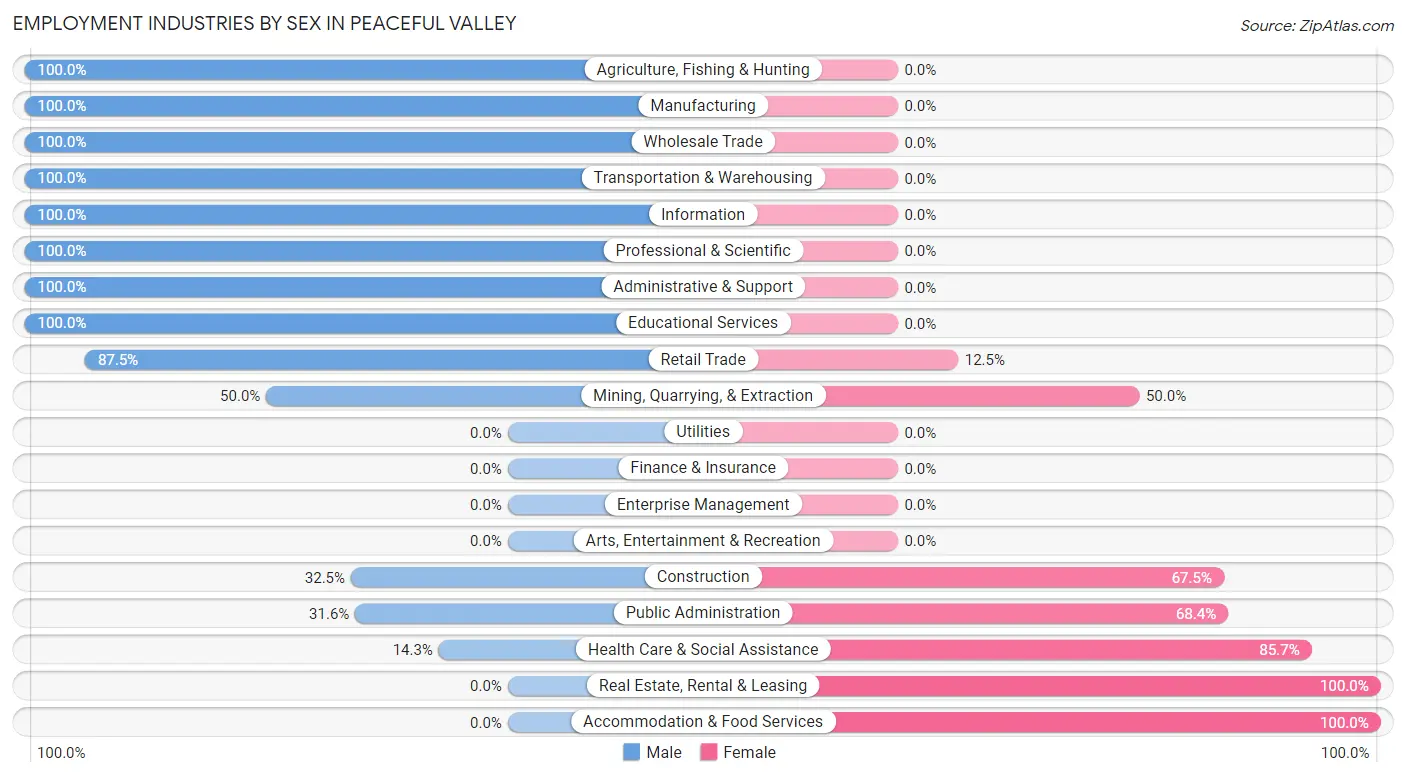
Employment Industries by Sex in Peaceful Valley
The Peaceful Valley industries that see more men than women are Agriculture, Fishing & Hunting (100.0%), Manufacturing (100.0%), and Wholesale Trade (100.0%), whereas the industries that tend to have a higher number of women are Real Estate, Rental & Leasing (100.0%), Accommodation & Food Services (100.0%), and Health Care & Social Assistance (85.7%).
| Industry | Male | Female |
| Agriculture, Fishing & Hunting | 13 (100.0%) | 0 (0.0%) |
| Mining, Quarrying, & Extraction | 21 (50.0%) | 21 (50.0%) |
| Construction | 25 (32.5%) | 52 (67.5%) |
| Manufacturing | 73 (100.0%) | 0 (0.0%) |
| Wholesale Trade | 19 (100.0%) | 0 (0.0%) |
| Retail Trade | 231 (87.5%) | 33 (12.5%) |
| Transportation & Warehousing | 20 (100.0%) | 0 (0.0%) |
| Utilities | 0 (0.0%) | 0 (0.0%) |
| Information | 14 (100.0%) | 0 (0.0%) |
| Finance & Insurance | 0 (0.0%) | 0 (0.0%) |
| Real Estate, Rental & Leasing | 0 (0.0%) | 5 (100.0%) |
| Professional & Scientific | 16 (100.0%) | 0 (0.0%) |
| Enterprise Management | 0 (0.0%) | 0 (0.0%) |
| Administrative & Support | 65 (100.0%) | 0 (0.0%) |
| Educational Services | 21 (100.0%) | 0 (0.0%) |
| Health Care & Social Assistance | 27 (14.3%) | 162 (85.7%) |
| Arts, Entertainment & Recreation | 0 (0.0%) | 0 (0.0%) |
| Accommodation & Food Services | 0 (0.0%) | 23 (100.0%) |
| Public Administration | 12 (31.6%) | 26 (68.4%) |
| Total | 591 (64.7%) | 322 (35.3%) |
Education in Peaceful Valley
School Enrollment in Peaceful Valley
The most common levels of schooling among the 503 students in Peaceful Valley are high school (178 | 35.4%), middle school (139 | 27.6%), and kindergarten (68 | 13.5%).
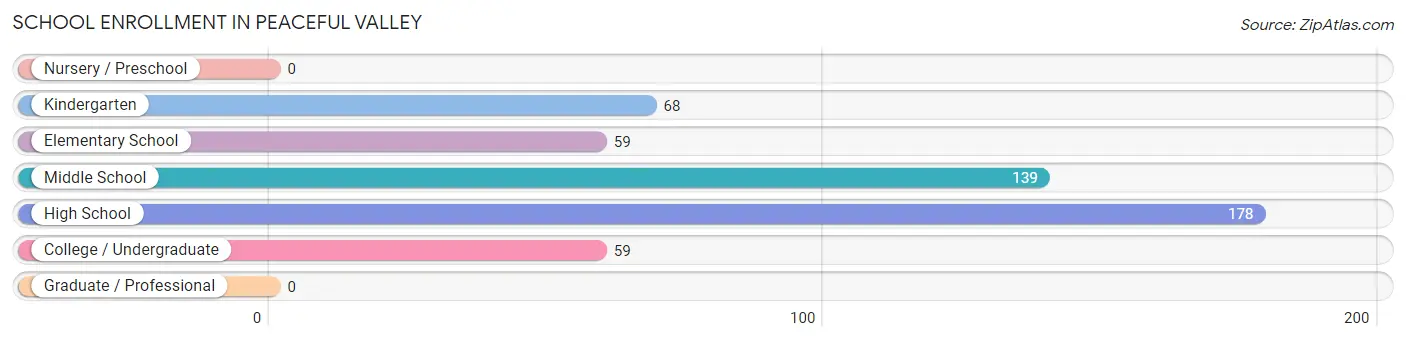
| School Level | # Students | % Students |
| Nursery / Preschool | 0 | 0.0% |
| Kindergarten | 68 | 13.5% |
| Elementary School | 59 | 11.7% |
| Middle School | 139 | 27.6% |
| High School | 178 | 35.4% |
| College / Undergraduate | 59 | 11.7% |
| Graduate / Professional | 0 | 0.0% |
| Total | 503 | 100.0% |
School Enrollment by Age by Funding Source in Peaceful Valley
Out of a total of 503 students who are enrolled in schools in Peaceful Valley, 30 (6.0%) attend a private institution, while the remaining 473 (94.0%) are enrolled in public schools. The age group of 5 to 9 year old has the highest likelihood of being enrolled in private schools, with 30 (27.0% in the age bracket) enrolled. Conversely, the age group of 10 to 14 year olds has the lowest likelihood of being enrolled in a private school, with 166 (100.0% in the age bracket) attending a public institution.
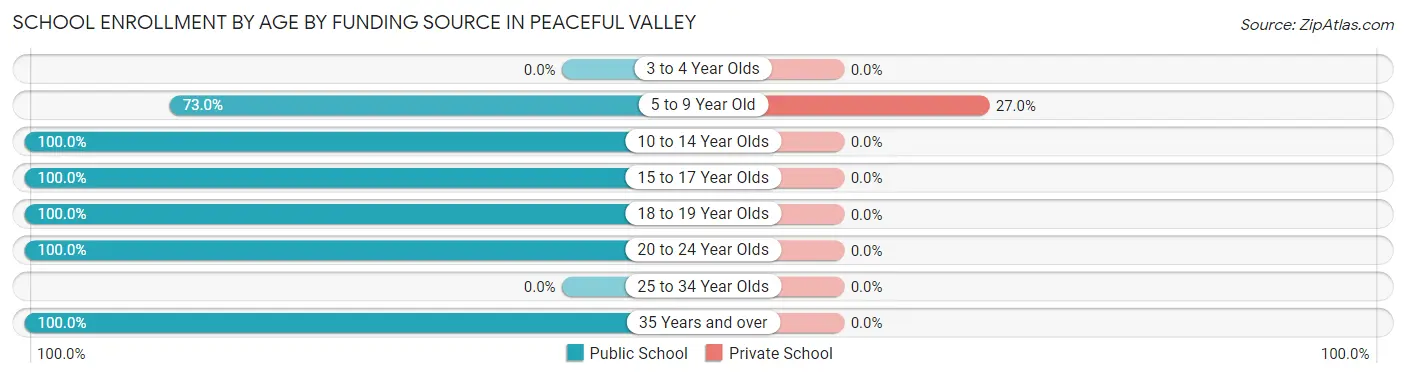
| Age Bracket | Public School | Private School |
| 3 to 4 Year Olds | 0 (0.0%) | 0 (0.0%) |
| 5 to 9 Year Old | 81 (73.0%) | 30 (27.0%) |
| 10 to 14 Year Olds | 166 (100.0%) | 0 (0.0%) |
| 15 to 17 Year Olds | 167 (100.0%) | 0 (0.0%) |
| 18 to 19 Year Olds | 21 (100.0%) | 0 (0.0%) |
| 20 to 24 Year Olds | 23 (100.0%) | 0 (0.0%) |
| 25 to 34 Year Olds | 0 (0.0%) | 0 (0.0%) |
| 35 Years and over | 15 (100.0%) | 0 (0.0%) |
| Total | 473 (94.0%) | 30 (6.0%) |
Educational Attainment by Field of Study in Peaceful Valley
Education (64 | 35.4%), liberal arts & history (56 | 30.9%), business (35 | 19.3%), visual & performing arts (14 | 7.7%), and psychology (12 | 6.6%) are the most common fields of study among 181 individuals in Peaceful Valley who have obtained a bachelor's degree or higher.
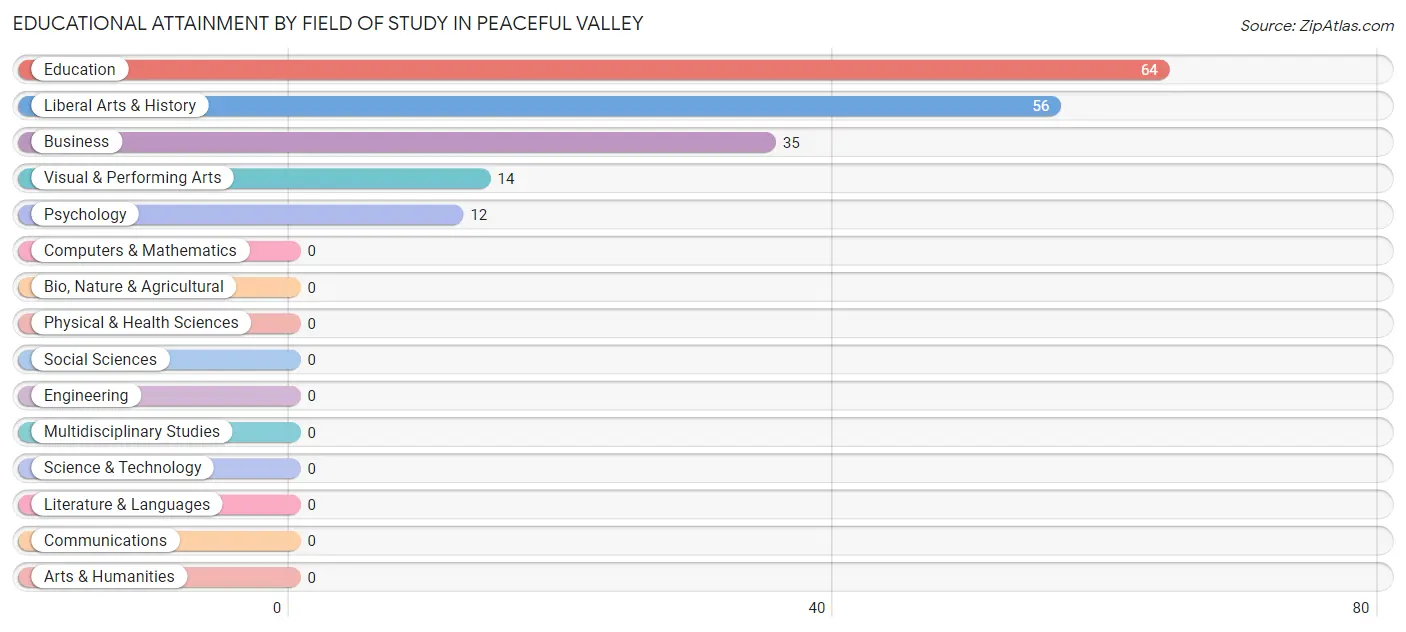
| Field of Study | # Graduates | % Graduates |
| Computers & Mathematics | 0 | 0.0% |
| Bio, Nature & Agricultural | 0 | 0.0% |
| Physical & Health Sciences | 0 | 0.0% |
| Psychology | 12 | 6.6% |
| Social Sciences | 0 | 0.0% |
| Engineering | 0 | 0.0% |
| Multidisciplinary Studies | 0 | 0.0% |
| Science & Technology | 0 | 0.0% |
| Business | 35 | 19.3% |
| Education | 64 | 35.4% |
| Literature & Languages | 0 | 0.0% |
| Liberal Arts & History | 56 | 30.9% |
| Visual & Performing Arts | 14 | 7.7% |
| Communications | 0 | 0.0% |
| Arts & Humanities | 0 | 0.0% |
| Total | 181 | 100.0% |
Transportation & Commute in Peaceful Valley
Vehicle Availability by Sex in Peaceful Valley
The most prevalent vehicle ownership categories in Peaceful Valley are males with 2 vehicles (220, accounting for 37.2%) and females with 2 vehicles (161, making up 68.3%).
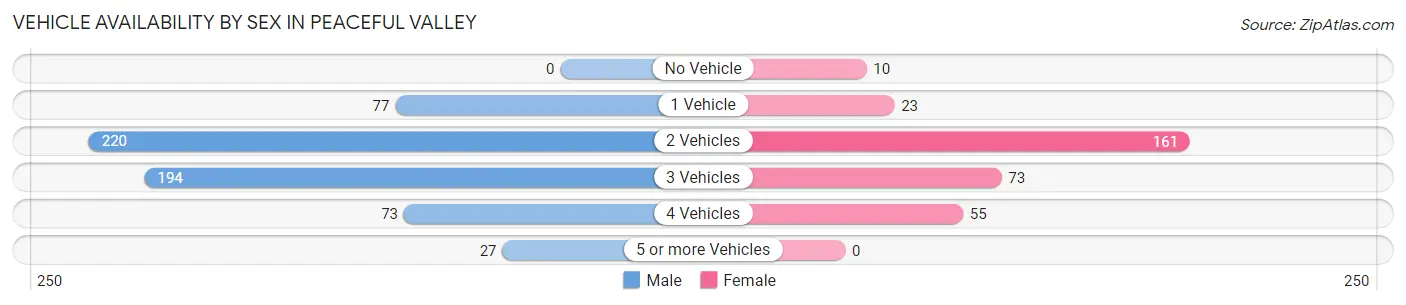
| Vehicles Available | Male | Female |
| No Vehicle | 0 (0.0%) | 10 (3.1%) |
| 1 Vehicle | 77 (13.0%) | 23 (7.1%) |
| 2 Vehicles | 220 (37.2%) | 161 (50.0%) |
| 3 Vehicles | 194 (32.8%) | 73 (22.7%) |
| 4 Vehicles | 73 (12.3%) | 55 (17.1%) |
| 5 or more Vehicles | 27 (4.6%) | 0 (0.0%) |
| Total | 591 (100.0%) | 322 (100.0%) |
Commute Time in Peaceful Valley
The most frequently occuring commute durations in Peaceful Valley are 40 to 44 minutes (219 commuters, 25.1%), 30 to 34 minutes (172 commuters, 19.8%), and 45 to 59 minutes (138 commuters, 15.8%).
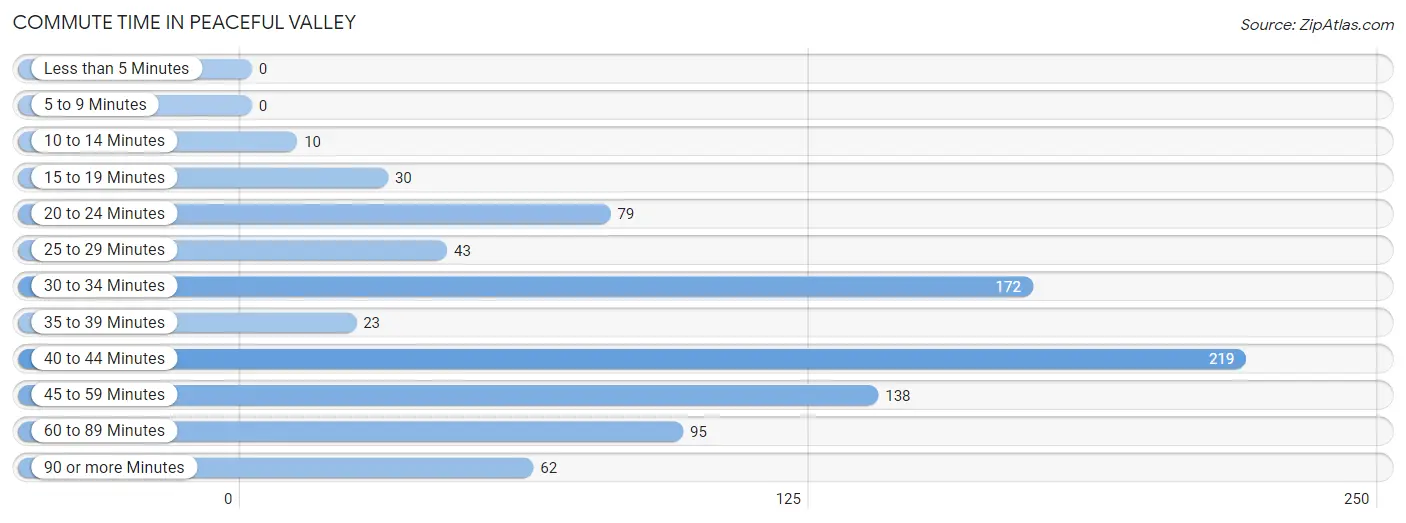
| Commute Time | # Commuters | % Commuters |
| Less than 5 Minutes | 0 | 0.0% |
| 5 to 9 Minutes | 0 | 0.0% |
| 10 to 14 Minutes | 10 | 1.1% |
| 15 to 19 Minutes | 30 | 3.4% |
| 20 to 24 Minutes | 79 | 9.1% |
| 25 to 29 Minutes | 43 | 4.9% |
| 30 to 34 Minutes | 172 | 19.8% |
| 35 to 39 Minutes | 23 | 2.6% |
| 40 to 44 Minutes | 219 | 25.1% |
| 45 to 59 Minutes | 138 | 15.8% |
| 60 to 89 Minutes | 95 | 10.9% |
| 90 or more Minutes | 62 | 7.1% |
Commute Time by Sex in Peaceful Valley
The most common commute times in Peaceful Valley are 30 to 34 minutes (161 commuters, 28.5%) for males and 40 to 44 minutes (84 commuters, 27.4%) for females.
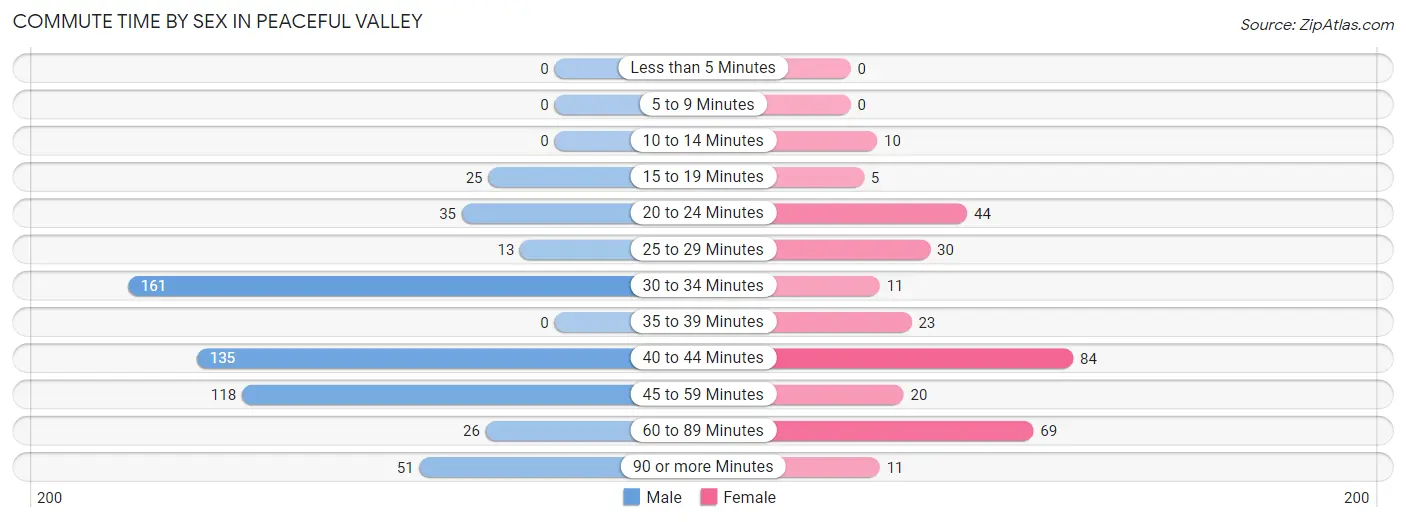
| Commute Time | Male | Female |
| Less than 5 Minutes | 0 (0.0%) | 0 (0.0%) |
| 5 to 9 Minutes | 0 (0.0%) | 0 (0.0%) |
| 10 to 14 Minutes | 0 (0.0%) | 10 (3.3%) |
| 15 to 19 Minutes | 25 (4.4%) | 5 (1.6%) |
| 20 to 24 Minutes | 35 (6.2%) | 44 (14.3%) |
| 25 to 29 Minutes | 13 (2.3%) | 30 (9.8%) |
| 30 to 34 Minutes | 161 (28.5%) | 11 (3.6%) |
| 35 to 39 Minutes | 0 (0.0%) | 23 (7.5%) |
| 40 to 44 Minutes | 135 (23.9%) | 84 (27.4%) |
| 45 to 59 Minutes | 118 (20.9%) | 20 (6.5%) |
| 60 to 89 Minutes | 26 (4.6%) | 69 (22.5%) |
| 90 or more Minutes | 51 (9.0%) | 11 (3.6%) |
Time of Departure to Work by Sex in Peaceful Valley
The most frequent times of departure to work in Peaceful Valley are 10:00 AM to 10:59 AM (176, 31.2%) for males and 6:30 AM to 6:59 AM (69, 22.5%) for females.
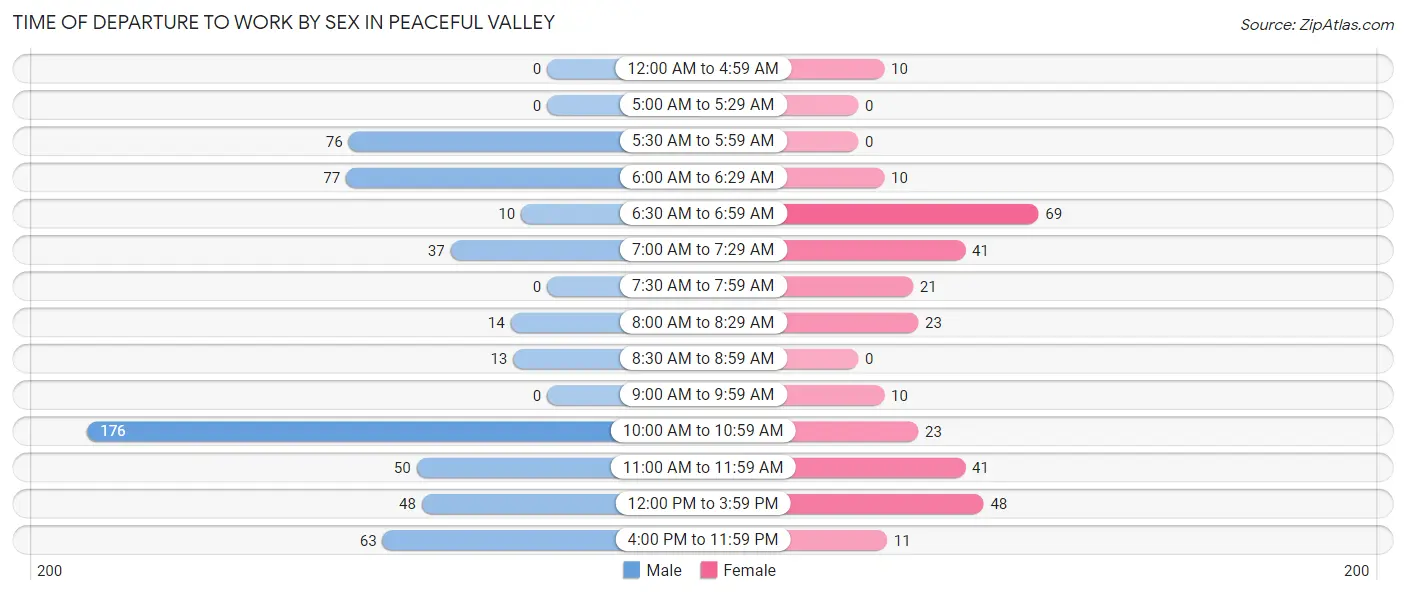
| Time of Departure | Male | Female |
| 12:00 AM to 4:59 AM | 0 (0.0%) | 10 (3.3%) |
| 5:00 AM to 5:29 AM | 0 (0.0%) | 0 (0.0%) |
| 5:30 AM to 5:59 AM | 76 (13.5%) | 0 (0.0%) |
| 6:00 AM to 6:29 AM | 77 (13.7%) | 10 (3.3%) |
| 6:30 AM to 6:59 AM | 10 (1.8%) | 69 (22.5%) |
| 7:00 AM to 7:29 AM | 37 (6.6%) | 41 (13.4%) |
| 7:30 AM to 7:59 AM | 0 (0.0%) | 21 (6.8%) |
| 8:00 AM to 8:29 AM | 14 (2.5%) | 23 (7.5%) |
| 8:30 AM to 8:59 AM | 13 (2.3%) | 0 (0.0%) |
| 9:00 AM to 9:59 AM | 0 (0.0%) | 10 (3.3%) |
| 10:00 AM to 10:59 AM | 176 (31.2%) | 23 (7.5%) |
| 11:00 AM to 11:59 AM | 50 (8.9%) | 41 (13.4%) |
| 12:00 PM to 3:59 PM | 48 (8.5%) | 48 (15.6%) |
| 4:00 PM to 11:59 PM | 63 (11.2%) | 11 (3.6%) |
| Total | 564 (100.0%) | 307 (100.0%) |
Housing Occupancy in Peaceful Valley
Occupancy by Ownership in Peaceful Valley
Of the total 1,036 dwellings in Peaceful Valley, owner-occupied units account for 681 (65.7%), while renter-occupied units make up 355 (34.3%).
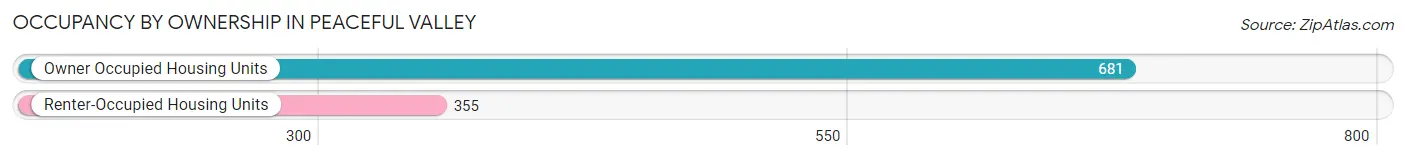
| Occupancy | # Housing Units | % Housing Units |
| Owner Occupied Housing Units | 681 | 65.7% |
| Renter-Occupied Housing Units | 355 | 34.3% |
| Total Occupied Housing Units | 1,036 | 100.0% |
Occupancy by Household Size in Peaceful Valley
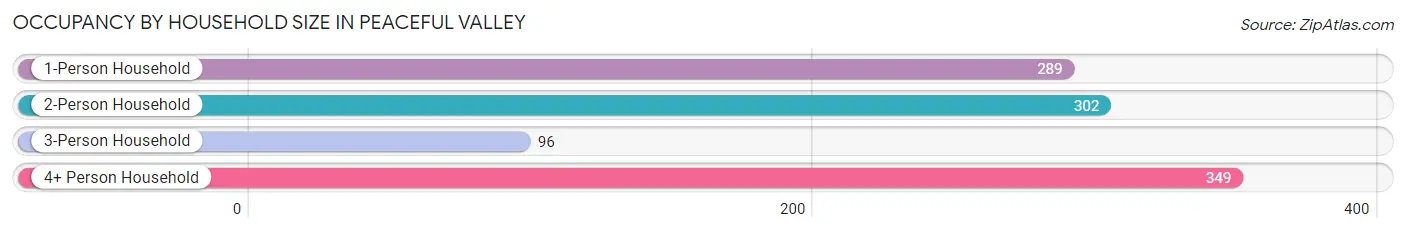
| Household Size | # Housing Units | % Housing Units |
| 1-Person Household | 289 | 27.9% |
| 2-Person Household | 302 | 29.1% |
| 3-Person Household | 96 | 9.3% |
| 4+ Person Household | 349 | 33.7% |
| Total Housing Units | 1,036 | 100.0% |
Occupancy by Ownership by Household Size in Peaceful Valley
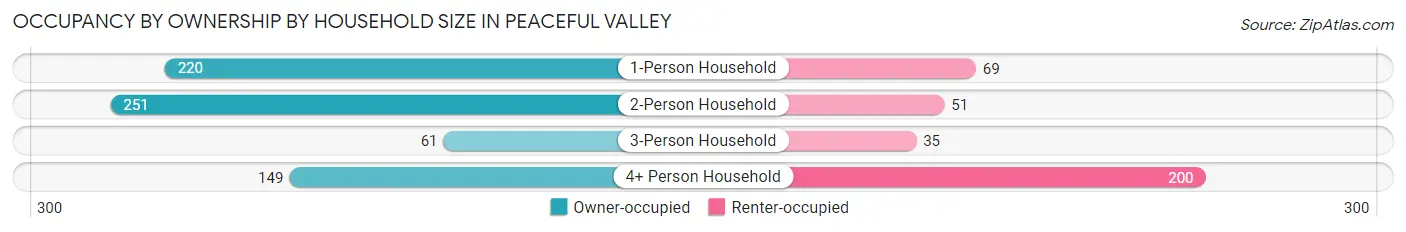
| Household Size | Owner-occupied | Renter-occupied |
| 1-Person Household | 220 (76.1%) | 69 (23.9%) |
| 2-Person Household | 251 (83.1%) | 51 (16.9%) |
| 3-Person Household | 61 (63.5%) | 35 (36.5%) |
| 4+ Person Household | 149 (42.7%) | 200 (57.3%) |
| Total Housing Units | 681 (65.7%) | 355 (34.3%) |
Occupancy by Educational Attainment in Peaceful Valley
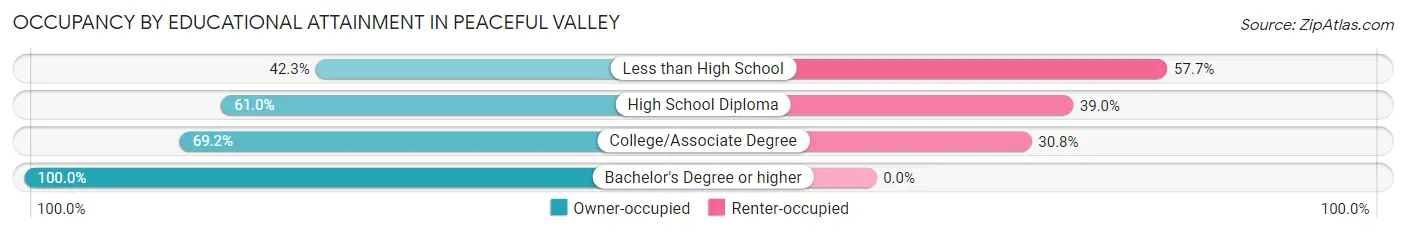
| Household Size | Owner-occupied | Renter-occupied |
| Less than High School | 44 (42.3%) | 60 (57.7%) |
| High School Diploma | 305 (61.0%) | 195 (39.0%) |
| College/Associate Degree | 225 (69.2%) | 100 (30.8%) |
| Bachelor's Degree or higher | 107 (100.0%) | 0 (0.0%) |
Occupancy by Age of Householder in Peaceful Valley
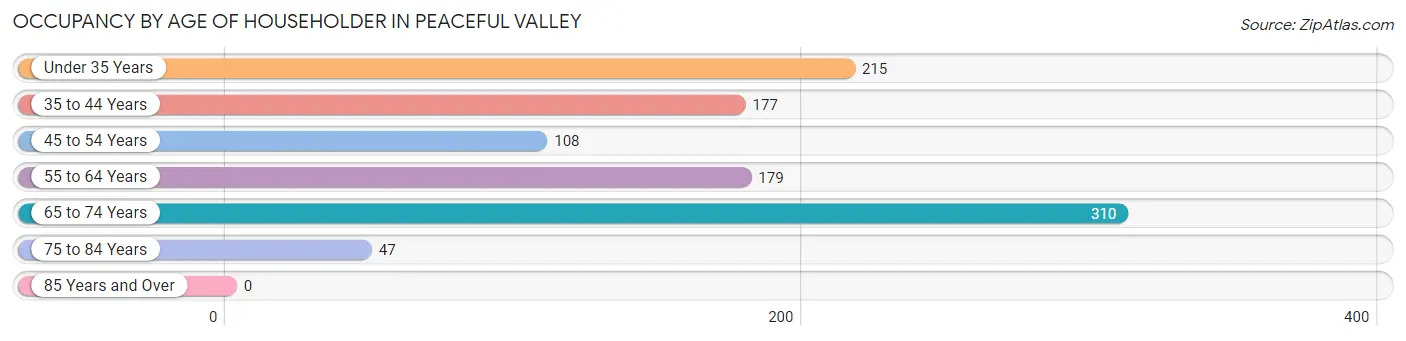
| Age Bracket | # Households | % Households |
| Under 35 Years | 215 | 20.7% |
| 35 to 44 Years | 177 | 17.1% |
| 45 to 54 Years | 108 | 10.4% |
| 55 to 64 Years | 179 | 17.3% |
| 65 to 74 Years | 310 | 29.9% |
| 75 to 84 Years | 47 | 4.5% |
| 85 Years and Over | 0 | 0.0% |
| Total | 1,036 | 100.0% |
Housing Finances in Peaceful Valley
Median Income by Occupancy in Peaceful Valley
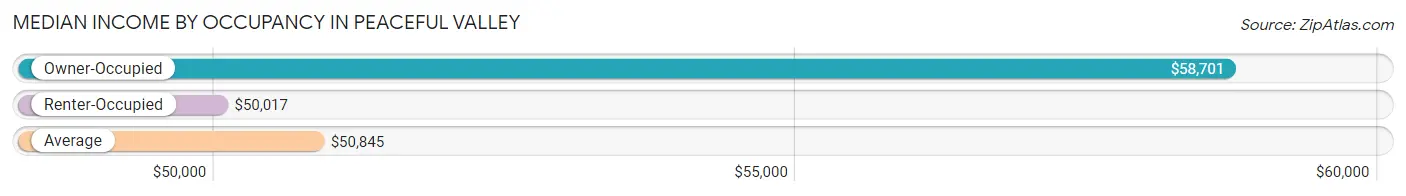
| Occupancy Type | # Households | Median Income |
| Owner-Occupied | 681 (65.7%) | $58,701 |
| Renter-Occupied | 355 (34.3%) | $50,017 |
| Average | 1,036 (100.0%) | $50,845 |
Occupancy by Householder Income Bracket in Peaceful Valley
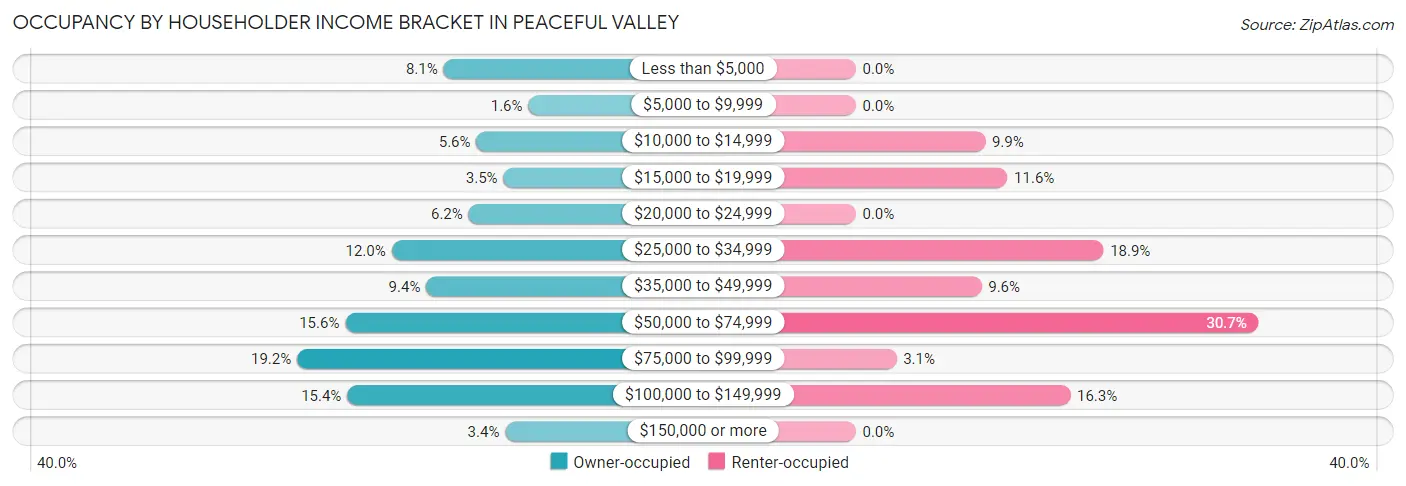
| Income Bracket | Owner-occupied | Renter-occupied |
| Less than $5,000 | 55 (8.1%) | 0 (0.0%) |
| $5,000 to $9,999 | 11 (1.6%) | 0 (0.0%) |
| $10,000 to $14,999 | 38 (5.6%) | 35 (9.9%) |
| $15,000 to $19,999 | 24 (3.5%) | 41 (11.6%) |
| $20,000 to $24,999 | 42 (6.2%) | 0 (0.0%) |
| $25,000 to $34,999 | 82 (12.0%) | 67 (18.9%) |
| $35,000 to $49,999 | 64 (9.4%) | 34 (9.6%) |
| $50,000 to $74,999 | 106 (15.6%) | 109 (30.7%) |
| $75,000 to $99,999 | 131 (19.2%) | 11 (3.1%) |
| $100,000 to $149,999 | 105 (15.4%) | 58 (16.3%) |
| $150,000 or more | 23 (3.4%) | 0 (0.0%) |
| Total | 681 (100.0%) | 355 (100.0%) |
Monthly Housing Cost Tiers in Peaceful Valley
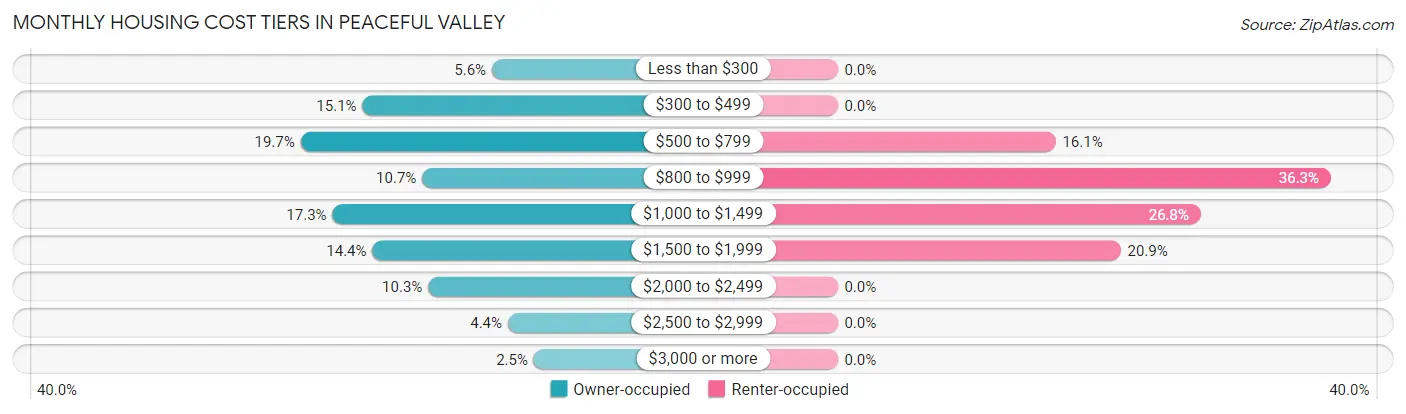
| Monthly Cost | Owner-occupied | Renter-occupied |
| Less than $300 | 38 (5.6%) | 0 (0.0%) |
| $300 to $499 | 103 (15.1%) | 0 (0.0%) |
| $500 to $799 | 134 (19.7%) | 57 (16.1%) |
| $800 to $999 | 73 (10.7%) | 129 (36.3%) |
| $1,000 to $1,499 | 118 (17.3%) | 95 (26.8%) |
| $1,500 to $1,999 | 98 (14.4%) | 74 (20.8%) |
| $2,000 to $2,499 | 70 (10.3%) | 0 (0.0%) |
| $2,500 to $2,999 | 30 (4.4%) | 0 (0.0%) |
| $3,000 or more | 17 (2.5%) | 0 (0.0%) |
| Total | 681 (100.0%) | 355 (100.0%) |
Physical Housing Characteristics in Peaceful Valley
Housing Structures in Peaceful Valley
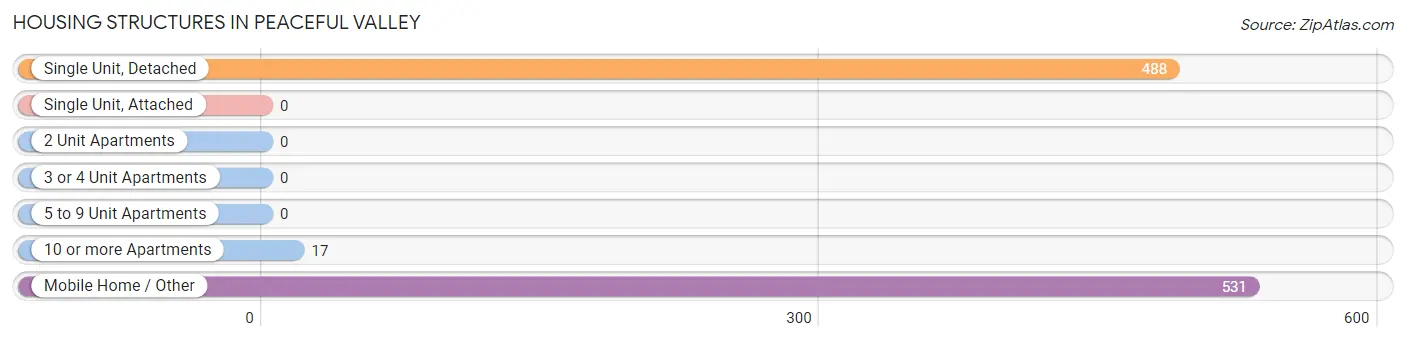
| Structure Type | # Housing Units | % Housing Units |
| Single Unit, Detached | 488 | 47.1% |
| Single Unit, Attached | 0 | 0.0% |
| 2 Unit Apartments | 0 | 0.0% |
| 3 or 4 Unit Apartments | 0 | 0.0% |
| 5 to 9 Unit Apartments | 0 | 0.0% |
| 10 or more Apartments | 17 | 1.6% |
| Mobile Home / Other | 531 | 51.2% |
| Total | 1,036 | 100.0% |
Housing Structures by Occupancy in Peaceful Valley
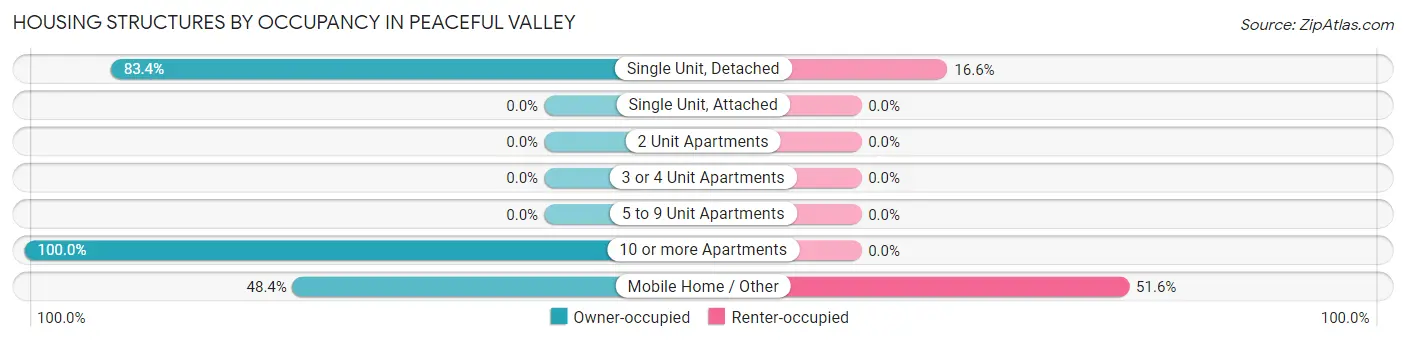
| Structure Type | Owner-occupied | Renter-occupied |
| Single Unit, Detached | 407 (83.4%) | 81 (16.6%) |
| Single Unit, Attached | 0 (0.0%) | 0 (0.0%) |
| 2 Unit Apartments | 0 (0.0%) | 0 (0.0%) |
| 3 or 4 Unit Apartments | 0 (0.0%) | 0 (0.0%) |
| 5 to 9 Unit Apartments | 0 (0.0%) | 0 (0.0%) |
| 10 or more Apartments | 17 (100.0%) | 0 (0.0%) |
| Mobile Home / Other | 257 (48.4%) | 274 (51.6%) |
| Total | 681 (65.7%) | 355 (34.3%) |
Housing Structures by Number of Rooms in Peaceful Valley
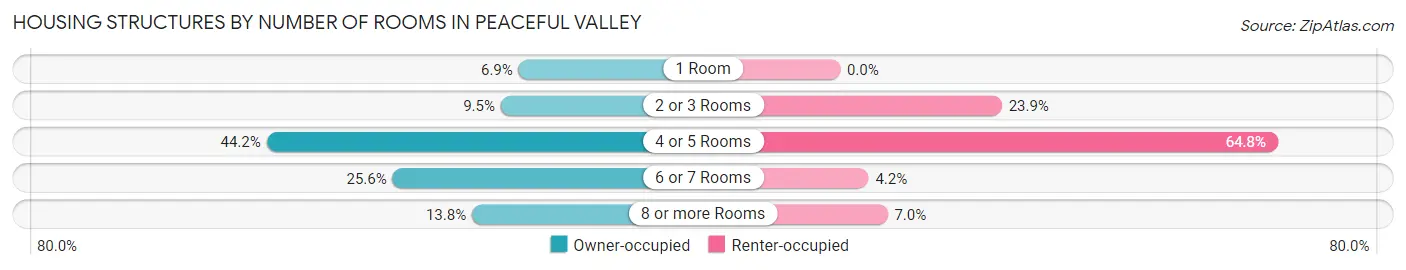
| Number of Rooms | Owner-occupied | Renter-occupied |
| 1 Room | 47 (6.9%) | 0 (0.0%) |
| 2 or 3 Rooms | 65 (9.5%) | 85 (23.9%) |
| 4 or 5 Rooms | 301 (44.2%) | 230 (64.8%) |
| 6 or 7 Rooms | 174 (25.6%) | 15 (4.2%) |
| 8 or more Rooms | 94 (13.8%) | 25 (7.0%) |
| Total | 681 (100.0%) | 355 (100.0%) |
Housing Structure by Heating Type in Peaceful Valley
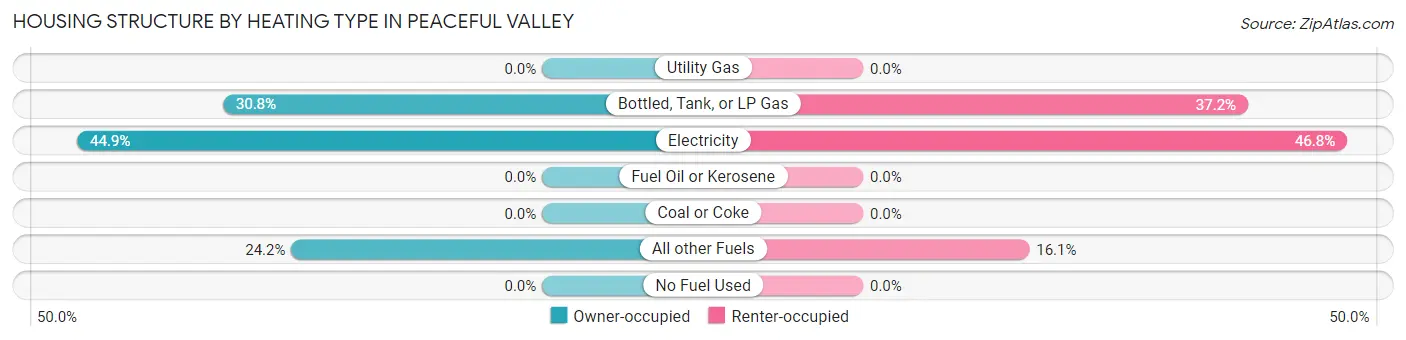
| Heating Type | Owner-occupied | Renter-occupied |
| Utility Gas | 0 (0.0%) | 0 (0.0%) |
| Bottled, Tank, or LP Gas | 210 (30.8%) | 132 (37.2%) |
| Electricity | 306 (44.9%) | 166 (46.8%) |
| Fuel Oil or Kerosene | 0 (0.0%) | 0 (0.0%) |
| Coal or Coke | 0 (0.0%) | 0 (0.0%) |
| All other Fuels | 165 (24.2%) | 57 (16.1%) |
| No Fuel Used | 0 (0.0%) | 0 (0.0%) |
| Total | 681 (100.0%) | 355 (100.0%) |
Household Vehicle Usage in Peaceful Valley
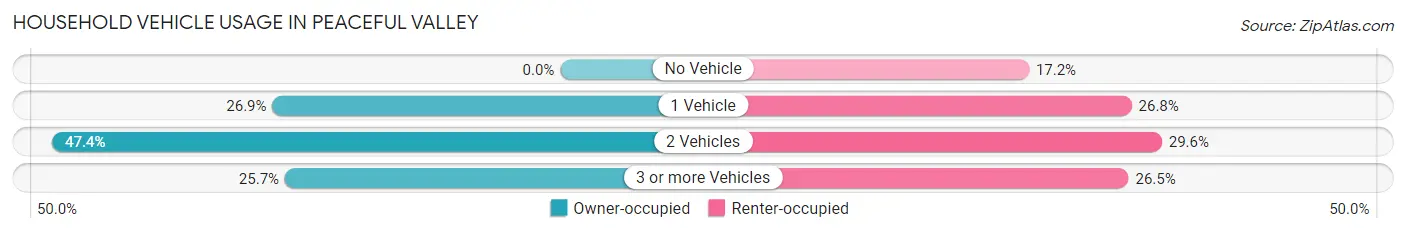
| Vehicles per Household | Owner-occupied | Renter-occupied |
| No Vehicle | 0 (0.0%) | 61 (17.2%) |
| 1 Vehicle | 183 (26.9%) | 95 (26.8%) |
| 2 Vehicles | 323 (47.4%) | 105 (29.6%) |
| 3 or more Vehicles | 175 (25.7%) | 94 (26.5%) |
| Total | 681 (100.0%) | 355 (100.0%) |
Real Estate & Mortgages in Peaceful Valley
Real Estate and Mortgage Overview in Peaceful Valley
| Characteristic | Without Mortgage | With Mortgage |
| Housing Units | 208 | 473 |
| Median Property Value | - | - |
| Median Household Income | $29,559 | $16 |
| Monthly Housing Costs | $491 | $17 |
| Real Estate Taxes | $1,217 | $0 |
Property Value by Mortgage Status in Peaceful Valley
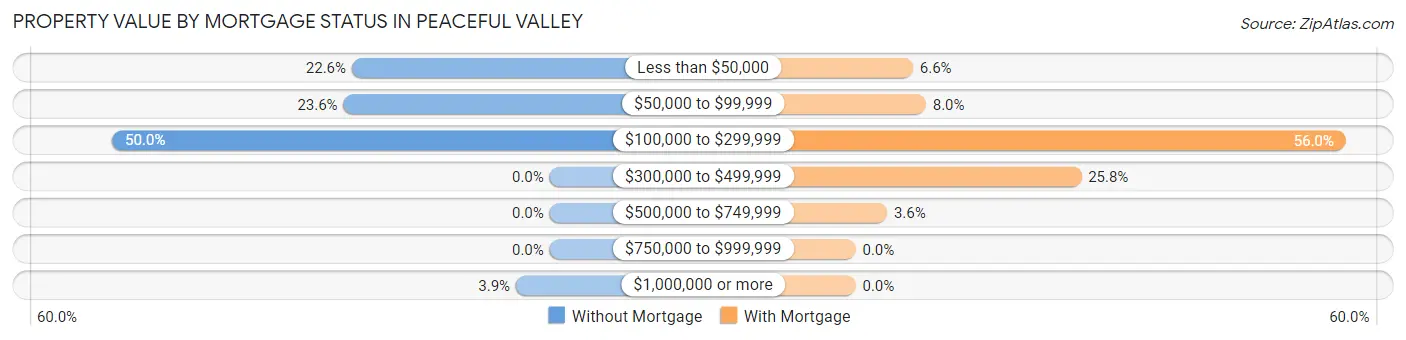
| Property Value | Without Mortgage | With Mortgage |
| Less than $50,000 | 47 (22.6%) | 31 (6.6%) |
| $50,000 to $99,999 | 49 (23.6%) | 38 (8.0%) |
| $100,000 to $299,999 | 104 (50.0%) | 265 (56.0%) |
| $300,000 to $499,999 | 0 (0.0%) | 122 (25.8%) |
| $500,000 to $749,999 | 0 (0.0%) | 17 (3.6%) |
| $750,000 to $999,999 | 0 (0.0%) | 0 (0.0%) |
| $1,000,000 or more | 8 (3.8%) | 0 (0.0%) |
| Total | 208 (100.0%) | 473 (100.0%) |
Household Income by Mortgage Status in Peaceful Valley
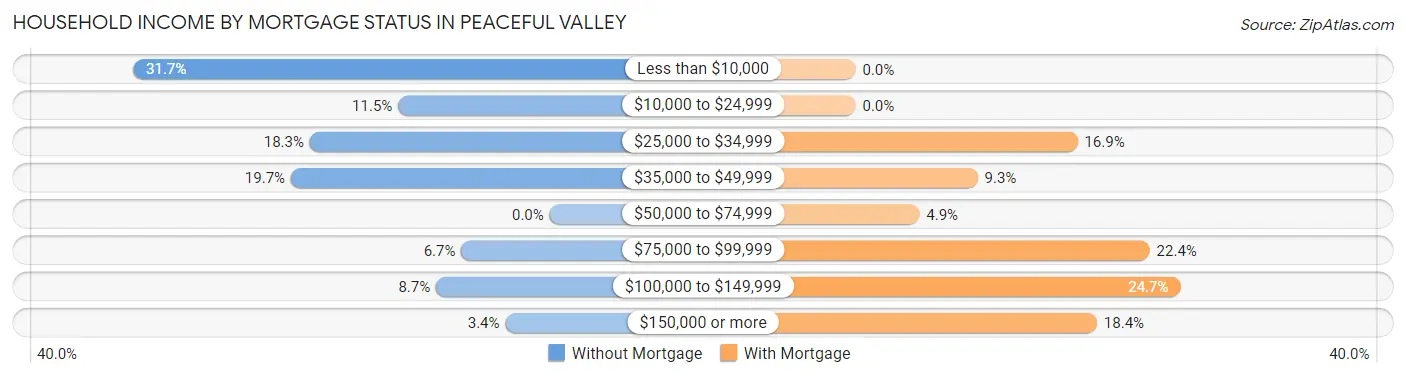
| Household Income | Without Mortgage | With Mortgage |
| Less than $10,000 | 66 (31.7%) | 0 (0.0%) |
| $10,000 to $24,999 | 24 (11.5%) | 0 (0.0%) |
| $25,000 to $34,999 | 38 (18.3%) | 80 (16.9%) |
| $35,000 to $49,999 | 41 (19.7%) | 44 (9.3%) |
| $50,000 to $74,999 | 0 (0.0%) | 23 (4.9%) |
| $75,000 to $99,999 | 14 (6.7%) | 106 (22.4%) |
| $100,000 to $149,999 | 18 (8.6%) | 117 (24.7%) |
| $150,000 or more | 7 (3.4%) | 87 (18.4%) |
| Total | 208 (100.0%) | 473 (100.0%) |
Property Value to Household Income Ratio in Peaceful Valley
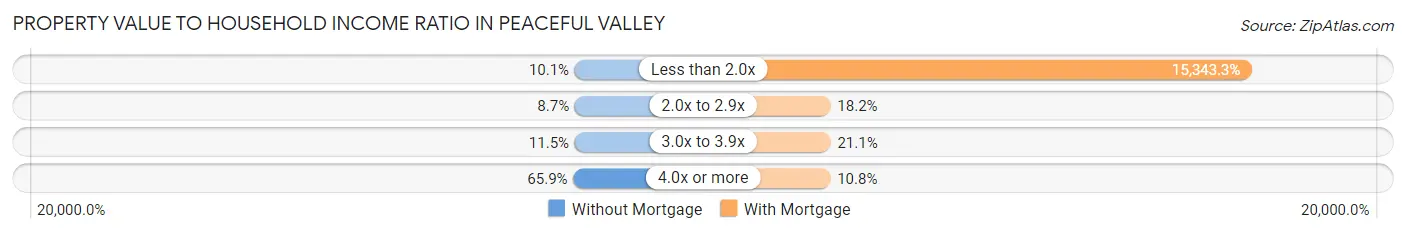
| Value-to-Income Ratio | Without Mortgage | With Mortgage |
| Less than 2.0x | 21 (10.1%) | 72,574 (15,343.3%) |
| 2.0x to 2.9x | 18 (8.6%) | 86 (18.2%) |
| 3.0x to 3.9x | 24 (11.5%) | 100 (21.1%) |
| 4.0x or more | 137 (65.9%) | 51 (10.8%) |
| Total | 208 (100.0%) | 473 (100.0%) |
Real Estate Taxes by Mortgage Status in Peaceful Valley
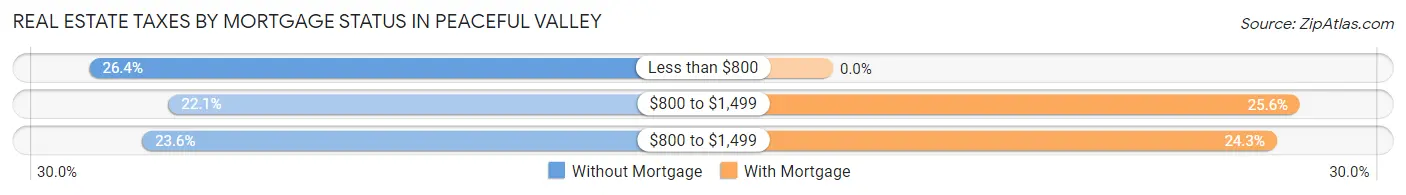
| Property Taxes | Without Mortgage | With Mortgage |
| Less than $800 | 55 (26.4%) | 0 (0.0%) |
| $800 to $1,499 | 46 (22.1%) | 121 (25.6%) |
| $800 to $1,499 | 49 (23.6%) | 115 (24.3%) |
| Total | 208 (100.0%) | 473 (100.0%) |
Health & Disability in Peaceful Valley
Health Insurance Coverage by Age in Peaceful Valley
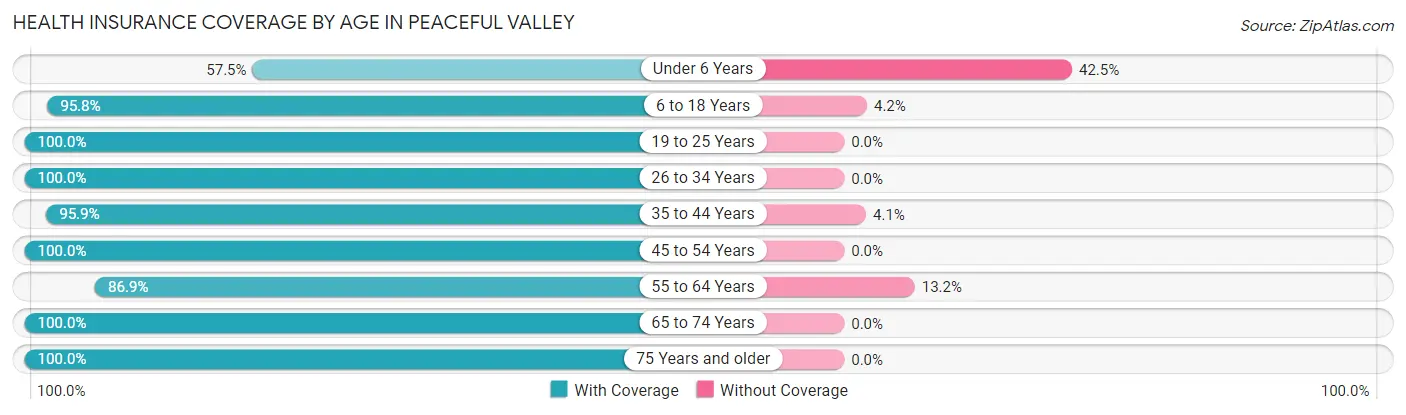
| Age Bracket | With Coverage | Without Coverage |
| Under 6 Years | 42 (57.5%) | 31 (42.5%) |
| 6 to 18 Years | 497 (95.8%) | 22 (4.2%) |
| 19 to 25 Years | 327 (100.0%) | 0 (0.0%) |
| 26 to 34 Years | 241 (100.0%) | 0 (0.0%) |
| 35 to 44 Years | 402 (95.9%) | 17 (4.1%) |
| 45 to 54 Years | 303 (100.0%) | 0 (0.0%) |
| 55 to 64 Years | 284 (86.9%) | 43 (13.2%) |
| 65 to 74 Years | 390 (100.0%) | 0 (0.0%) |
| 75 Years and older | 116 (100.0%) | 0 (0.0%) |
| Total | 2,602 (95.8%) | 113 (4.2%) |
Health Insurance Coverage by Citizenship Status in Peaceful Valley
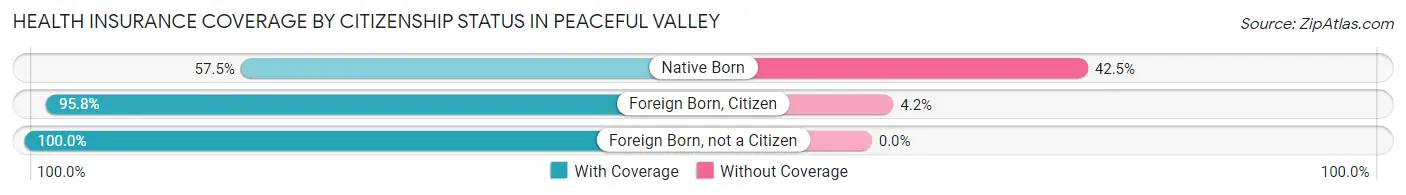
| Citizenship Status | With Coverage | Without Coverage |
| Native Born | 42 (57.5%) | 31 (42.5%) |
| Foreign Born, Citizen | 497 (95.8%) | 22 (4.2%) |
| Foreign Born, not a Citizen | 327 (100.0%) | 0 (0.0%) |
Health Insurance Coverage by Household Income in Peaceful Valley
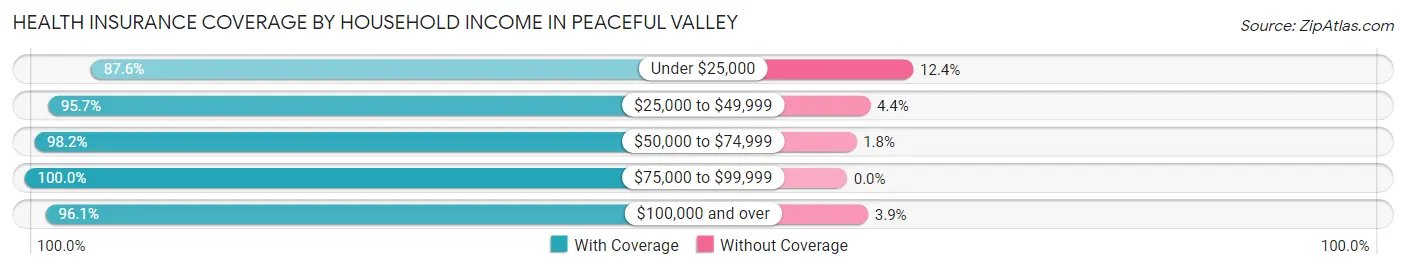
| Household Income | With Coverage | Without Coverage |
| Under $25,000 | 303 (87.6%) | 43 (12.4%) |
| $25,000 to $49,999 | 682 (95.7%) | 31 (4.3%) |
| $50,000 to $74,999 | 556 (98.2%) | 10 (1.8%) |
| $75,000 to $99,999 | 354 (100.0%) | 0 (0.0%) |
| $100,000 and over | 707 (96.1%) | 29 (3.9%) |
Public vs Private Health Insurance Coverage by Age in Peaceful Valley
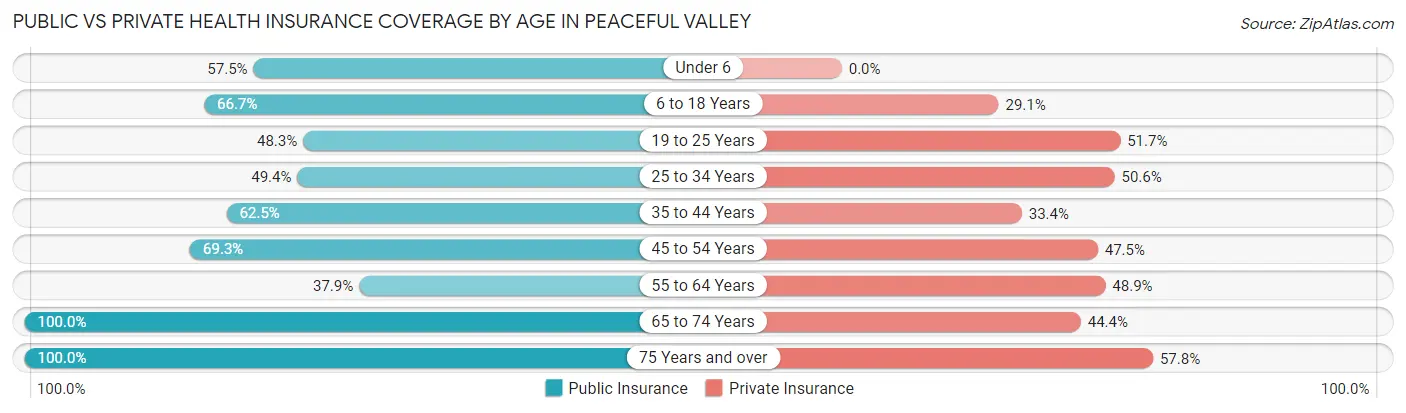
| Age Bracket | Public Insurance | Private Insurance |
| Under 6 | 42 (57.5%) | 0 (0.0%) |
| 6 to 18 Years | 346 (66.7%) | 151 (29.1%) |
| 19 to 25 Years | 158 (48.3%) | 169 (51.7%) |
| 25 to 34 Years | 119 (49.4%) | 122 (50.6%) |
| 35 to 44 Years | 262 (62.5%) | 140 (33.4%) |
| 45 to 54 Years | 210 (69.3%) | 144 (47.5%) |
| 55 to 64 Years | 124 (37.9%) | 160 (48.9%) |
| 65 to 74 Years | 390 (100.0%) | 173 (44.4%) |
| 75 Years and over | 116 (100.0%) | 67 (57.8%) |
| Total | 1,767 (65.1%) | 1,126 (41.5%) |
Disability Status by Sex by Age in Peaceful Valley
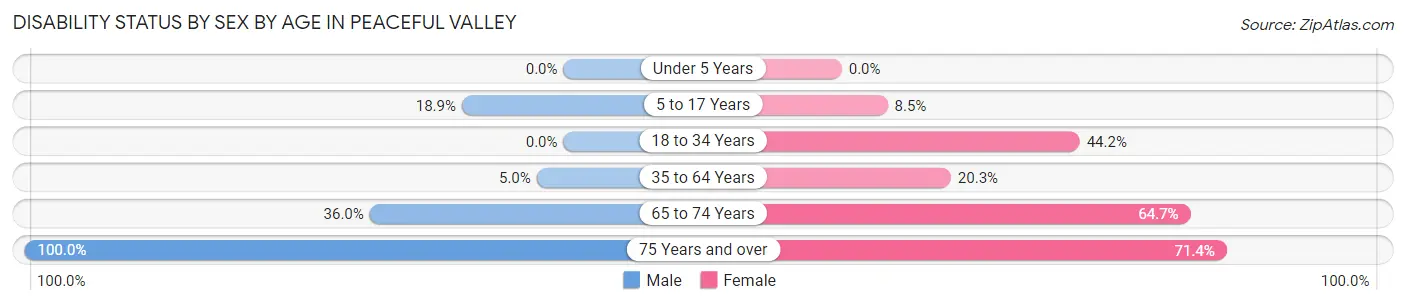
| Age Bracket | Male | Female |
| Under 5 Years | 0 (0.0%) | 0 (0.0%) |
| 5 to 17 Years | 59 (18.9%) | 13 (8.5%) |
| 18 to 34 Years | 0 (0.0%) | 106 (44.2%) |
| 35 to 64 Years | 28 (5.0%) | 98 (20.3%) |
| 65 to 74 Years | 73 (36.0%) | 121 (64.7%) |
| 75 Years and over | 67 (100.0%) | 35 (71.4%) |
Disability Class by Sex by Age in Peaceful Valley
Disability Class: Hearing Difficulty
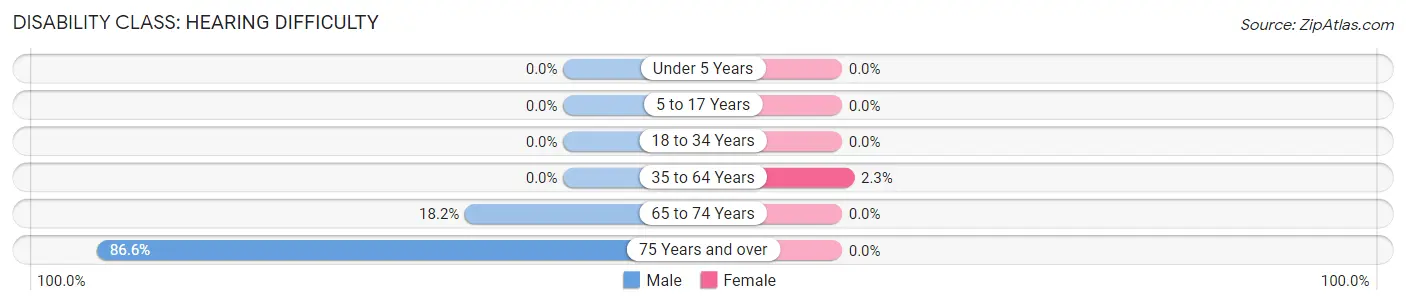
| Age Bracket | Male | Female |
| Under 5 Years | 0 (0.0%) | 0 (0.0%) |
| 5 to 17 Years | 0 (0.0%) | 0 (0.0%) |
| 18 to 34 Years | 0 (0.0%) | 0 (0.0%) |
| 35 to 64 Years | 0 (0.0%) | 11 (2.3%) |
| 65 to 74 Years | 37 (18.2%) | 0 (0.0%) |
| 75 Years and over | 58 (86.6%) | 0 (0.0%) |
Disability Class: Vision Difficulty
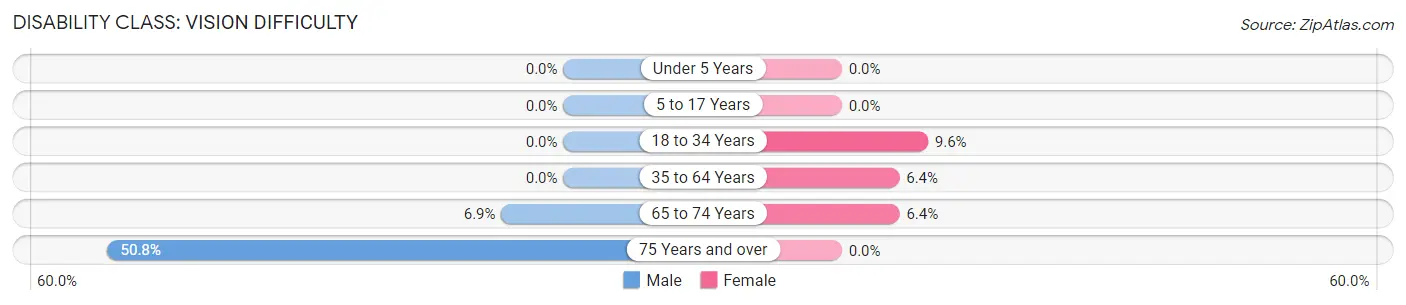
| Age Bracket | Male | Female |
| Under 5 Years | 0 (0.0%) | 0 (0.0%) |
| 5 to 17 Years | 0 (0.0%) | 0 (0.0%) |
| 18 to 34 Years | 0 (0.0%) | 23 (9.6%) |
| 35 to 64 Years | 0 (0.0%) | 31 (6.4%) |
| 65 to 74 Years | 14 (6.9%) | 12 (6.4%) |
| 75 Years and over | 34 (50.7%) | 0 (0.0%) |
Disability Class: Cognitive Difficulty
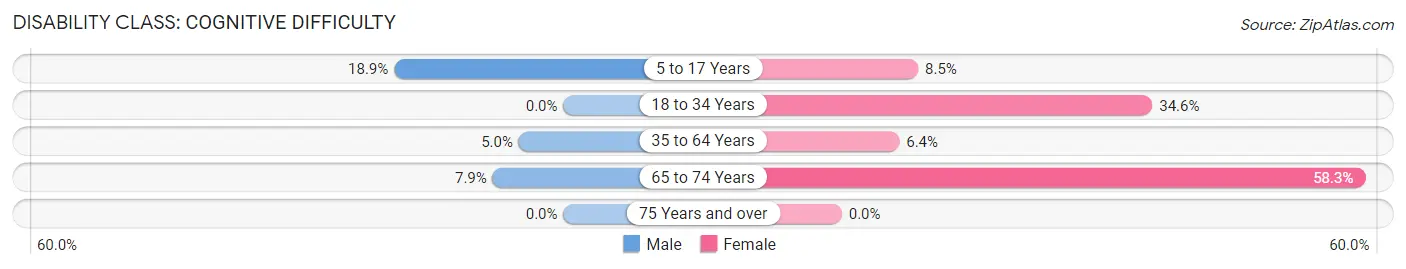
| Age Bracket | Male | Female |
| 5 to 17 Years | 59 (18.9%) | 13 (8.5%) |
| 18 to 34 Years | 0 (0.0%) | 83 (34.6%) |
| 35 to 64 Years | 28 (5.0%) | 31 (6.4%) |
| 65 to 74 Years | 16 (7.9%) | 109 (58.3%) |
| 75 Years and over | 0 (0.0%) | 0 (0.0%) |
Disability Class: Ambulatory Difficulty
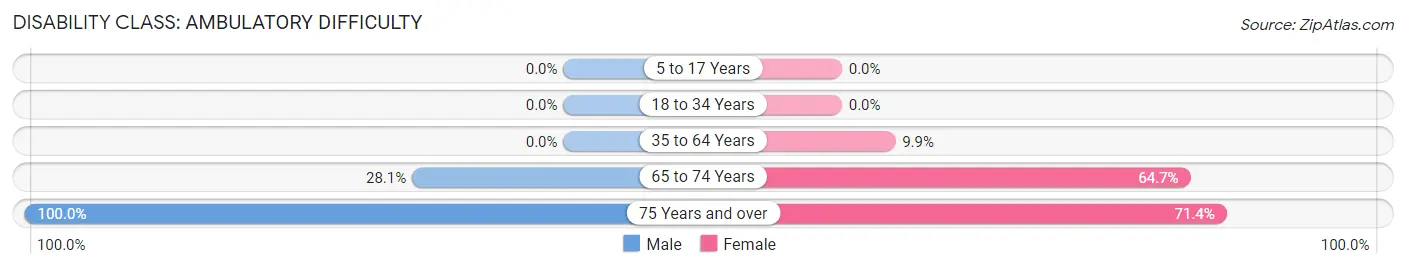
| Age Bracket | Male | Female |
| 5 to 17 Years | 0 (0.0%) | 0 (0.0%) |
| 18 to 34 Years | 0 (0.0%) | 0 (0.0%) |
| 35 to 64 Years | 0 (0.0%) | 48 (9.9%) |
| 65 to 74 Years | 57 (28.1%) | 121 (64.7%) |
| 75 Years and over | 67 (100.0%) | 35 (71.4%) |
Disability Class: Self-Care Difficulty
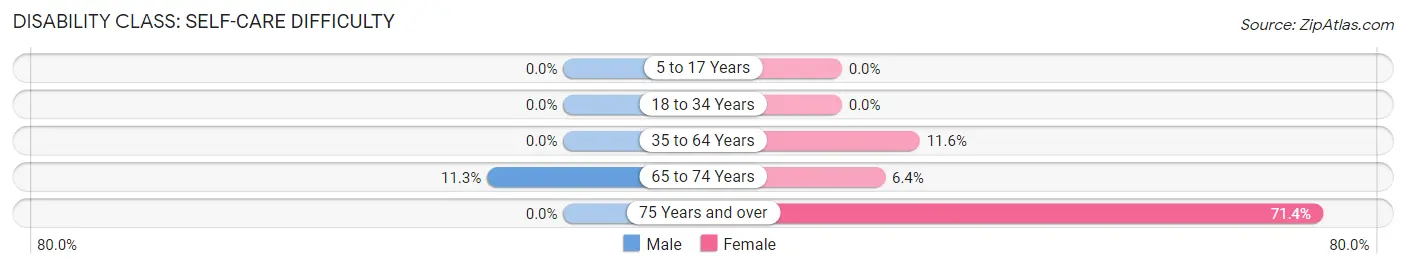
| Age Bracket | Male | Female |
| 5 to 17 Years | 0 (0.0%) | 0 (0.0%) |
| 18 to 34 Years | 0 (0.0%) | 0 (0.0%) |
| 35 to 64 Years | 0 (0.0%) | 56 (11.6%) |
| 65 to 74 Years | 23 (11.3%) | 12 (6.4%) |
| 75 Years and over | 0 (0.0%) | 35 (71.4%) |
Technology Access in Peaceful Valley
Computing Device Access in Peaceful Valley
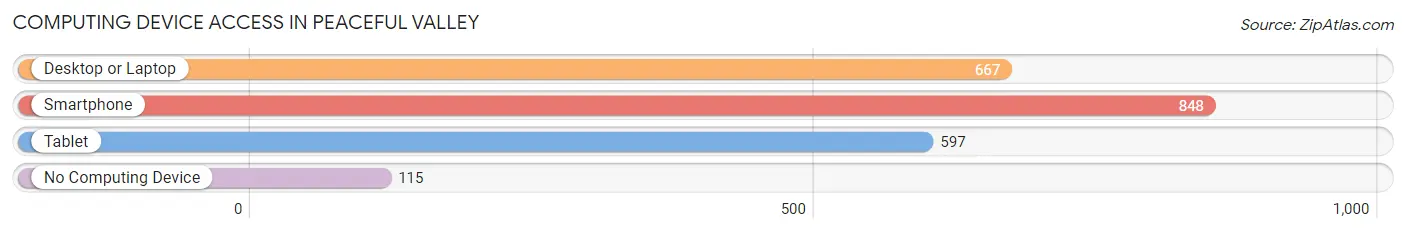
| Device Type | # Households | % Households |
| Desktop or Laptop | 667 | 64.4% |
| Smartphone | 848 | 81.9% |
| Tablet | 597 | 57.6% |
| No Computing Device | 115 | 11.1% |
| Total | 1,036 | 100.0% |
Internet Access in Peaceful Valley
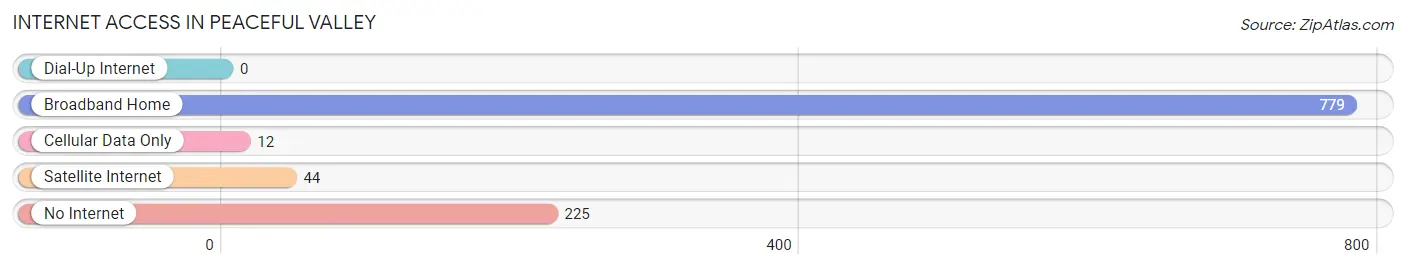
| Internet Type | # Households | % Households |
| Dial-Up Internet | 0 | 0.0% |
| Broadband Home | 779 | 75.2% |
| Cellular Data Only | 12 | 1.2% |
| Satellite Internet | 44 | 4.3% |
| No Internet | 225 | 21.7% |
| Total | 1,036 | 100.0% |
Peaceful Valley Summary
Peaceful Valley is a small unincorporated community located in the foothills of the Cascade Mountains in Snohomish County, Washington. The community is situated along the Stillaguamish River, approximately 25 miles northeast of Seattle. Peaceful Valley is a rural area with a population of approximately 1,000 people.
History
Peaceful Valley was first settled in the late 1800s by homesteaders who were attracted to the area by its fertile soil and abundant natural resources. The first settlers were mostly of Scandinavian descent, and the community was originally known as “Scandinavia.” In the early 1900s, the area was renamed “Peaceful Valley” by a local postmaster.
The area was primarily an agricultural community until the 1950s, when the construction of the nearby Everett Mall began to draw people to the area. The mall, which opened in 1959, was the first major shopping center in the area and helped to spur the growth of the community.
Geography
Peaceful Valley is located in the foothills of the Cascade Mountains in Snohomish County, Washington. The community is situated along the Stillaguamish River, approximately 25 miles northeast of Seattle. The area is characterized by rolling hills, dense forests, and numerous rivers and streams. The climate is mild and temperate, with average temperatures ranging from the mid-30s in the winter to the mid-70s in the summer.
Economy
Peaceful Valley is primarily a rural, agricultural community. The area is home to several small farms and ranches, as well as a number of small businesses. The area is also home to the Everett Mall, which is the largest shopping center in the area. The mall is home to a variety of stores, restaurants, and entertainment venues.
Demographics
As of the 2010 census, the population of Peaceful Valley was 1,000 people. The racial makeup of the community was 94.2% White, 1.2% African American, 0.7% Native American, 0.7% Asian, 0.2% Pacific Islander, and 2.2% from other races. The median household income was $50,000, and the median age was 40 years.
Conclusion
Peaceful Valley is a small, rural community located in the foothills of the Cascade Mountains in Snohomish County, Washington. The area is characterized by rolling hills, dense forests, and numerous rivers and streams. The community is primarily an agricultural area, with a number of small farms and ranches, as well as the Everett Mall, which is the largest shopping center in the area. The population of Peaceful Valley is approximately 1,000 people, with a median household income of $50,000 and a median age of 40 years.
Common Questions
What is Per Capita Income in Peaceful Valley?
Per Capita income in Peaceful Valley is $22,107.
What is the Median Family Income in Peaceful Valley?
Median Family Income in Peaceful Valley is $49,831.
What is the Median Household income in Peaceful Valley?
Median Household Income in Peaceful Valley is $50,845.
What is Income or Wage Gap in Peaceful Valley?
Income or Wage Gap in Peaceful Valley is 10.6%.
Women in Peaceful Valley earn 89.4 cents for every dollar earned by a man.
What is Family Income Deficit in Peaceful Valley?
Family Income Deficit in Peaceful Valley is $8,992.
Families that are below poverty line in Peaceful Valley earn $8,992 less on average than the poverty threshold level.
What is Inequality or Gini Index in Peaceful Valley?
Inequality or Gini Index in Peaceful Valley is 0.41.
What is the Total Population of Peaceful Valley?
Total Population of Peaceful Valley is 2,715.
What is the Total Male Population of Peaceful Valley?
Total Male Population of Peaceful Valley is 1,602.
What is the Total Female Population of Peaceful Valley?
Total Female Population of Peaceful Valley is 1,113.
What is the Ratio of Males per 100 Females in Peaceful Valley?
There are 143.94 Males per 100 Females in Peaceful Valley.
What is the Ratio of Females per 100 Males in Peaceful Valley?
There are 69.48 Females per 100 Males in Peaceful Valley.
What is the Median Population Age in Peaceful Valley?
Median Population Age in Peaceful Valley is 41.4 Years.
What is the Average Family Size in Peaceful Valley
Average Family Size in Peaceful Valley is 3.1 People.
What is the Average Household Size in Peaceful Valley
Average Household Size in Peaceful Valley is 2.6 People.
How Large is the Labor Force in Peaceful Valley?
There are 963 People in the Labor Forcein in Peaceful Valley.
What is the Percentage of People in the Labor Force in Peaceful Valley?
42.2% of People are in the Labor Force in Peaceful Valley.
What is the Unemployment Rate in Peaceful Valley?
Unemployment Rate in Peaceful Valley is 5.2%.