Woodland, WA Map & Demographics
Woodland Map
Woodland Overview
$31,577
PER CAPITA INCOME
$78,821
AVG FAMILY INCOME
$78,870
AVG HOUSEHOLD INCOME
41.9%
WAGE / INCOME GAP [ % ]
58.1¢/ $1
WAGE / INCOME GAP [ $ ]
0.38
INEQUALITY / GINI INDEX
6,463
TOTAL POPULATION
3,101
MALE POPULATION
3,362
FEMALE POPULATION
92.24
MALES / 100 FEMALES
108.42
FEMALES / 100 MALES
36.7
MEDIAN AGE
3.1
AVG FAMILY SIZE
2.6
AVG HOUSEHOLD SIZE
3,111
LABOR FORCE [ PEOPLE ]
64.8%
PERCENT IN LABOR FORCE
6.8%
UNEMPLOYMENT RATE
Woodland Zip Codes
Woodland Area Codes
Income in Woodland
Income Overview in Woodland
Per Capita Income in Woodland is $31,577, while median incomes of families and households are $78,821 and $78,870 respectively.
| Characteristic | Number | Measure |
| Per Capita Income | 6,463 | $31,577 |
| Median Family Income | 1,688 | $78,821 |
| Mean Family Income | 1,688 | $86,797 |
| Median Household Income | 2,465 | $78,870 |
| Mean Household Income | 2,465 | $83,829 |
| Income Deficit | 1,688 | $0 |
| Wage / Income Gap (%) | 6,463 | 41.88% |
| Wage / Income Gap ($) | 6,463 | 58.12¢ per $1 |
| Gini / Inequality Index | 6,463 | 0.38 |
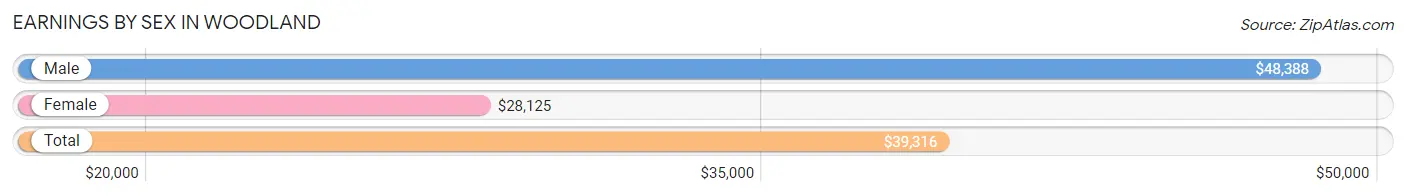
Earnings by Sex in Woodland
Average Earnings in Woodland are $39,316, $48,388 for men and $28,125 for women, a difference of 41.9%.
| Sex | Number | Average Earnings |
| Male | 1,733 (55.6%) | $48,388 |
| Female | 1,384 (44.4%) | $28,125 |
| Total | 3,117 (100.0%) | $39,316 |
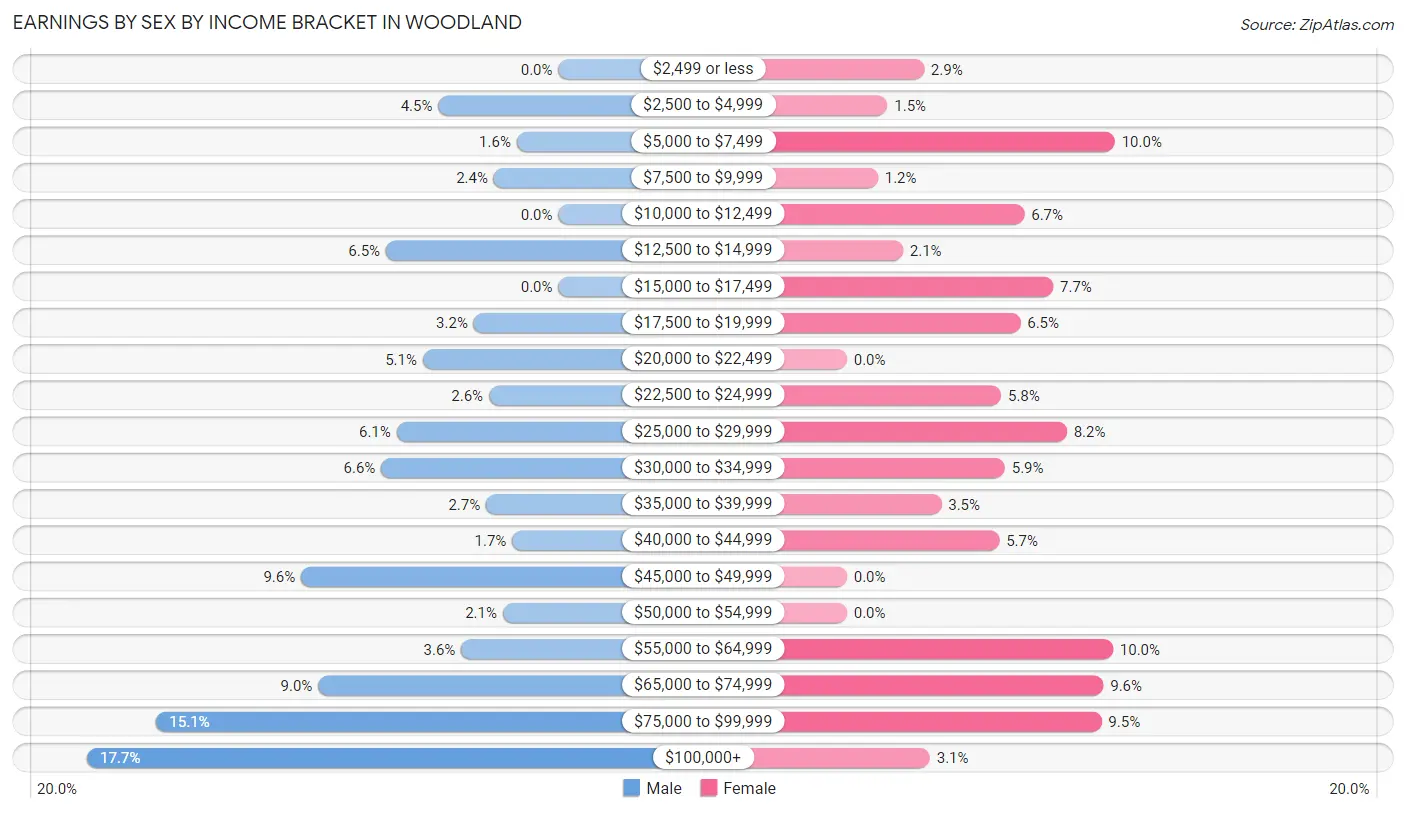
Earnings by Sex by Income Bracket in Woodland
The most common earnings brackets in Woodland are $100,000+ for men (306 | 17.7%) and $5,000 to $7,499 for women (139 | 10.0%).
| Income | Male | Female |
| $2,499 or less | 0 (0.0%) | 40 (2.9%) |
| $2,500 to $4,999 | 78 (4.5%) | 21 (1.5%) |
| $5,000 to $7,499 | 27 (1.6%) | 139 (10.0%) |
| $7,500 to $9,999 | 42 (2.4%) | 16 (1.2%) |
| $10,000 to $12,499 | 0 (0.0%) | 92 (6.7%) |
| $12,500 to $14,999 | 112 (6.5%) | 29 (2.1%) |
| $15,000 to $17,499 | 0 (0.0%) | 107 (7.7%) |
| $17,500 to $19,999 | 55 (3.2%) | 90 (6.5%) |
| $20,000 to $22,499 | 88 (5.1%) | 0 (0.0%) |
| $22,500 to $24,999 | 45 (2.6%) | 80 (5.8%) |
| $25,000 to $29,999 | 105 (6.1%) | 114 (8.2%) |
| $30,000 to $34,999 | 115 (6.6%) | 82 (5.9%) |
| $35,000 to $39,999 | 47 (2.7%) | 49 (3.5%) |
| $40,000 to $44,999 | 30 (1.7%) | 79 (5.7%) |
| $45,000 to $49,999 | 167 (9.6%) | 0 (0.0%) |
| $50,000 to $54,999 | 36 (2.1%) | 0 (0.0%) |
| $55,000 to $64,999 | 63 (3.6%) | 138 (10.0%) |
| $65,000 to $74,999 | 156 (9.0%) | 133 (9.6%) |
| $75,000 to $99,999 | 261 (15.1%) | 132 (9.5%) |
| $100,000+ | 306 (17.7%) | 43 (3.1%) |
| Total | 1,733 (100.0%) | 1,384 (100.0%) |
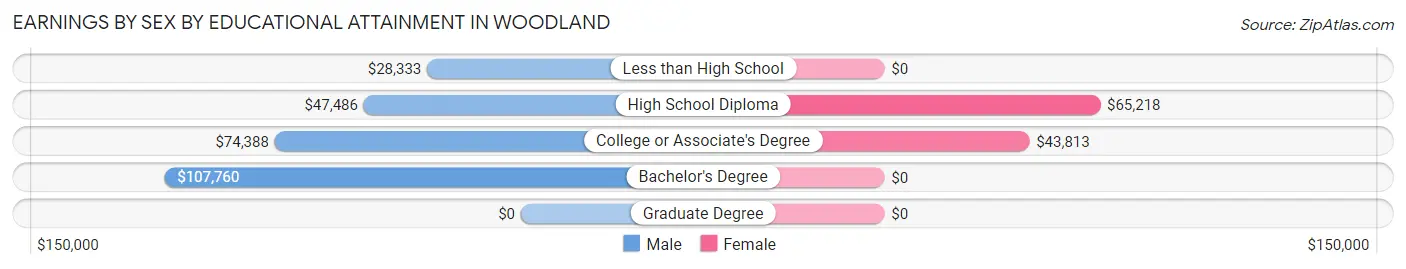
Earnings by Sex by Educational Attainment in Woodland
Average earnings in Woodland are $64,565 for men and $34,135 for women, a difference of 47.1%. Men with an educational attainment of bachelor's degree enjoy the highest average annual earnings of $107,760, while those with less than high school education earn the least with $28,333. Women with an educational attainment of high school diploma earn the most with the average annual earnings of $65,218, while those with college or associate's degree education have the smallest earnings of $43,813.
| Educational Attainment | Male Income | Female Income |
| Less than High School | $28,333 | $0 |
| High School Diploma | $47,486 | $65,218 |
| College or Associate's Degree | $74,388 | $43,813 |
| Bachelor's Degree | $107,760 | $0 |
| Graduate Degree | - | - |
| Total | $64,565 | $34,135 |
Family Income in Woodland
Family Income Brackets in Woodland
According to the Woodland family income data, there are 456 families falling into the $75,000 to $99,999 income range, which is the most common income bracket and makes up 27.0% of all families.
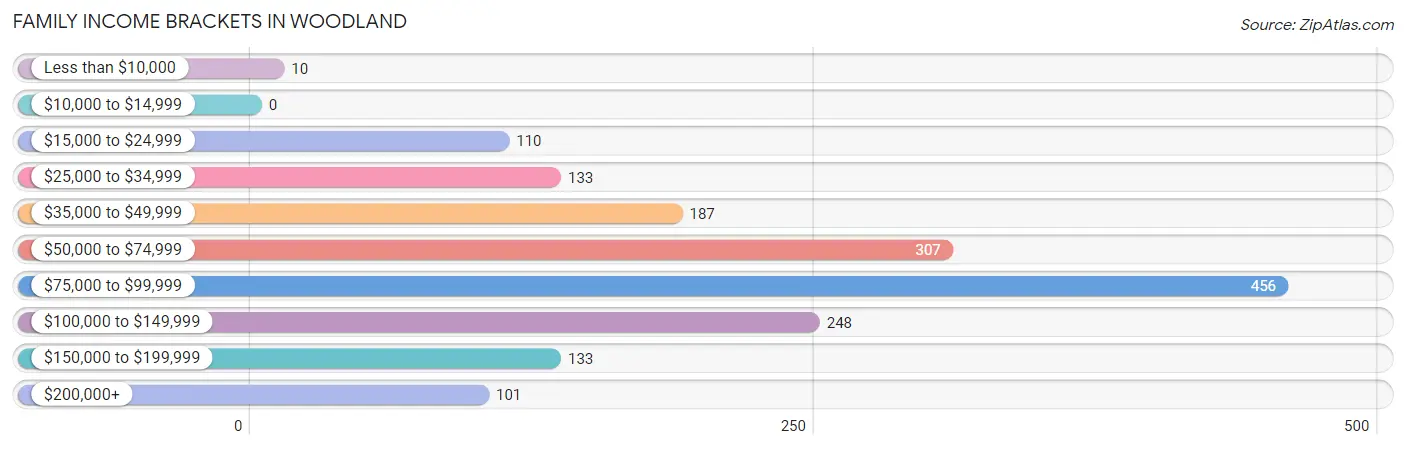
| Income Bracket | # Families | % Families |
| Less than $10,000 | 10 | 0.6% |
| $10,000 to $14,999 | 0 | 0.0% |
| $15,000 to $24,999 | 110 | 6.5% |
| $25,000 to $34,999 | 133 | 7.9% |
| $35,000 to $49,999 | 187 | 11.1% |
| $50,000 to $74,999 | 307 | 18.2% |
| $75,000 to $99,999 | 456 | 27.0% |
| $100,000 to $149,999 | 248 | 14.7% |
| $150,000 to $199,999 | 133 | 7.9% |
| $200,000+ | 101 | 6.0% |
Family Income by Famaliy Size in Woodland
4-person families (371 | 22.0%) account for the highest median family income in Woodland with $85,683 per family, while 2-person families (572 | 33.9%) have the highest median income of $29,203 per family member.
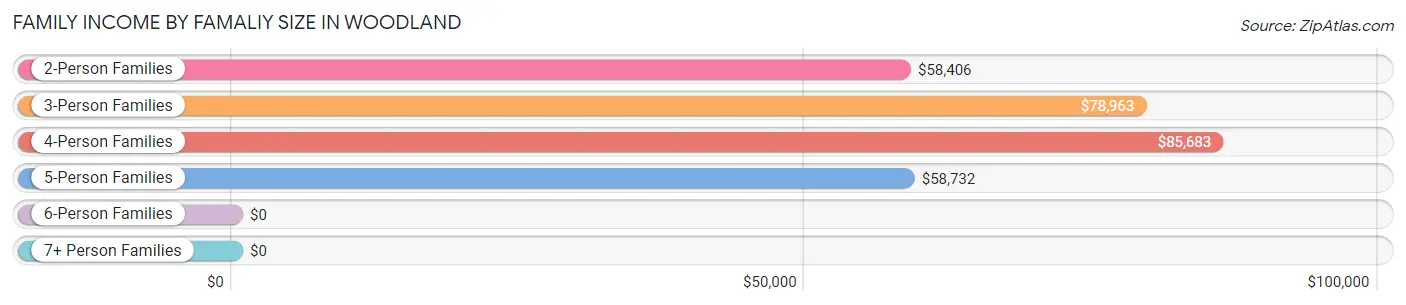
| Income Bracket | # Families | Median Income |
| 2-Person Families | 572 (33.9%) | $58,406 |
| 3-Person Families | 518 (30.7%) | $78,963 |
| 4-Person Families | 371 (22.0%) | $85,683 |
| 5-Person Families | 160 (9.5%) | $58,732 |
| 6-Person Families | 29 (1.7%) | $0 |
| 7+ Person Families | 38 (2.2%) | $0 |
| Total | 1,688 (100.0%) | $78,821 |
Family Income by Number of Earners in Woodland
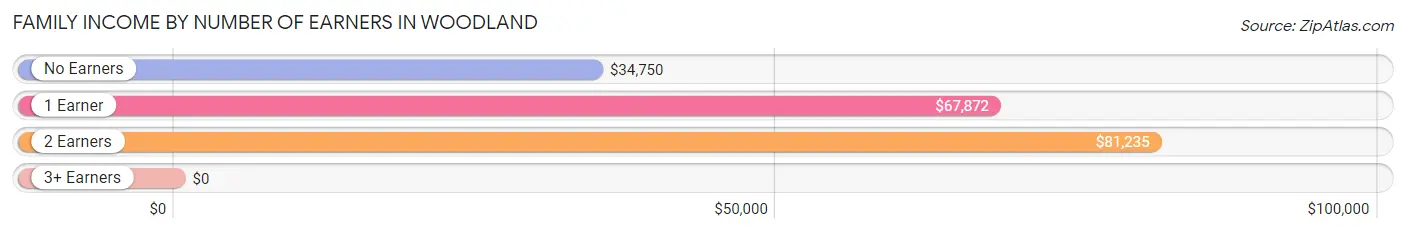
| Number of Earners | # Families | Median Income |
| No Earners | 216 (12.8%) | $34,750 |
| 1 Earner | 741 (43.9%) | $67,872 |
| 2 Earners | 549 (32.5%) | $81,235 |
| 3+ Earners | 182 (10.8%) | $0 |
| Total | 1,688 (100.0%) | $78,821 |
Household Income in Woodland
Household Income Brackets in Woodland
With 498 households falling in the category, the $75,000 to $99,999 income range is the most frequent in Woodland, accounting for 20.2% of all households. In contrast, only 30 households (1.2%) fall into the less than $10,000 income bracket, making it the least populous group.
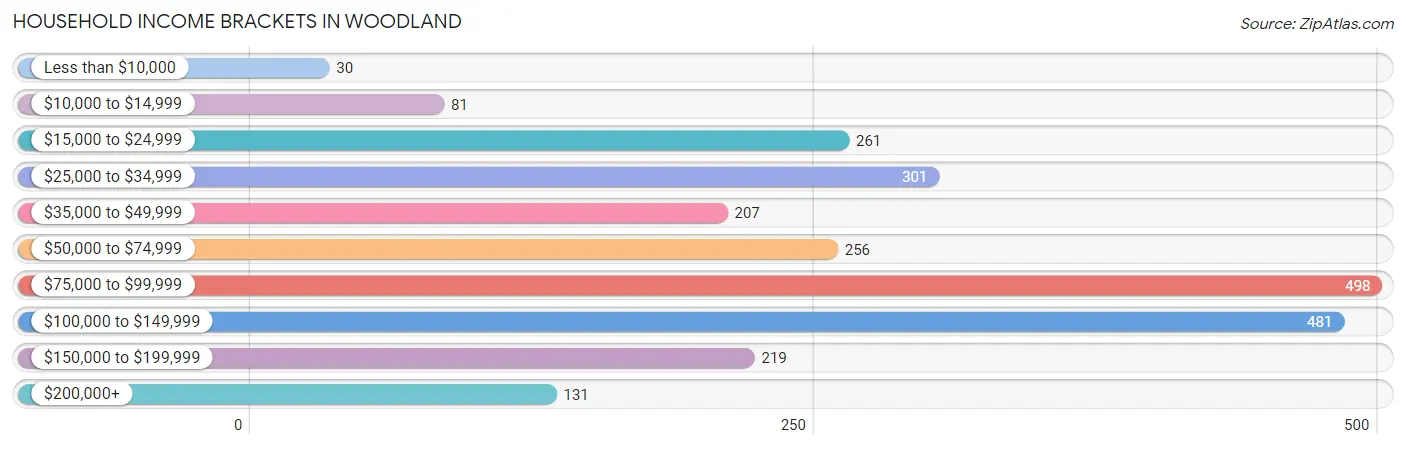
| Income Bracket | # Households | % Households |
| Less than $10,000 | 30 | 1.2% |
| $10,000 to $14,999 | 81 | 3.3% |
| $15,000 to $24,999 | 261 | 10.6% |
| $25,000 to $34,999 | 301 | 12.2% |
| $35,000 to $49,999 | 207 | 8.4% |
| $50,000 to $74,999 | 256 | 10.4% |
| $75,000 to $99,999 | 498 | 20.2% |
| $100,000 to $149,999 | 481 | 19.5% |
| $150,000 to $199,999 | 219 | 8.9% |
| $200,000+ | 131 | 5.3% |
Household Income by Householder Age in Woodland
The median household income in Woodland is $78,870, with the highest median household income of $85,911 found in the 45 to 64 years age bracket for the primary householder. A total of 842 households (34.2%) fall into this category. Meanwhile, the 15 to 24 years age bracket for the primary householder has the lowest median household income of $0, with 196 households (8.0%) in this group.
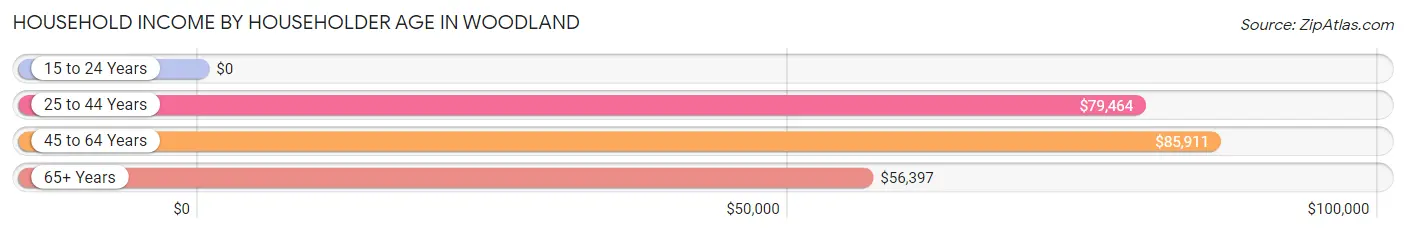
| Income Bracket | # Households | Median Income |
| 15 to 24 Years | 196 (8.0%) | $0 |
| 25 to 44 Years | 691 (28.0%) | $79,464 |
| 45 to 64 Years | 842 (34.2%) | $85,911 |
| 65+ Years | 736 (29.9%) | $56,397 |
| Total | 2,465 (100.0%) | $78,870 |
Poverty in Woodland
Income Below Poverty by Sex and Age in Woodland
With 9.1% poverty level for males and 9.0% for females among the residents of Woodland, 15 year old males and 12 to 14 year old females are the most vulnerable to poverty, with 35 males (33.0%) and 60 females (29.6%) in their respective age groups living below the poverty level.
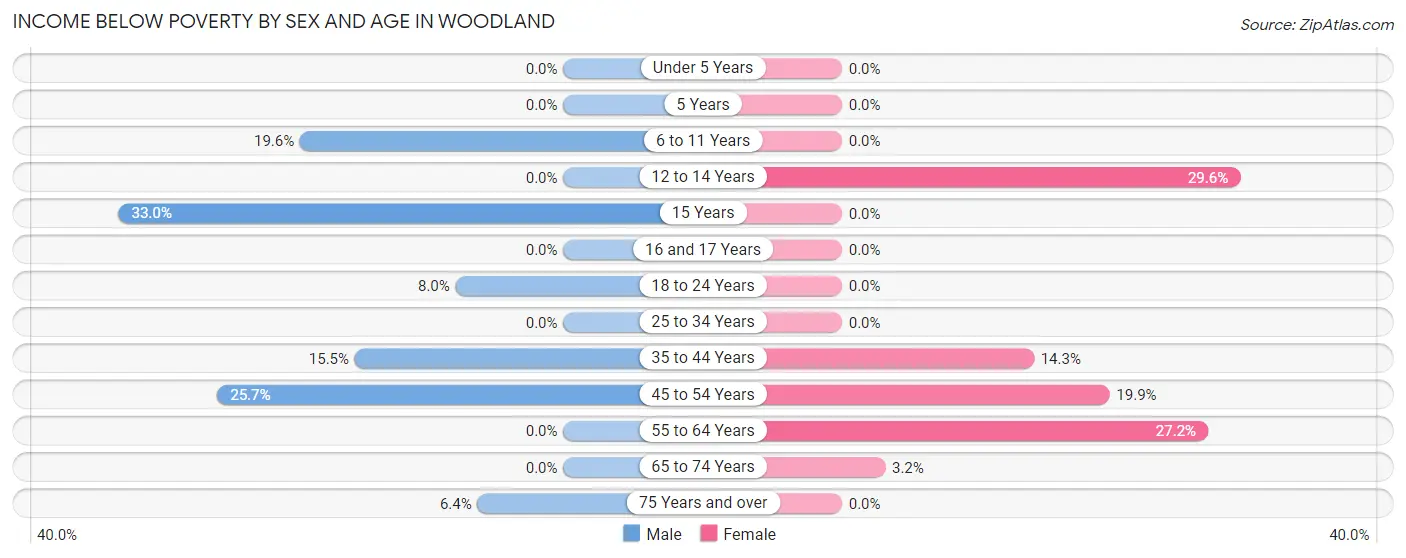
| Age Bracket | Male | Female |
| Under 5 Years | 0 (0.0%) | 0 (0.0%) |
| 5 Years | 0 (0.0%) | 0 (0.0%) |
| 6 to 11 Years | 35 (19.6%) | 0 (0.0%) |
| 12 to 14 Years | 0 (0.0%) | 60 (29.6%) |
| 15 Years | 35 (33.0%) | 0 (0.0%) |
| 16 and 17 Years | 0 (0.0%) | 0 (0.0%) |
| 18 to 24 Years | 36 (8.0%) | 0 (0.0%) |
| 25 to 34 Years | 0 (0.0%) | 0 (0.0%) |
| 35 to 44 Years | 50 (15.5%) | 54 (14.2%) |
| 45 to 54 Years | 112 (25.7%) | 92 (19.9%) |
| 55 to 64 Years | 0 (0.0%) | 78 (27.2%) |
| 65 to 74 Years | 0 (0.0%) | 13 (3.2%) |
| 75 Years and over | 10 (6.4%) | 0 (0.0%) |
| Total | 278 (9.1%) | 297 (9.0%) |
Income Above Poverty by Sex and Age in Woodland
According to the poverty statistics in Woodland, males aged under 5 years and females aged under 5 years are the age groups that are most secure financially, with 100.0% of males and 100.0% of females in these age groups living above the poverty line.
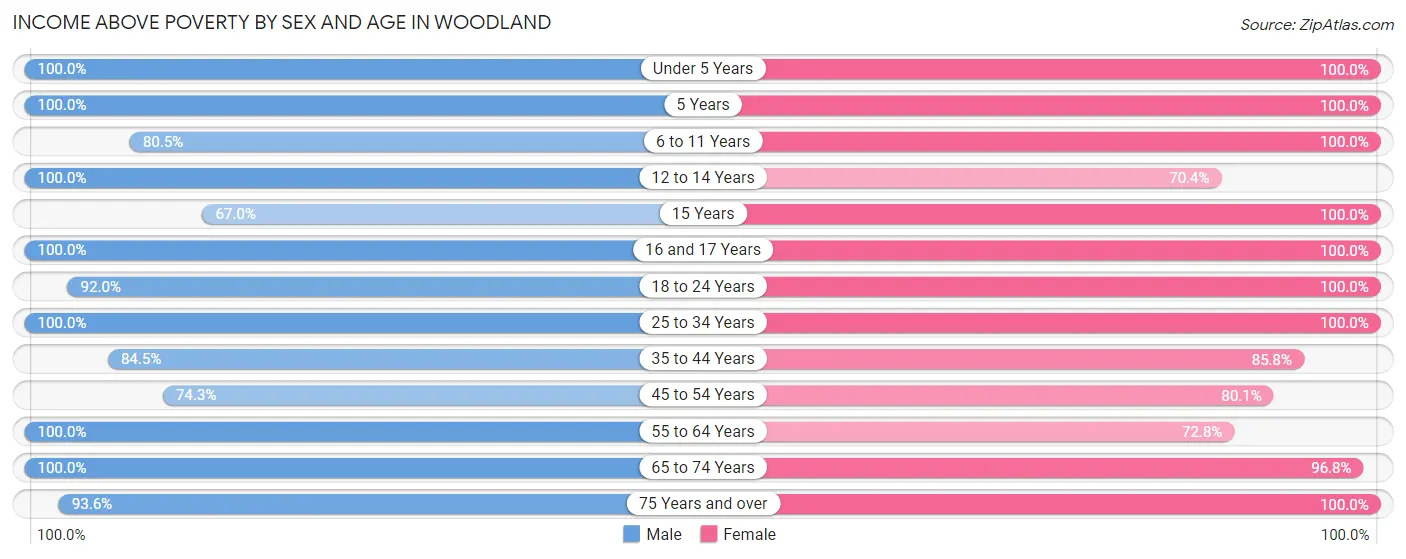
| Age Bracket | Male | Female |
| Under 5 Years | 221 (100.0%) | 148 (100.0%) |
| 5 Years | 81 (100.0%) | 62 (100.0%) |
| 6 to 11 Years | 144 (80.4%) | 464 (100.0%) |
| 12 to 14 Years | 147 (100.0%) | 143 (70.4%) |
| 15 Years | 71 (67.0%) | 17 (100.0%) |
| 16 and 17 Years | 116 (100.0%) | 96 (100.0%) |
| 18 to 24 Years | 414 (92.0%) | 262 (100.0%) |
| 25 to 34 Years | 278 (100.0%) | 261 (100.0%) |
| 35 to 44 Years | 273 (84.5%) | 325 (85.8%) |
| 45 to 54 Years | 324 (74.3%) | 371 (80.1%) |
| 55 to 64 Years | 266 (100.0%) | 209 (72.8%) |
| 65 to 74 Years | 290 (100.0%) | 392 (96.8%) |
| 75 Years and over | 147 (93.6%) | 264 (100.0%) |
| Total | 2,772 (90.9%) | 3,014 (91.0%) |
Income Below Poverty Among Married-Couple Families in Woodland
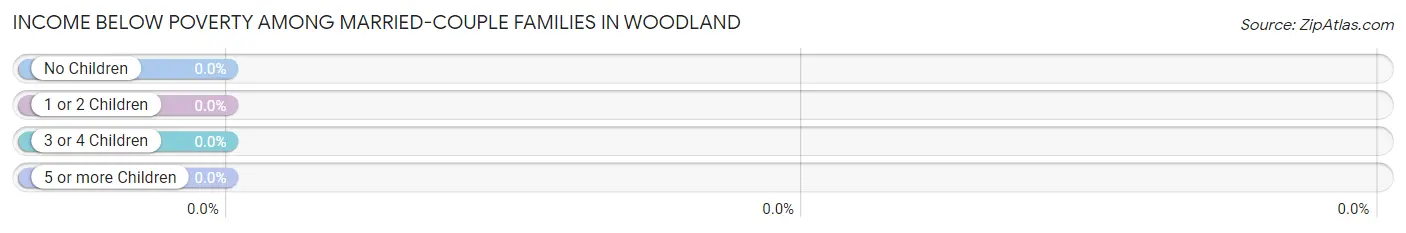
| Children | Above Poverty | Below Poverty |
| No Children | 612 (100.0%) | 0 (0.0%) |
| 1 or 2 Children | 445 (100.0%) | 0 (0.0%) |
| 3 or 4 Children | 22 (100.0%) | 0 (0.0%) |
| 5 or more Children | 38 (100.0%) | 0 (0.0%) |
| Total | 1,117 (100.0%) | 0 (0.0%) |
Income Below Poverty Among Single-Parent Households in Woodland
According to the poverty data in Woodland, 8.6% or 10 single-father households and 21.6% or 98 single-mother households are living below the poverty line. Among single-father households, those with no children have the highest poverty rate, with 10 households (100.0%) experiencing poverty. Likewise, among single-mother households, those with 1 or 2 children have the highest poverty rate, with 98 households (35.4%) falling below the poverty line.
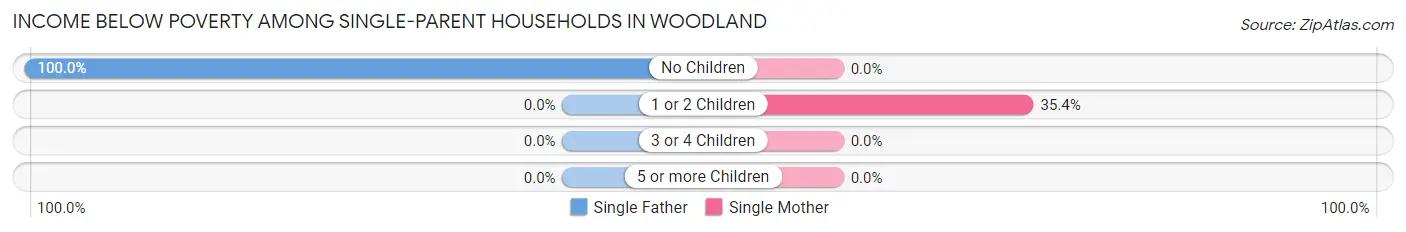
| Children | Single Father | Single Mother |
| No Children | 10 (100.0%) | 0 (0.0%) |
| 1 or 2 Children | 0 (0.0%) | 98 (35.4%) |
| 3 or 4 Children | 0 (0.0%) | 0 (0.0%) |
| 5 or more Children | 0 (0.0%) | 0 (0.0%) |
| Total | 10 (8.6%) | 98 (21.6%) |
Income Below Poverty Among Married-Couple vs Single-Parent Households in Woodland
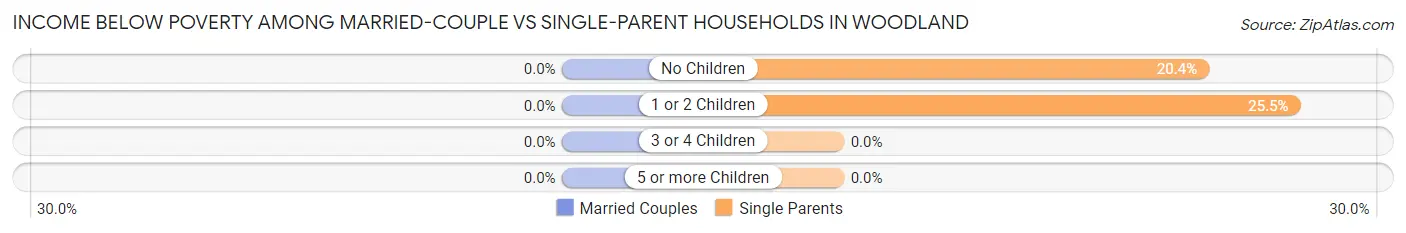
| Children | Married-Couple Families | Single-Parent Households |
| No Children | 0 (0.0%) | 10 (20.4%) |
| 1 or 2 Children | 0 (0.0%) | 98 (25.5%) |
| 3 or 4 Children | 0 (0.0%) | 0 (0.0%) |
| 5 or more Children | 0 (0.0%) | 0 (0.0%) |
| Total | 0 (0.0%) | 108 (18.9%) |
Race in Woodland
The most populous races in Woodland are White / Caucasian (5,317 | 82.3%), Hispanic or Latino (1,613 | 25.0%), and Two or more Races (787 | 12.2%).
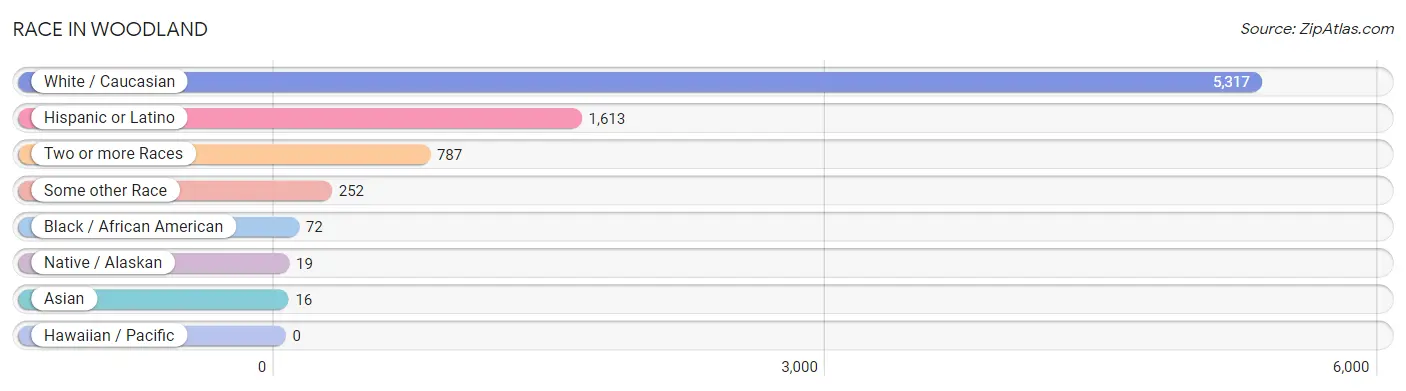
| Race | # Population | % Population |
| Asian | 16 | 0.3% |
| Black / African American | 72 | 1.1% |
| Hawaiian / Pacific | 0 | 0.0% |
| Hispanic or Latino | 1,613 | 25.0% |
| Native / Alaskan | 19 | 0.3% |
| White / Caucasian | 5,317 | 82.3% |
| Two or more Races | 787 | 12.2% |
| Some other Race | 252 | 3.9% |
| Total | 6,463 | 100.0% |
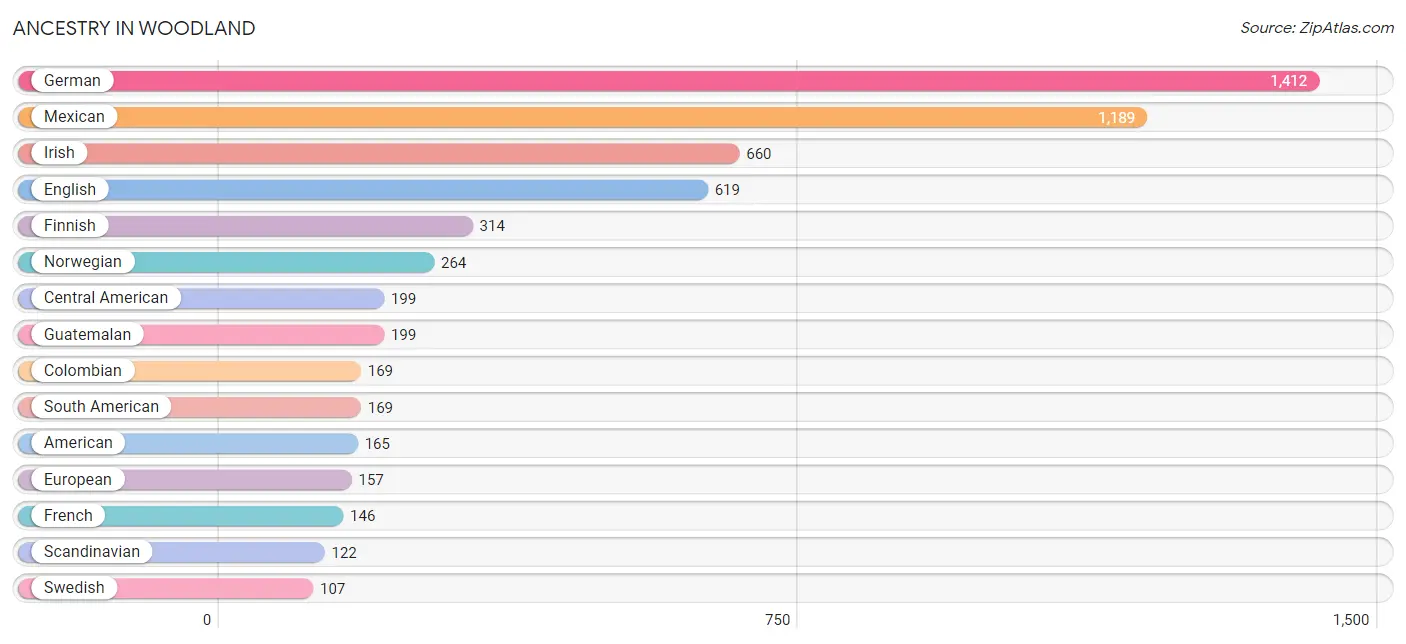
Ancestry in Woodland
The most populous ancestries reported in Woodland are German (1,412 | 21.8%), Mexican (1,189 | 18.4%), Irish (660 | 10.2%), English (619 | 9.6%), and Finnish (314 | 4.9%), together accounting for 64.9% of all Woodland residents.
| Ancestry | # Population | % Population |
| American | 165 | 2.5% |
| Austrian | 103 | 1.6% |
| Basque | 29 | 0.4% |
| Belgian | 14 | 0.2% |
| Bhutanese | 52 | 0.8% |
| Canadian | 30 | 0.5% |
| Central American | 199 | 3.1% |
| Colombian | 169 | 2.6% |
| Czech | 10 | 0.2% |
| Danish | 50 | 0.8% |
| Dutch | 60 | 0.9% |
| Eastern European | 13 | 0.2% |
| English | 619 | 9.6% |
| European | 157 | 2.4% |
| Finnish | 314 | 4.9% |
| French | 146 | 2.3% |
| French Canadian | 24 | 0.4% |
| German | 1,412 | 21.8% |
| Greek | 11 | 0.2% |
| Guatemalan | 199 | 3.1% |
| Hungarian | 26 | 0.4% |
| Irish | 660 | 10.2% |
| Italian | 74 | 1.1% |
| Korean | 14 | 0.2% |
| Menominee | 18 | 0.3% |
| Mexican | 1,189 | 18.4% |
| Northern European | 39 | 0.6% |
| Norwegian | 264 | 4.1% |
| Polish | 31 | 0.5% |
| Portuguese | 26 | 0.4% |
| Russian | 55 | 0.9% |
| Scandinavian | 122 | 1.9% |
| Sioux | 11 | 0.2% |
| South American | 169 | 2.6% |
| Spaniard | 27 | 0.4% |
| Swedish | 107 | 1.7% |
| Swiss | 22 | 0.3% |
| Welsh | 13 | 0.2% | View All 38 Rows |
Immigrants in Woodland
The most numerous immigrant groups reported in Woodland came from Latin America (473 | 7.3%), Central America (421 | 6.5%), Mexico (317 | 4.9%), Guatemala (104 | 1.6%), and Colombia (52 | 0.8%), together accounting for 21.1% of all Woodland residents.
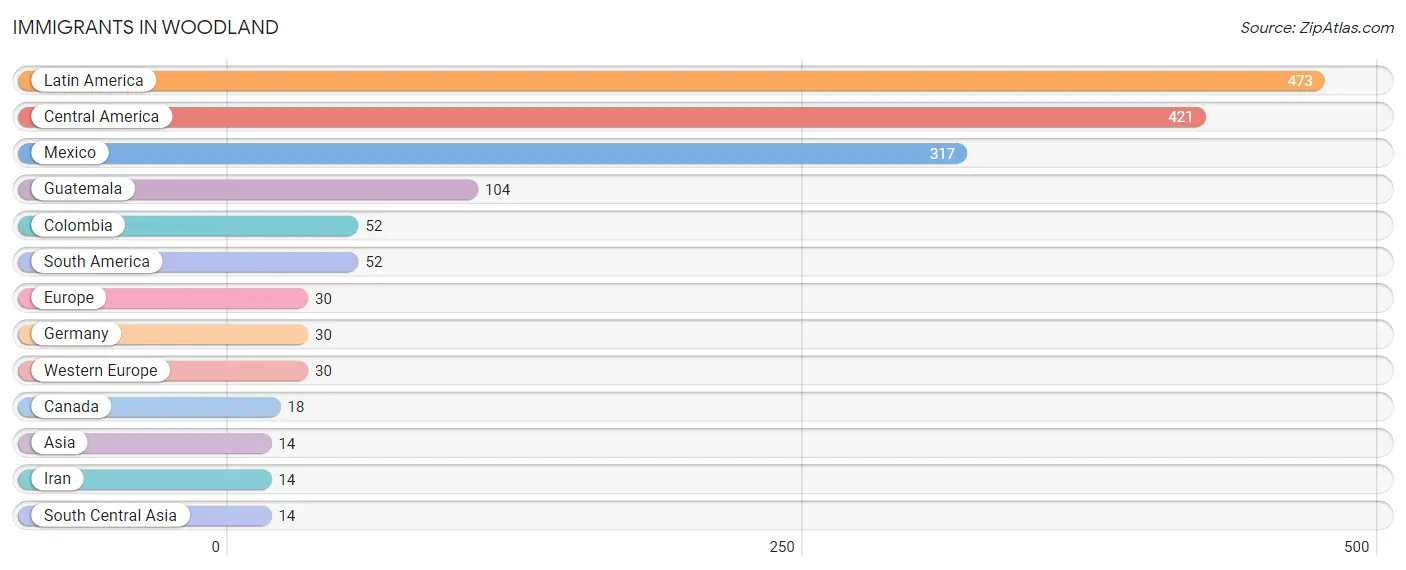
| Immigration Origin | # Population | % Population |
| Asia | 14 | 0.2% |
| Canada | 18 | 0.3% |
| Central America | 421 | 6.5% |
| Colombia | 52 | 0.8% |
| Europe | 30 | 0.5% |
| Germany | 30 | 0.5% |
| Guatemala | 104 | 1.6% |
| Iran | 14 | 0.2% |
| Latin America | 473 | 7.3% |
| Mexico | 317 | 4.9% |
| South America | 52 | 0.8% |
| South Central Asia | 14 | 0.2% |
| Western Europe | 30 | 0.5% | View All 13 Rows |
Sex and Age in Woodland
Sex and Age in Woodland
The most populous age groups in Woodland are 20 to 24 Years (422 | 13.6%) for men and 5 to 9 Years (386 | 11.5%) for women.
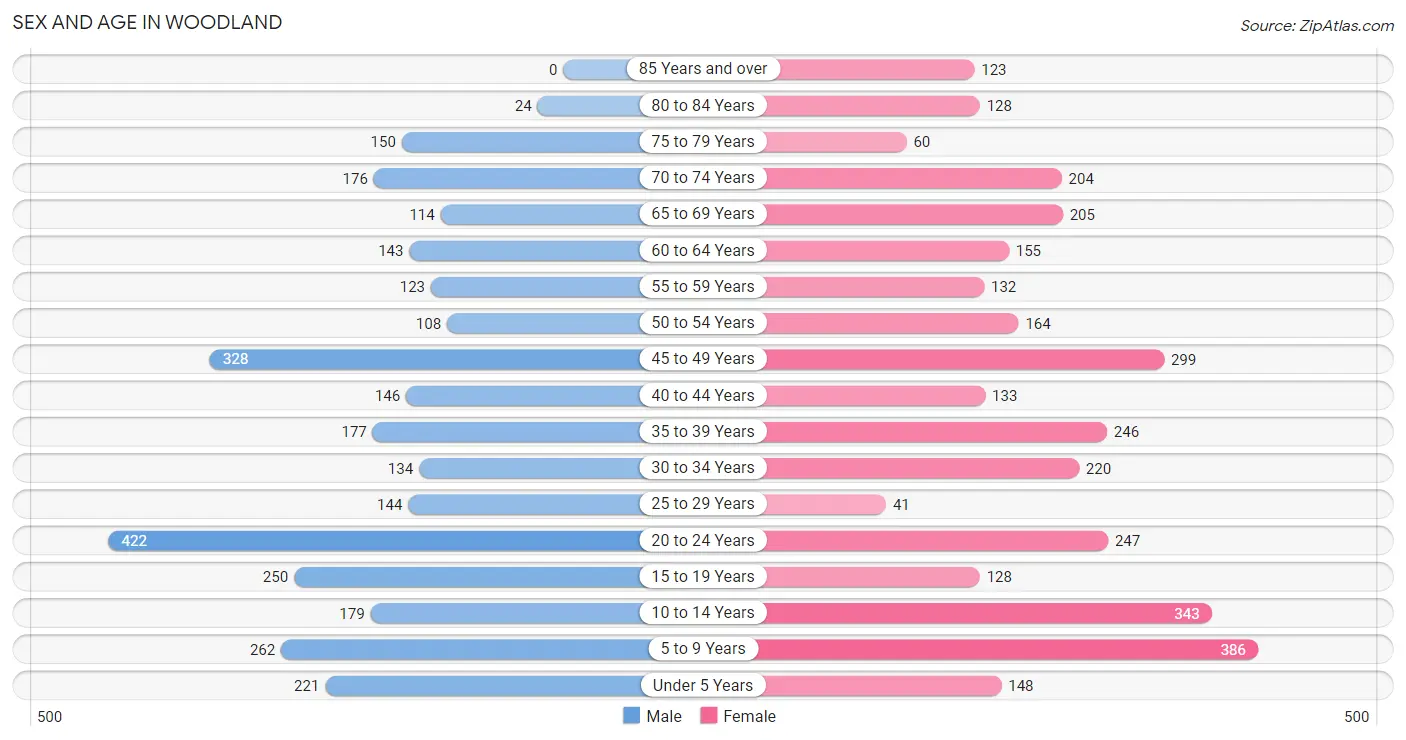
| Age Bracket | Male | Female |
| Under 5 Years | 221 (7.1%) | 148 (4.4%) |
| 5 to 9 Years | 262 (8.5%) | 386 (11.5%) |
| 10 to 14 Years | 179 (5.8%) | 343 (10.2%) |
| 15 to 19 Years | 250 (8.1%) | 128 (3.8%) |
| 20 to 24 Years | 422 (13.6%) | 247 (7.3%) |
| 25 to 29 Years | 144 (4.6%) | 41 (1.2%) |
| 30 to 34 Years | 134 (4.3%) | 220 (6.5%) |
| 35 to 39 Years | 177 (5.7%) | 246 (7.3%) |
| 40 to 44 Years | 146 (4.7%) | 133 (4.0%) |
| 45 to 49 Years | 328 (10.6%) | 299 (8.9%) |
| 50 to 54 Years | 108 (3.5%) | 164 (4.9%) |
| 55 to 59 Years | 123 (4.0%) | 132 (3.9%) |
| 60 to 64 Years | 143 (4.6%) | 155 (4.6%) |
| 65 to 69 Years | 114 (3.7%) | 205 (6.1%) |
| 70 to 74 Years | 176 (5.7%) | 204 (6.1%) |
| 75 to 79 Years | 150 (4.8%) | 60 (1.8%) |
| 80 to 84 Years | 24 (0.8%) | 128 (3.8%) |
| 85 Years and over | 0 (0.0%) | 123 (3.7%) |
| Total | 3,101 (100.0%) | 3,362 (100.0%) |
Families and Households in Woodland
Median Family Size in Woodland
The median family size in Woodland is 3.13 persons per family, with single female/mother families (454 | 26.9%) accounting for the largest median family size of 3.46 persons per family. On the other hand, single male/father families (117 | 6.9%) represent the smallest median family size with 2.81 persons per family.
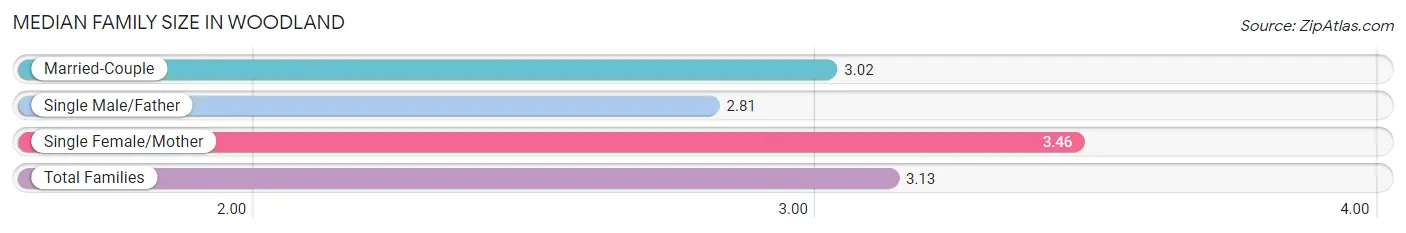
| Family Type | # Families | Family Size |
| Married-Couple | 1,117 (66.2%) | 3.02 |
| Single Male/Father | 117 (6.9%) | 2.81 |
| Single Female/Mother | 454 (26.9%) | 3.46 |
| Total Families | 1,688 (100.0%) | 3.13 |
Median Household Size in Woodland
The median household size in Woodland is 2.59 persons per household, with single female/mother households (454 | 18.4%) accounting for the largest median household size of 3.68 persons per household. non-family households (777 | 31.5%) represent the smallest median household size with 1.20 persons per household.
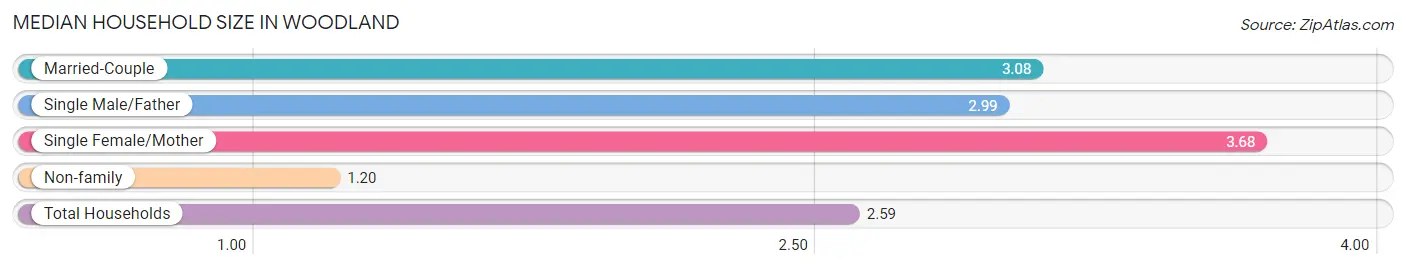
| Household Type | # Households | Household Size |
| Married-Couple | 1,117 (45.3%) | 3.08 |
| Single Male/Father | 117 (4.8%) | 2.99 |
| Single Female/Mother | 454 (18.4%) | 3.68 |
| Non-family | 777 (31.5%) | 1.20 |
| Total Households | 2,465 (100.0%) | 2.59 |
Household Size by Marriage Status in Woodland
Out of a total of 2,465 households in Woodland, 1,688 (68.5%) are family households, while 777 (31.5%) are nonfamily households. The most numerous type of family households are 2-person households, comprising 518, and the most common type of nonfamily households are 1-person households, comprising 710.
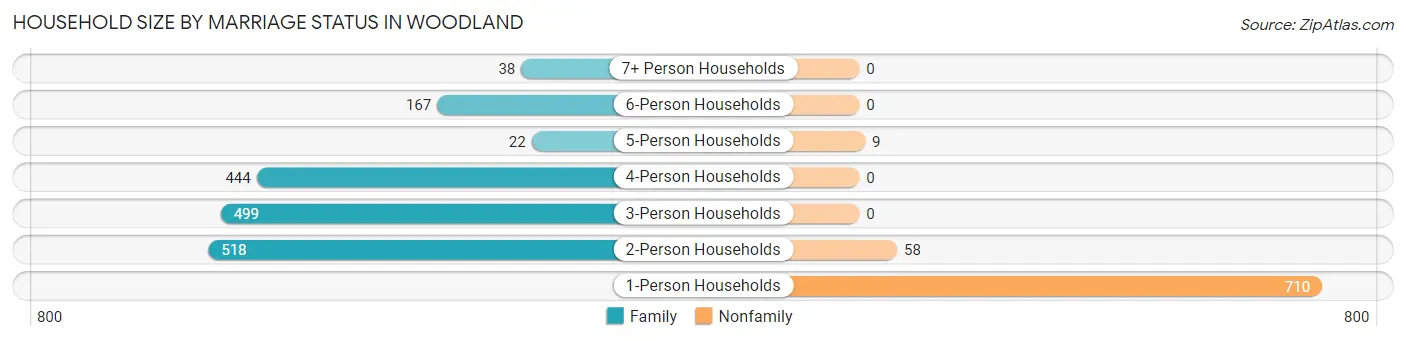
| Household Size | Family Households | Nonfamily Households |
| 1-Person Households | - | 710 (28.8%) |
| 2-Person Households | 518 (21.0%) | 58 (2.4%) |
| 3-Person Households | 499 (20.2%) | 0 (0.0%) |
| 4-Person Households | 444 (18.0%) | 0 (0.0%) |
| 5-Person Households | 22 (0.9%) | 9 (0.4%) |
| 6-Person Households | 167 (6.8%) | 0 (0.0%) |
| 7+ Person Households | 38 (1.5%) | 0 (0.0%) |
| Total | 1,688 (68.5%) | 777 (31.5%) |
Female Fertility in Woodland
Fertility by Age in Woodland
Average fertility rate in Woodland is 88.0 births per 1,000 women. Women in the age bracket of 20 to 34 years have the highest fertility rate with 207.0 births per 1,000 women. Women in the age bracket of 20 to 34 years acount for 90.5% of all women with births.
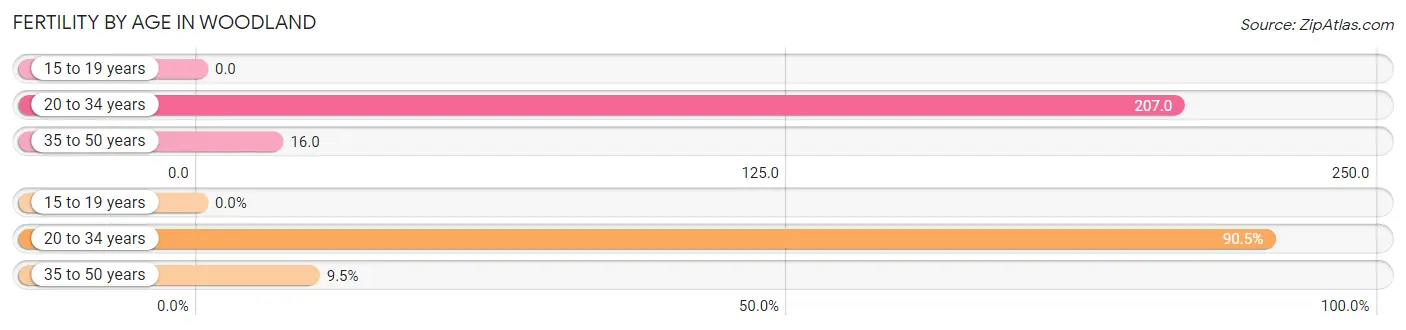
| Age Bracket | Women with Births | Births / 1,000 Women |
| 15 to 19 years | 0 (0.0%) | 0.0 |
| 20 to 34 years | 105 (90.5%) | 207.0 |
| 35 to 50 years | 11 (9.5%) | 16.0 |
| Total | 116 (100.0%) | 88.0 |
Fertility by Age by Marriage Status in Woodland
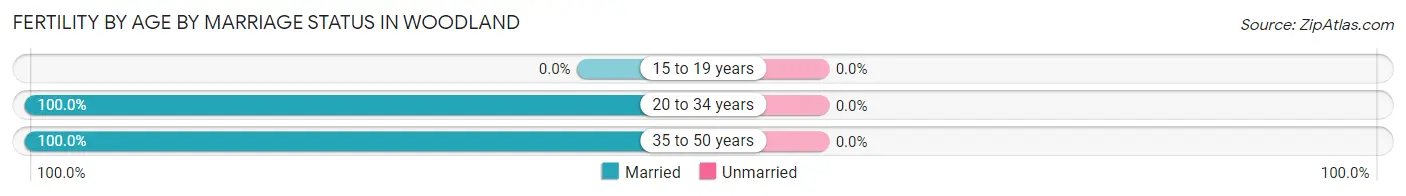
| Age Bracket | Married | Unmarried |
| 15 to 19 years | 0 (0.0%) | 0 (0.0%) |
| 20 to 34 years | 105 (100.0%) | 0 (0.0%) |
| 35 to 50 years | 11 (100.0%) | 0 (0.0%) |
| Total | 116 (100.0%) | 0 (0.0%) |
Fertility by Education in Woodland
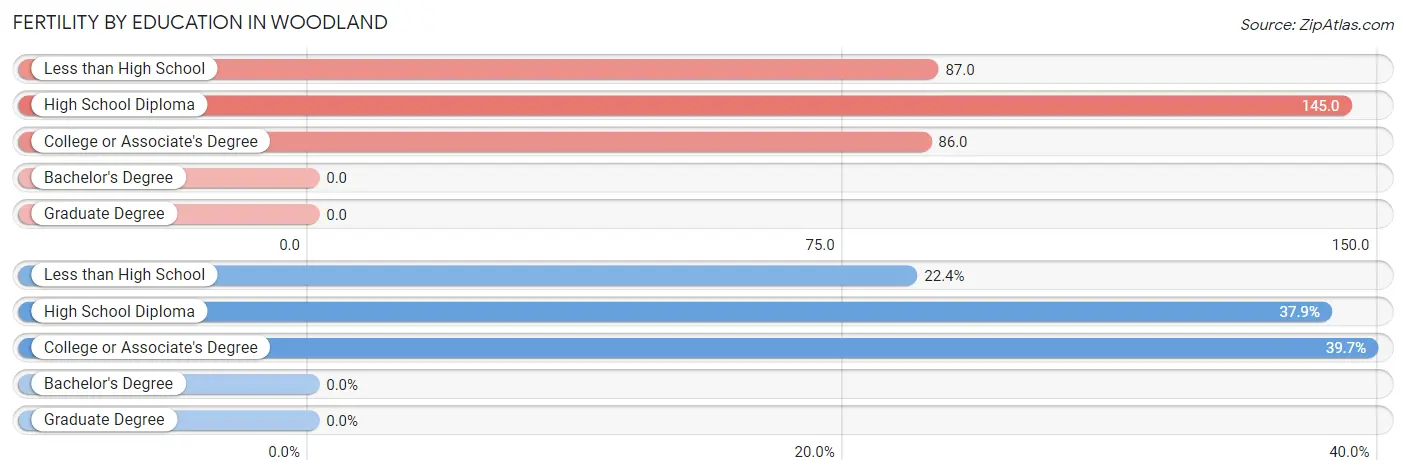
| Educational Attainment | Women with Births | Births / 1,000 Women |
| Less than High School | 26 (22.4%) | 87.0 |
| High School Diploma | 44 (37.9%) | 145.0 |
| College or Associate's Degree | 46 (39.7%) | 86.0 |
| Bachelor's Degree | 0 (0.0%) | 0.0 |
| Graduate Degree | 0 (0.0%) | 0.0 |
| Total | 116 (100.0%) | 88.0 |
Fertility by Education by Marriage Status in Woodland
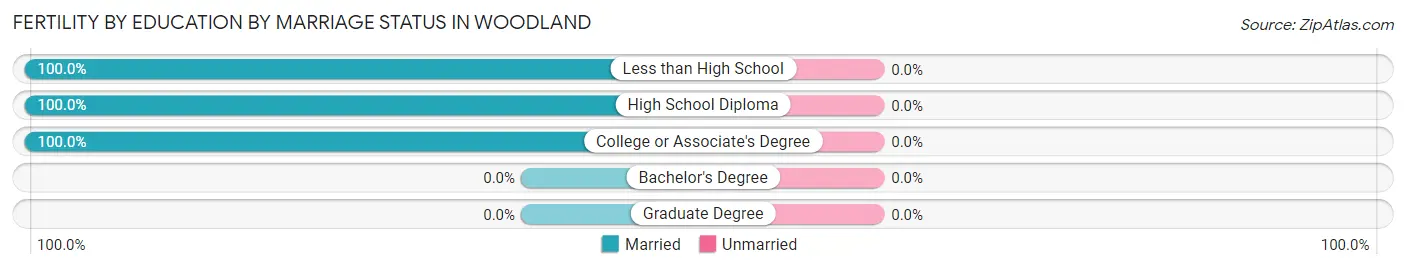
| Educational Attainment | Married | Unmarried |
| Less than High School | 26 (100.0%) | 0 (0.0%) |
| High School Diploma | 44 (100.0%) | 0 (0.0%) |
| College or Associate's Degree | 46 (100.0%) | 0 (0.0%) |
| Bachelor's Degree | 0 (0.0%) | 0 (0.0%) |
| Graduate Degree | 0 (0.0%) | 0 (0.0%) |
| Total | 116 (100.0%) | 0 (0.0%) |
Employment Characteristics in Woodland
Employment by Class of Employer in Woodland
Among the 2,891 employed individuals in Woodland, private company employees (2,117 | 73.2%), not-for-profit organizations (236 | 8.2%), and self-employed (not incorporated) (219 | 7.6%) make up the most common classes of employment.
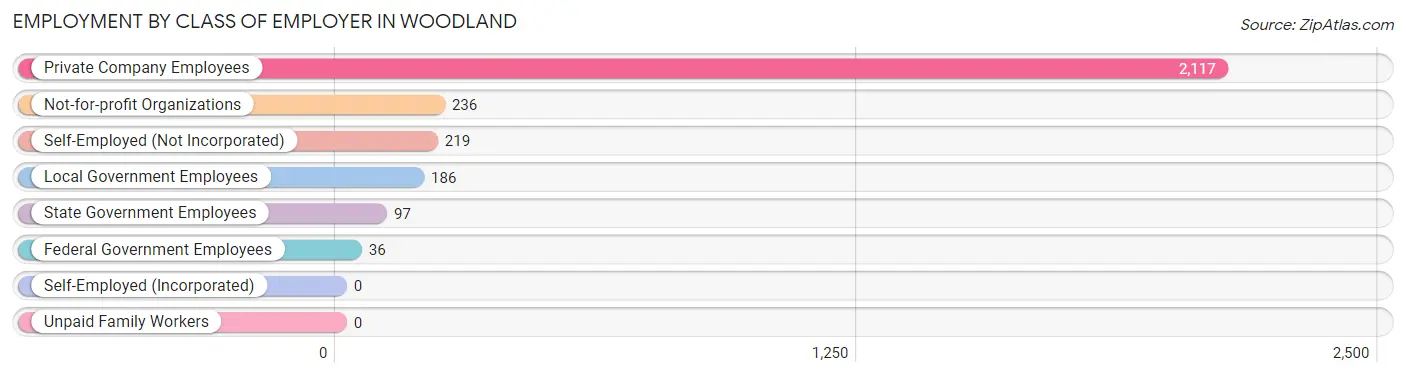
| Employer Class | # Employees | % Employees |
| Private Company Employees | 2,117 | 73.2% |
| Self-Employed (Incorporated) | 0 | 0.0% |
| Self-Employed (Not Incorporated) | 219 | 7.6% |
| Not-for-profit Organizations | 236 | 8.2% |
| Local Government Employees | 186 | 6.4% |
| State Government Employees | 97 | 3.4% |
| Federal Government Employees | 36 | 1.3% |
| Unpaid Family Workers | 0 | 0.0% |
| Total | 2,891 | 100.0% |
Employment Status by Age in Woodland
According to the labor force statistics for Woodland, out of the total population over 16 years of age (4,801), 64.8% or 3,111 individuals are in the labor force, with 6.8% or 212 of them unemployed. The age group with the highest labor force participation rate is 30 to 34 years, with 96.3% or 341 individuals in the labor force. Within the labor force, the 20 to 24 years age range has the highest percentage of unemployed individuals, with 23.7% or 137 of them being unemployed.
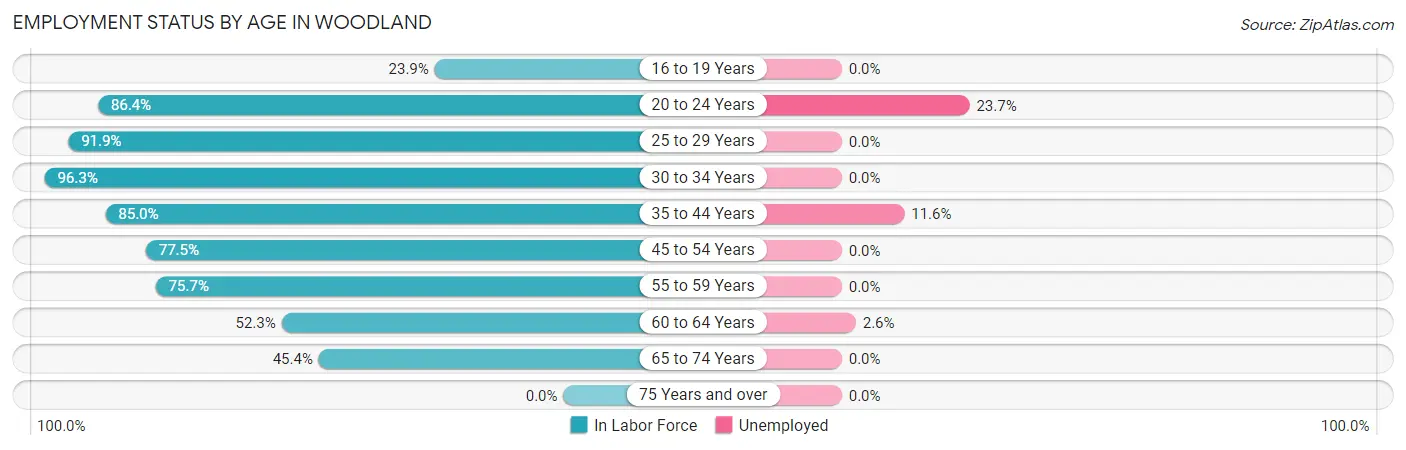
| Age Bracket | In Labor Force | Unemployed |
| 16 to 19 Years | 61 (23.9%) | 0 (0.0%) |
| 20 to 24 Years | 578 (86.4%) | 137 (23.7%) |
| 25 to 29 Years | 170 (91.9%) | 0 (0.0%) |
| 30 to 34 Years | 341 (96.3%) | 0 (0.0%) |
| 35 to 44 Years | 597 (85.0%) | 69 (11.6%) |
| 45 to 54 Years | 697 (77.5%) | 0 (0.0%) |
| 55 to 59 Years | 193 (75.7%) | 0 (0.0%) |
| 60 to 64 Years | 156 (52.3%) | 4 (2.6%) |
| 65 to 74 Years | 317 (45.4%) | 0 (0.0%) |
| 75 Years and over | 0 (0.0%) | 0 (0.0%) |
| Total | 3,111 (64.8%) | 212 (6.8%) |
Employment Status by Educational Attainment in Woodland
According to labor force statistics for Woodland, 80.0% of individuals (2,154) out of the total population between 25 and 64 years of age (2,693) are in the labor force, with 3.4% or 73 of them being unemployed. The group with the highest labor force participation rate are those with the educational attainment of college / associate degree, with 84.5% or 898 individuals in the labor force. Within the labor force, individuals with high school diploma education have the highest percentage of unemployment, with 12.8% or 73 of them being unemployed.
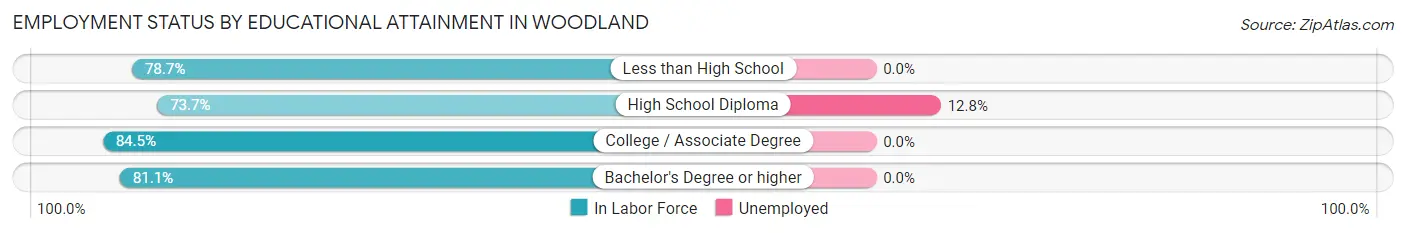
| Educational Attainment | In Labor Force | Unemployed |
| Less than High School | 269 (78.7%) | 0 (0.0%) |
| High School Diploma | 571 (73.7%) | 99 (12.8%) |
| College / Associate Degree | 898 (84.5%) | 0 (0.0%) |
| Bachelor's Degree or higher | 416 (81.1%) | 0 (0.0%) |
| Total | 2,154 (80.0%) | 92 (3.4%) |
Employment Occupations by Sex in Woodland
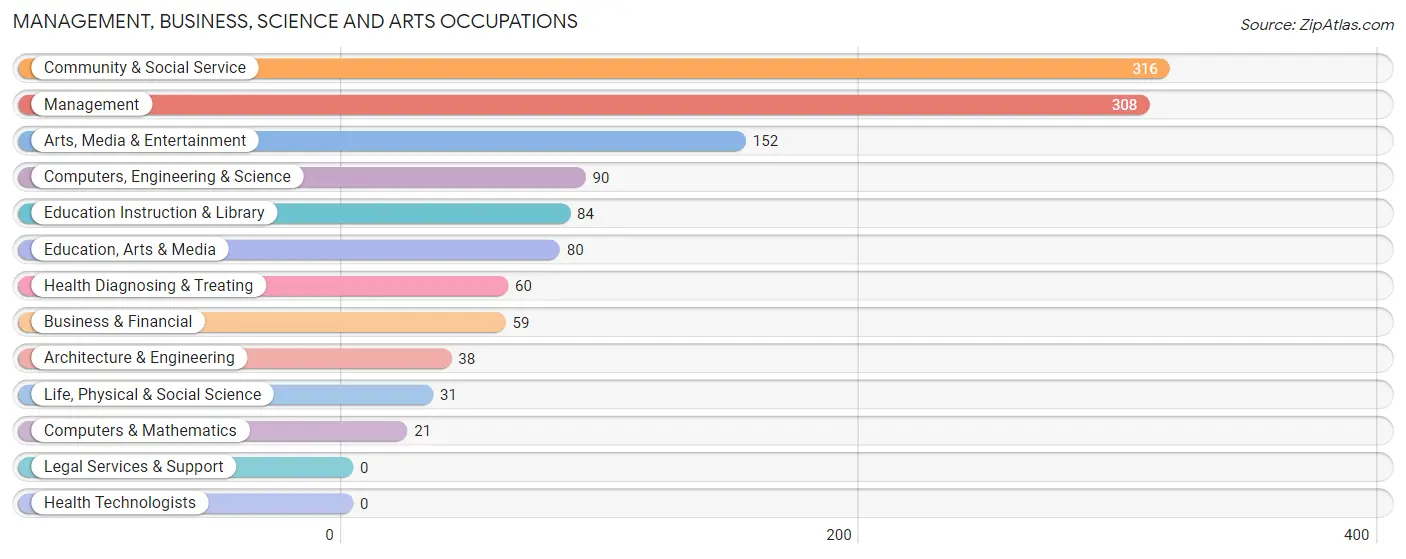
Management, Business, Science and Arts Occupations
The most common Management, Business, Science and Arts occupations in Woodland are Community & Social Service (316 | 10.9%), Management (308 | 10.6%), Arts, Media & Entertainment (152 | 5.2%), Computers, Engineering & Science (90 | 3.1%), and Education Instruction & Library (84 | 2.9%).
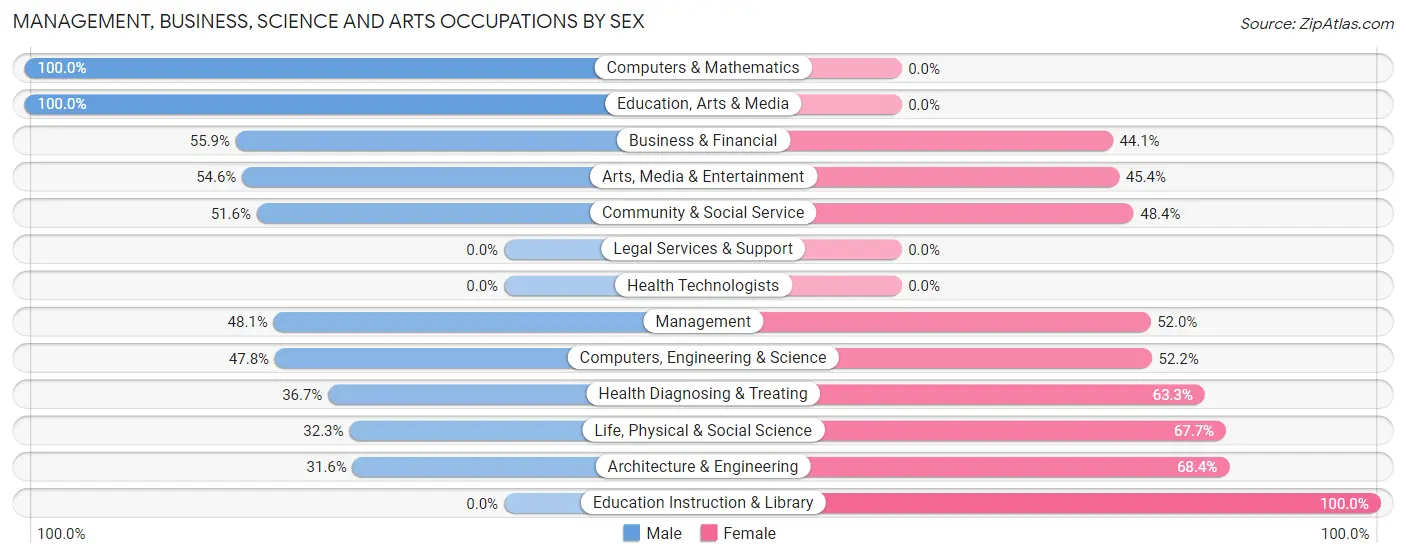
Management, Business, Science and Arts Occupations by Sex
Within the Management, Business, Science and Arts occupations in Woodland, the most male-oriented occupations are Computers & Mathematics (100.0%), Education, Arts & Media (100.0%), and Business & Financial (55.9%), while the most female-oriented occupations are Education Instruction & Library (100.0%), Architecture & Engineering (68.4%), and Life, Physical & Social Science (67.7%).
| Occupation | Male | Female |
| Management | 148 (48.0%) | 160 (51.9%) |
| Business & Financial | 33 (55.9%) | 26 (44.1%) |
| Computers, Engineering & Science | 43 (47.8%) | 47 (52.2%) |
| Computers & Mathematics | 21 (100.0%) | 0 (0.0%) |
| Architecture & Engineering | 12 (31.6%) | 26 (68.4%) |
| Life, Physical & Social Science | 10 (32.3%) | 21 (67.7%) |
| Community & Social Service | 163 (51.6%) | 153 (48.4%) |
| Education, Arts & Media | 80 (100.0%) | 0 (0.0%) |
| Legal Services & Support | 0 (0.0%) | 0 (0.0%) |
| Education Instruction & Library | 0 (0.0%) | 84 (100.0%) |
| Arts, Media & Entertainment | 83 (54.6%) | 69 (45.4%) |
| Health Diagnosing & Treating | 22 (36.7%) | 38 (63.3%) |
| Health Technologists | 0 (0.0%) | 0 (0.0%) |
| Total (Category) | 409 (49.1%) | 424 (50.9%) |
| Total (Overall) | 1,596 (55.0%) | 1,304 (45.0%) |
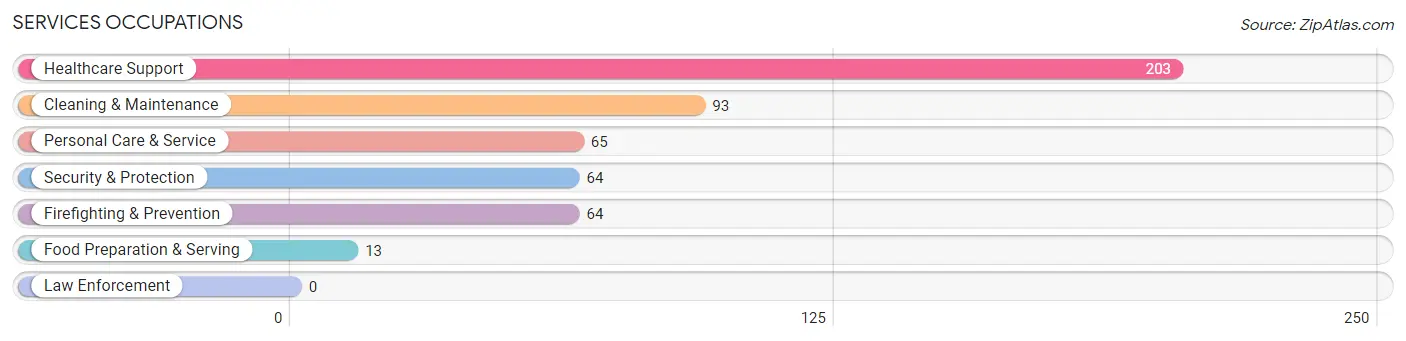
Services Occupations
The most common Services occupations in Woodland are Healthcare Support (203 | 7.0%), Cleaning & Maintenance (93 | 3.2%), Personal Care & Service (65 | 2.2%), Security & Protection (64 | 2.2%), and Firefighting & Prevention (64 | 2.2%).
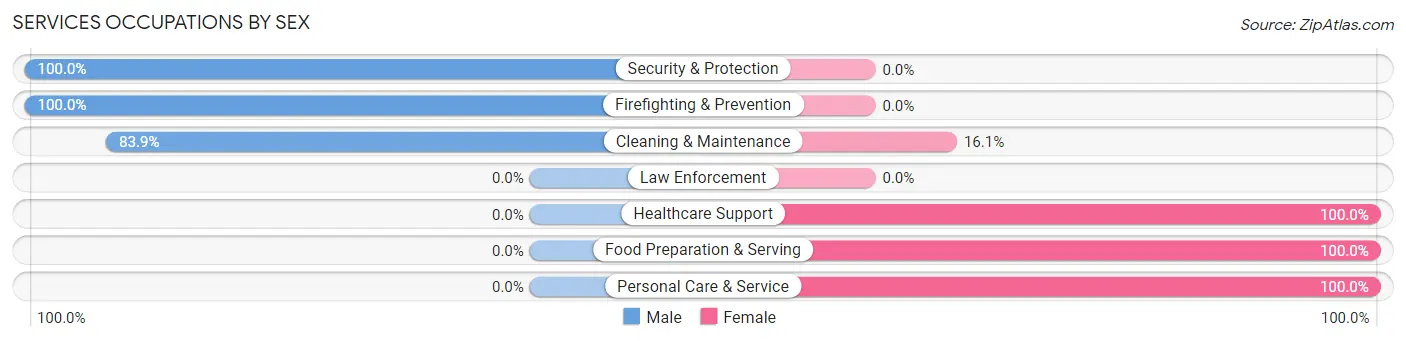
Services Occupations by Sex
Within the Services occupations in Woodland, the most male-oriented occupations are Security & Protection (100.0%), Firefighting & Prevention (100.0%), and Cleaning & Maintenance (83.9%), while the most female-oriented occupations are Healthcare Support (100.0%), Food Preparation & Serving (100.0%), and Personal Care & Service (100.0%).
| Occupation | Male | Female |
| Healthcare Support | 0 (0.0%) | 203 (100.0%) |
| Security & Protection | 64 (100.0%) | 0 (0.0%) |
| Firefighting & Prevention | 64 (100.0%) | 0 (0.0%) |
| Law Enforcement | 0 (0.0%) | 0 (0.0%) |
| Food Preparation & Serving | 0 (0.0%) | 13 (100.0%) |
| Cleaning & Maintenance | 78 (83.9%) | 15 (16.1%) |
| Personal Care & Service | 0 (0.0%) | 65 (100.0%) |
| Total (Category) | 142 (32.4%) | 296 (67.6%) |
| Total (Overall) | 1,596 (55.0%) | 1,304 (45.0%) |
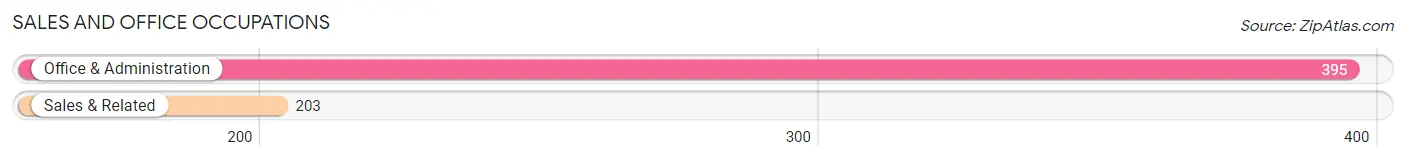
Sales and Office Occupations
The most common Sales and Office occupations in Woodland are Office & Administration (395 | 13.6%), and Sales & Related (203 | 7.0%).
Sales and Office Occupations by Sex
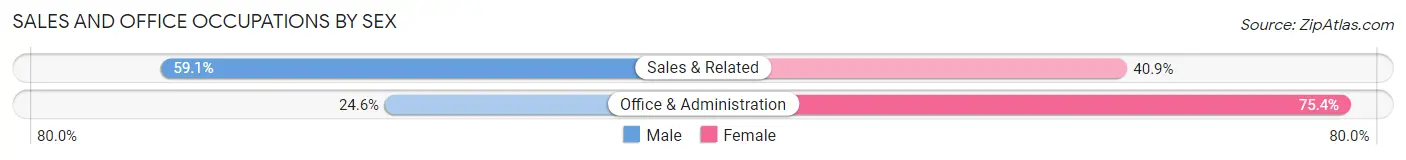
| Occupation | Male | Female |
| Sales & Related | 120 (59.1%) | 83 (40.9%) |
| Office & Administration | 97 (24.6%) | 298 (75.4%) |
| Total (Category) | 217 (36.3%) | 381 (63.7%) |
| Total (Overall) | 1,596 (55.0%) | 1,304 (45.0%) |
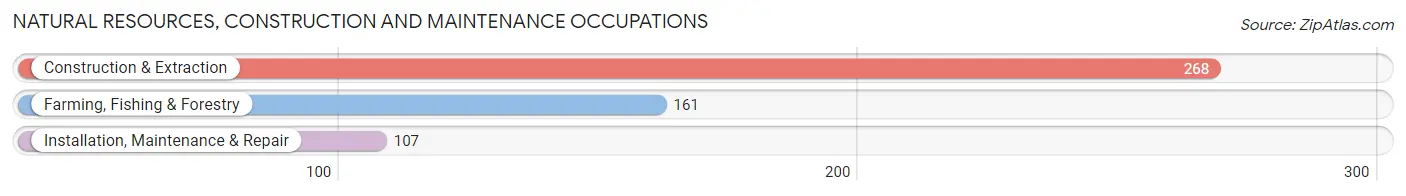
Natural Resources, Construction and Maintenance Occupations
The most common Natural Resources, Construction and Maintenance occupations in Woodland are Construction & Extraction (268 | 9.2%), Farming, Fishing & Forestry (161 | 5.6%), and Installation, Maintenance & Repair (107 | 3.7%).
Natural Resources, Construction and Maintenance Occupations by Sex
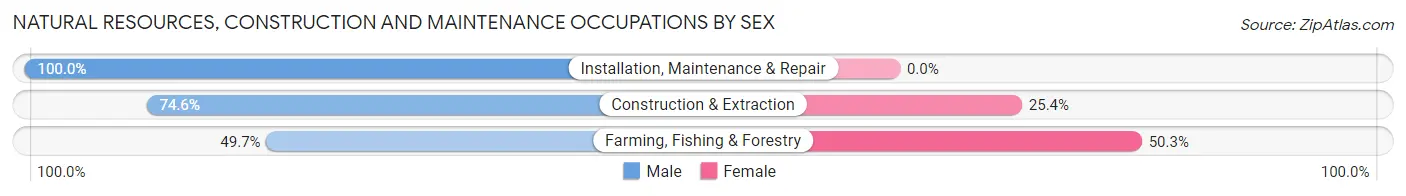
| Occupation | Male | Female |
| Farming, Fishing & Forestry | 80 (49.7%) | 81 (50.3%) |
| Construction & Extraction | 200 (74.6%) | 68 (25.4%) |
| Installation, Maintenance & Repair | 107 (100.0%) | 0 (0.0%) |
| Total (Category) | 387 (72.2%) | 149 (27.8%) |
| Total (Overall) | 1,596 (55.0%) | 1,304 (45.0%) |
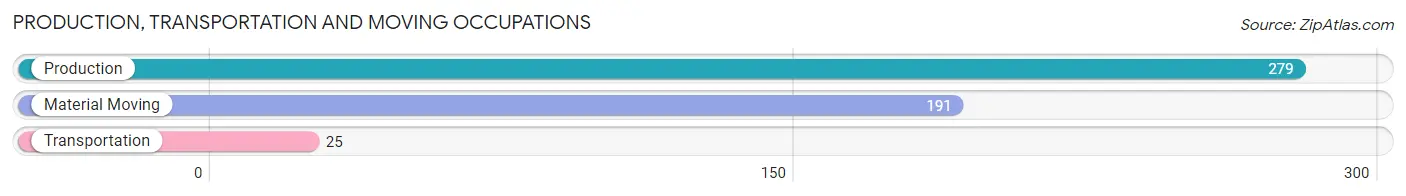
Production, Transportation and Moving Occupations
The most common Production, Transportation and Moving occupations in Woodland are Production (279 | 9.6%), Material Moving (191 | 6.6%), and Transportation (25 | 0.9%).
Production, Transportation and Moving Occupations by Sex
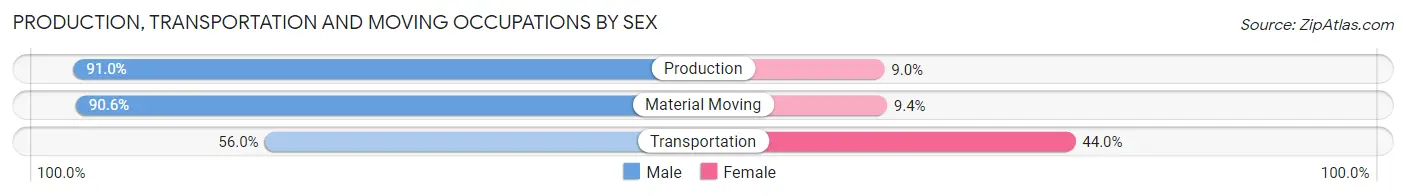
| Occupation | Male | Female |
| Production | 254 (91.0%) | 25 (9.0%) |
| Transportation | 14 (56.0%) | 11 (44.0%) |
| Material Moving | 173 (90.6%) | 18 (9.4%) |
| Total (Category) | 441 (89.1%) | 54 (10.9%) |
| Total (Overall) | 1,596 (55.0%) | 1,304 (45.0%) |
Employment Industries by Sex in Woodland
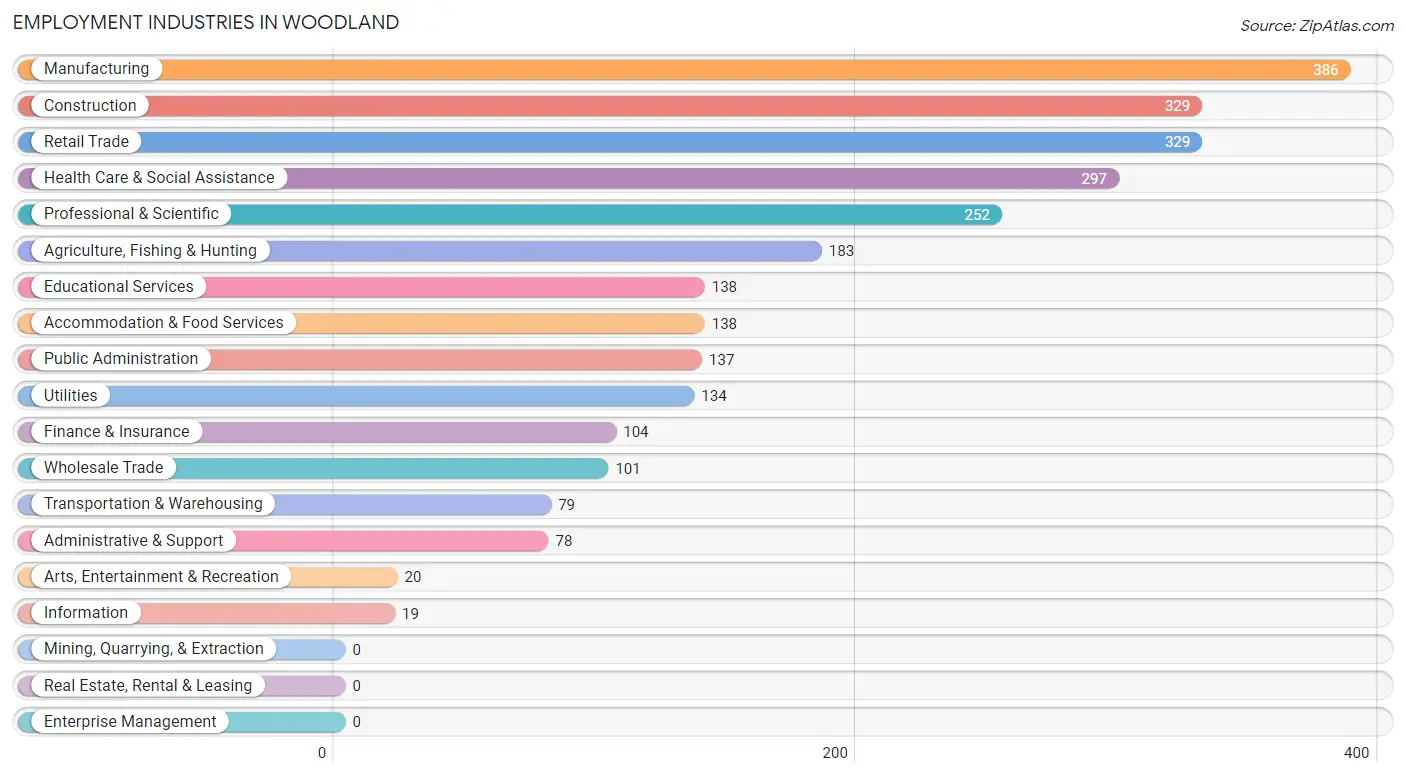
Employment Industries in Woodland
The major employment industries in Woodland include Manufacturing (386 | 13.3%), Construction (329 | 11.3%), Retail Trade (329 | 11.3%), Health Care & Social Assistance (297 | 10.2%), and Professional & Scientific (252 | 8.7%).
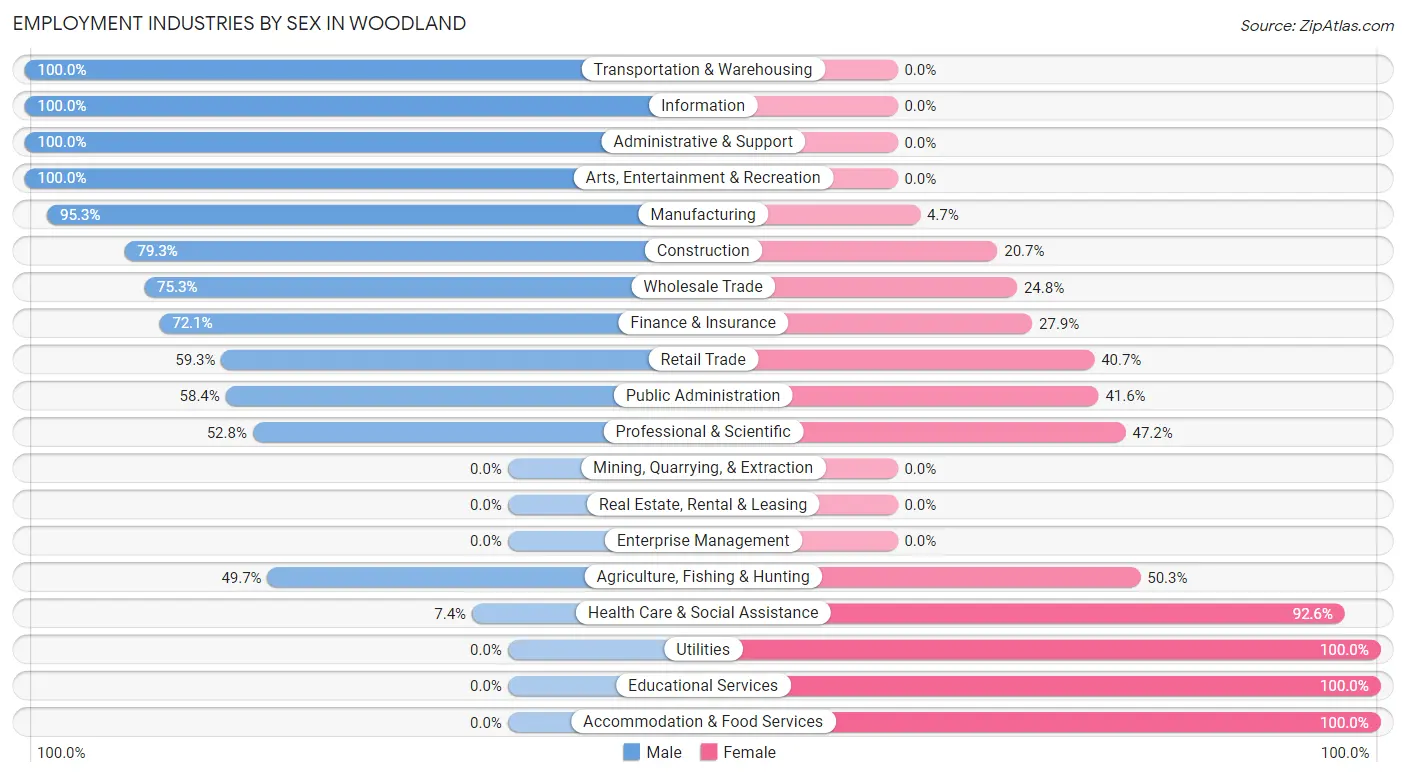
Employment Industries by Sex in Woodland
The Woodland industries that see more men than women are Transportation & Warehousing (100.0%), Information (100.0%), and Administrative & Support (100.0%), whereas the industries that tend to have a higher number of women are Utilities (100.0%), Educational Services (100.0%), and Accommodation & Food Services (100.0%).
| Industry | Male | Female |
| Agriculture, Fishing & Hunting | 91 (49.7%) | 92 (50.3%) |
| Mining, Quarrying, & Extraction | 0 (0.0%) | 0 (0.0%) |
| Construction | 261 (79.3%) | 68 (20.7%) |
| Manufacturing | 368 (95.3%) | 18 (4.7%) |
| Wholesale Trade | 76 (75.2%) | 25 (24.7%) |
| Retail Trade | 195 (59.3%) | 134 (40.7%) |
| Transportation & Warehousing | 79 (100.0%) | 0 (0.0%) |
| Utilities | 0 (0.0%) | 134 (100.0%) |
| Information | 19 (100.0%) | 0 (0.0%) |
| Finance & Insurance | 75 (72.1%) | 29 (27.9%) |
| Real Estate, Rental & Leasing | 0 (0.0%) | 0 (0.0%) |
| Professional & Scientific | 133 (52.8%) | 119 (47.2%) |
| Enterprise Management | 0 (0.0%) | 0 (0.0%) |
| Administrative & Support | 78 (100.0%) | 0 (0.0%) |
| Educational Services | 0 (0.0%) | 138 (100.0%) |
| Health Care & Social Assistance | 22 (7.4%) | 275 (92.6%) |
| Arts, Entertainment & Recreation | 20 (100.0%) | 0 (0.0%) |
| Accommodation & Food Services | 0 (0.0%) | 138 (100.0%) |
| Public Administration | 80 (58.4%) | 57 (41.6%) |
| Total | 1,596 (55.0%) | 1,304 (45.0%) |
Education in Woodland
School Enrollment in Woodland
The most common levels of schooling among the 1,661 students in Woodland are elementary school (466 | 28.1%), high school (398 | 24.0%), and middle school (352 | 21.2%).
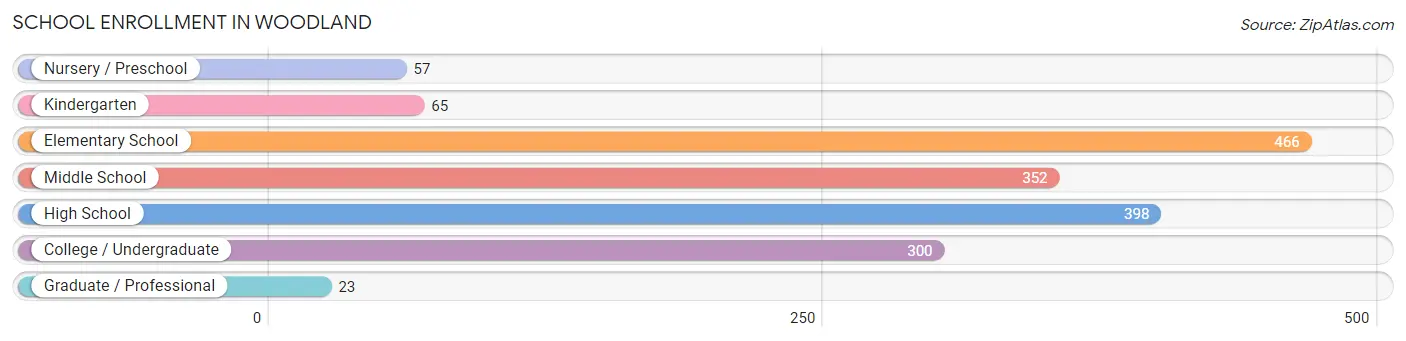
| School Level | # Students | % Students |
| Nursery / Preschool | 57 | 3.4% |
| Kindergarten | 65 | 3.9% |
| Elementary School | 466 | 28.1% |
| Middle School | 352 | 21.2% |
| High School | 398 | 24.0% |
| College / Undergraduate | 300 | 18.1% |
| Graduate / Professional | 23 | 1.4% |
| Total | 1,661 | 100.0% |
School Enrollment by Age by Funding Source in Woodland
Out of a total of 1,661 students who are enrolled in schools in Woodland, 138 (8.3%) attend a private institution, while the remaining 1,523 (91.7%) are enrolled in public schools. The age group of 35 years and over has the highest likelihood of being enrolled in private schools, with 23 (34.8% in the age bracket) enrolled. Conversely, the age group of 3 to 4 year olds has the lowest likelihood of being enrolled in a private school, with 5 (100.0% in the age bracket) attending a public institution.
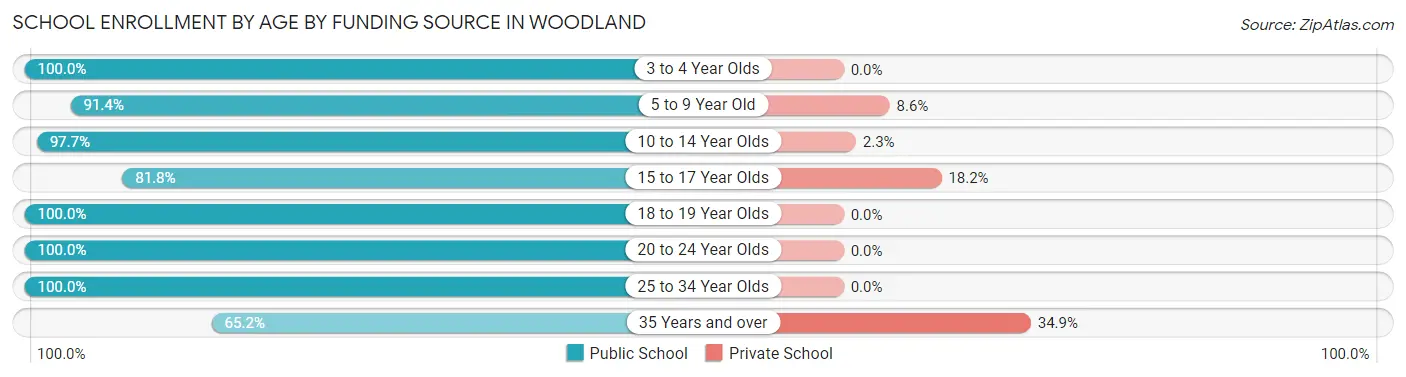
| Age Bracket | Public School | Private School |
| 3 to 4 Year Olds | 5 (100.0%) | 0 (0.0%) |
| 5 to 9 Year Old | 470 (91.4%) | 44 (8.6%) |
| 10 to 14 Year Olds | 431 (97.7%) | 10 (2.3%) |
| 15 to 17 Year Olds | 274 (81.8%) | 61 (18.2%) |
| 18 to 19 Year Olds | 43 (100.0%) | 0 (0.0%) |
| 20 to 24 Year Olds | 163 (100.0%) | 0 (0.0%) |
| 25 to 34 Year Olds | 94 (100.0%) | 0 (0.0%) |
| 35 Years and over | 43 (65.1%) | 23 (34.8%) |
| Total | 1,523 (91.7%) | 138 (8.3%) |
Educational Attainment by Field of Study in Woodland
Education (165 | 19.6%), liberal arts & history (102 | 12.1%), business (100 | 11.9%), bio, nature & agricultural (96 | 11.4%), and computers & mathematics (82 | 9.8%) are the most common fields of study among 840 individuals in Woodland who have obtained a bachelor's degree or higher.
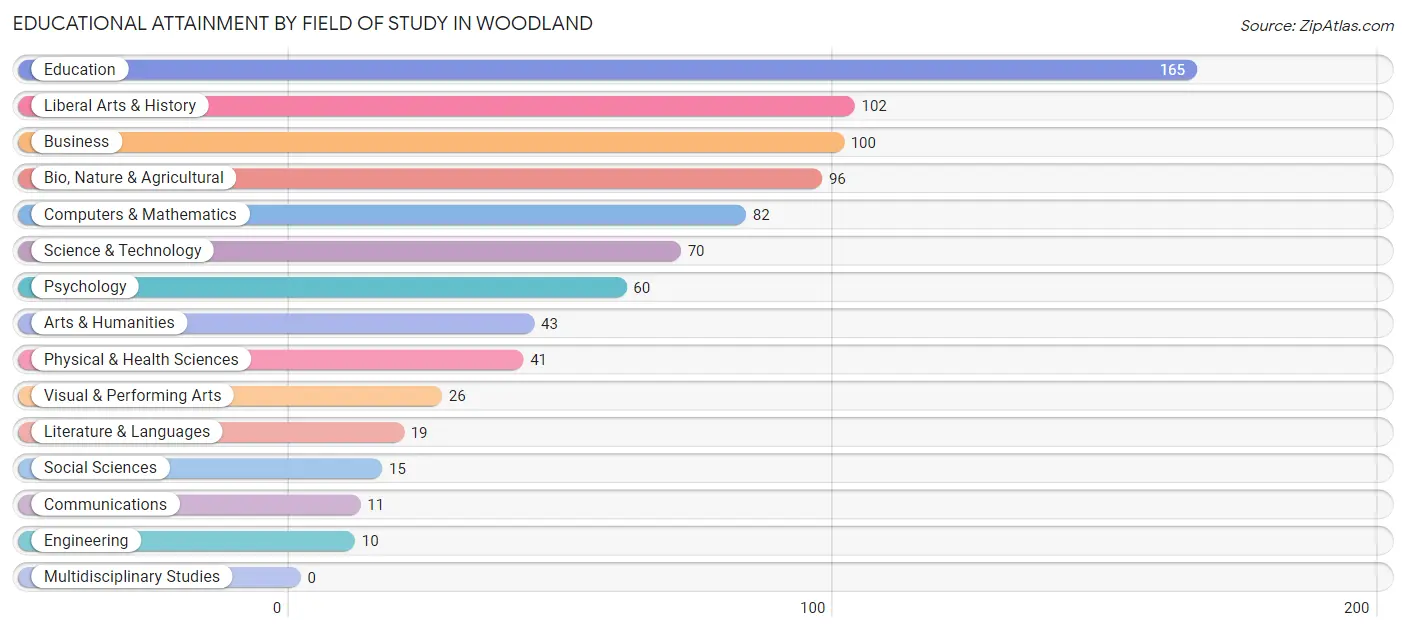
| Field of Study | # Graduates | % Graduates |
| Computers & Mathematics | 82 | 9.8% |
| Bio, Nature & Agricultural | 96 | 11.4% |
| Physical & Health Sciences | 41 | 4.9% |
| Psychology | 60 | 7.1% |
| Social Sciences | 15 | 1.8% |
| Engineering | 10 | 1.2% |
| Multidisciplinary Studies | 0 | 0.0% |
| Science & Technology | 70 | 8.3% |
| Business | 100 | 11.9% |
| Education | 165 | 19.6% |
| Literature & Languages | 19 | 2.3% |
| Liberal Arts & History | 102 | 12.1% |
| Visual & Performing Arts | 26 | 3.1% |
| Communications | 11 | 1.3% |
| Arts & Humanities | 43 | 5.1% |
| Total | 840 | 100.0% |
Transportation & Commute in Woodland
Vehicle Availability by Sex in Woodland
The most prevalent vehicle ownership categories in Woodland are males with 2 vehicles (629, accounting for 39.4%) and females with 2 vehicles (481, making up 48.6%).
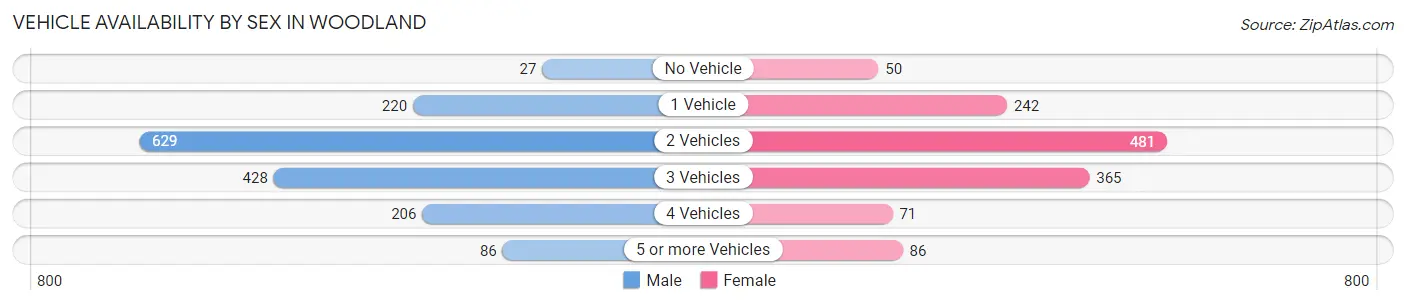
| Vehicles Available | Male | Female |
| No Vehicle | 27 (1.7%) | 50 (3.9%) |
| 1 Vehicle | 220 (13.8%) | 242 (18.7%) |
| 2 Vehicles | 629 (39.4%) | 481 (37.1%) |
| 3 Vehicles | 428 (26.8%) | 365 (28.2%) |
| 4 Vehicles | 206 (12.9%) | 71 (5.5%) |
| 5 or more Vehicles | 86 (5.4%) | 86 (6.6%) |
| Total | 1,596 (100.0%) | 1,295 (100.0%) |
Commute Time in Woodland
The most frequently occuring commute durations in Woodland are 30 to 34 minutes (634 commuters, 24.4%), 20 to 24 minutes (391 commuters, 15.0%), and 60 to 89 minutes (357 commuters, 13.7%).
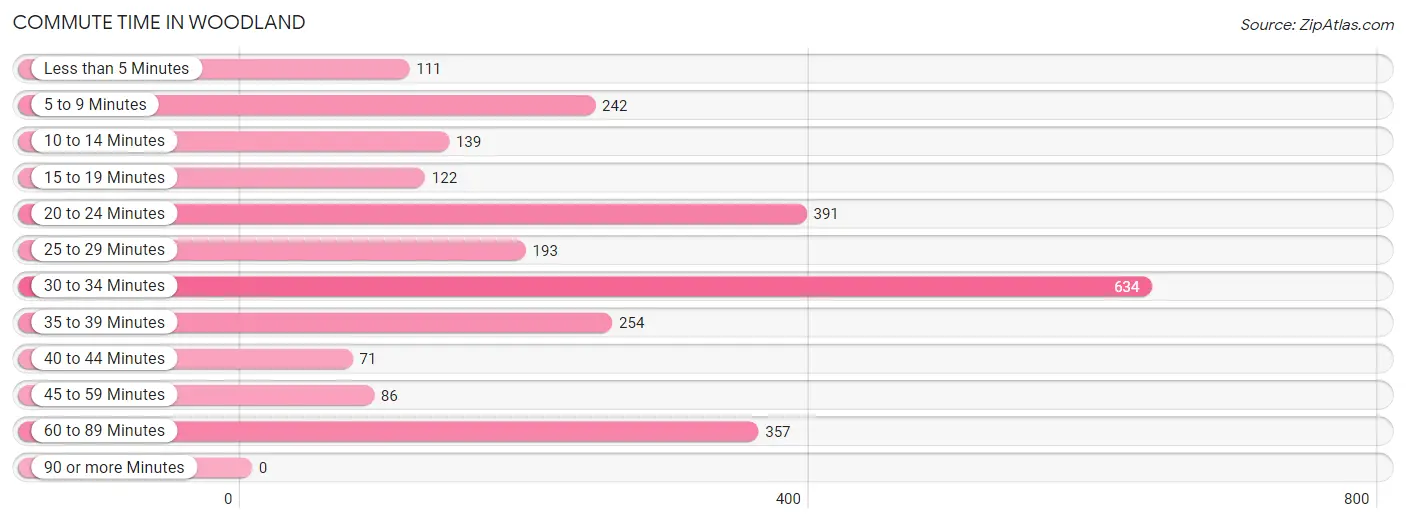
| Commute Time | # Commuters | % Commuters |
| Less than 5 Minutes | 111 | 4.3% |
| 5 to 9 Minutes | 242 | 9.3% |
| 10 to 14 Minutes | 139 | 5.3% |
| 15 to 19 Minutes | 122 | 4.7% |
| 20 to 24 Minutes | 391 | 15.0% |
| 25 to 29 Minutes | 193 | 7.4% |
| 30 to 34 Minutes | 634 | 24.4% |
| 35 to 39 Minutes | 254 | 9.8% |
| 40 to 44 Minutes | 71 | 2.7% |
| 45 to 59 Minutes | 86 | 3.3% |
| 60 to 89 Minutes | 357 | 13.7% |
| 90 or more Minutes | 0 | 0.0% |
Commute Time by Sex in Woodland
The most common commute times in Woodland are 30 to 34 minutes (411 commuters, 29.2%) for males and 60 to 89 minutes (314 commuters, 26.3%) for females.
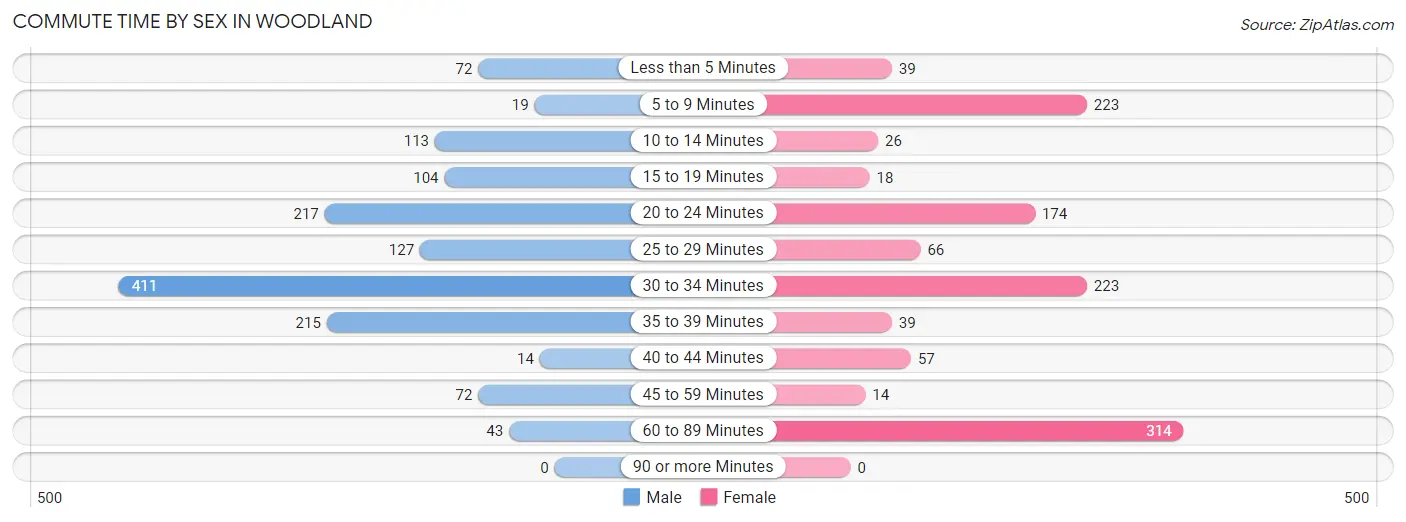
| Commute Time | Male | Female |
| Less than 5 Minutes | 72 (5.1%) | 39 (3.3%) |
| 5 to 9 Minutes | 19 (1.3%) | 223 (18.7%) |
| 10 to 14 Minutes | 113 (8.0%) | 26 (2.2%) |
| 15 to 19 Minutes | 104 (7.4%) | 18 (1.5%) |
| 20 to 24 Minutes | 217 (15.4%) | 174 (14.6%) |
| 25 to 29 Minutes | 127 (9.0%) | 66 (5.5%) |
| 30 to 34 Minutes | 411 (29.2%) | 223 (18.7%) |
| 35 to 39 Minutes | 215 (15.3%) | 39 (3.3%) |
| 40 to 44 Minutes | 14 (1.0%) | 57 (4.8%) |
| 45 to 59 Minutes | 72 (5.1%) | 14 (1.2%) |
| 60 to 89 Minutes | 43 (3.1%) | 314 (26.3%) |
| 90 or more Minutes | 0 (0.0%) | 0 (0.0%) |
Time of Departure to Work by Sex in Woodland
The most frequent times of departure to work in Woodland are 5:00 AM to 5:29 AM (295, 21.0%) for males and 5:30 AM to 5:59 AM (332, 27.8%) for females.
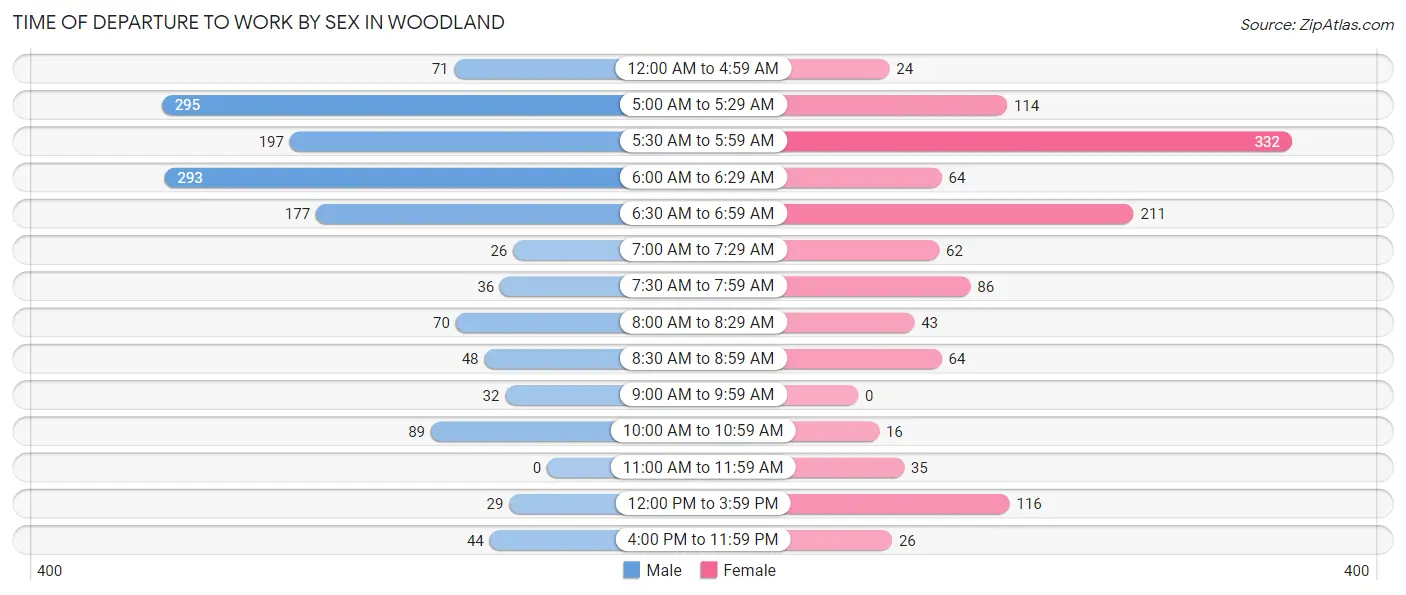
| Time of Departure | Male | Female |
| 12:00 AM to 4:59 AM | 71 (5.1%) | 24 (2.0%) |
| 5:00 AM to 5:29 AM | 295 (21.0%) | 114 (9.6%) |
| 5:30 AM to 5:59 AM | 197 (14.0%) | 332 (27.8%) |
| 6:00 AM to 6:29 AM | 293 (20.8%) | 64 (5.4%) |
| 6:30 AM to 6:59 AM | 177 (12.6%) | 211 (17.7%) |
| 7:00 AM to 7:29 AM | 26 (1.8%) | 62 (5.2%) |
| 7:30 AM to 7:59 AM | 36 (2.6%) | 86 (7.2%) |
| 8:00 AM to 8:29 AM | 70 (5.0%) | 43 (3.6%) |
| 8:30 AM to 8:59 AM | 48 (3.4%) | 64 (5.4%) |
| 9:00 AM to 9:59 AM | 32 (2.3%) | 0 (0.0%) |
| 10:00 AM to 10:59 AM | 89 (6.3%) | 16 (1.3%) |
| 11:00 AM to 11:59 AM | 0 (0.0%) | 35 (2.9%) |
| 12:00 PM to 3:59 PM | 29 (2.1%) | 116 (9.7%) |
| 4:00 PM to 11:59 PM | 44 (3.1%) | 26 (2.2%) |
| Total | 1,407 (100.0%) | 1,193 (100.0%) |
Housing Occupancy in Woodland
Occupancy by Ownership in Woodland
Of the total 2,465 dwellings in Woodland, owner-occupied units account for 1,236 (50.1%), while renter-occupied units make up 1,229 (49.9%).
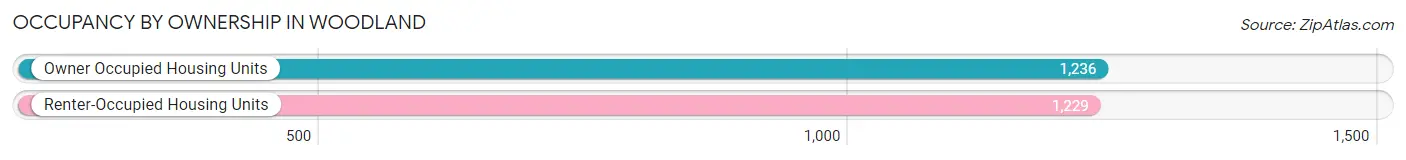
| Occupancy | # Housing Units | % Housing Units |
| Owner Occupied Housing Units | 1,236 | 50.1% |
| Renter-Occupied Housing Units | 1,229 | 49.9% |
| Total Occupied Housing Units | 2,465 | 100.0% |
Occupancy by Household Size in Woodland
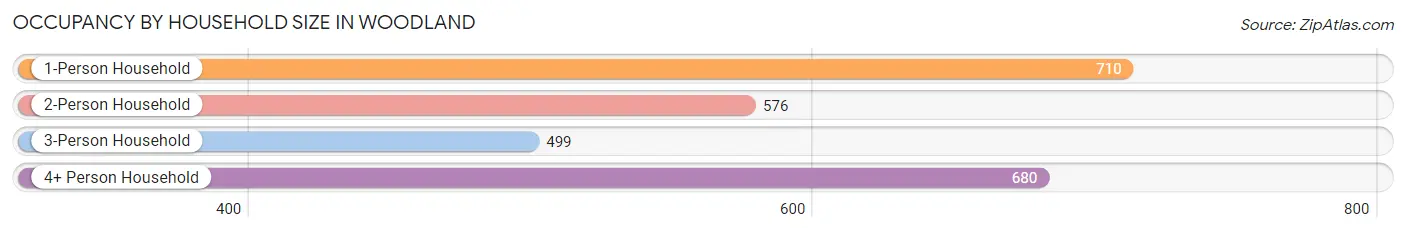
| Household Size | # Housing Units | % Housing Units |
| 1-Person Household | 710 | 28.8% |
| 2-Person Household | 576 | 23.4% |
| 3-Person Household | 499 | 20.2% |
| 4+ Person Household | 680 | 27.6% |
| Total Housing Units | 2,465 | 100.0% |
Occupancy by Ownership by Household Size in Woodland
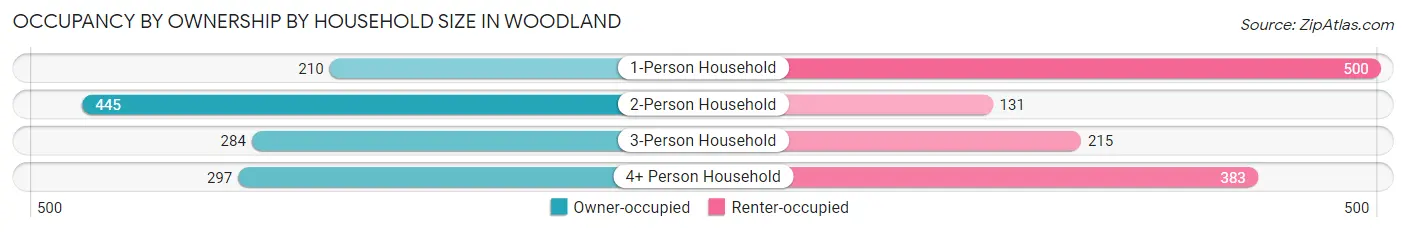
| Household Size | Owner-occupied | Renter-occupied |
| 1-Person Household | 210 (29.6%) | 500 (70.4%) |
| 2-Person Household | 445 (77.3%) | 131 (22.7%) |
| 3-Person Household | 284 (56.9%) | 215 (43.1%) |
| 4+ Person Household | 297 (43.7%) | 383 (56.3%) |
| Total Housing Units | 1,236 (50.1%) | 1,229 (49.9%) |
Occupancy by Educational Attainment in Woodland
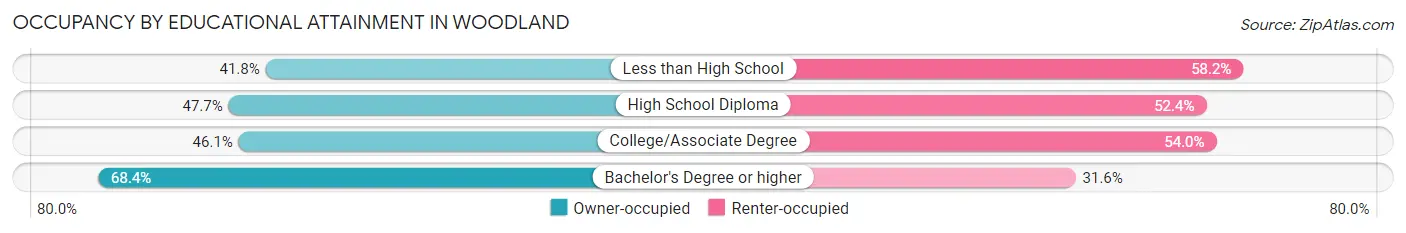
| Household Size | Owner-occupied | Renter-occupied |
| Less than High School | 145 (41.8%) | 202 (58.2%) |
| High School Diploma | 314 (47.6%) | 345 (52.3%) |
| College/Associate Degree | 455 (46.1%) | 533 (53.9%) |
| Bachelor's Degree or higher | 322 (68.4%) | 149 (31.6%) |
Occupancy by Age of Householder in Woodland
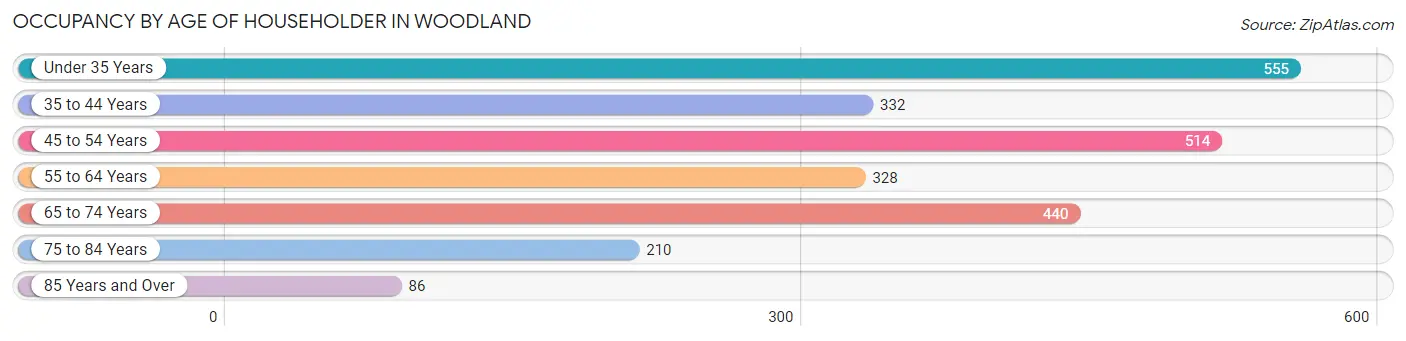
| Age Bracket | # Households | % Households |
| Under 35 Years | 555 | 22.5% |
| 35 to 44 Years | 332 | 13.5% |
| 45 to 54 Years | 514 | 20.8% |
| 55 to 64 Years | 328 | 13.3% |
| 65 to 74 Years | 440 | 17.8% |
| 75 to 84 Years | 210 | 8.5% |
| 85 Years and Over | 86 | 3.5% |
| Total | 2,465 | 100.0% |
Housing Finances in Woodland
Median Income by Occupancy in Woodland
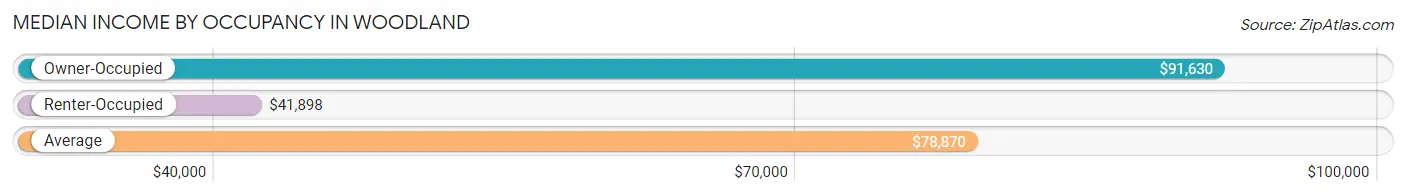
| Occupancy Type | # Households | Median Income |
| Owner-Occupied | 1,236 (50.1%) | $91,630 |
| Renter-Occupied | 1,229 (49.9%) | $41,898 |
| Average | 2,465 (100.0%) | $78,870 |
Occupancy by Householder Income Bracket in Woodland
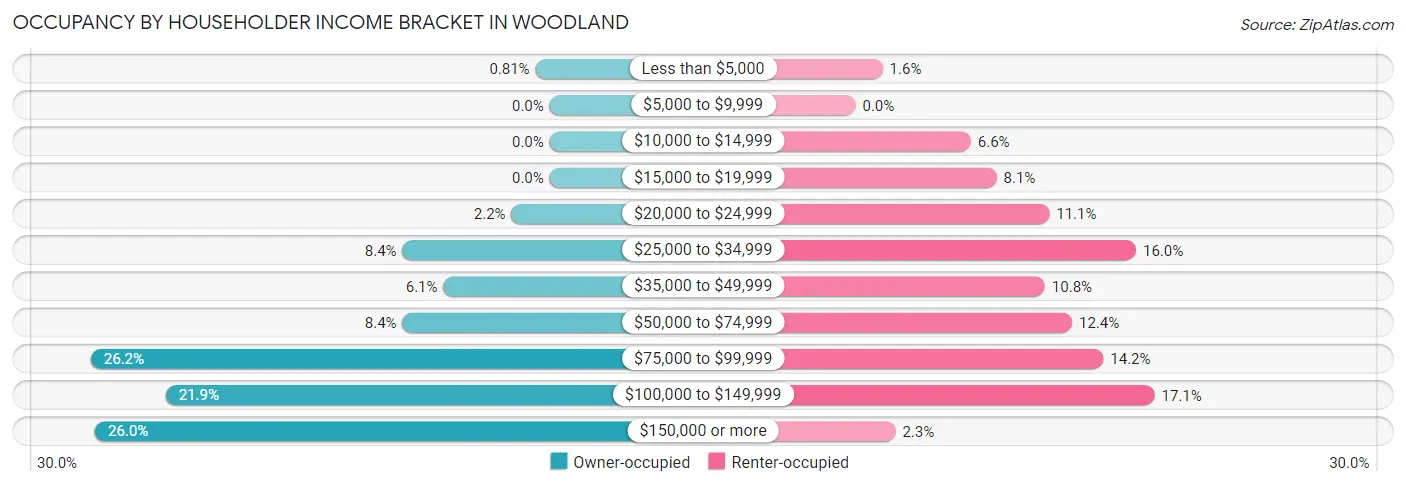
| Income Bracket | Owner-occupied | Renter-occupied |
| Less than $5,000 | 10 (0.8%) | 19 (1.5%) |
| $5,000 to $9,999 | 0 (0.0%) | 0 (0.0%) |
| $10,000 to $14,999 | 0 (0.0%) | 81 (6.6%) |
| $15,000 to $19,999 | 0 (0.0%) | 99 (8.1%) |
| $20,000 to $24,999 | 27 (2.2%) | 136 (11.1%) |
| $25,000 to $34,999 | 104 (8.4%) | 197 (16.0%) |
| $35,000 to $49,999 | 75 (6.1%) | 133 (10.8%) |
| $50,000 to $74,999 | 104 (8.4%) | 152 (12.4%) |
| $75,000 to $99,999 | 324 (26.2%) | 174 (14.2%) |
| $100,000 to $149,999 | 271 (21.9%) | 210 (17.1%) |
| $150,000 or more | 321 (26.0%) | 28 (2.3%) |
| Total | 1,236 (100.0%) | 1,229 (100.0%) |
Monthly Housing Cost Tiers in Woodland
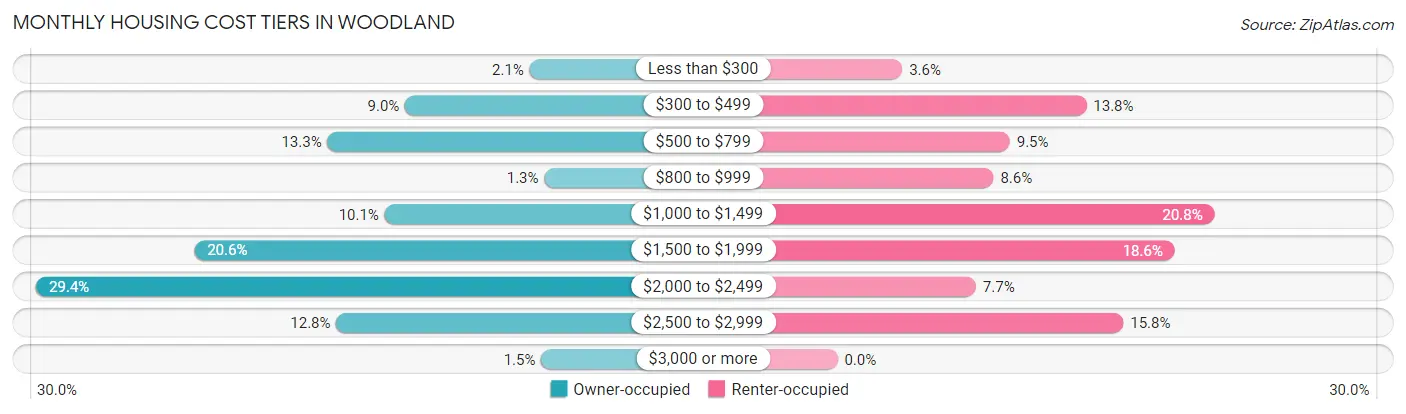
| Monthly Cost | Owner-occupied | Renter-occupied |
| Less than $300 | 26 (2.1%) | 44 (3.6%) |
| $300 to $499 | 111 (9.0%) | 169 (13.8%) |
| $500 to $799 | 164 (13.3%) | 117 (9.5%) |
| $800 to $999 | 16 (1.3%) | 106 (8.6%) |
| $1,000 to $1,499 | 125 (10.1%) | 256 (20.8%) |
| $1,500 to $1,999 | 255 (20.6%) | 229 (18.6%) |
| $2,000 to $2,499 | 363 (29.4%) | 94 (7.6%) |
| $2,500 to $2,999 | 158 (12.8%) | 194 (15.8%) |
| $3,000 or more | 18 (1.5%) | 0 (0.0%) |
| Total | 1,236 (100.0%) | 1,229 (100.0%) |
Physical Housing Characteristics in Woodland
Housing Structures in Woodland
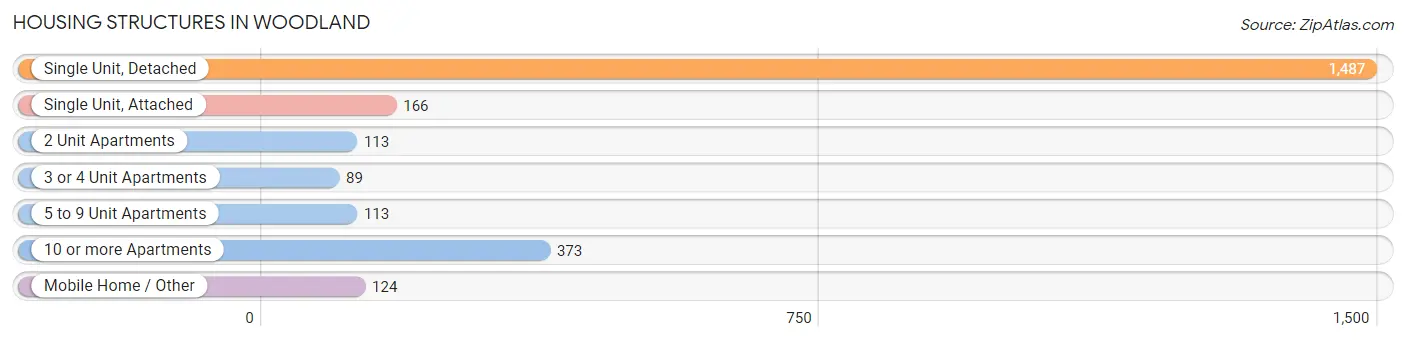
| Structure Type | # Housing Units | % Housing Units |
| Single Unit, Detached | 1,487 | 60.3% |
| Single Unit, Attached | 166 | 6.7% |
| 2 Unit Apartments | 113 | 4.6% |
| 3 or 4 Unit Apartments | 89 | 3.6% |
| 5 to 9 Unit Apartments | 113 | 4.6% |
| 10 or more Apartments | 373 | 15.1% |
| Mobile Home / Other | 124 | 5.0% |
| Total | 2,465 | 100.0% |
Housing Structures by Occupancy in Woodland
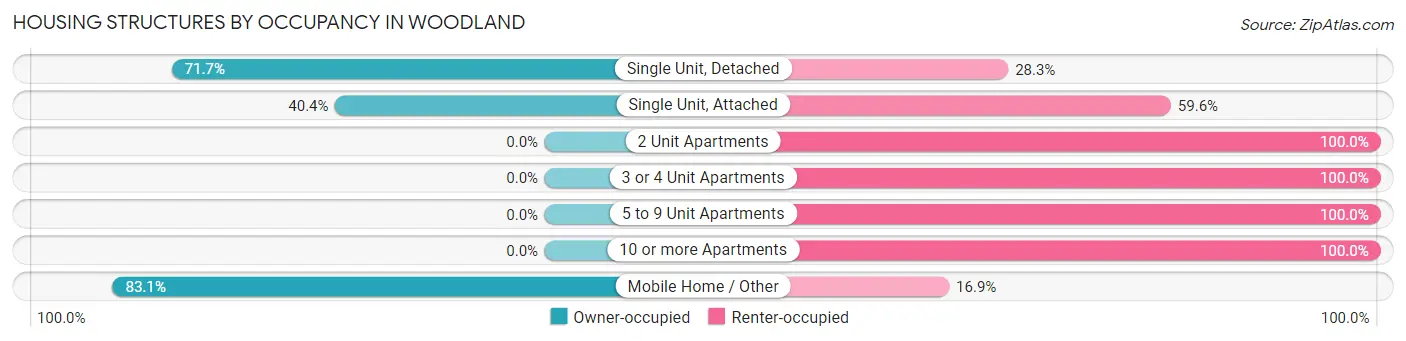
| Structure Type | Owner-occupied | Renter-occupied |
| Single Unit, Detached | 1,066 (71.7%) | 421 (28.3%) |
| Single Unit, Attached | 67 (40.4%) | 99 (59.6%) |
| 2 Unit Apartments | 0 (0.0%) | 113 (100.0%) |
| 3 or 4 Unit Apartments | 0 (0.0%) | 89 (100.0%) |
| 5 to 9 Unit Apartments | 0 (0.0%) | 113 (100.0%) |
| 10 or more Apartments | 0 (0.0%) | 373 (100.0%) |
| Mobile Home / Other | 103 (83.1%) | 21 (16.9%) |
| Total | 1,236 (50.1%) | 1,229 (49.9%) |
Housing Structures by Number of Rooms in Woodland
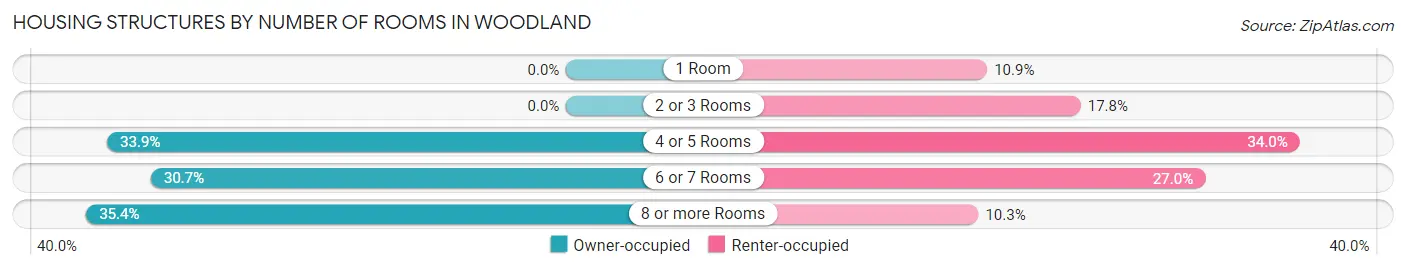
| Number of Rooms | Owner-occupied | Renter-occupied |
| 1 Room | 0 (0.0%) | 134 (10.9%) |
| 2 or 3 Rooms | 0 (0.0%) | 219 (17.8%) |
| 4 or 5 Rooms | 419 (33.9%) | 418 (34.0%) |
| 6 or 7 Rooms | 379 (30.7%) | 332 (27.0%) |
| 8 or more Rooms | 438 (35.4%) | 126 (10.2%) |
| Total | 1,236 (100.0%) | 1,229 (100.0%) |
Housing Structure by Heating Type in Woodland
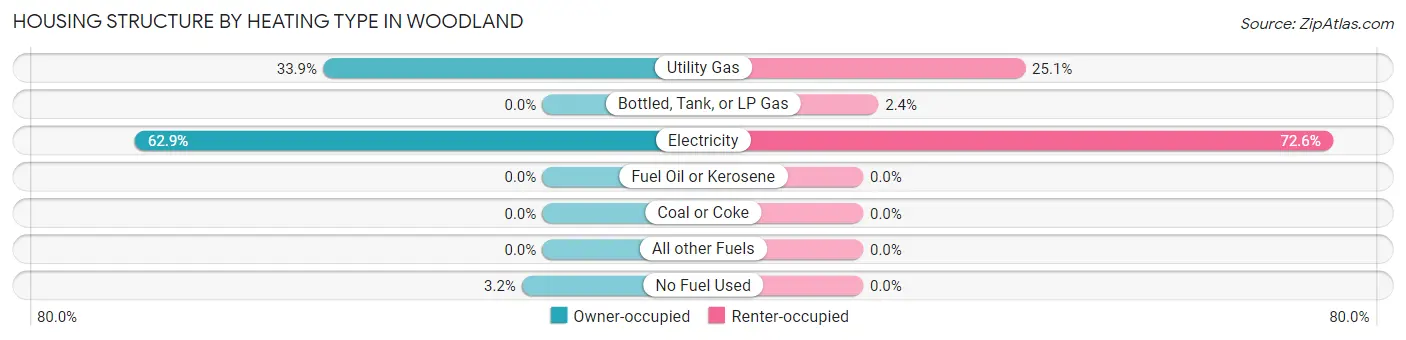
| Heating Type | Owner-occupied | Renter-occupied |
| Utility Gas | 419 (33.9%) | 308 (25.1%) |
| Bottled, Tank, or LP Gas | 0 (0.0%) | 29 (2.4%) |
| Electricity | 778 (62.9%) | 892 (72.6%) |
| Fuel Oil or Kerosene | 0 (0.0%) | 0 (0.0%) |
| Coal or Coke | 0 (0.0%) | 0 (0.0%) |
| All other Fuels | 0 (0.0%) | 0 (0.0%) |
| No Fuel Used | 39 (3.2%) | 0 (0.0%) |
| Total | 1,236 (100.0%) | 1,229 (100.0%) |
Household Vehicle Usage in Woodland
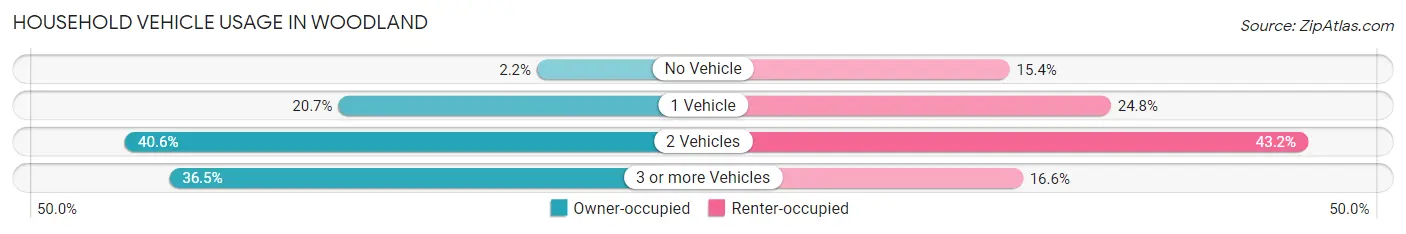
| Vehicles per Household | Owner-occupied | Renter-occupied |
| No Vehicle | 27 (2.2%) | 189 (15.4%) |
| 1 Vehicle | 256 (20.7%) | 305 (24.8%) |
| 2 Vehicles | 502 (40.6%) | 531 (43.2%) |
| 3 or more Vehicles | 451 (36.5%) | 204 (16.6%) |
| Total | 1,236 (100.0%) | 1,229 (100.0%) |
Real Estate & Mortgages in Woodland
Real Estate and Mortgage Overview in Woodland
| Characteristic | Without Mortgage | With Mortgage |
| Housing Units | 324 | 912 |
| Median Property Value | $262,500 | $357,000 |
| Median Household Income | $67,778 | $212 |
| Monthly Housing Costs | $714 | $18 |
| Real Estate Taxes | $3,021 | $0 |
Property Value by Mortgage Status in Woodland
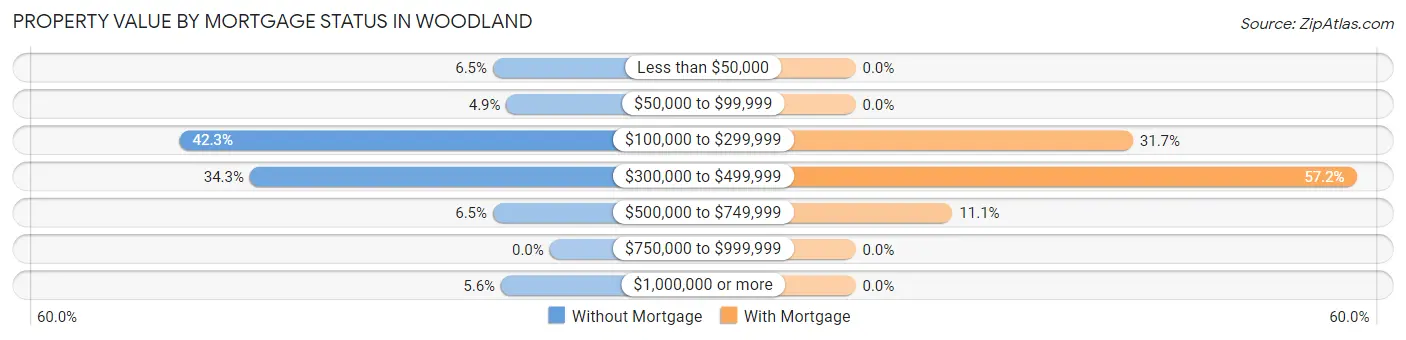
| Property Value | Without Mortgage | With Mortgage |
| Less than $50,000 | 21 (6.5%) | 0 (0.0%) |
| $50,000 to $99,999 | 16 (4.9%) | 0 (0.0%) |
| $100,000 to $299,999 | 137 (42.3%) | 289 (31.7%) |
| $300,000 to $499,999 | 111 (34.3%) | 522 (57.2%) |
| $500,000 to $749,999 | 21 (6.5%) | 101 (11.1%) |
| $750,000 to $999,999 | 0 (0.0%) | 0 (0.0%) |
| $1,000,000 or more | 18 (5.6%) | 0 (0.0%) |
| Total | 324 (100.0%) | 912 (100.0%) |
Household Income by Mortgage Status in Woodland
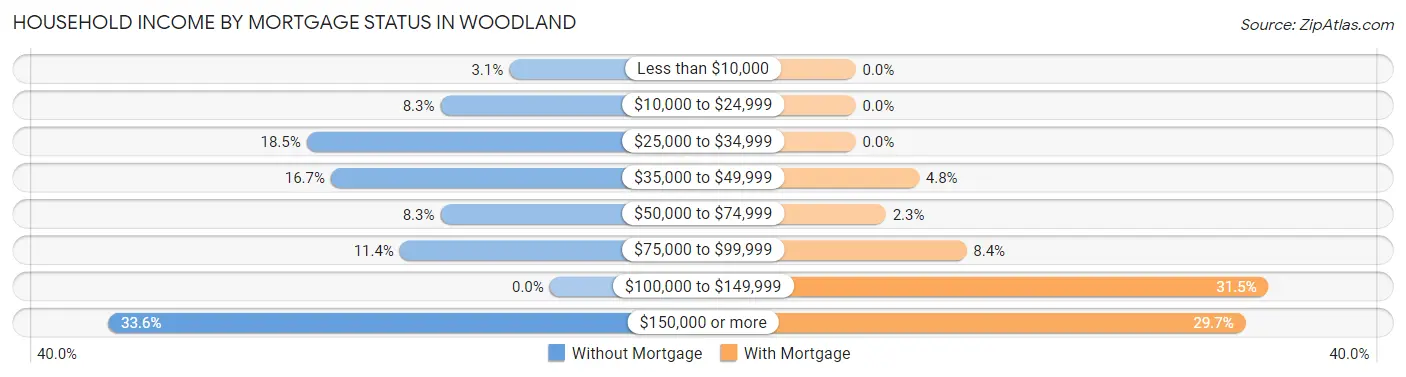
| Household Income | Without Mortgage | With Mortgage |
| Less than $10,000 | 10 (3.1%) | 0 (0.0%) |
| $10,000 to $24,999 | 27 (8.3%) | 0 (0.0%) |
| $25,000 to $34,999 | 60 (18.5%) | 0 (0.0%) |
| $35,000 to $49,999 | 54 (16.7%) | 44 (4.8%) |
| $50,000 to $74,999 | 27 (8.3%) | 21 (2.3%) |
| $75,000 to $99,999 | 37 (11.4%) | 77 (8.4%) |
| $100,000 to $149,999 | 0 (0.0%) | 287 (31.5%) |
| $150,000 or more | 109 (33.6%) | 271 (29.7%) |
| Total | 324 (100.0%) | 912 (100.0%) |
Property Value to Household Income Ratio in Woodland
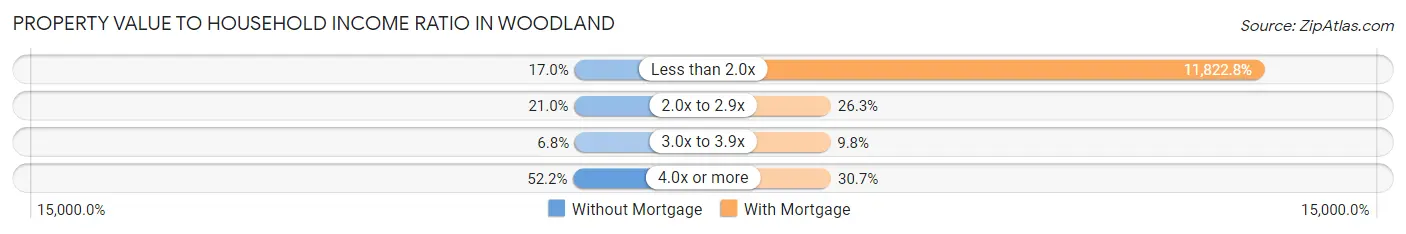
| Value-to-Income Ratio | Without Mortgage | With Mortgage |
| Less than 2.0x | 55 (17.0%) | 107,824 (11,822.8%) |
| 2.0x to 2.9x | 68 (21.0%) | 240 (26.3%) |
| 3.0x to 3.9x | 22 (6.8%) | 89 (9.8%) |
| 4.0x or more | 169 (52.2%) | 280 (30.7%) |
| Total | 324 (100.0%) | 912 (100.0%) |
Real Estate Taxes by Mortgage Status in Woodland
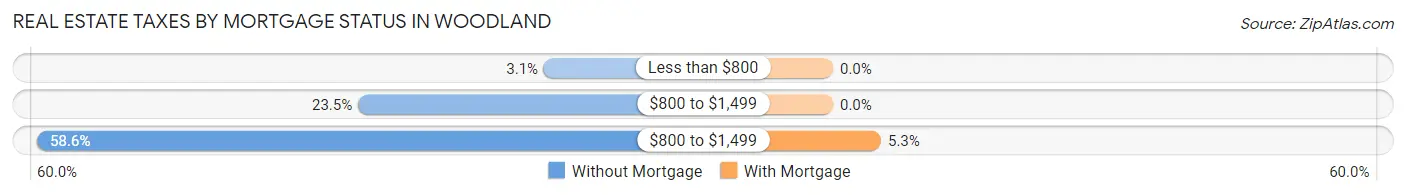
| Property Taxes | Without Mortgage | With Mortgage |
| Less than $800 | 10 (3.1%) | 0 (0.0%) |
| $800 to $1,499 | 76 (23.5%) | 0 (0.0%) |
| $800 to $1,499 | 190 (58.6%) | 48 (5.3%) |
| Total | 324 (100.0%) | 912 (100.0%) |
Health & Disability in Woodland
Health Insurance Coverage by Age in Woodland
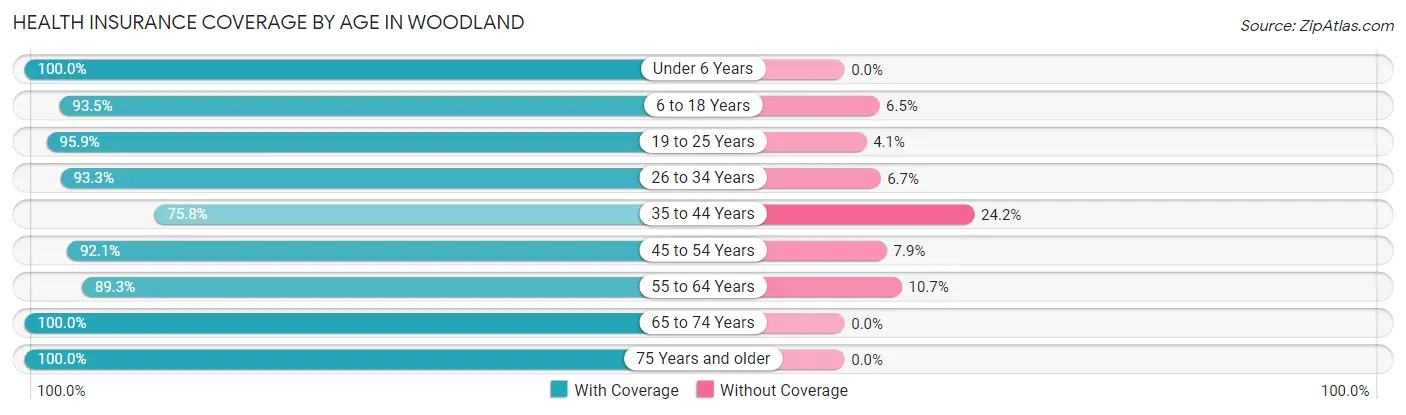
| Age Bracket | With Coverage | Without Coverage |
| Under 6 Years | 546 (100.0%) | 0 (0.0%) |
| 6 to 18 Years | 1,282 (93.5%) | 89 (6.5%) |
| 19 to 25 Years | 658 (95.9%) | 28 (4.1%) |
| 26 to 34 Years | 487 (93.3%) | 35 (6.7%) |
| 35 to 44 Years | 532 (75.8%) | 170 (24.2%) |
| 45 to 54 Years | 828 (92.1%) | 71 (7.9%) |
| 55 to 64 Years | 494 (89.3%) | 59 (10.7%) |
| 65 to 74 Years | 695 (100.0%) | 0 (0.0%) |
| 75 Years and older | 421 (100.0%) | 0 (0.0%) |
| Total | 5,943 (92.9%) | 452 (7.1%) |
Health Insurance Coverage by Citizenship Status in Woodland
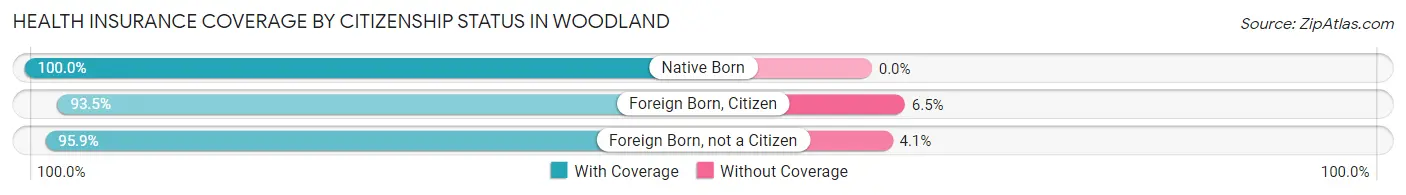
| Citizenship Status | With Coverage | Without Coverage |
| Native Born | 546 (100.0%) | 0 (0.0%) |
| Foreign Born, Citizen | 1,282 (93.5%) | 89 (6.5%) |
| Foreign Born, not a Citizen | 658 (95.9%) | 28 (4.1%) |
Health Insurance Coverage by Household Income in Woodland
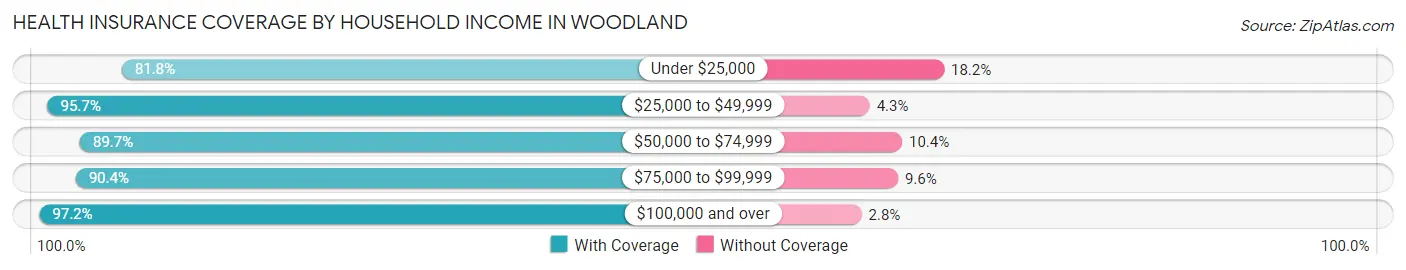
| Household Income | With Coverage | Without Coverage |
| Under $25,000 | 552 (81.8%) | 123 (18.2%) |
| $25,000 to $49,999 | 957 (95.7%) | 43 (4.3%) |
| $50,000 to $74,999 | 459 (89.6%) | 53 (10.3%) |
| $75,000 to $99,999 | 1,548 (90.4%) | 164 (9.6%) |
| $100,000 and over | 2,423 (97.2%) | 69 (2.8%) |
Public vs Private Health Insurance Coverage by Age in Woodland
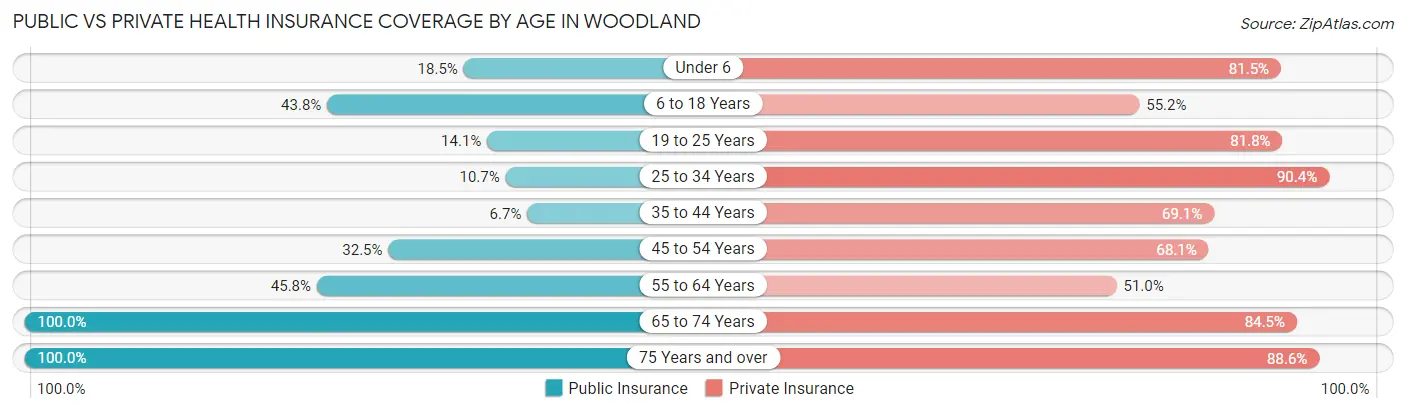
| Age Bracket | Public Insurance | Private Insurance |
| Under 6 | 101 (18.5%) | 445 (81.5%) |
| 6 to 18 Years | 601 (43.8%) | 757 (55.2%) |
| 19 to 25 Years | 97 (14.1%) | 561 (81.8%) |
| 25 to 34 Years | 56 (10.7%) | 472 (90.4%) |
| 35 to 44 Years | 47 (6.7%) | 485 (69.1%) |
| 45 to 54 Years | 292 (32.5%) | 612 (68.1%) |
| 55 to 64 Years | 253 (45.8%) | 282 (51.0%) |
| 65 to 74 Years | 695 (100.0%) | 587 (84.5%) |
| 75 Years and over | 421 (100.0%) | 373 (88.6%) |
| Total | 2,563 (40.1%) | 4,574 (71.5%) |
Disability Status by Sex by Age in Woodland
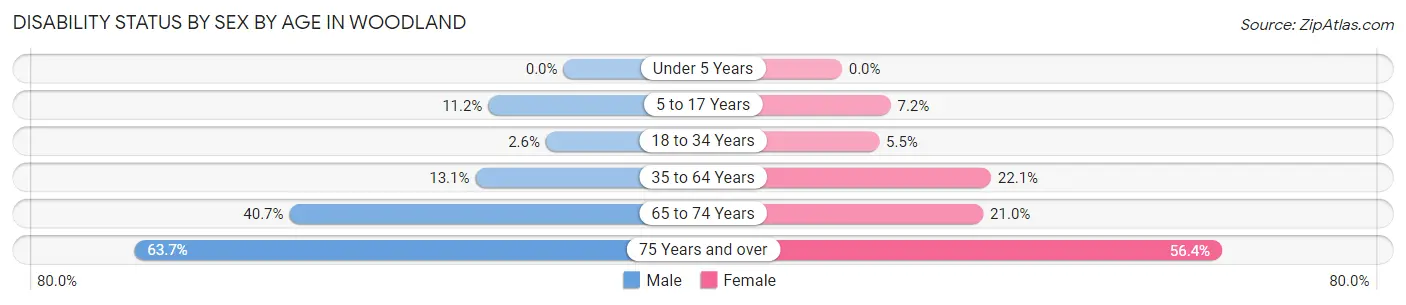
| Age Bracket | Male | Female |
| Under 5 Years | 0 (0.0%) | 0 (0.0%) |
| 5 to 17 Years | 74 (11.2%) | 61 (7.2%) |
| 18 to 34 Years | 19 (2.6%) | 29 (5.5%) |
| 35 to 64 Years | 134 (13.1%) | 250 (22.1%) |
| 65 to 74 Years | 118 (40.7%) | 85 (21.0%) |
| 75 Years and over | 100 (63.7%) | 149 (56.4%) |
Disability Class by Sex by Age in Woodland
Disability Class: Hearing Difficulty
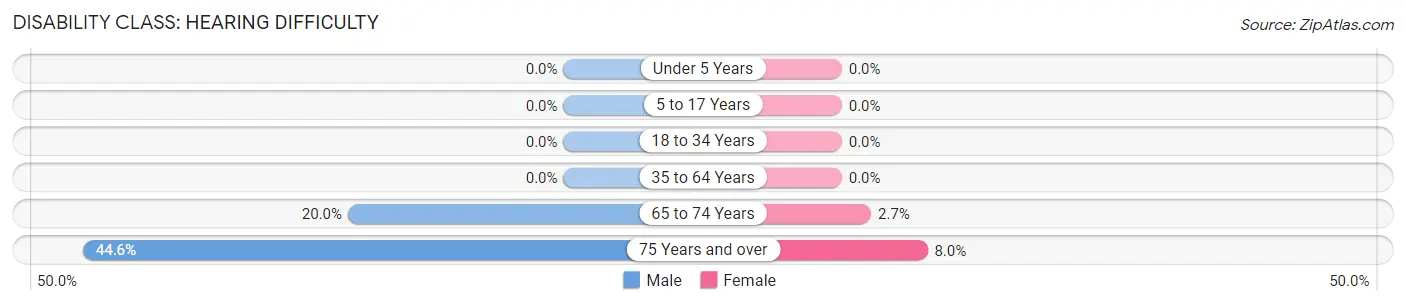
| Age Bracket | Male | Female |
| Under 5 Years | 0 (0.0%) | 0 (0.0%) |
| 5 to 17 Years | 0 (0.0%) | 0 (0.0%) |
| 18 to 34 Years | 0 (0.0%) | 0 (0.0%) |
| 35 to 64 Years | 0 (0.0%) | 0 (0.0%) |
| 65 to 74 Years | 58 (20.0%) | 11 (2.7%) |
| 75 Years and over | 70 (44.6%) | 21 (8.0%) |
Disability Class: Vision Difficulty
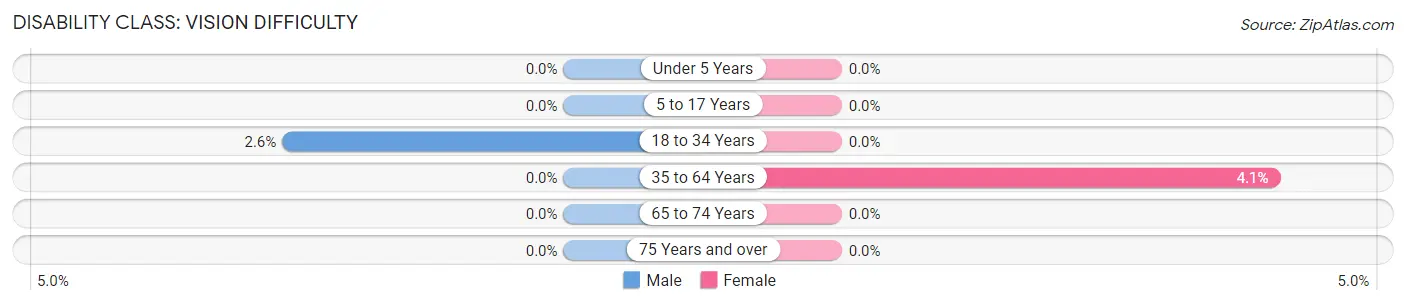
| Age Bracket | Male | Female |
| Under 5 Years | 0 (0.0%) | 0 (0.0%) |
| 5 to 17 Years | 0 (0.0%) | 0 (0.0%) |
| 18 to 34 Years | 19 (2.6%) | 0 (0.0%) |
| 35 to 64 Years | 0 (0.0%) | 46 (4.1%) |
| 65 to 74 Years | 0 (0.0%) | 0 (0.0%) |
| 75 Years and over | 0 (0.0%) | 0 (0.0%) |
Disability Class: Cognitive Difficulty
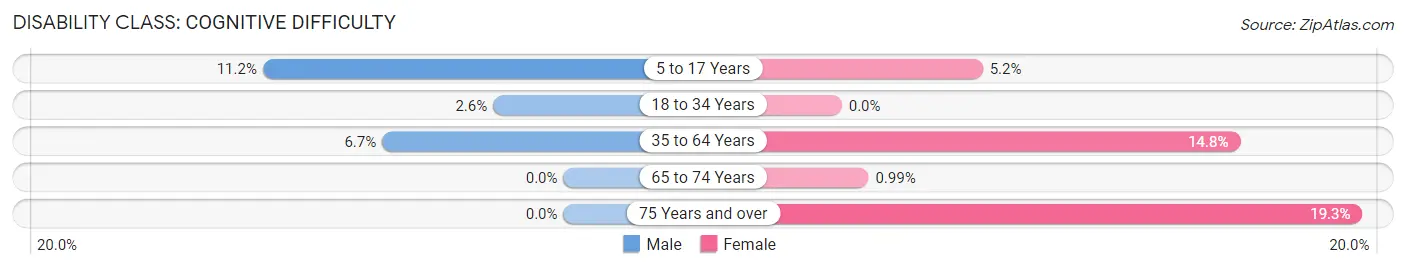
| Age Bracket | Male | Female |
| 5 to 17 Years | 74 (11.2%) | 44 (5.2%) |
| 18 to 34 Years | 19 (2.6%) | 0 (0.0%) |
| 35 to 64 Years | 69 (6.7%) | 167 (14.8%) |
| 65 to 74 Years | 0 (0.0%) | 4 (1.0%) |
| 75 Years and over | 0 (0.0%) | 51 (19.3%) |
Disability Class: Ambulatory Difficulty
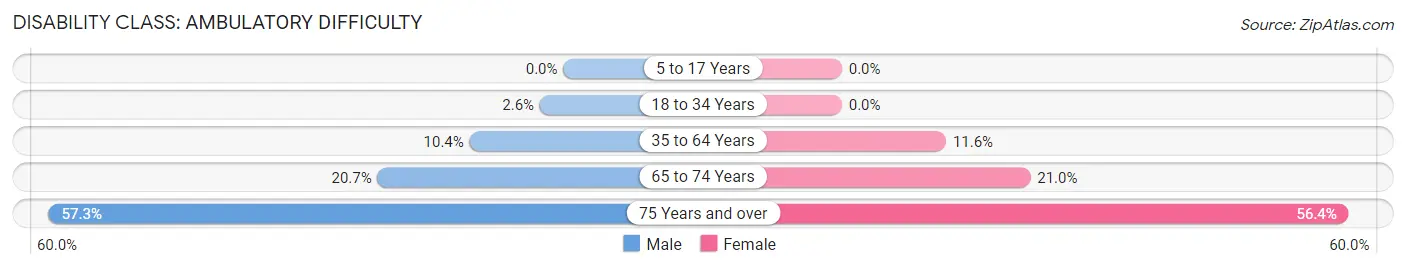
| Age Bracket | Male | Female |
| 5 to 17 Years | 0 (0.0%) | 0 (0.0%) |
| 18 to 34 Years | 19 (2.6%) | 0 (0.0%) |
| 35 to 64 Years | 107 (10.4%) | 131 (11.6%) |
| 65 to 74 Years | 60 (20.7%) | 85 (21.0%) |
| 75 Years and over | 90 (57.3%) | 149 (56.4%) |
Disability Class: Self-Care Difficulty
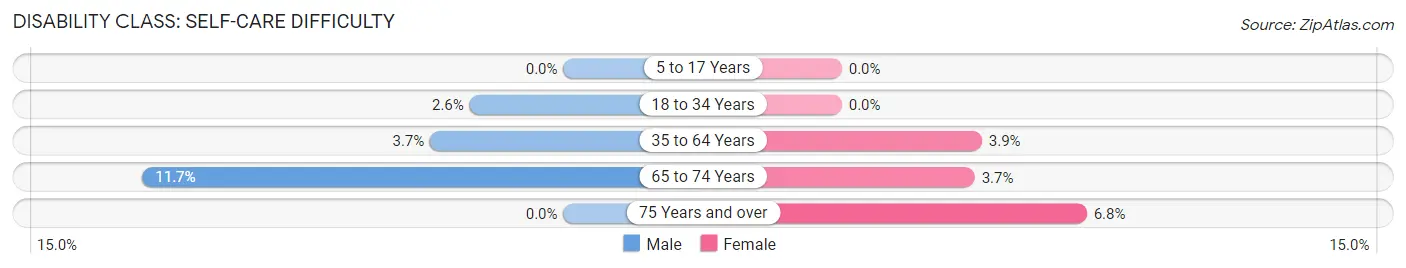
| Age Bracket | Male | Female |
| 5 to 17 Years | 0 (0.0%) | 0 (0.0%) |
| 18 to 34 Years | 19 (2.6%) | 0 (0.0%) |
| 35 to 64 Years | 38 (3.7%) | 44 (3.9%) |
| 65 to 74 Years | 34 (11.7%) | 15 (3.7%) |
| 75 Years and over | 0 (0.0%) | 18 (6.8%) |
Technology Access in Woodland
Computing Device Access in Woodland
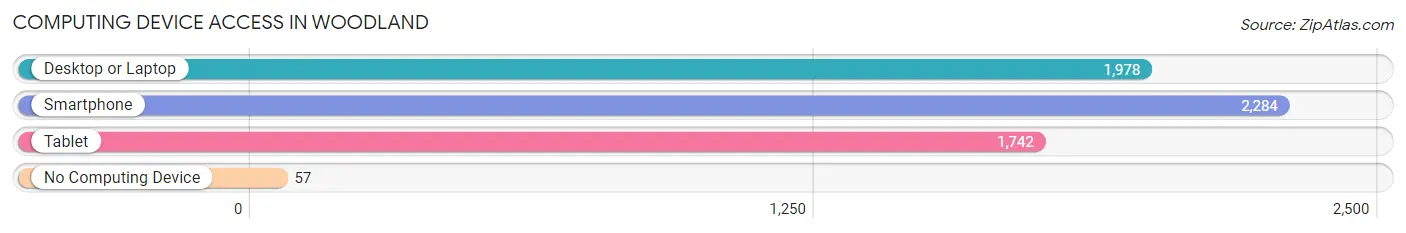
| Device Type | # Households | % Households |
| Desktop or Laptop | 1,978 | 80.2% |
| Smartphone | 2,284 | 92.7% |
| Tablet | 1,742 | 70.7% |
| No Computing Device | 57 | 2.3% |
| Total | 2,465 | 100.0% |
Internet Access in Woodland
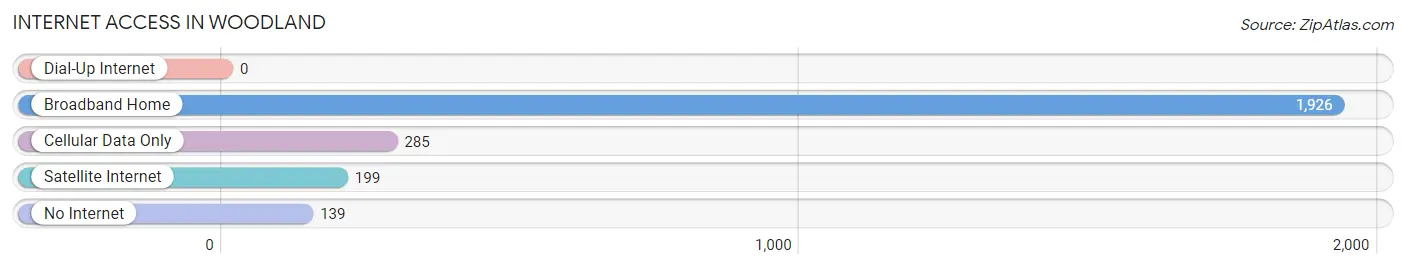
| Internet Type | # Households | % Households |
| Dial-Up Internet | 0 | 0.0% |
| Broadband Home | 1,926 | 78.1% |
| Cellular Data Only | 285 | 11.6% |
| Satellite Internet | 199 | 8.1% |
| No Internet | 139 | 5.6% |
| Total | 2,465 | 100.0% |
Woodland Summary
Woodland, Washington is a small city located in Cowlitz County, Washington, United States. It is situated along the Columbia River, approximately 25 miles north of Vancouver, Washington. The city has a population of 5,509 as of the 2010 census.
History
Woodland was first settled in 1845 by the Hudson's Bay Company, who established a trading post in the area. The post was named "Woodland" after the nearby forest. The area was used for logging and farming, and the town was officially incorporated in 1891.
In the early 1900s, the town was a major hub for the timber industry, with several sawmills and logging camps in the area. The town also had a thriving agricultural industry, with several farms and orchards in the area.
In the 1950s, the town began to experience a decline in its timber industry, and the population began to decline as well. In the 1970s, the town began to experience a resurgence in population growth, as people began to move to the area for its scenic beauty and recreational opportunities.
Geography
Woodland is located in Cowlitz County, Washington, approximately 25 miles north of Vancouver, Washington. The city is situated along the Columbia River, and is surrounded by forests and rolling hills. The city has a total area of 4.2 square miles, all of which is land.
The climate in Woodland is mild and temperate, with warm summers and cool winters. The average annual temperature is around 50 degrees Fahrenheit.
Economy
Woodland's economy is largely based on the timber industry, with several sawmills and logging camps in the area. The city also has a thriving agricultural industry, with several farms and orchards in the area.
The city also has a growing tourism industry, with several recreational activities available in the area, such as fishing, camping, and hiking.
Demographics
As of the 2010 census, Woodland had a population of 5,509. The racial makeup of the city was 91.3% White, 0.7% African American, 0.7% Native American, 0.7% Asian, 0.2% Pacific Islander, 4.2% from other races, and 2.1% from two or more races. Hispanic or Latino of any race were 8.2% of the population.
The median income for a household in the city was $41,944, and the median income for a family was $50,944. The per capita income for the city was $20,944. About 11.2% of families and 14.2% of the population were below the poverty line, including 19.2% of those under age 18 and 8.2% of those age 65 or over.
Common Questions
What is Per Capita Income in Woodland?
Per Capita income in Woodland is $31,577.
What is the Median Family Income in Woodland?
Median Family Income in Woodland is $78,821.
What is the Median Household income in Woodland?
Median Household Income in Woodland is $78,870.
What is Income or Wage Gap in Woodland?
Income or Wage Gap in Woodland is 41.9%.
Women in Woodland earn 58.1 cents for every dollar earned by a man.
What is Inequality or Gini Index in Woodland?
Inequality or Gini Index in Woodland is 0.38.
What is the Total Population of Woodland?
Total Population of Woodland is 6,463.
What is the Total Male Population of Woodland?
Total Male Population of Woodland is 3,101.
What is the Total Female Population of Woodland?
Total Female Population of Woodland is 3,362.
What is the Ratio of Males per 100 Females in Woodland?
There are 92.24 Males per 100 Females in Woodland.
What is the Ratio of Females per 100 Males in Woodland?
There are 108.42 Females per 100 Males in Woodland.
What is the Median Population Age in Woodland?
Median Population Age in Woodland is 36.7 Years.
What is the Average Family Size in Woodland
Average Family Size in Woodland is 3.1 People.
What is the Average Household Size in Woodland
Average Household Size in Woodland is 2.6 People.
How Large is the Labor Force in Woodland?
There are 3,111 People in the Labor Forcein in Woodland.
What is the Percentage of People in the Labor Force in Woodland?
64.8% of People are in the Labor Force in Woodland.
What is the Unemployment Rate in Woodland?
Unemployment Rate in Woodland is 6.8%.