Hamilton, WA Map & Demographics
Hamilton Map
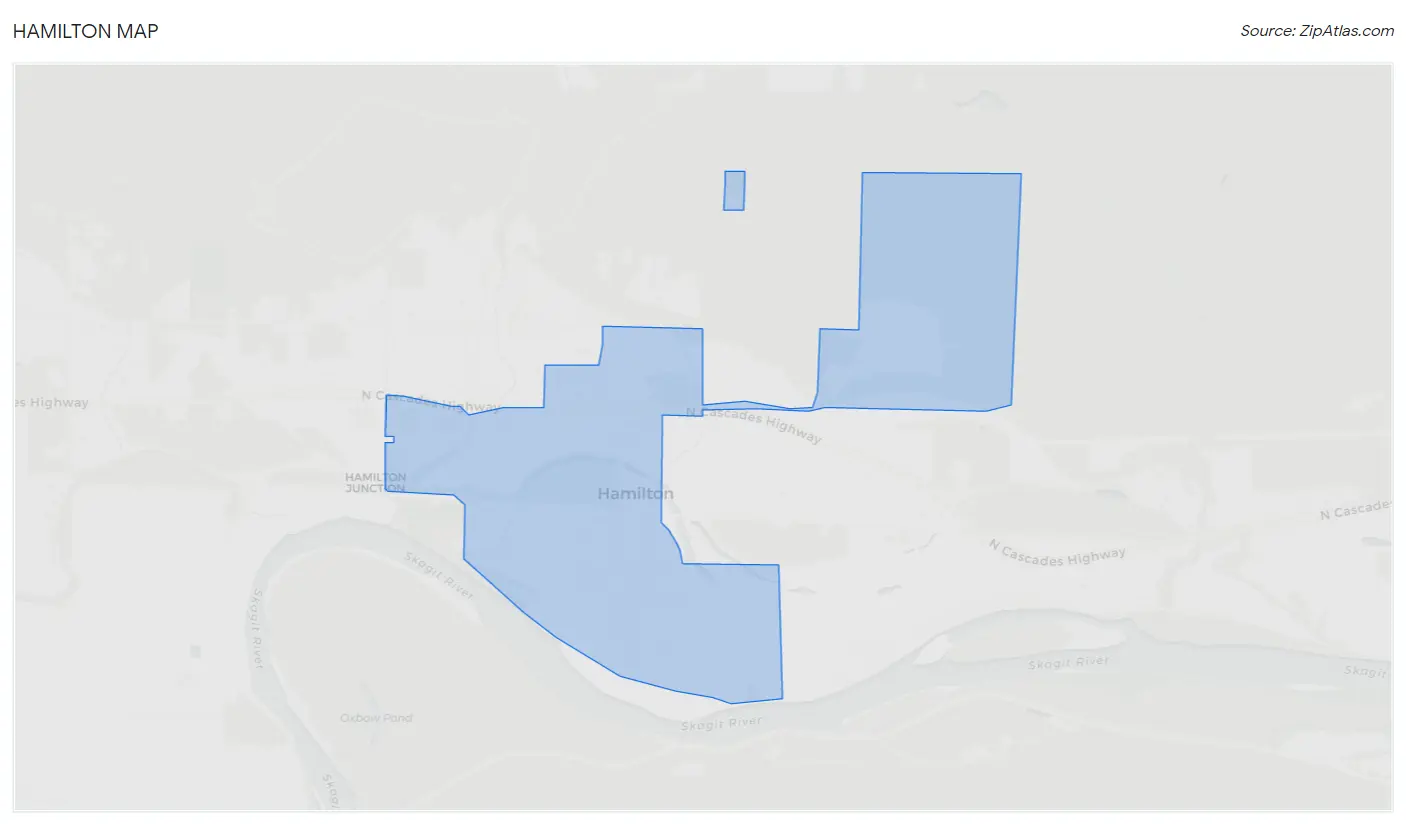
Hamilton Overview
$38,535
PER CAPITA INCOME
$100,625
AVG FAMILY INCOME
$64,063
AVG HOUSEHOLD INCOME
0.40
INEQUALITY / GINI INDEX
376
TOTAL POPULATION
187
MALE POPULATION
189
FEMALE POPULATION
98.94
MALES / 100 FEMALES
101.07
FEMALES / 100 MALES
52.9
MEDIAN AGE
2.3
AVG FAMILY SIZE
2.1
AVG HOUSEHOLD SIZE
155
LABOR FORCE [ PEOPLE ]
46.1%
PERCENT IN LABOR FORCE
8.4%
UNEMPLOYMENT RATE
Hamilton Zip Codes
Hamilton Area Codes
Income in Hamilton
Income Overview in Hamilton
Per Capita Income in Hamilton is $38,535, while median incomes of families and households are $100,625 and $64,063 respectively.
| Characteristic | Number | Measure |
| Per Capita Income | 376 | $38,535 |
| Median Family Income | 135 | $100,625 |
| Mean Family Income | 135 | $94,267 |
| Median Household Income | 179 | $64,063 |
| Mean Household Income | 179 | $80,685 |
| Income Deficit | 135 | $0 |
| Wage / Income Gap (%) | 376 | 0.00% |
| Wage / Income Gap ($) | 376 | 100.00¢ per $1 |
| Gini / Inequality Index | 376 | 0.40 |
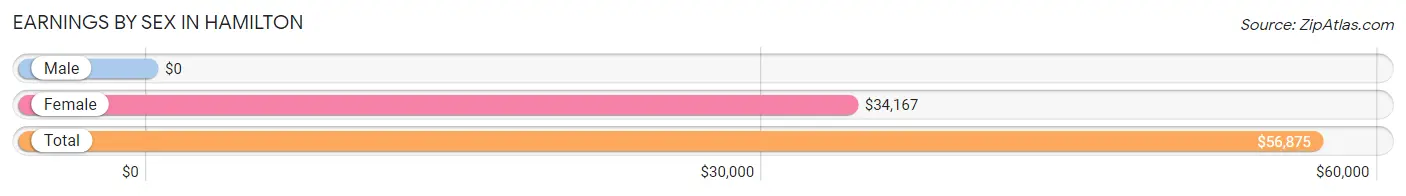
Earnings by Sex in Hamilton
| Sex | Number | Average Earnings |
| Male | 104 (65.0%) | $0 |
| Female | 56 (35.0%) | $34,167 |
| Total | 160 (100.0%) | $56,875 |
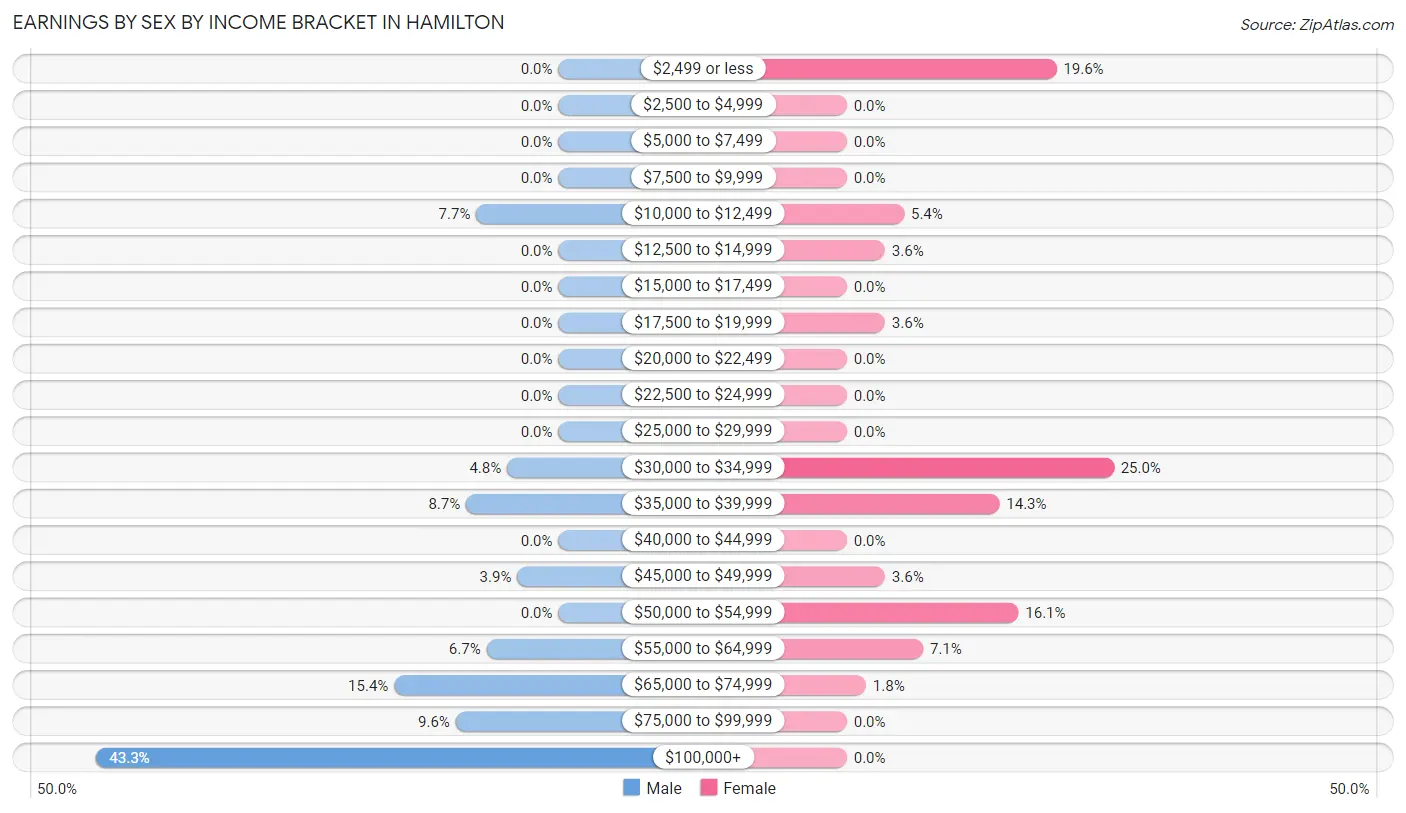
Earnings by Sex by Income Bracket in Hamilton
The most common earnings brackets in Hamilton are $100,000+ for men (45 | 43.3%) and $30,000 to $34,999 for women (14 | 25.0%).
| Income | Male | Female |
| $2,499 or less | 0 (0.0%) | 11 (19.6%) |
| $2,500 to $4,999 | 0 (0.0%) | 0 (0.0%) |
| $5,000 to $7,499 | 0 (0.0%) | 0 (0.0%) |
| $7,500 to $9,999 | 0 (0.0%) | 0 (0.0%) |
| $10,000 to $12,499 | 8 (7.7%) | 3 (5.4%) |
| $12,500 to $14,999 | 0 (0.0%) | 2 (3.6%) |
| $15,000 to $17,499 | 0 (0.0%) | 0 (0.0%) |
| $17,500 to $19,999 | 0 (0.0%) | 2 (3.6%) |
| $20,000 to $22,499 | 0 (0.0%) | 0 (0.0%) |
| $22,500 to $24,999 | 0 (0.0%) | 0 (0.0%) |
| $25,000 to $29,999 | 0 (0.0%) | 0 (0.0%) |
| $30,000 to $34,999 | 5 (4.8%) | 14 (25.0%) |
| $35,000 to $39,999 | 9 (8.6%) | 8 (14.3%) |
| $40,000 to $44,999 | 0 (0.0%) | 0 (0.0%) |
| $45,000 to $49,999 | 4 (3.8%) | 2 (3.6%) |
| $50,000 to $54,999 | 0 (0.0%) | 9 (16.1%) |
| $55,000 to $64,999 | 7 (6.7%) | 4 (7.1%) |
| $65,000 to $74,999 | 16 (15.4%) | 1 (1.8%) |
| $75,000 to $99,999 | 10 (9.6%) | 0 (0.0%) |
| $100,000+ | 45 (43.3%) | 0 (0.0%) |
| Total | 104 (100.0%) | 56 (100.0%) |
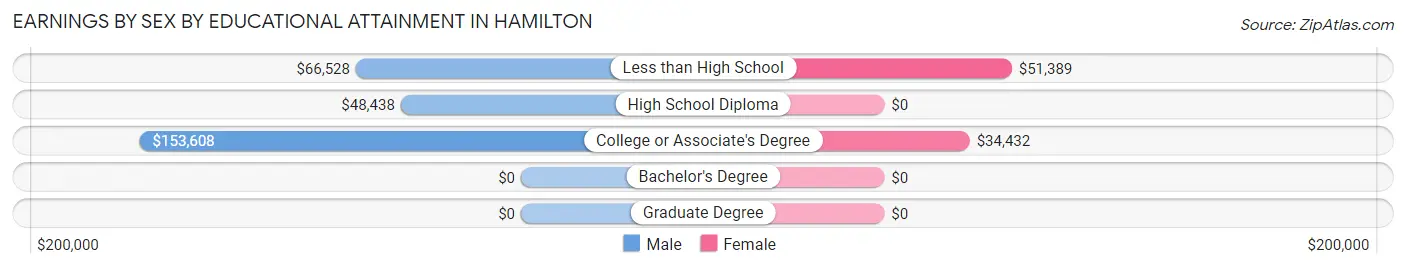
Earnings by Sex by Educational Attainment in Hamilton
| Educational Attainment | Male Income | Female Income |
| Less than High School | $66,528 | $51,389 |
| High School Diploma | $48,438 | $0 |
| College or Associate's Degree | $153,608 | $34,432 |
| Bachelor's Degree | - | - |
| Graduate Degree | - | - |
| Total | - | - |
Family Income in Hamilton
Family Income Brackets in Hamilton
According to the Hamilton family income data, there are 46 families falling into the $150,000 to $199,999 income range, which is the most common income bracket and makes up 34.1% of all families.
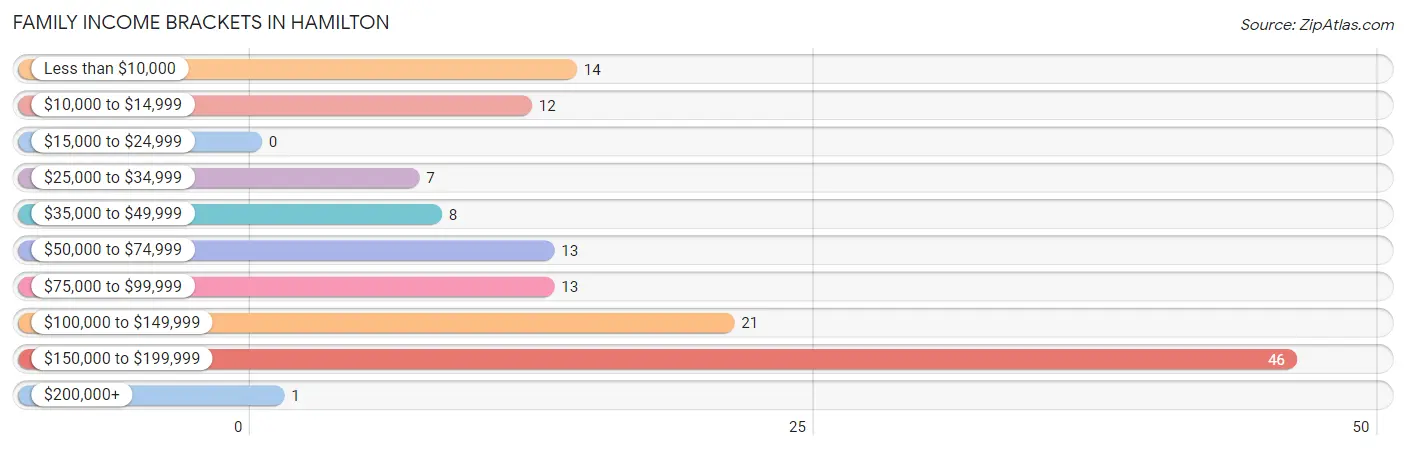
| Income Bracket | # Families | % Families |
| Less than $10,000 | 14 | 10.4% |
| $10,000 to $14,999 | 12 | 8.9% |
| $15,000 to $24,999 | 0 | 0.0% |
| $25,000 to $34,999 | 7 | 5.2% |
| $35,000 to $49,999 | 8 | 5.9% |
| $50,000 to $74,999 | 13 | 9.6% |
| $75,000 to $99,999 | 13 | 9.6% |
| $100,000 to $149,999 | 21 | 15.6% |
| $150,000 to $199,999 | 46 | 34.1% |
| $200,000+ | 1 | 0.7% |
Family Income by Famaliy Size in Hamilton
2-person families (107 | 79.3%) account for the highest median family income in Hamilton with $128,750 per family, while 2-person families (107 | 79.3%) have the highest median income of $64,375 per family member.
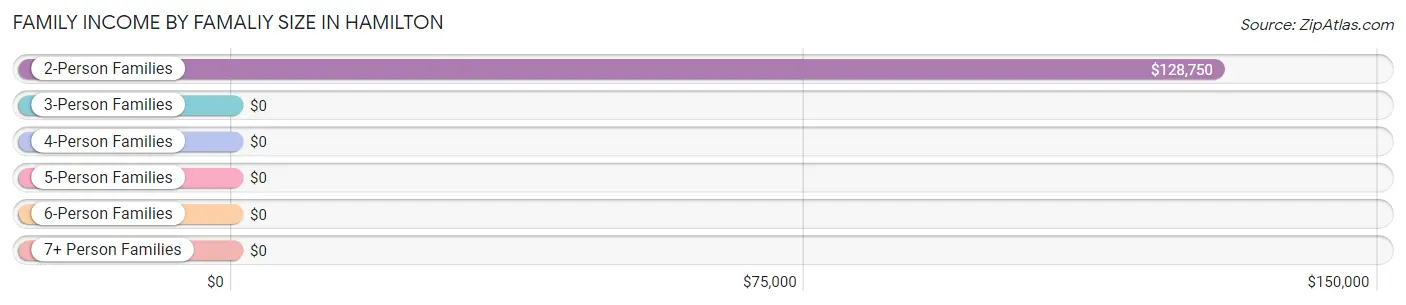
| Income Bracket | # Families | Median Income |
| 2-Person Families | 107 (79.3%) | $128,750 |
| 3-Person Families | 11 (8.2%) | $0 |
| 4-Person Families | 11 (8.2%) | $0 |
| 5-Person Families | 4 (3.0%) | $0 |
| 6-Person Families | 2 (1.5%) | $0 |
| 7+ Person Families | 0 (0.0%) | $0 |
| Total | 135 (100.0%) | $100,625 |
Family Income by Number of Earners in Hamilton
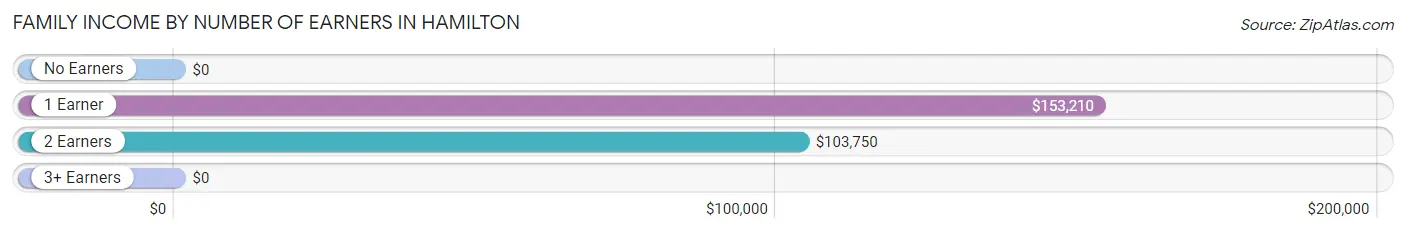
| Number of Earners | # Families | Median Income |
| No Earners | 38 (28.1%) | $0 |
| 1 Earner | 63 (46.7%) | $153,210 |
| 2 Earners | 30 (22.2%) | $103,750 |
| 3+ Earners | 4 (3.0%) | $0 |
| Total | 135 (100.0%) | $100,625 |
Household Income in Hamilton
Household Income Brackets in Hamilton
With 46 households falling in the category, the $150,000 to $199,999 income range is the most frequent in Hamilton, accounting for 25.7% of all households. In contrast, only 1 households (0.6%) fall into the $200,000+ income bracket, making it the least populous group.
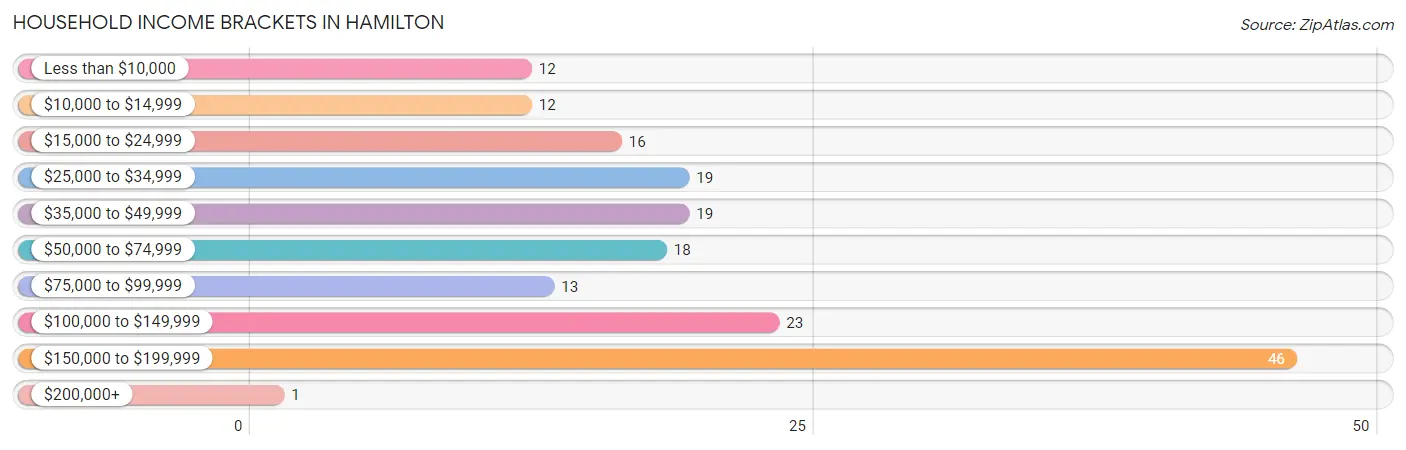
| Income Bracket | # Households | % Households |
| Less than $10,000 | 12 | 6.7% |
| $10,000 to $14,999 | 12 | 6.7% |
| $15,000 to $24,999 | 16 | 8.9% |
| $25,000 to $34,999 | 19 | 10.6% |
| $35,000 to $49,999 | 19 | 10.6% |
| $50,000 to $74,999 | 18 | 10.1% |
| $75,000 to $99,999 | 13 | 7.3% |
| $100,000 to $149,999 | 23 | 12.8% |
| $150,000 to $199,999 | 46 | 25.7% |
| $200,000+ | 1 | 0.6% |
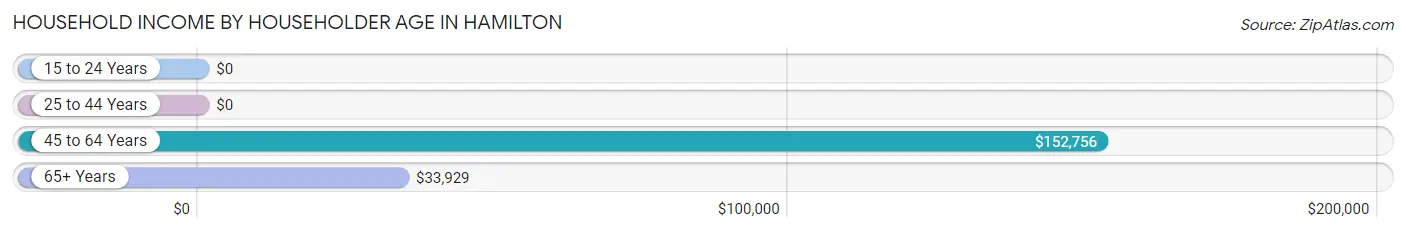
Household Income by Householder Age in Hamilton
The median household income in Hamilton is $64,063, with the highest median household income of $152,756 found in the 45 to 64 years age bracket for the primary householder. A total of 81 households (45.3%) fall into this category. Meanwhile, the 15 to 24 years age bracket for the primary householder has the lowest median household income of $0, with 4 households (2.2%) in this group.
| Income Bracket | # Households | Median Income |
| 15 to 24 Years | 4 (2.2%) | $0 |
| 25 to 44 Years | 52 (29.0%) | $0 |
| 45 to 64 Years | 81 (45.3%) | $152,756 |
| 65+ Years | 42 (23.5%) | $33,929 |
| Total | 179 (100.0%) | $64,063 |
Poverty in Hamilton
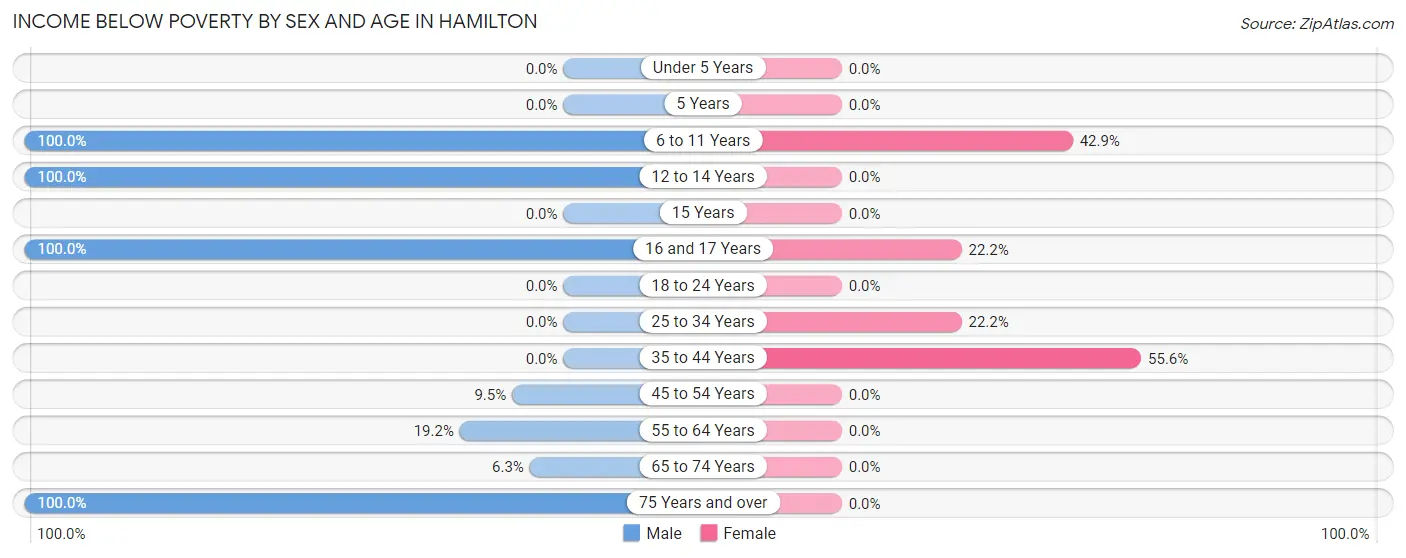
Income Below Poverty by Sex and Age in Hamilton
With 16.0% poverty level for males and 18.0% for females among the residents of Hamilton, 6 to 11 year old males and 35 to 44 year old females are the most vulnerable to poverty, with 4 males (100.0%) and 25 females (55.6%) in their respective age groups living below the poverty level.
| Age Bracket | Male | Female |
| Under 5 Years | 0 (0.0%) | 0 (0.0%) |
| 5 Years | 0 (0.0%) | 0 (0.0%) |
| 6 to 11 Years | 4 (100.0%) | 3 (42.9%) |
| 12 to 14 Years | 5 (100.0%) | 0 (0.0%) |
| 15 Years | 0 (0.0%) | 0 (0.0%) |
| 16 and 17 Years | 5 (100.0%) | 4 (22.2%) |
| 18 to 24 Years | 0 (0.0%) | 0 (0.0%) |
| 25 to 34 Years | 0 (0.0%) | 2 (22.2%) |
| 35 to 44 Years | 0 (0.0%) | 25 (55.6%) |
| 45 to 54 Years | 6 (9.5%) | 0 (0.0%) |
| 55 to 64 Years | 5 (19.2%) | 0 (0.0%) |
| 65 to 74 Years | 1 (6.2%) | 0 (0.0%) |
| 75 Years and over | 4 (100.0%) | 0 (0.0%) |
| Total | 30 (16.0%) | 34 (18.0%) |
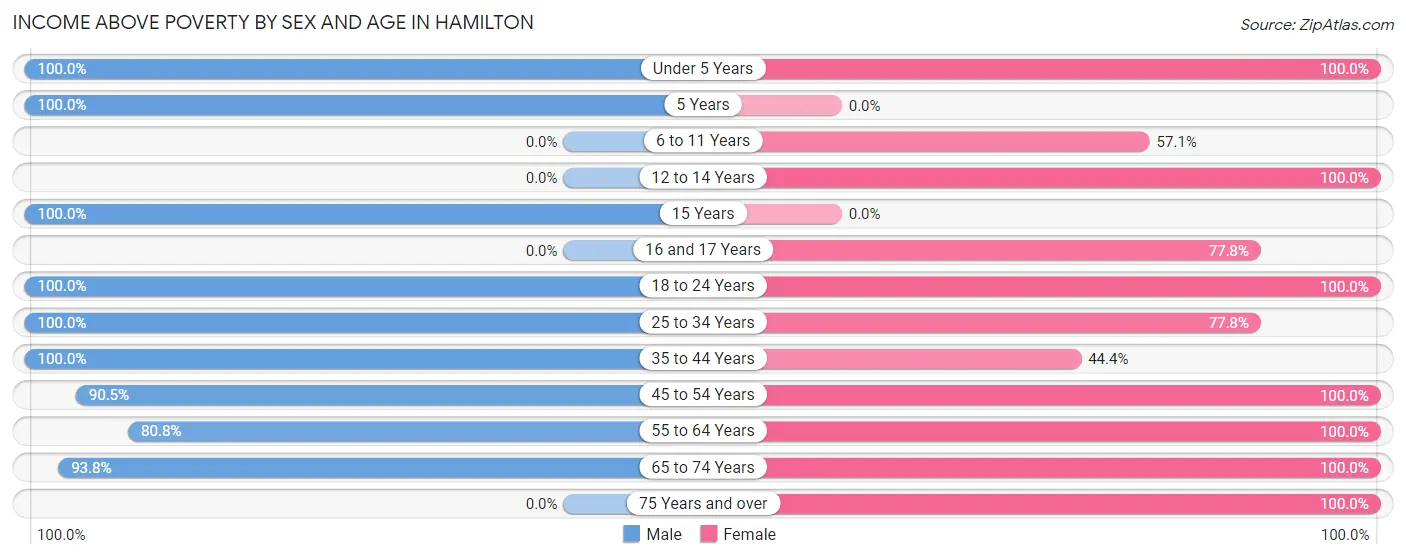
Income Above Poverty by Sex and Age in Hamilton
According to the poverty statistics in Hamilton, males aged under 5 years and females aged under 5 years are the age groups that are most secure financially, with 100.0% of males and 100.0% of females in these age groups living above the poverty line.
| Age Bracket | Male | Female |
| Under 5 Years | 5 (100.0%) | 2 (100.0%) |
| 5 Years | 4 (100.0%) | 0 (0.0%) |
| 6 to 11 Years | 0 (0.0%) | 4 (57.1%) |
| 12 to 14 Years | 0 (0.0%) | 6 (100.0%) |
| 15 Years | 7 (100.0%) | 0 (0.0%) |
| 16 and 17 Years | 0 (0.0%) | 14 (77.8%) |
| 18 to 24 Years | 5 (100.0%) | 6 (100.0%) |
| 25 to 34 Years | 28 (100.0%) | 7 (77.8%) |
| 35 to 44 Years | 15 (100.0%) | 20 (44.4%) |
| 45 to 54 Years | 57 (90.5%) | 11 (100.0%) |
| 55 to 64 Years | 21 (80.8%) | 52 (100.0%) |
| 65 to 74 Years | 15 (93.8%) | 24 (100.0%) |
| 75 Years and over | 0 (0.0%) | 9 (100.0%) |
| Total | 157 (84.0%) | 155 (82.0%) |
Income Below Poverty Among Married-Couple Families in Hamilton
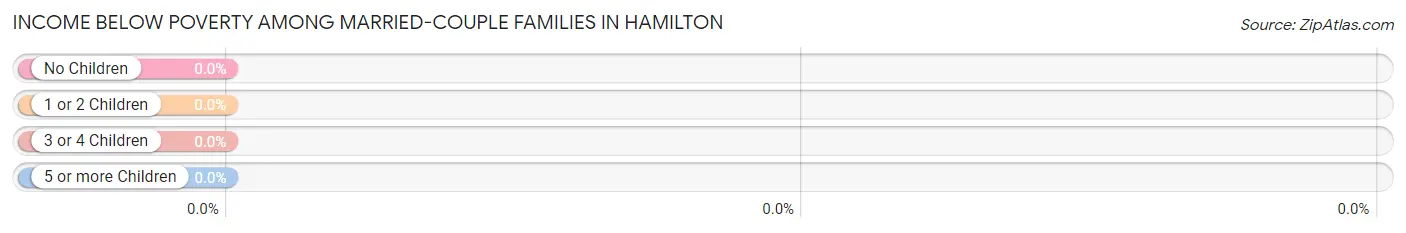
| Children | Above Poverty | Below Poverty |
| No Children | 77 (100.0%) | 0 (0.0%) |
| 1 or 2 Children | 7 (100.0%) | 0 (0.0%) |
| 3 or 4 Children | 0 (0.0%) | 0 (0.0%) |
| 5 or more Children | 0 (0.0%) | 0 (0.0%) |
| Total | 84 (100.0%) | 0 (0.0%) |
Income Below Poverty Among Single-Parent Households in Hamilton
According to the poverty data in Hamilton, 60.0% or 6 single-father households and 48.8% or 20 single-mother households are living below the poverty line. Among single-father households, those with 1 or 2 children have the highest poverty rate, with 6 households (100.0%) experiencing poverty. Likewise, among single-mother households, those with 1 or 2 children have the highest poverty rate, with 20 households (76.9%) falling below the poverty line.
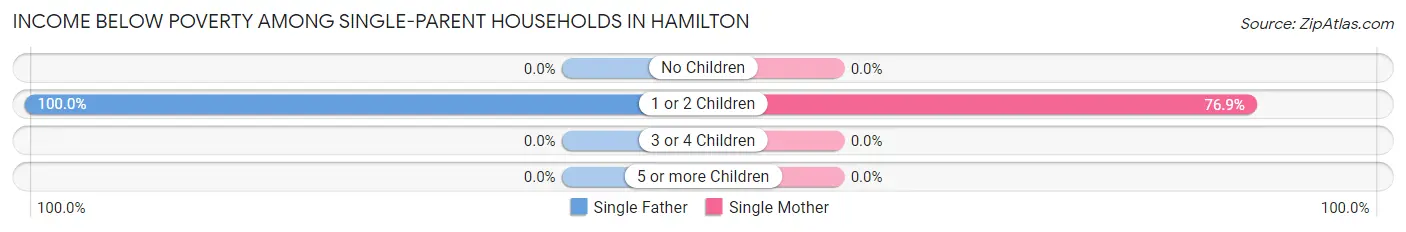
| Children | Single Father | Single Mother |
| No Children | 0 (0.0%) | 0 (0.0%) |
| 1 or 2 Children | 6 (100.0%) | 20 (76.9%) |
| 3 or 4 Children | 0 (0.0%) | 0 (0.0%) |
| 5 or more Children | 0 (0.0%) | 0 (0.0%) |
| Total | 6 (60.0%) | 20 (48.8%) |
Income Below Poverty Among Married-Couple vs Single-Parent Households in Hamilton
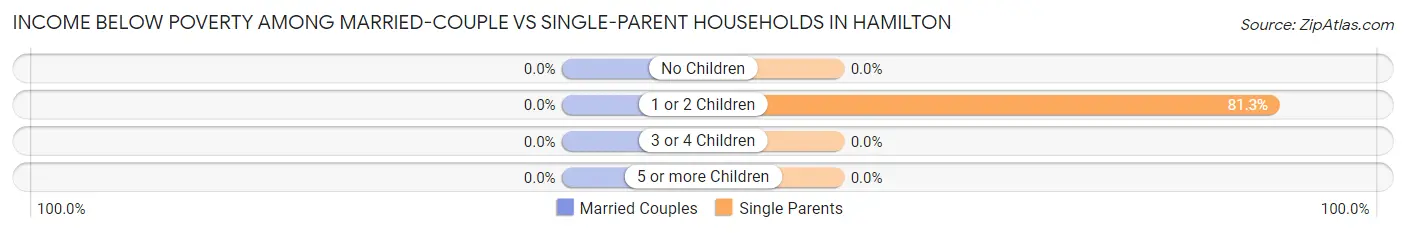
| Children | Married-Couple Families | Single-Parent Households |
| No Children | 0 (0.0%) | 0 (0.0%) |
| 1 or 2 Children | 0 (0.0%) | 26 (81.2%) |
| 3 or 4 Children | 0 (0.0%) | 0 (0.0%) |
| 5 or more Children | 0 (0.0%) | 0 (0.0%) |
| Total | 0 (0.0%) | 26 (51.0%) |
Race in Hamilton
The most populous races in Hamilton are White / Caucasian (321 | 85.4%), Hispanic or Latino (33 | 8.8%), and Two or more Races (27 | 7.2%).
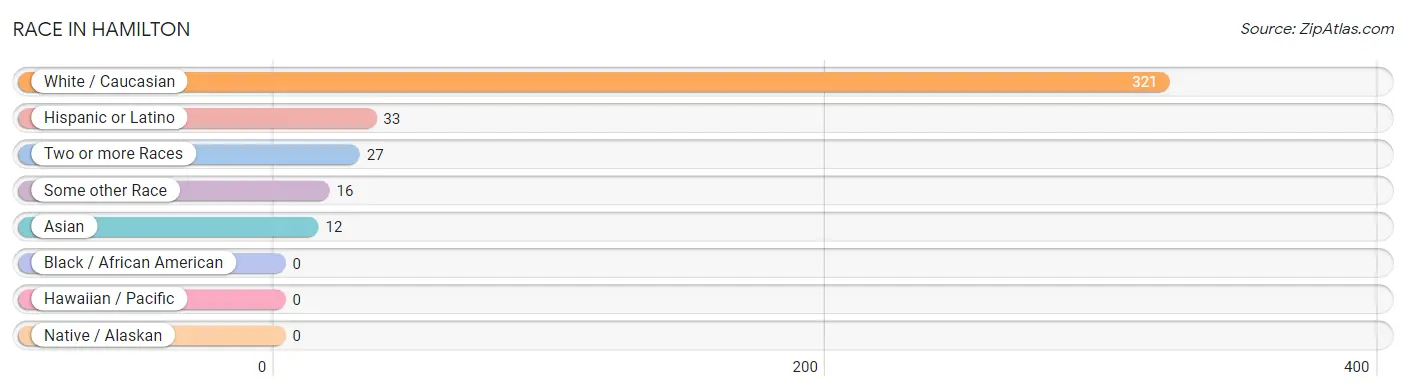
| Race | # Population | % Population |
| Asian | 12 | 3.2% |
| Black / African American | 0 | 0.0% |
| Hawaiian / Pacific | 0 | 0.0% |
| Hispanic or Latino | 33 | 8.8% |
| Native / Alaskan | 0 | 0.0% |
| White / Caucasian | 321 | 85.4% |
| Two or more Races | 27 | 7.2% |
| Some other Race | 16 | 4.3% |
| Total | 376 | 100.0% |
Ancestry in Hamilton
The most populous ancestries reported in Hamilton are Irish (87 | 23.1%), English (59 | 15.7%), Polish (51 | 13.6%), Ukrainian (43 | 11.4%), and Swedish (42 | 11.2%), together accounting for 75.0% of all Hamilton residents.
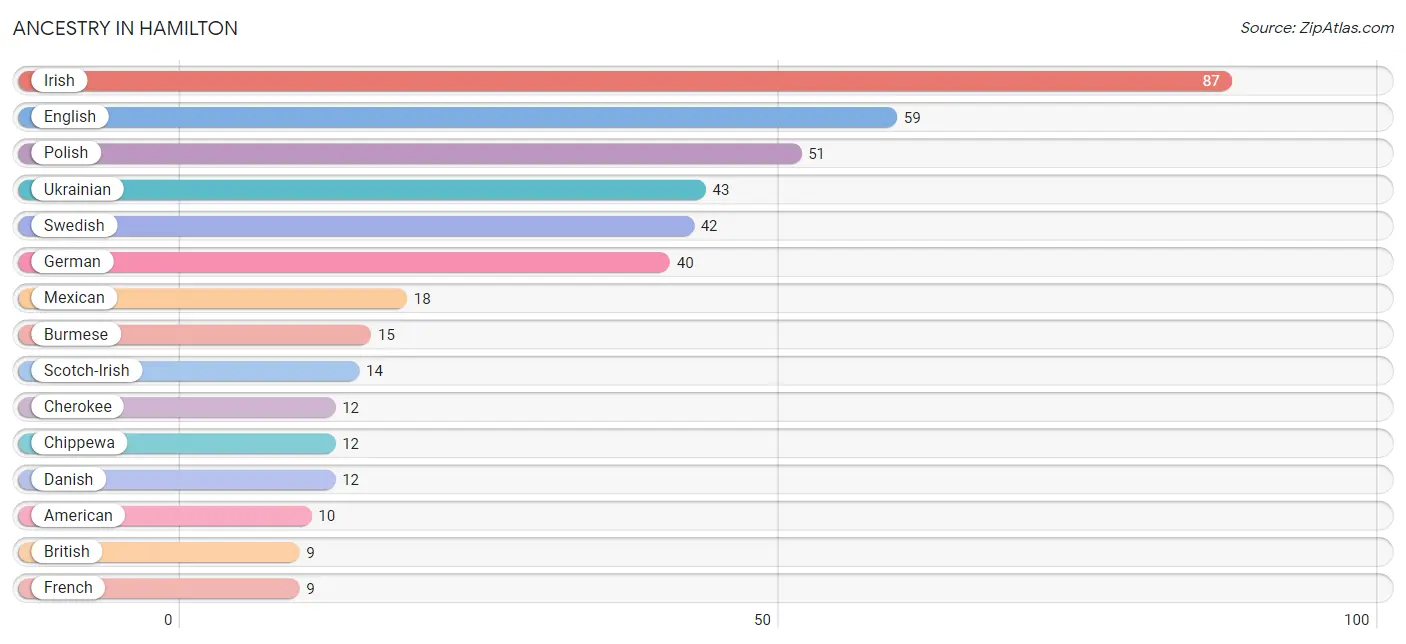
| Ancestry | # Population | % Population |
| American | 10 | 2.7% |
| British | 9 | 2.4% |
| Burmese | 15 | 4.0% |
| Cherokee | 12 | 3.2% |
| Chippewa | 12 | 3.2% |
| Czech | 2 | 0.5% |
| Danish | 12 | 3.2% |
| Dutch | 2 | 0.5% |
| English | 59 | 15.7% |
| French | 9 | 2.4% |
| German | 40 | 10.6% |
| Hungarian | 2 | 0.5% |
| Irish | 87 | 23.1% |
| Italian | 5 | 1.3% |
| Mexican | 18 | 4.8% |
| Polish | 51 | 13.6% |
| Portuguese | 1 | 0.3% |
| Puerto Rican | 5 | 1.3% |
| Scotch-Irish | 14 | 3.7% |
| Scottish | 3 | 0.8% |
| Swedish | 42 | 11.2% |
| Ukrainian | 43 | 11.4% |
| Welsh | 5 | 1.3% | View All 23 Rows |
Immigrants in Hamilton
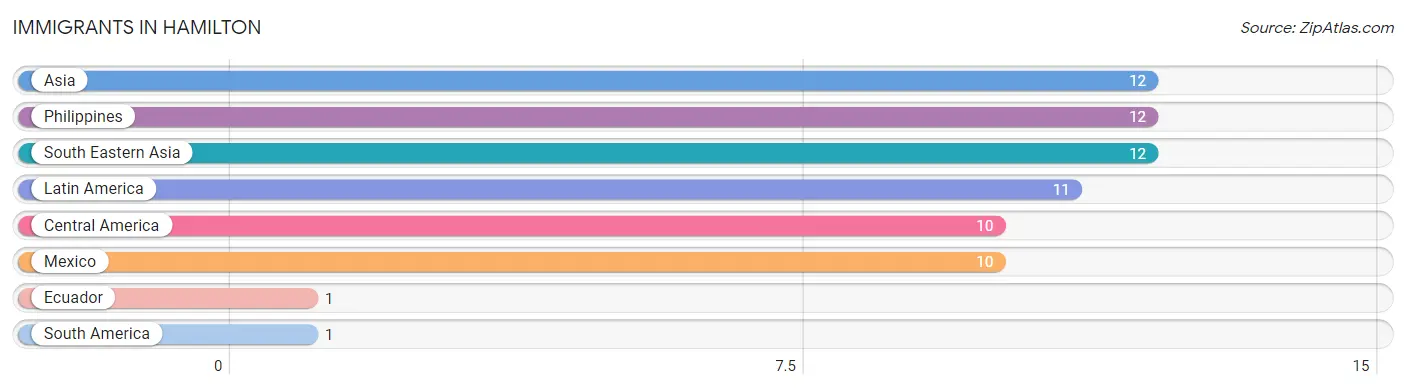
The most numerous immigrant groups reported in Hamilton came from Asia (12 | 3.2%), Philippines (12 | 3.2%), South Eastern Asia (12 | 3.2%), Latin America (11 | 2.9%), and Central America (10 | 2.7%), together accounting for 15.2% of all Hamilton residents.
| Immigration Origin | # Population | % Population |
| Asia | 12 | 3.2% |
| Central America | 10 | 2.7% |
| Ecuador | 1 | 0.3% |
| Latin America | 11 | 2.9% |
| Mexico | 10 | 2.7% |
| Philippines | 12 | 3.2% |
| South America | 1 | 0.3% |
| South Eastern Asia | 12 | 3.2% | View All 8 Rows |
Sex and Age in Hamilton
Sex and Age in Hamilton
The most populous age groups in Hamilton are 50 to 54 Years (57 | 30.5%) for men and 55 to 59 Years (50 | 26.5%) for women.
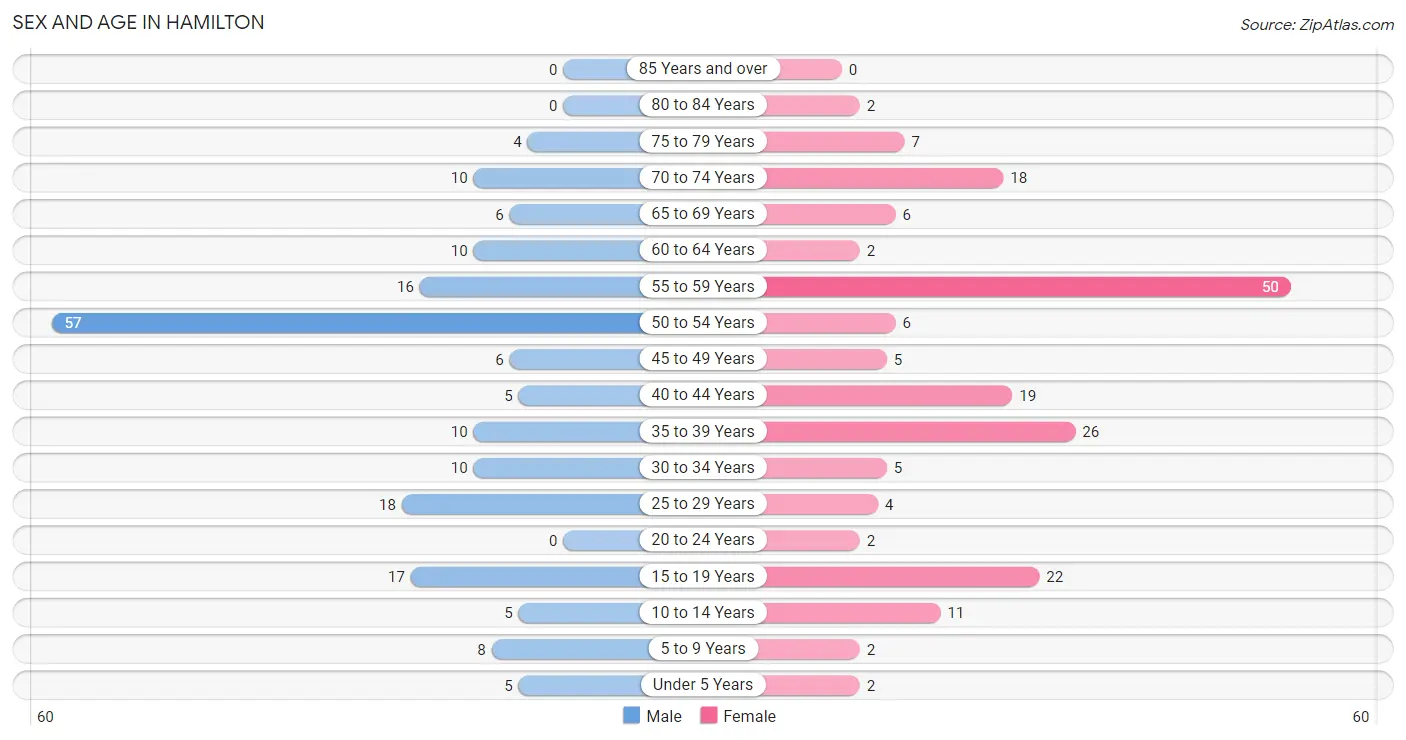
| Age Bracket | Male | Female |
| Under 5 Years | 5 (2.7%) | 2 (1.1%) |
| 5 to 9 Years | 8 (4.3%) | 2 (1.1%) |
| 10 to 14 Years | 5 (2.7%) | 11 (5.8%) |
| 15 to 19 Years | 17 (9.1%) | 22 (11.6%) |
| 20 to 24 Years | 0 (0.0%) | 2 (1.1%) |
| 25 to 29 Years | 18 (9.6%) | 4 (2.1%) |
| 30 to 34 Years | 10 (5.3%) | 5 (2.6%) |
| 35 to 39 Years | 10 (5.3%) | 26 (13.8%) |
| 40 to 44 Years | 5 (2.7%) | 19 (10.1%) |
| 45 to 49 Years | 6 (3.2%) | 5 (2.6%) |
| 50 to 54 Years | 57 (30.5%) | 6 (3.2%) |
| 55 to 59 Years | 16 (8.6%) | 50 (26.5%) |
| 60 to 64 Years | 10 (5.3%) | 2 (1.1%) |
| 65 to 69 Years | 6 (3.2%) | 6 (3.2%) |
| 70 to 74 Years | 10 (5.3%) | 18 (9.5%) |
| 75 to 79 Years | 4 (2.1%) | 7 (3.7%) |
| 80 to 84 Years | 0 (0.0%) | 2 (1.1%) |
| 85 Years and over | 0 (0.0%) | 0 (0.0%) |
| Total | 187 (100.0%) | 189 (100.0%) |
Families and Households in Hamilton
Median Family Size in Hamilton
The median family size in Hamilton is 2.32 persons per family, with single female/mother families (41 | 30.4%) accounting for the largest median family size of 2.63 persons per family. On the other hand, single male/father families (10 | 7.4%) represent the smallest median family size with 1.80 persons per family.
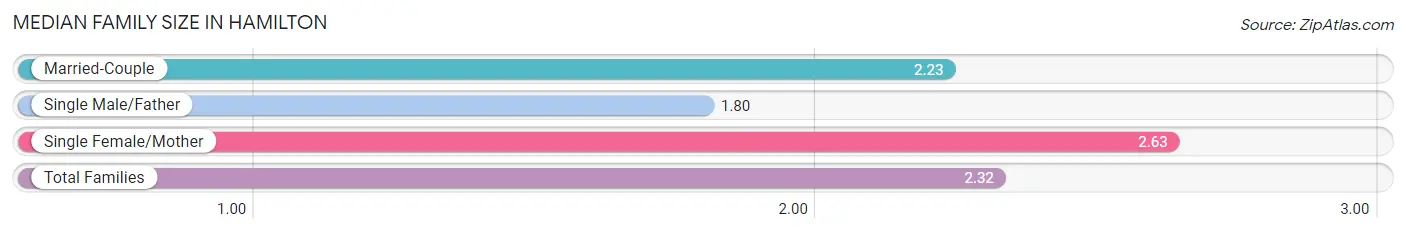
| Family Type | # Families | Family Size |
| Married-Couple | 84 (62.2%) | 2.23 |
| Single Male/Father | 10 (7.4%) | 1.80 |
| Single Female/Mother | 41 (30.4%) | 2.63 |
| Total Families | 135 (100.0%) | 2.32 |
Median Household Size in Hamilton
The median household size in Hamilton is 2.10 persons per household, with single female/mother households (41 | 22.9%) accounting for the largest median household size of 2.83 persons per household. non-family households (44 | 24.6%) represent the smallest median household size with 1.14 persons per household.
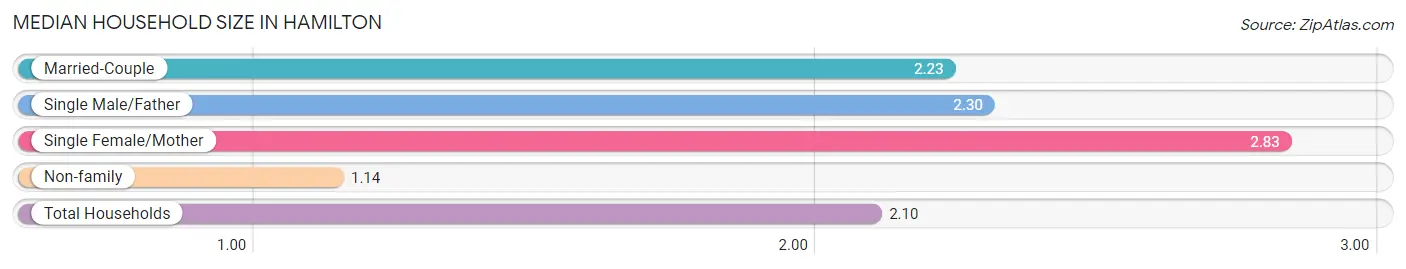
| Household Type | # Households | Household Size |
| Married-Couple | 84 (46.9%) | 2.23 |
| Single Male/Father | 10 (5.6%) | 2.30 |
| Single Female/Mother | 41 (22.9%) | 2.83 |
| Non-family | 44 (24.6%) | 1.14 |
| Total Households | 179 (100.0%) | 2.10 |
Household Size by Marriage Status in Hamilton
Out of a total of 179 households in Hamilton, 135 (75.4%) are family households, while 44 (24.6%) are nonfamily households. The most numerous type of family households are 2-person households, comprising 94, and the most common type of nonfamily households are 1-person households, comprising 38.
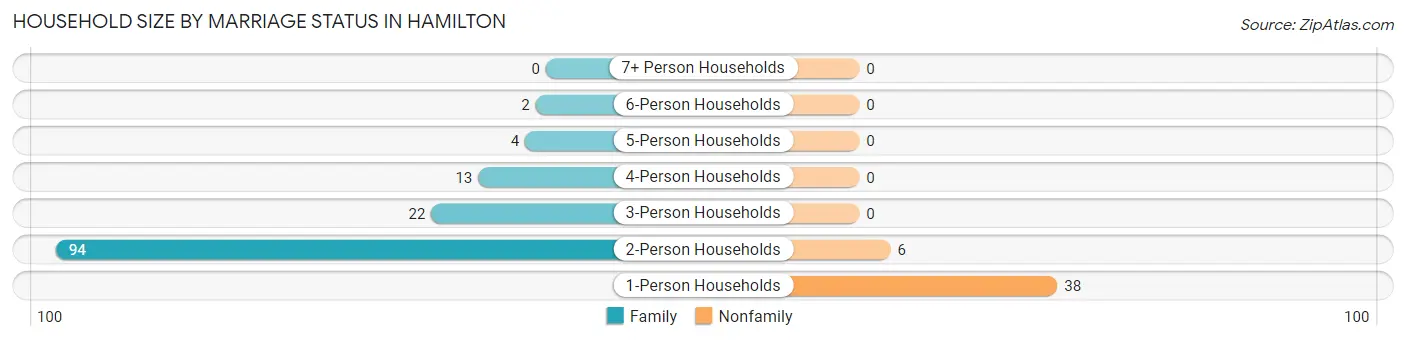
| Household Size | Family Households | Nonfamily Households |
| 1-Person Households | - | 38 (21.2%) |
| 2-Person Households | 94 (52.5%) | 6 (3.4%) |
| 3-Person Households | 22 (12.3%) | 0 (0.0%) |
| 4-Person Households | 13 (7.3%) | 0 (0.0%) |
| 5-Person Households | 4 (2.2%) | 0 (0.0%) |
| 6-Person Households | 2 (1.1%) | 0 (0.0%) |
| 7+ Person Households | 0 (0.0%) | 0 (0.0%) |
| Total | 135 (75.4%) | 44 (24.6%) |
Female Fertility in Hamilton
Fertility by Age in Hamilton
Average fertility rate in Hamilton is 108.0 births per 1,000 women. Women in the age bracket of 35 to 50 years have the highest fertility rate with 180.0 births per 1,000 women. Women in the age bracket of 35 to 50 years acount for 100.0% of all women with births.
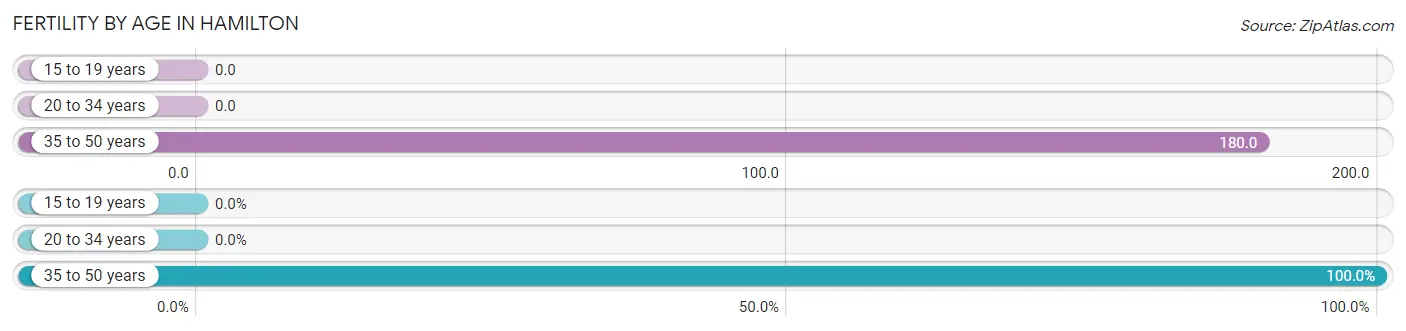
| Age Bracket | Women with Births | Births / 1,000 Women |
| 15 to 19 years | 0 (0.0%) | 0.0 |
| 20 to 34 years | 0 (0.0%) | 0.0 |
| 35 to 50 years | 9 (100.0%) | 180.0 |
| Total | 9 (100.0%) | 108.0 |
Fertility by Age by Marriage Status in Hamilton
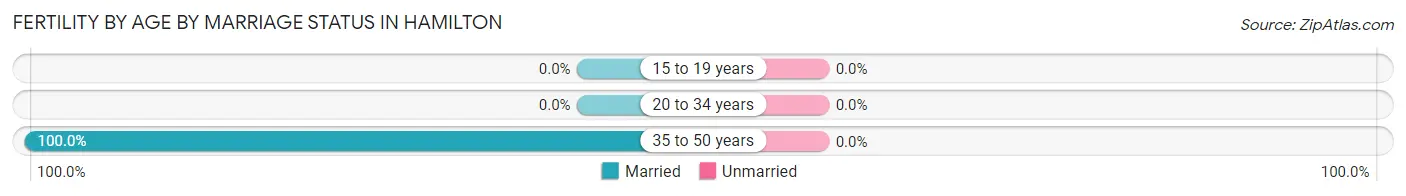
| Age Bracket | Married | Unmarried |
| 15 to 19 years | 0 (0.0%) | 0 (0.0%) |
| 20 to 34 years | 0 (0.0%) | 0 (0.0%) |
| 35 to 50 years | 9 (100.0%) | 0 (0.0%) |
| Total | 9 (100.0%) | 0 (0.0%) |
Fertility by Education in Hamilton
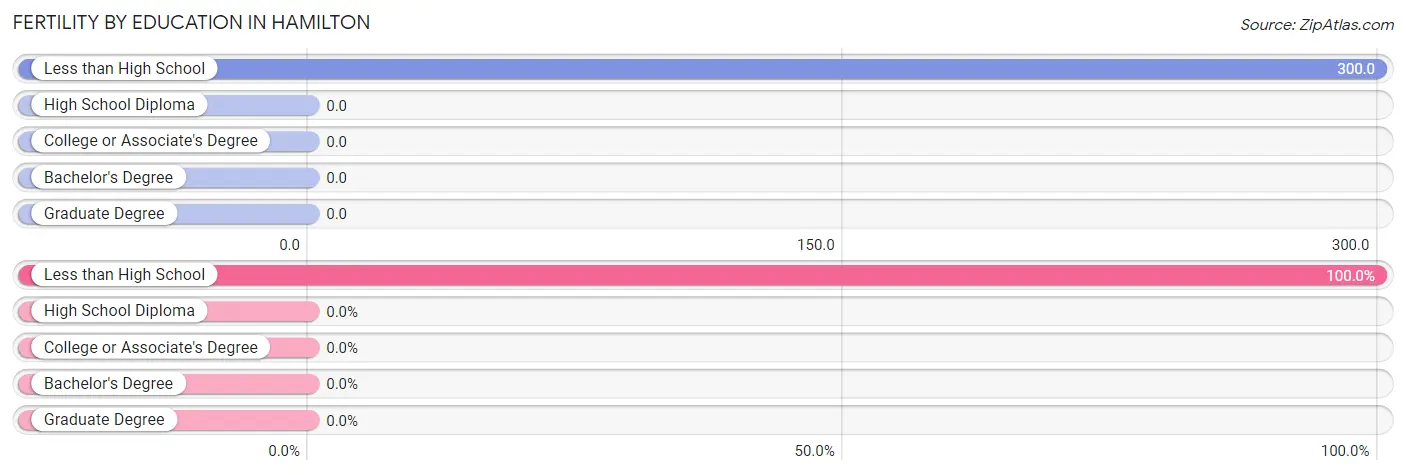
| Educational Attainment | Women with Births | Births / 1,000 Women |
| Less than High School | 9 (100.0%) | 300.0 |
| High School Diploma | 0 (0.0%) | 0.0 |
| College or Associate's Degree | 0 (0.0%) | 0.0 |
| Bachelor's Degree | 0 (0.0%) | 0.0 |
| Graduate Degree | 0 (0.0%) | 0.0 |
| Total | 9 (100.0%) | 108.0 |
Fertility by Education by Marriage Status in Hamilton
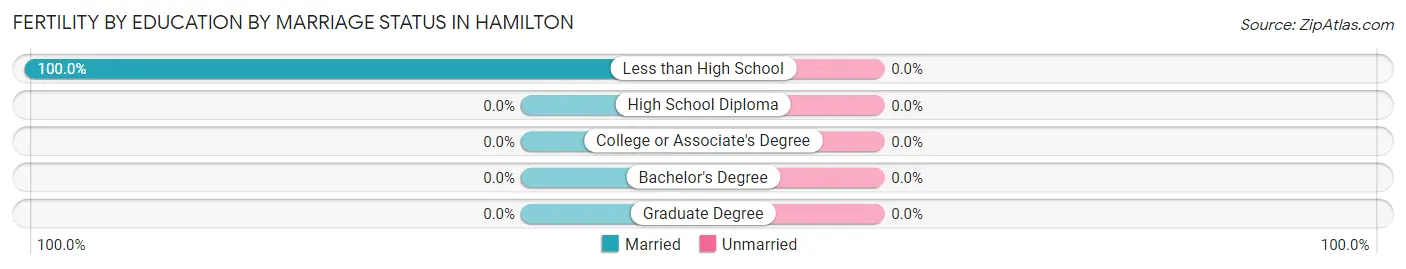
| Educational Attainment | Married | Unmarried |
| Less than High School | 9 (100.0%) | 0 (0.0%) |
| High School Diploma | 0 (0.0%) | 0 (0.0%) |
| College or Associate's Degree | 0 (0.0%) | 0 (0.0%) |
| Bachelor's Degree | 0 (0.0%) | 0 (0.0%) |
| Graduate Degree | 0 (0.0%) | 0 (0.0%) |
| Total | 9 (100.0%) | 0 (0.0%) |
Employment Characteristics in Hamilton
Employment by Class of Employer in Hamilton
Among the 124 employed individuals in Hamilton, private company employees (115 | 92.7%), self-employed (not incorporated) (5 | 4.0%), and not-for-profit organizations (3 | 2.4%) make up the most common classes of employment.
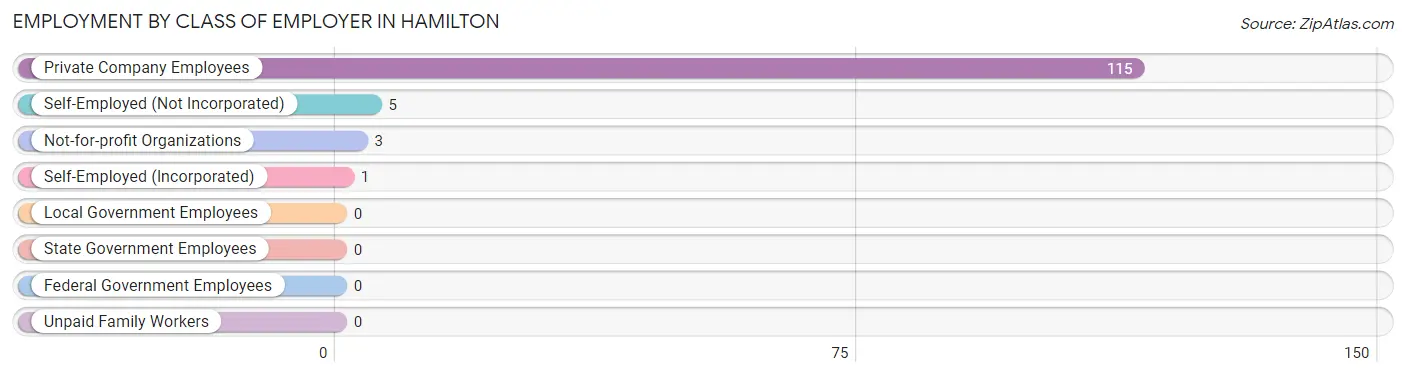
| Employer Class | # Employees | % Employees |
| Private Company Employees | 115 | 92.7% |
| Self-Employed (Incorporated) | 1 | 0.8% |
| Self-Employed (Not Incorporated) | 5 | 4.0% |
| Not-for-profit Organizations | 3 | 2.4% |
| Local Government Employees | 0 | 0.0% |
| State Government Employees | 0 | 0.0% |
| Federal Government Employees | 0 | 0.0% |
| Unpaid Family Workers | 0 | 0.0% |
| Total | 124 | 100.0% |
Employment Status by Age in Hamilton
According to the labor force statistics for Hamilton, out of the total population over 16 years of age (336), 46.1% or 155 individuals are in the labor force, with 8.4% or 13 of them unemployed. The age group with the highest labor force participation rate is 45 to 54 years, with 79.7% or 59 individuals in the labor force. Within the labor force, the 16 to 19 years age range has the highest percentage of unemployed individuals, with 53.3% or 8 of them being unemployed.
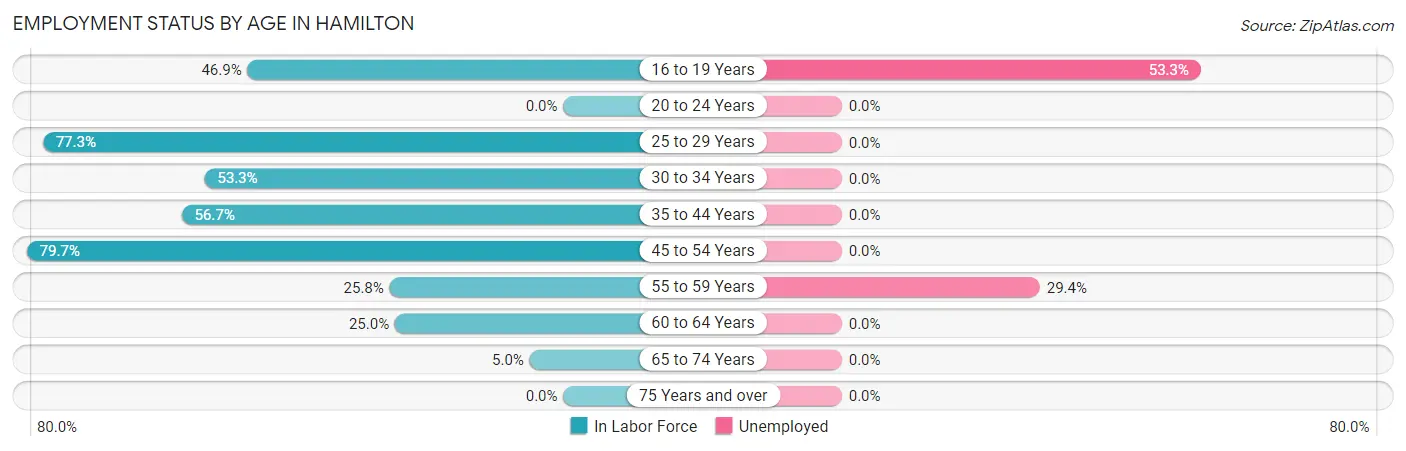
| Age Bracket | In Labor Force | Unemployed |
| 16 to 19 Years | 15 (46.9%) | 8 (53.3%) |
| 20 to 24 Years | 0 (0.0%) | 0 (0.0%) |
| 25 to 29 Years | 17 (77.3%) | 0 (0.0%) |
| 30 to 34 Years | 8 (53.3%) | 0 (0.0%) |
| 35 to 44 Years | 34 (56.7%) | 0 (0.0%) |
| 45 to 54 Years | 59 (79.7%) | 0 (0.0%) |
| 55 to 59 Years | 17 (25.8%) | 5 (29.4%) |
| 60 to 64 Years | 3 (25.0%) | 0 (0.0%) |
| 65 to 74 Years | 2 (5.0%) | 0 (0.0%) |
| 75 Years and over | 0 (0.0%) | 0 (0.0%) |
| Total | 155 (46.1%) | 13 (8.4%) |
Employment Status by Educational Attainment in Hamilton
According to labor force statistics for Hamilton, 55.4% of individuals (138) out of the total population between 25 and 64 years of age (249) are in the labor force, with 3.6% or 5 of them being unemployed. The group with the highest labor force participation rate are those with the educational attainment of less than high school, with 84.6% or 33 individuals in the labor force. Within the labor force, individuals with high school diploma education have the highest percentage of unemployment, with 12.5% or 5 of them being unemployed.
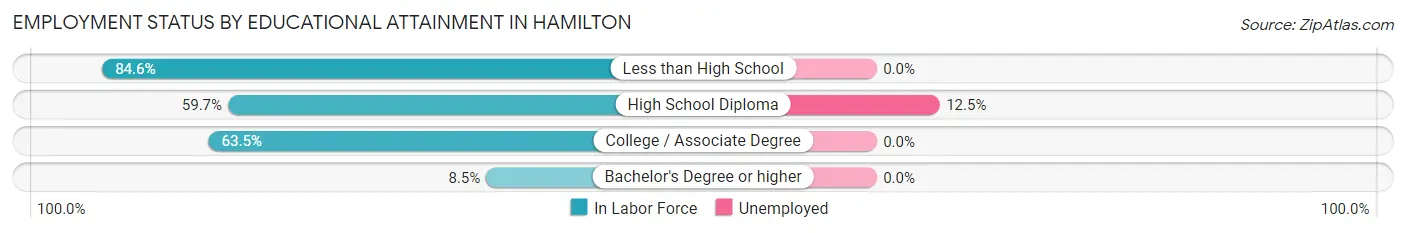
| Educational Attainment | In Labor Force | Unemployed |
| Less than High School | 33 (84.6%) | 0 (0.0%) |
| High School Diploma | 40 (59.7%) | 8 (12.5%) |
| College / Associate Degree | 61 (63.5%) | 0 (0.0%) |
| Bachelor's Degree or higher | 4 (8.5%) | 0 (0.0%) |
| Total | 138 (55.4%) | 9 (3.6%) |
Employment Occupations by Sex in Hamilton
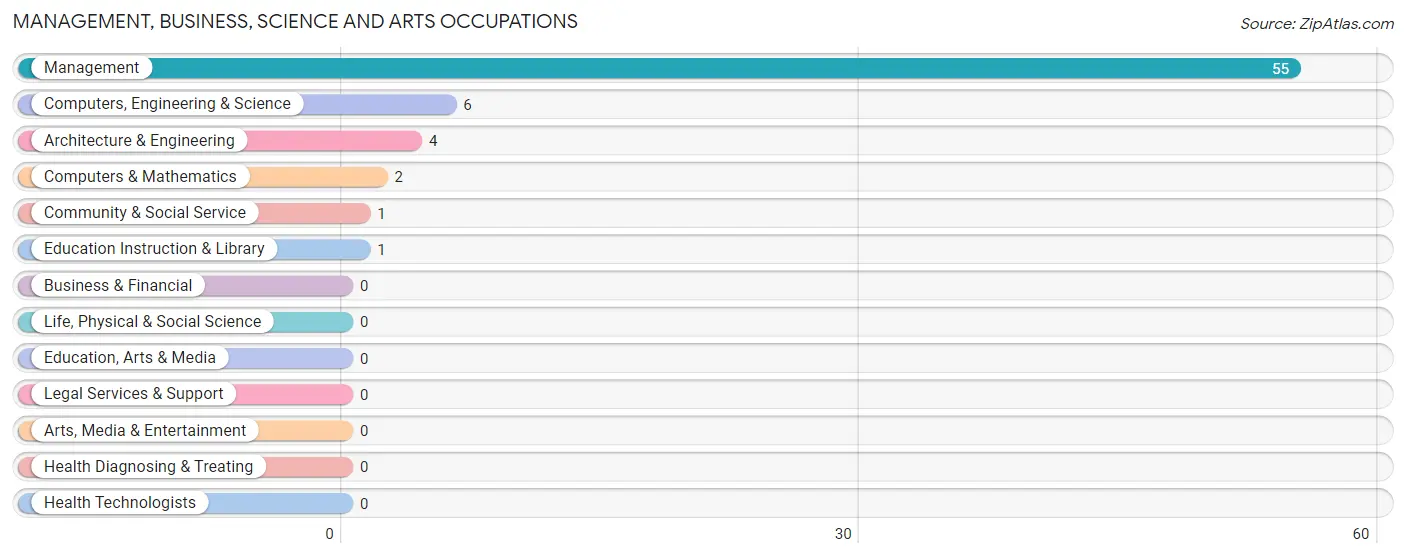
Management, Business, Science and Arts Occupations
The most common Management, Business, Science and Arts occupations in Hamilton are Management (55 | 38.7%), Computers, Engineering & Science (6 | 4.2%), Architecture & Engineering (4 | 2.8%), Computers & Mathematics (2 | 1.4%), and Community & Social Service (1 | 0.7%).
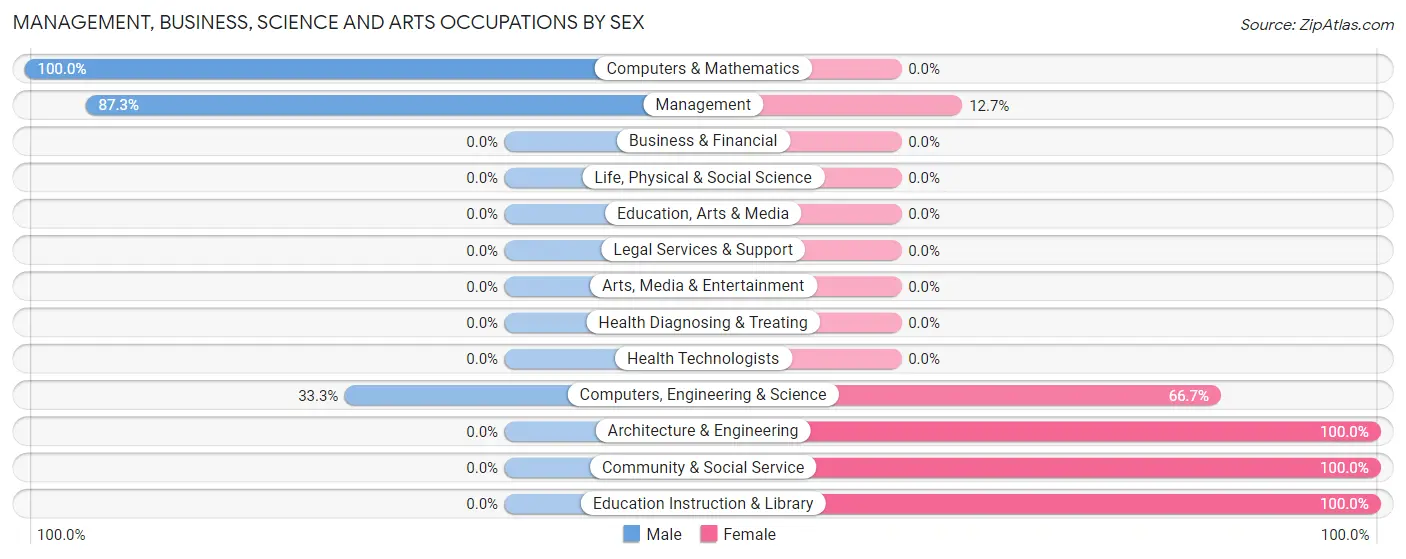
Management, Business, Science and Arts Occupations by Sex
Within the Management, Business, Science and Arts occupations in Hamilton, the most male-oriented occupations are Computers & Mathematics (100.0%), Management (87.3%), and Computers, Engineering & Science (33.3%), while the most female-oriented occupations are Architecture & Engineering (100.0%), Community & Social Service (100.0%), and Education Instruction & Library (100.0%).
| Occupation | Male | Female |
| Management | 48 (87.3%) | 7 (12.7%) |
| Business & Financial | 0 (0.0%) | 0 (0.0%) |
| Computers, Engineering & Science | 2 (33.3%) | 4 (66.7%) |
| Computers & Mathematics | 2 (100.0%) | 0 (0.0%) |
| Architecture & Engineering | 0 (0.0%) | 4 (100.0%) |
| Life, Physical & Social Science | 0 (0.0%) | 0 (0.0%) |
| Community & Social Service | 0 (0.0%) | 1 (100.0%) |
| Education, Arts & Media | 0 (0.0%) | 0 (0.0%) |
| Legal Services & Support | 0 (0.0%) | 0 (0.0%) |
| Education Instruction & Library | 0 (0.0%) | 1 (100.0%) |
| Arts, Media & Entertainment | 0 (0.0%) | 0 (0.0%) |
| Health Diagnosing & Treating | 0 (0.0%) | 0 (0.0%) |
| Health Technologists | 0 (0.0%) | 0 (0.0%) |
| Total (Category) | 50 (80.6%) | 12 (19.4%) |
| Total (Overall) | 94 (66.2%) | 48 (33.8%) |
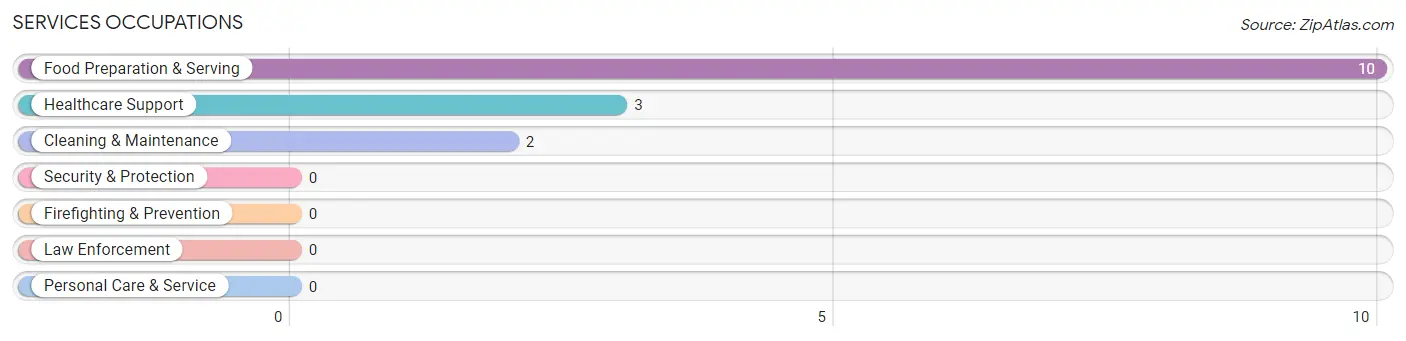
Services Occupations
The most common Services occupations in Hamilton are Food Preparation & Serving (10 | 7.0%), Healthcare Support (3 | 2.1%), and Cleaning & Maintenance (2 | 1.4%).
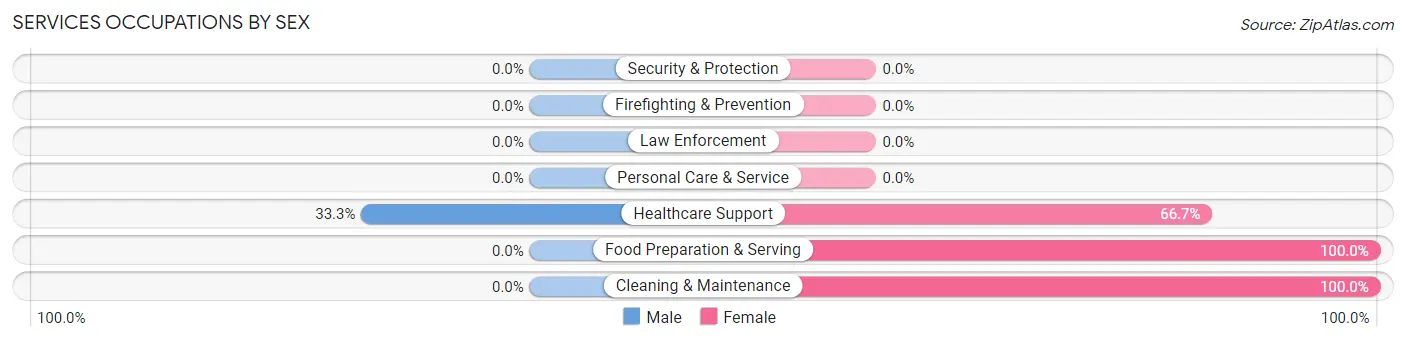
Services Occupations by Sex
| Occupation | Male | Female |
| Healthcare Support | 1 (33.3%) | 2 (66.7%) |
| Security & Protection | 0 (0.0%) | 0 (0.0%) |
| Firefighting & Prevention | 0 (0.0%) | 0 (0.0%) |
| Law Enforcement | 0 (0.0%) | 0 (0.0%) |
| Food Preparation & Serving | 0 (0.0%) | 10 (100.0%) |
| Cleaning & Maintenance | 0 (0.0%) | 2 (100.0%) |
| Personal Care & Service | 0 (0.0%) | 0 (0.0%) |
| Total (Category) | 1 (6.7%) | 14 (93.3%) |
| Total (Overall) | 94 (66.2%) | 48 (33.8%) |
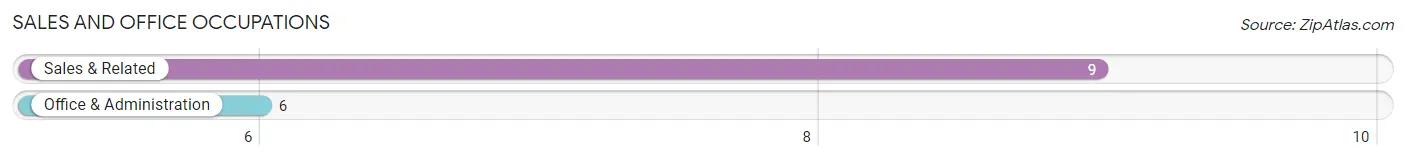
Sales and Office Occupations
The most common Sales and Office occupations in Hamilton are Sales & Related (9 | 6.3%), and Office & Administration (6 | 4.2%).
Sales and Office Occupations by Sex
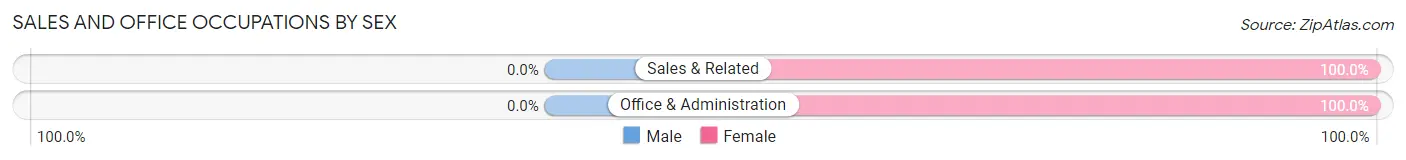
| Occupation | Male | Female |
| Sales & Related | 0 (0.0%) | 9 (100.0%) |
| Office & Administration | 0 (0.0%) | 6 (100.0%) |
| Total (Category) | 0 (0.0%) | 15 (100.0%) |
| Total (Overall) | 94 (66.2%) | 48 (33.8%) |
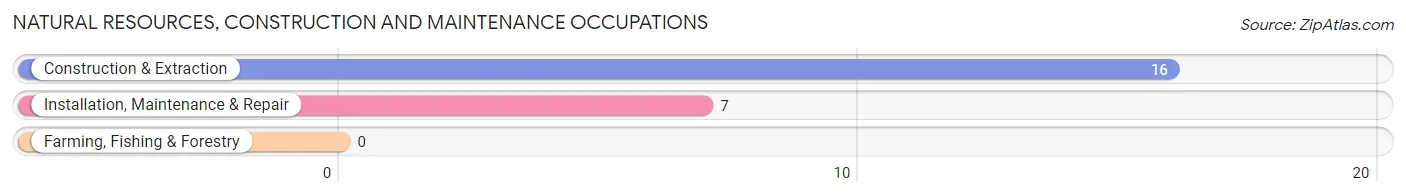
Natural Resources, Construction and Maintenance Occupations
The most common Natural Resources, Construction and Maintenance occupations in Hamilton are Construction & Extraction (16 | 11.3%), and Installation, Maintenance & Repair (7 | 4.9%).
Natural Resources, Construction and Maintenance Occupations by Sex
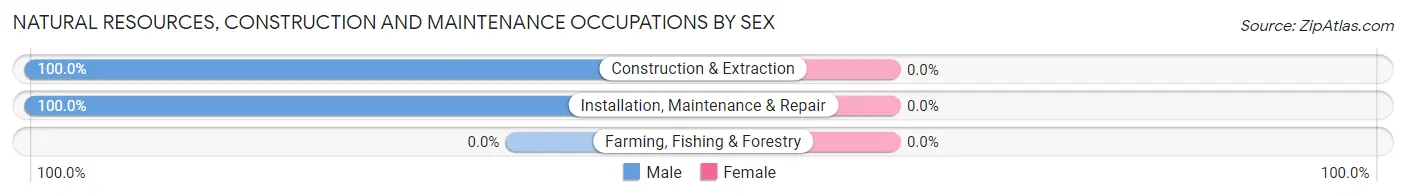
| Occupation | Male | Female |
| Farming, Fishing & Forestry | 0 (0.0%) | 0 (0.0%) |
| Construction & Extraction | 16 (100.0%) | 0 (0.0%) |
| Installation, Maintenance & Repair | 7 (100.0%) | 0 (0.0%) |
| Total (Category) | 23 (100.0%) | 0 (0.0%) |
| Total (Overall) | 94 (66.2%) | 48 (33.8%) |
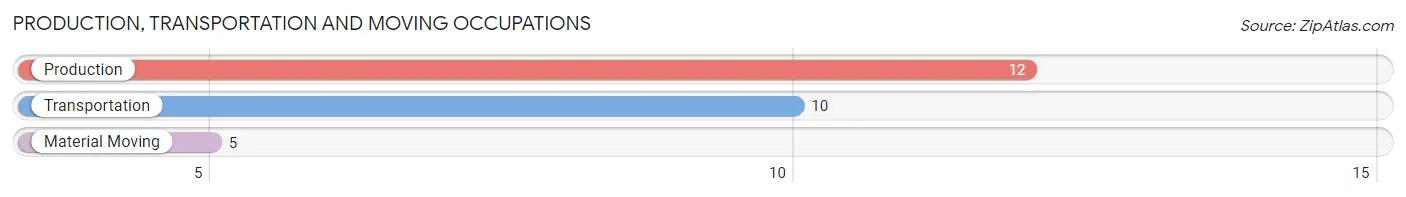
Production, Transportation and Moving Occupations
The most common Production, Transportation and Moving occupations in Hamilton are Production (12 | 8.5%), Transportation (10 | 7.0%), and Material Moving (5 | 3.5%).
Production, Transportation and Moving Occupations by Sex
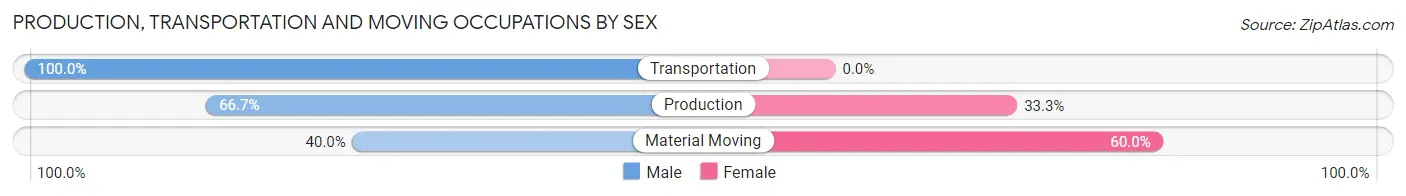
| Occupation | Male | Female |
| Production | 8 (66.7%) | 4 (33.3%) |
| Transportation | 10 (100.0%) | 0 (0.0%) |
| Material Moving | 2 (40.0%) | 3 (60.0%) |
| Total (Category) | 20 (74.1%) | 7 (25.9%) |
| Total (Overall) | 94 (66.2%) | 48 (33.8%) |
Employment Industries by Sex in Hamilton
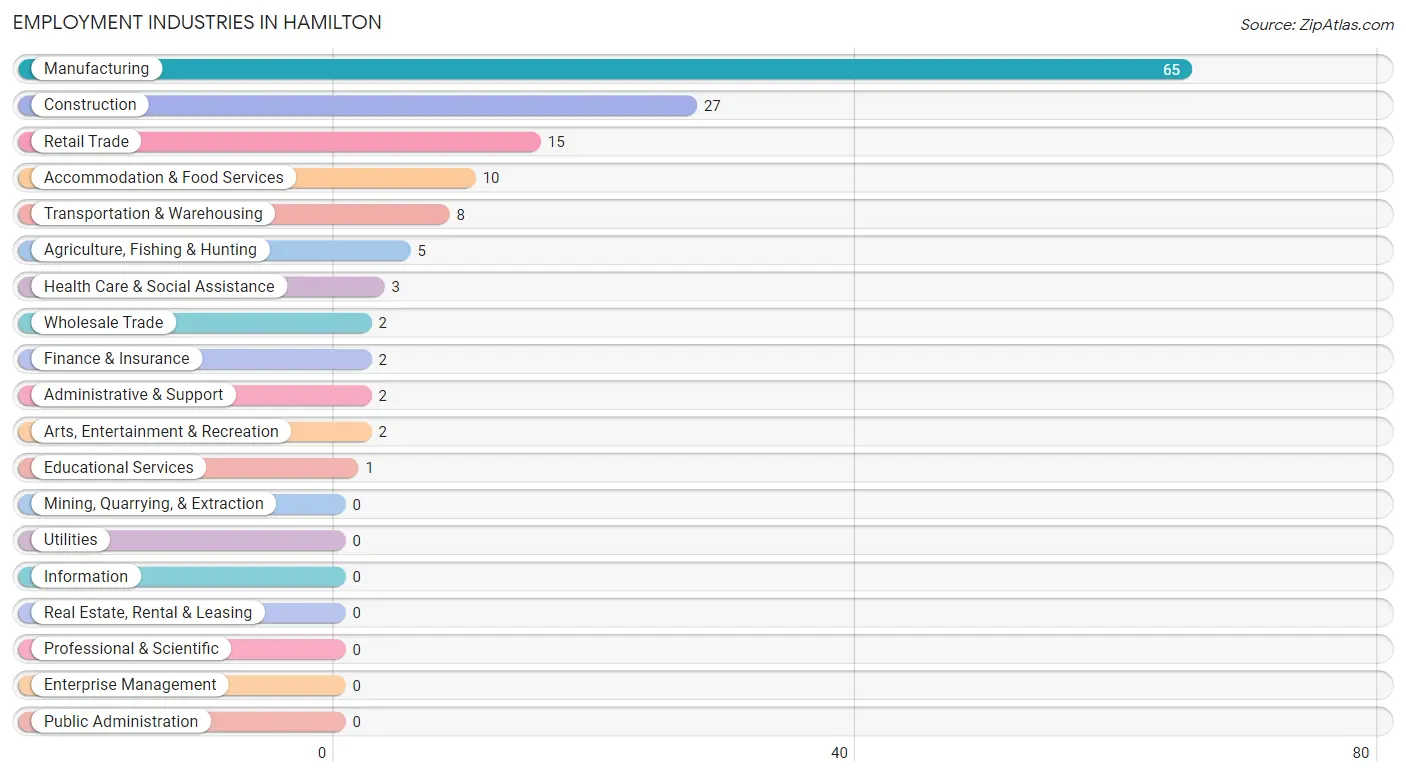
Employment Industries in Hamilton
The major employment industries in Hamilton include Manufacturing (65 | 45.8%), Construction (27 | 19.0%), Retail Trade (15 | 10.6%), Accommodation & Food Services (10 | 7.0%), and Transportation & Warehousing (8 | 5.6%).
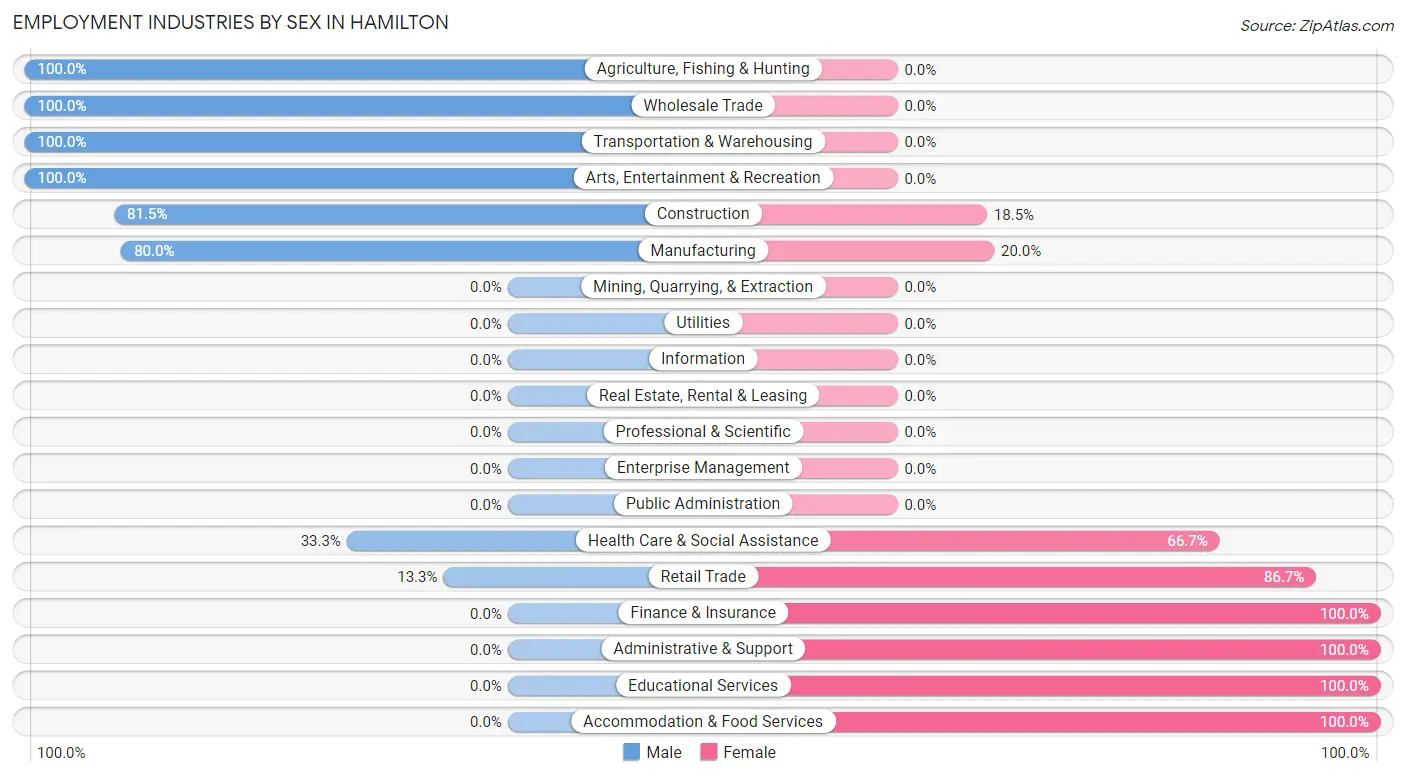
Employment Industries by Sex in Hamilton
The Hamilton industries that see more men than women are Agriculture, Fishing & Hunting (100.0%), Wholesale Trade (100.0%), and Transportation & Warehousing (100.0%), whereas the industries that tend to have a higher number of women are Finance & Insurance (100.0%), Administrative & Support (100.0%), and Educational Services (100.0%).
| Industry | Male | Female |
| Agriculture, Fishing & Hunting | 5 (100.0%) | 0 (0.0%) |
| Mining, Quarrying, & Extraction | 0 (0.0%) | 0 (0.0%) |
| Construction | 22 (81.5%) | 5 (18.5%) |
| Manufacturing | 52 (80.0%) | 13 (20.0%) |
| Wholesale Trade | 2 (100.0%) | 0 (0.0%) |
| Retail Trade | 2 (13.3%) | 13 (86.7%) |
| Transportation & Warehousing | 8 (100.0%) | 0 (0.0%) |
| Utilities | 0 (0.0%) | 0 (0.0%) |
| Information | 0 (0.0%) | 0 (0.0%) |
| Finance & Insurance | 0 (0.0%) | 2 (100.0%) |
| Real Estate, Rental & Leasing | 0 (0.0%) | 0 (0.0%) |
| Professional & Scientific | 0 (0.0%) | 0 (0.0%) |
| Enterprise Management | 0 (0.0%) | 0 (0.0%) |
| Administrative & Support | 0 (0.0%) | 2 (100.0%) |
| Educational Services | 0 (0.0%) | 1 (100.0%) |
| Health Care & Social Assistance | 1 (33.3%) | 2 (66.7%) |
| Arts, Entertainment & Recreation | 2 (100.0%) | 0 (0.0%) |
| Accommodation & Food Services | 0 (0.0%) | 10 (100.0%) |
| Public Administration | 0 (0.0%) | 0 (0.0%) |
| Total | 94 (66.2%) | 48 (33.8%) |
Education in Hamilton
School Enrollment in Hamilton
The most common levels of schooling among the 63 students in Hamilton are high school (30 | 47.6%), middle school (13 | 20.6%), and kindergarten (8 | 12.7%).
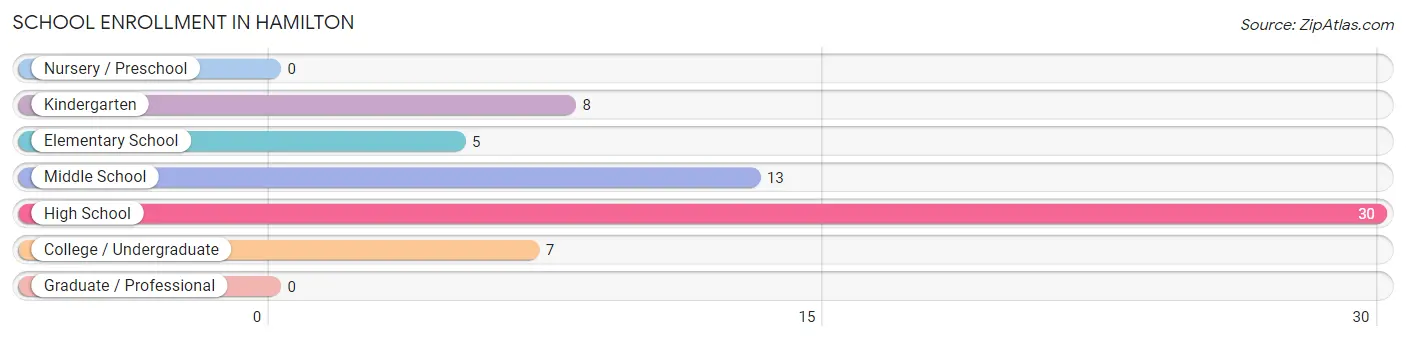
| School Level | # Students | % Students |
| Nursery / Preschool | 0 | 0.0% |
| Kindergarten | 8 | 12.7% |
| Elementary School | 5 | 7.9% |
| Middle School | 13 | 20.6% |
| High School | 30 | 47.6% |
| College / Undergraduate | 7 | 11.1% |
| Graduate / Professional | 0 | 0.0% |
| Total | 63 | 100.0% |
School Enrollment by Age by Funding Source in Hamilton
Out of a total of 63 students who are enrolled in schools in Hamilton, 4 (6.3%) attend a private institution, while the remaining 59 (93.7%) are enrolled in public schools. The age group of 5 to 9 year old has the highest likelihood of being enrolled in private schools, with 4 (40.0% in the age bracket) enrolled. Conversely, the age group of 10 to 14 year olds has the lowest likelihood of being enrolled in a private school, with 16 (100.0% in the age bracket) attending a public institution.
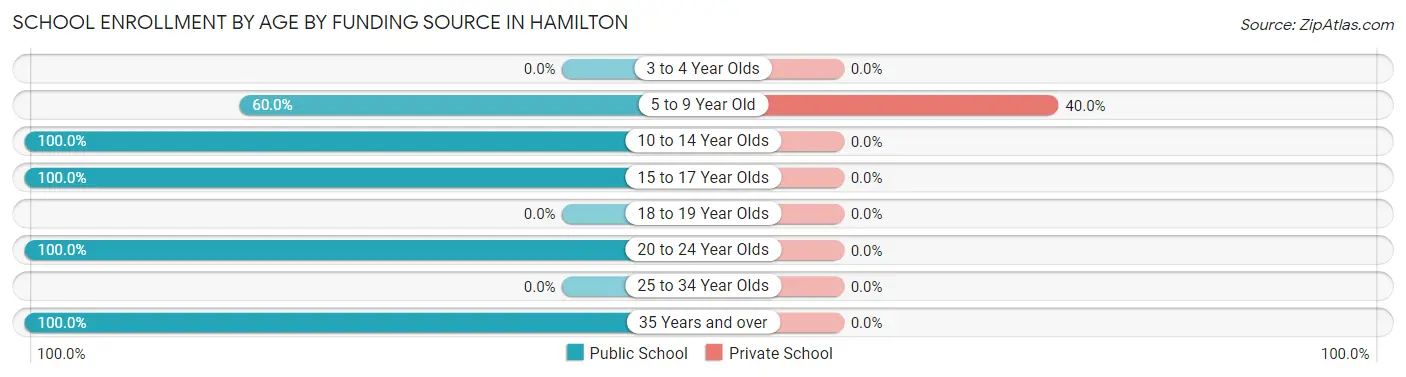
| Age Bracket | Public School | Private School |
| 3 to 4 Year Olds | 0 (0.0%) | 0 (0.0%) |
| 5 to 9 Year Old | 6 (60.0%) | 4 (40.0%) |
| 10 to 14 Year Olds | 16 (100.0%) | 0 (0.0%) |
| 15 to 17 Year Olds | 30 (100.0%) | 0 (0.0%) |
| 18 to 19 Year Olds | 0 (0.0%) | 0 (0.0%) |
| 20 to 24 Year Olds | 2 (100.0%) | 0 (0.0%) |
| 25 to 34 Year Olds | 0 (0.0%) | 0 (0.0%) |
| 35 Years and over | 5 (100.0%) | 0 (0.0%) |
| Total | 59 (93.7%) | 4 (6.3%) |
Educational Attainment by Field of Study in Hamilton
Business (43 | 58.9%), social sciences (11 | 15.1%), bio, nature & agricultural (10 | 13.7%), physical & health sciences (6 | 8.2%), and education (3 | 4.1%) are the most common fields of study among 73 individuals in Hamilton who have obtained a bachelor's degree or higher.
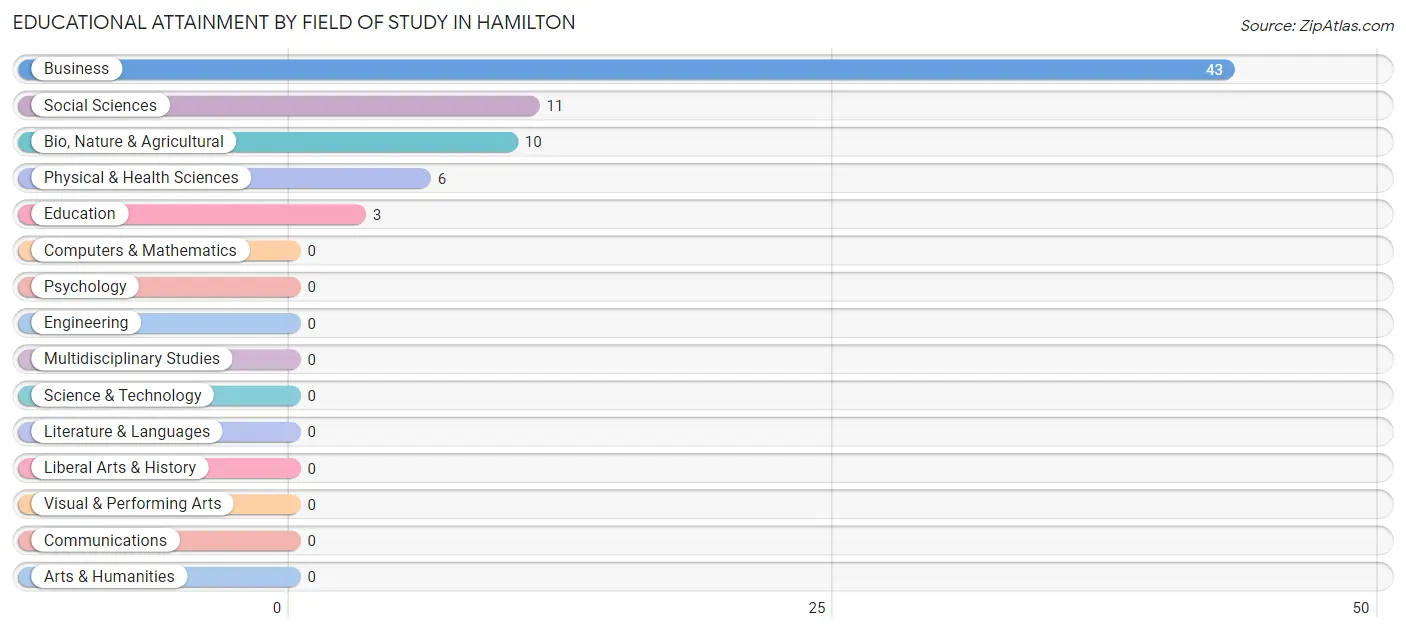
| Field of Study | # Graduates | % Graduates |
| Computers & Mathematics | 0 | 0.0% |
| Bio, Nature & Agricultural | 10 | 13.7% |
| Physical & Health Sciences | 6 | 8.2% |
| Psychology | 0 | 0.0% |
| Social Sciences | 11 | 15.1% |
| Engineering | 0 | 0.0% |
| Multidisciplinary Studies | 0 | 0.0% |
| Science & Technology | 0 | 0.0% |
| Business | 43 | 58.9% |
| Education | 3 | 4.1% |
| Literature & Languages | 0 | 0.0% |
| Liberal Arts & History | 0 | 0.0% |
| Visual & Performing Arts | 0 | 0.0% |
| Communications | 0 | 0.0% |
| Arts & Humanities | 0 | 0.0% |
| Total | 73 | 100.0% |
Transportation & Commute in Hamilton
Vehicle Availability by Sex in Hamilton
The most prevalent vehicle ownership categories in Hamilton are males with 2 vehicles (59, accounting for 69.4%) and females with 2 vehicles (11, making up 151.3%).
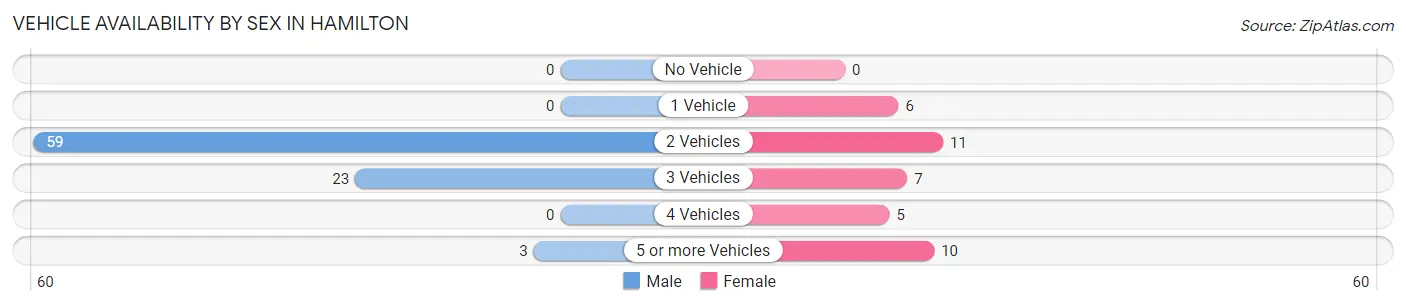
| Vehicles Available | Male | Female |
| No Vehicle | 0 (0.0%) | 0 (0.0%) |
| 1 Vehicle | 0 (0.0%) | 6 (15.4%) |
| 2 Vehicles | 59 (69.4%) | 11 (28.2%) |
| 3 Vehicles | 23 (27.1%) | 7 (17.9%) |
| 4 Vehicles | 0 (0.0%) | 5 (12.8%) |
| 5 or more Vehicles | 3 (3.5%) | 10 (25.6%) |
| Total | 85 (100.0%) | 39 (100.0%) |
Commute Time in Hamilton
The most frequently occuring commute durations in Hamilton are 20 to 24 minutes (46 commuters, 38.0%), 45 to 59 minutes (17 commuters, 14.1%), and 15 to 19 minutes (11 commuters, 9.1%).
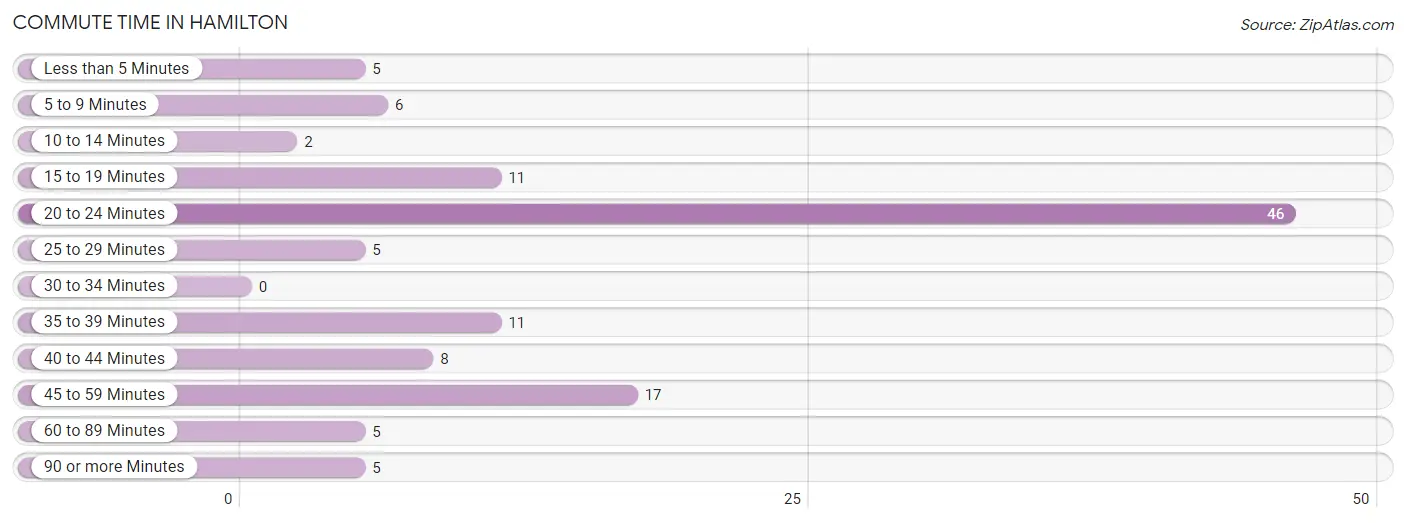
| Commute Time | # Commuters | % Commuters |
| Less than 5 Minutes | 5 | 4.1% |
| 5 to 9 Minutes | 6 | 5.0% |
| 10 to 14 Minutes | 2 | 1.7% |
| 15 to 19 Minutes | 11 | 9.1% |
| 20 to 24 Minutes | 46 | 38.0% |
| 25 to 29 Minutes | 5 | 4.1% |
| 30 to 34 Minutes | 0 | 0.0% |
| 35 to 39 Minutes | 11 | 9.1% |
| 40 to 44 Minutes | 8 | 6.6% |
| 45 to 59 Minutes | 17 | 14.1% |
| 60 to 89 Minutes | 5 | 4.1% |
| 90 or more Minutes | 5 | 4.1% |
Commute Time by Sex in Hamilton
The most common commute times in Hamilton are 20 to 24 minutes (46 commuters, 54.1%) for males and 35 to 39 minutes (7 commuters, 19.4%) for females.
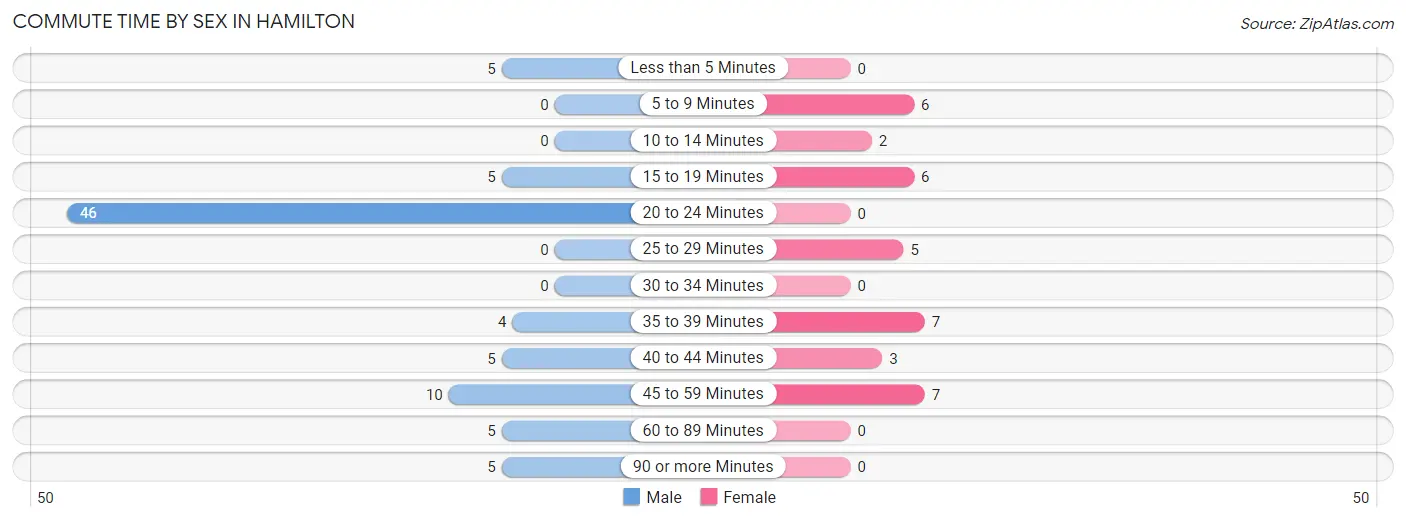
| Commute Time | Male | Female |
| Less than 5 Minutes | 5 (5.9%) | 0 (0.0%) |
| 5 to 9 Minutes | 0 (0.0%) | 6 (16.7%) |
| 10 to 14 Minutes | 0 (0.0%) | 2 (5.6%) |
| 15 to 19 Minutes | 5 (5.9%) | 6 (16.7%) |
| 20 to 24 Minutes | 46 (54.1%) | 0 (0.0%) |
| 25 to 29 Minutes | 0 (0.0%) | 5 (13.9%) |
| 30 to 34 Minutes | 0 (0.0%) | 0 (0.0%) |
| 35 to 39 Minutes | 4 (4.7%) | 7 (19.4%) |
| 40 to 44 Minutes | 5 (5.9%) | 3 (8.3%) |
| 45 to 59 Minutes | 10 (11.8%) | 7 (19.4%) |
| 60 to 89 Minutes | 5 (5.9%) | 0 (0.0%) |
| 90 or more Minutes | 5 (5.9%) | 0 (0.0%) |
Time of Departure to Work by Sex in Hamilton
The most frequent times of departure to work in Hamilton are 5:00 AM to 5:29 AM (44, 51.8%) for males and 8:00 AM to 8:29 AM (8, 22.2%) for females.
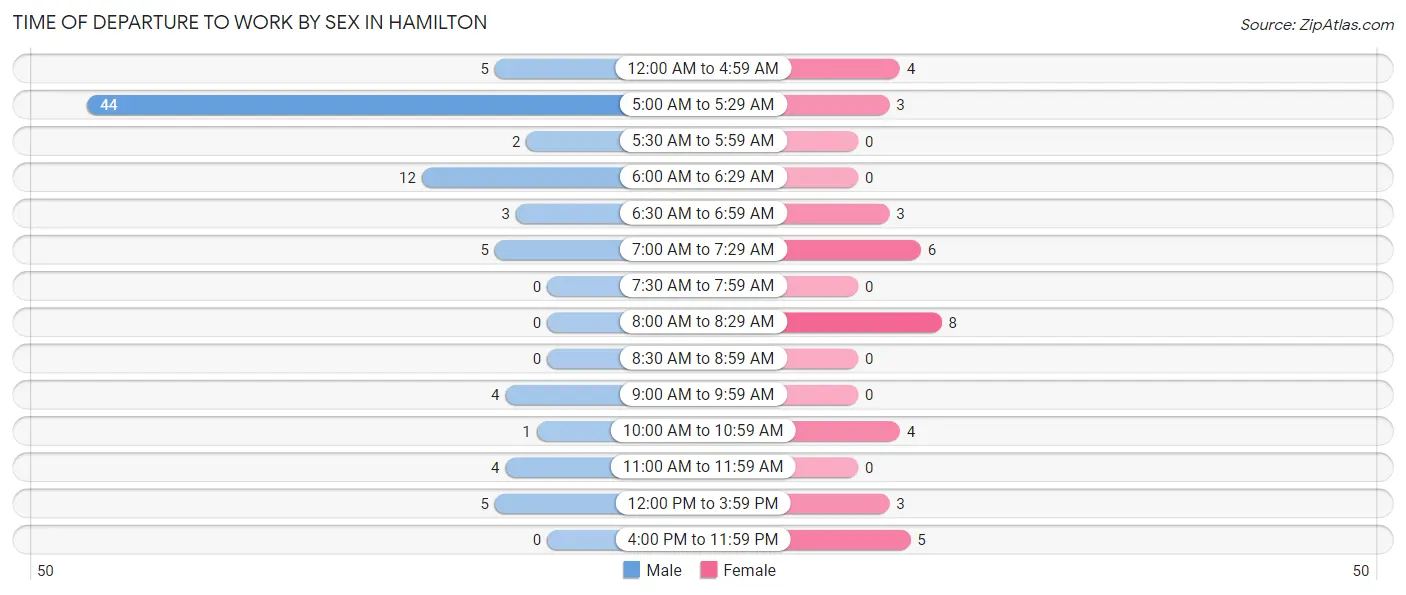
| Time of Departure | Male | Female |
| 12:00 AM to 4:59 AM | 5 (5.9%) | 4 (11.1%) |
| 5:00 AM to 5:29 AM | 44 (51.8%) | 3 (8.3%) |
| 5:30 AM to 5:59 AM | 2 (2.4%) | 0 (0.0%) |
| 6:00 AM to 6:29 AM | 12 (14.1%) | 0 (0.0%) |
| 6:30 AM to 6:59 AM | 3 (3.5%) | 3 (8.3%) |
| 7:00 AM to 7:29 AM | 5 (5.9%) | 6 (16.7%) |
| 7:30 AM to 7:59 AM | 0 (0.0%) | 0 (0.0%) |
| 8:00 AM to 8:29 AM | 0 (0.0%) | 8 (22.2%) |
| 8:30 AM to 8:59 AM | 0 (0.0%) | 0 (0.0%) |
| 9:00 AM to 9:59 AM | 4 (4.7%) | 0 (0.0%) |
| 10:00 AM to 10:59 AM | 1 (1.2%) | 4 (11.1%) |
| 11:00 AM to 11:59 AM | 4 (4.7%) | 0 (0.0%) |
| 12:00 PM to 3:59 PM | 5 (5.9%) | 3 (8.3%) |
| 4:00 PM to 11:59 PM | 0 (0.0%) | 5 (13.9%) |
| Total | 85 (100.0%) | 36 (100.0%) |
Housing Occupancy in Hamilton
Occupancy by Ownership in Hamilton
Of the total 179 dwellings in Hamilton, owner-occupied units account for 156 (87.2%), while renter-occupied units make up 23 (12.9%).
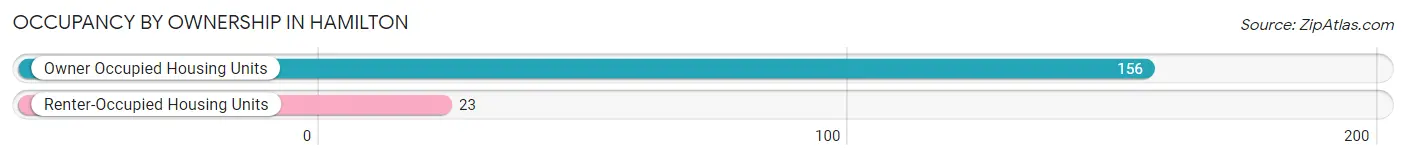
| Occupancy | # Housing Units | % Housing Units |
| Owner Occupied Housing Units | 156 | 87.2% |
| Renter-Occupied Housing Units | 23 | 12.9% |
| Total Occupied Housing Units | 179 | 100.0% |
Occupancy by Household Size in Hamilton
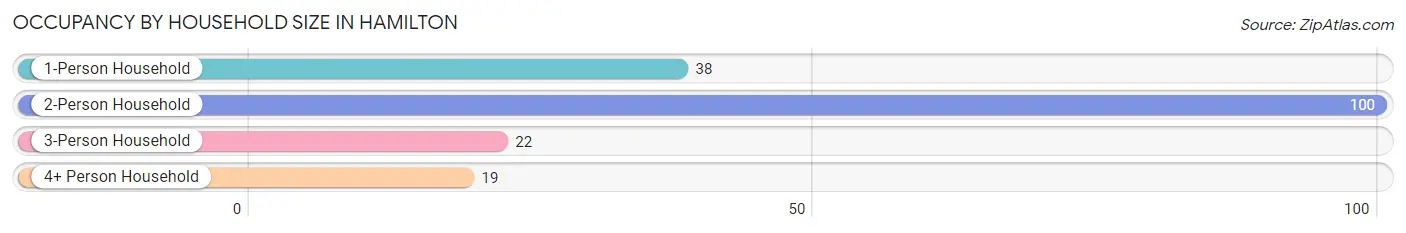
| Household Size | # Housing Units | % Housing Units |
| 1-Person Household | 38 | 21.2% |
| 2-Person Household | 100 | 55.9% |
| 3-Person Household | 22 | 12.3% |
| 4+ Person Household | 19 | 10.6% |
| Total Housing Units | 179 | 100.0% |
Occupancy by Ownership by Household Size in Hamilton
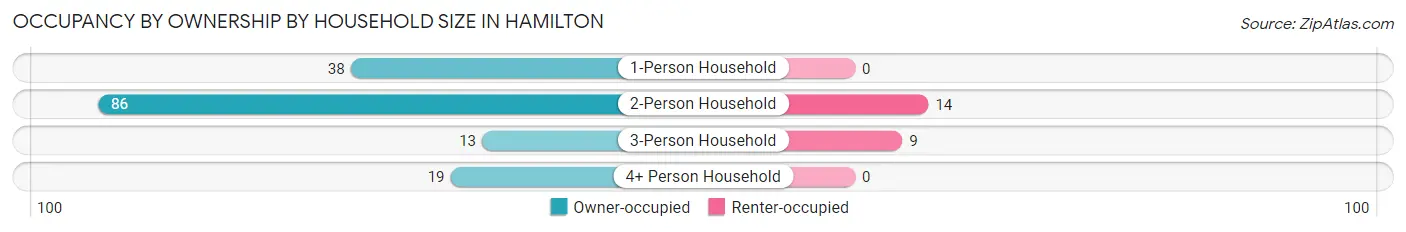
| Household Size | Owner-occupied | Renter-occupied |
| 1-Person Household | 38 (100.0%) | 0 (0.0%) |
| 2-Person Household | 86 (86.0%) | 14 (14.0%) |
| 3-Person Household | 13 (59.1%) | 9 (40.9%) |
| 4+ Person Household | 19 (100.0%) | 0 (0.0%) |
| Total Housing Units | 156 (87.2%) | 23 (12.9%) |
Occupancy by Educational Attainment in Hamilton
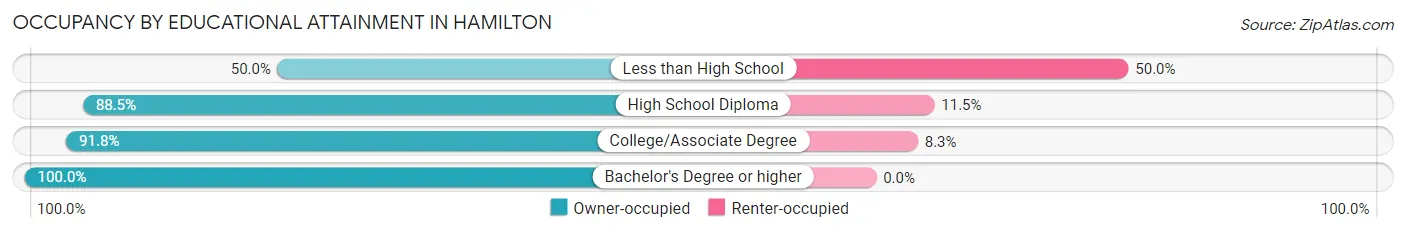
| Household Size | Owner-occupied | Renter-occupied |
| Less than High School | 9 (50.0%) | 9 (50.0%) |
| High School Diploma | 46 (88.5%) | 6 (11.5%) |
| College/Associate Degree | 89 (91.7%) | 8 (8.3%) |
| Bachelor's Degree or higher | 12 (100.0%) | 0 (0.0%) |
Occupancy by Age of Householder in Hamilton
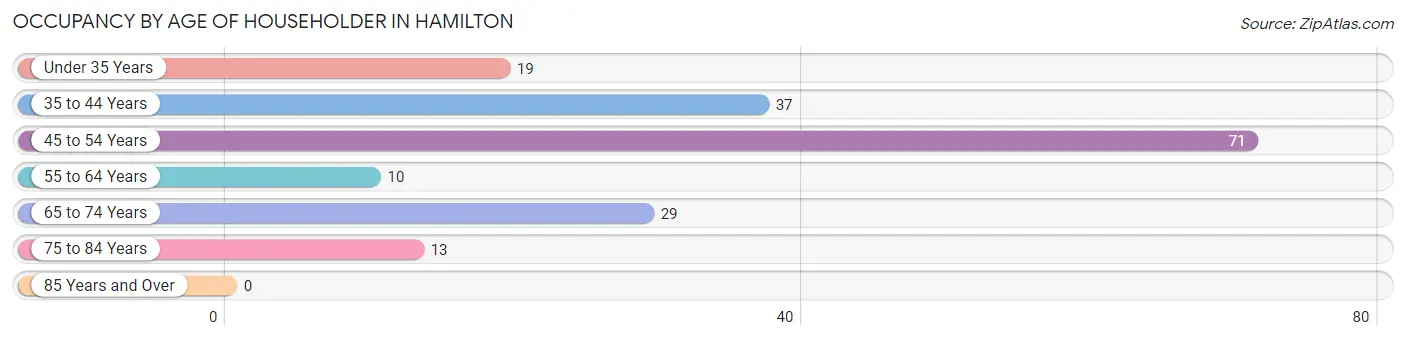
| Age Bracket | # Households | % Households |
| Under 35 Years | 19 | 10.6% |
| 35 to 44 Years | 37 | 20.7% |
| 45 to 54 Years | 71 | 39.7% |
| 55 to 64 Years | 10 | 5.6% |
| 65 to 74 Years | 29 | 16.2% |
| 75 to 84 Years | 13 | 7.3% |
| 85 Years and Over | 0 | 0.0% |
| Total | 179 | 100.0% |
Housing Finances in Hamilton
Median Income by Occupancy in Hamilton
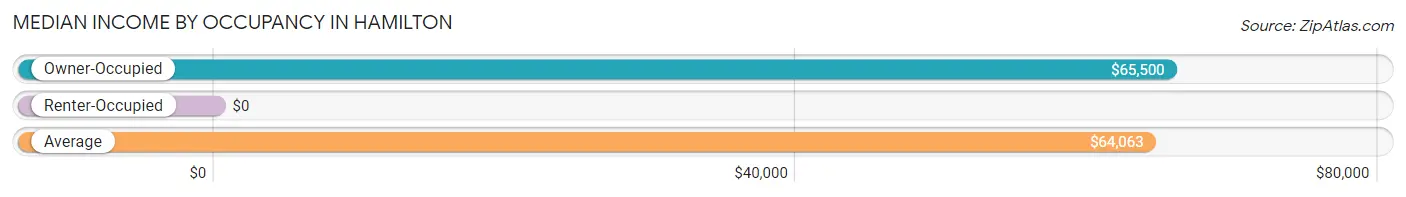
| Occupancy Type | # Households | Median Income |
| Owner-Occupied | 156 (87.2%) | $65,500 |
| Renter-Occupied | 23 (12.9%) | $0 |
| Average | 179 (100.0%) | $64,063 |
Occupancy by Householder Income Bracket in Hamilton
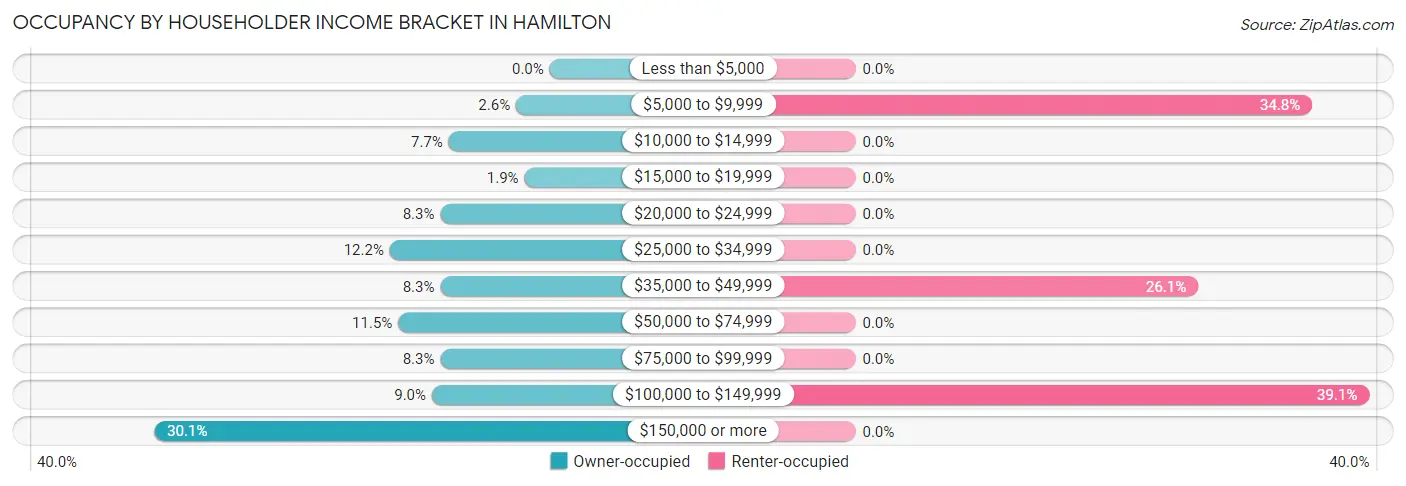
| Income Bracket | Owner-occupied | Renter-occupied |
| Less than $5,000 | 0 (0.0%) | 0 (0.0%) |
| $5,000 to $9,999 | 4 (2.6%) | 8 (34.8%) |
| $10,000 to $14,999 | 12 (7.7%) | 0 (0.0%) |
| $15,000 to $19,999 | 3 (1.9%) | 0 (0.0%) |
| $20,000 to $24,999 | 13 (8.3%) | 0 (0.0%) |
| $25,000 to $34,999 | 19 (12.2%) | 0 (0.0%) |
| $35,000 to $49,999 | 13 (8.3%) | 6 (26.1%) |
| $50,000 to $74,999 | 18 (11.5%) | 0 (0.0%) |
| $75,000 to $99,999 | 13 (8.3%) | 0 (0.0%) |
| $100,000 to $149,999 | 14 (9.0%) | 9 (39.1%) |
| $150,000 or more | 47 (30.1%) | 0 (0.0%) |
| Total | 156 (100.0%) | 23 (100.0%) |
Monthly Housing Cost Tiers in Hamilton
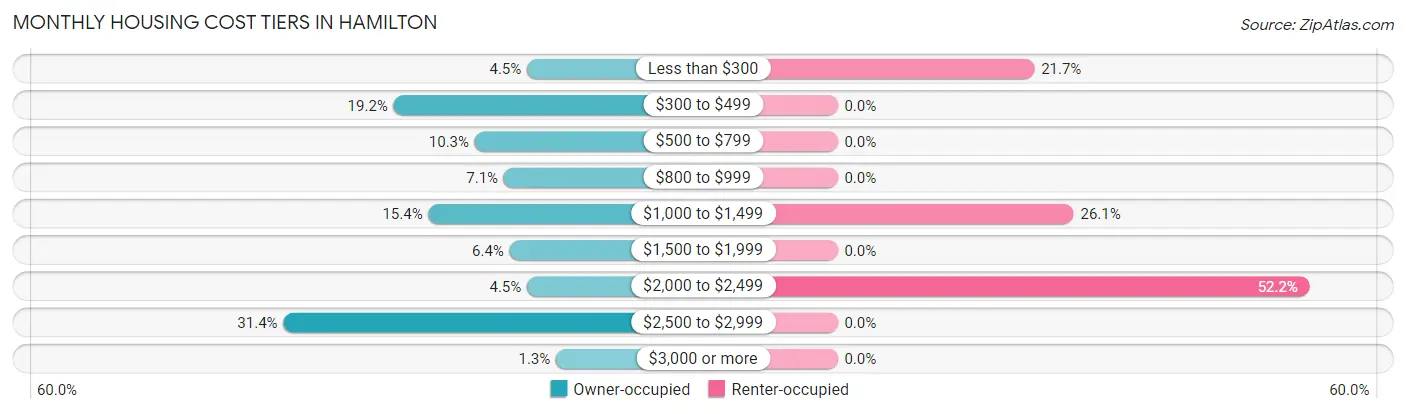
| Monthly Cost | Owner-occupied | Renter-occupied |
| Less than $300 | 7 (4.5%) | 5 (21.7%) |
| $300 to $499 | 30 (19.2%) | 0 (0.0%) |
| $500 to $799 | 16 (10.3%) | 0 (0.0%) |
| $800 to $999 | 11 (7.0%) | 0 (0.0%) |
| $1,000 to $1,499 | 24 (15.4%) | 6 (26.1%) |
| $1,500 to $1,999 | 10 (6.4%) | 0 (0.0%) |
| $2,000 to $2,499 | 7 (4.5%) | 12 (52.2%) |
| $2,500 to $2,999 | 49 (31.4%) | 0 (0.0%) |
| $3,000 or more | 2 (1.3%) | 0 (0.0%) |
| Total | 156 (100.0%) | 23 (100.0%) |
Physical Housing Characteristics in Hamilton
Housing Structures in Hamilton
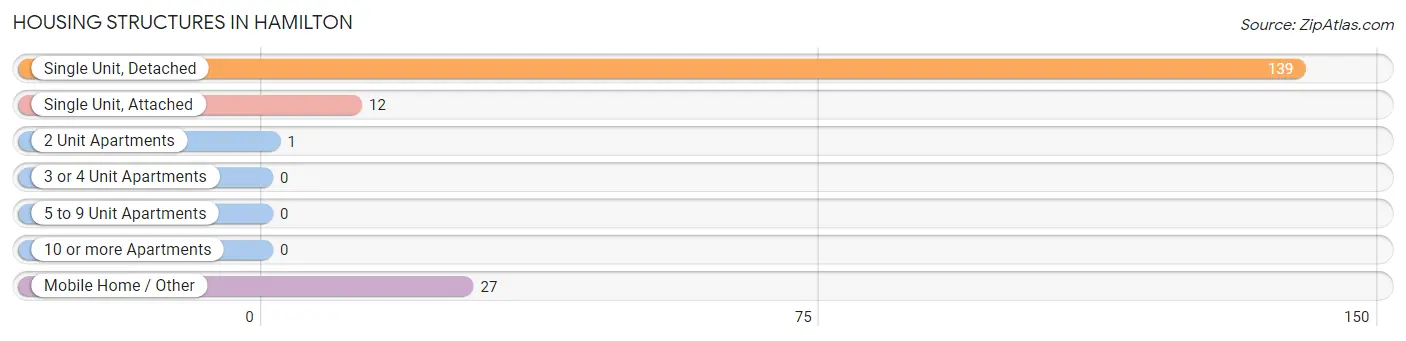
| Structure Type | # Housing Units | % Housing Units |
| Single Unit, Detached | 139 | 77.6% |
| Single Unit, Attached | 12 | 6.7% |
| 2 Unit Apartments | 1 | 0.6% |
| 3 or 4 Unit Apartments | 0 | 0.0% |
| 5 to 9 Unit Apartments | 0 | 0.0% |
| 10 or more Apartments | 0 | 0.0% |
| Mobile Home / Other | 27 | 15.1% |
| Total | 179 | 100.0% |
Housing Structures by Occupancy in Hamilton
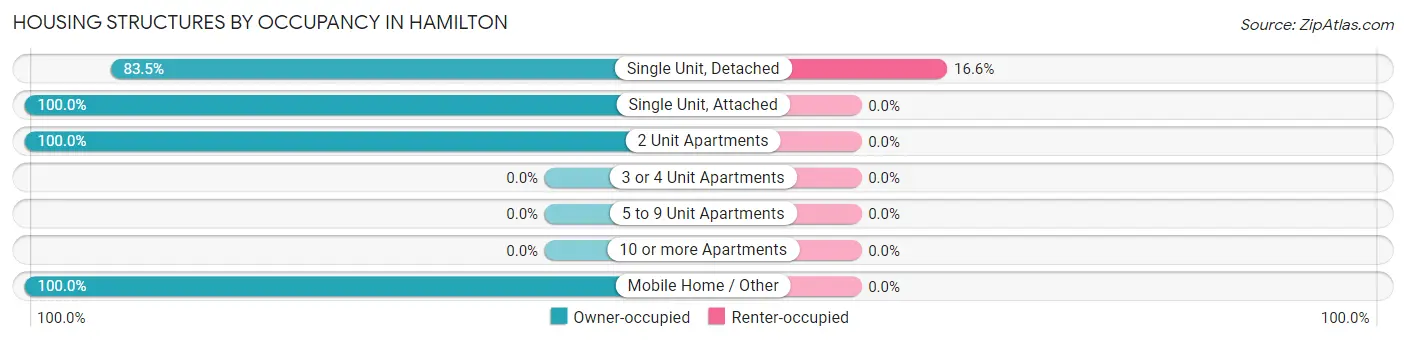
| Structure Type | Owner-occupied | Renter-occupied |
| Single Unit, Detached | 116 (83.5%) | 23 (16.6%) |
| Single Unit, Attached | 12 (100.0%) | 0 (0.0%) |
| 2 Unit Apartments | 1 (100.0%) | 0 (0.0%) |
| 3 or 4 Unit Apartments | 0 (0.0%) | 0 (0.0%) |
| 5 to 9 Unit Apartments | 0 (0.0%) | 0 (0.0%) |
| 10 or more Apartments | 0 (0.0%) | 0 (0.0%) |
| Mobile Home / Other | 27 (100.0%) | 0 (0.0%) |
| Total | 156 (87.2%) | 23 (12.9%) |
Housing Structures by Number of Rooms in Hamilton
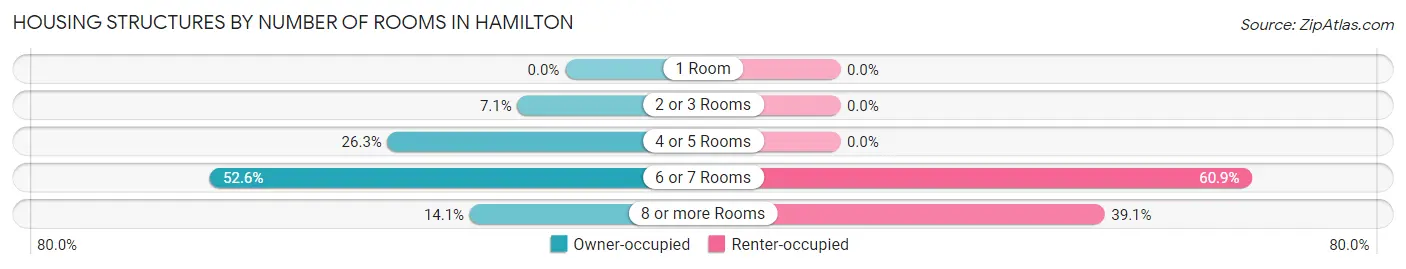
| Number of Rooms | Owner-occupied | Renter-occupied |
| 1 Room | 0 (0.0%) | 0 (0.0%) |
| 2 or 3 Rooms | 11 (7.0%) | 0 (0.0%) |
| 4 or 5 Rooms | 41 (26.3%) | 0 (0.0%) |
| 6 or 7 Rooms | 82 (52.6%) | 14 (60.9%) |
| 8 or more Rooms | 22 (14.1%) | 9 (39.1%) |
| Total | 156 (100.0%) | 23 (100.0%) |
Housing Structure by Heating Type in Hamilton
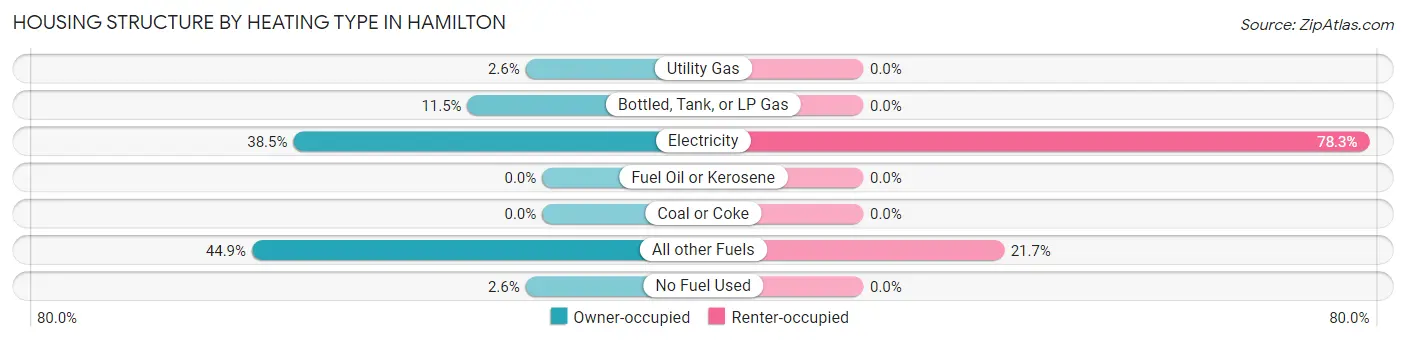
| Heating Type | Owner-occupied | Renter-occupied |
| Utility Gas | 4 (2.6%) | 0 (0.0%) |
| Bottled, Tank, or LP Gas | 18 (11.5%) | 0 (0.0%) |
| Electricity | 60 (38.5%) | 18 (78.3%) |
| Fuel Oil or Kerosene | 0 (0.0%) | 0 (0.0%) |
| Coal or Coke | 0 (0.0%) | 0 (0.0%) |
| All other Fuels | 70 (44.9%) | 5 (21.7%) |
| No Fuel Used | 4 (2.6%) | 0 (0.0%) |
| Total | 156 (100.0%) | 23 (100.0%) |
Household Vehicle Usage in Hamilton
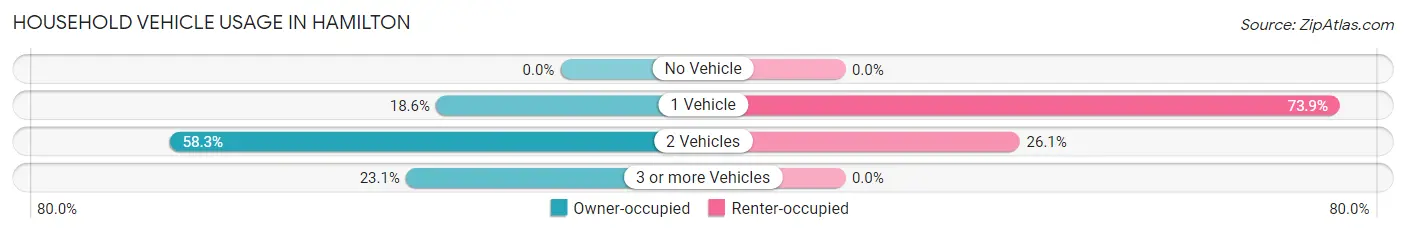
| Vehicles per Household | Owner-occupied | Renter-occupied |
| No Vehicle | 0 (0.0%) | 0 (0.0%) |
| 1 Vehicle | 29 (18.6%) | 17 (73.9%) |
| 2 Vehicles | 91 (58.3%) | 6 (26.1%) |
| 3 or more Vehicles | 36 (23.1%) | 0 (0.0%) |
| Total | 156 (100.0%) | 23 (100.0%) |
Real Estate & Mortgages in Hamilton
Real Estate and Mortgage Overview in Hamilton
| Characteristic | Without Mortgage | With Mortgage |
| Housing Units | 55 | 101 |
| Median Property Value | $194,600 | $390,600 |
| Median Household Income | $32,841 | $47 |
| Monthly Housing Costs | $455 | $2 |
| Real Estate Taxes | $1,758 | $0 |
Property Value by Mortgage Status in Hamilton
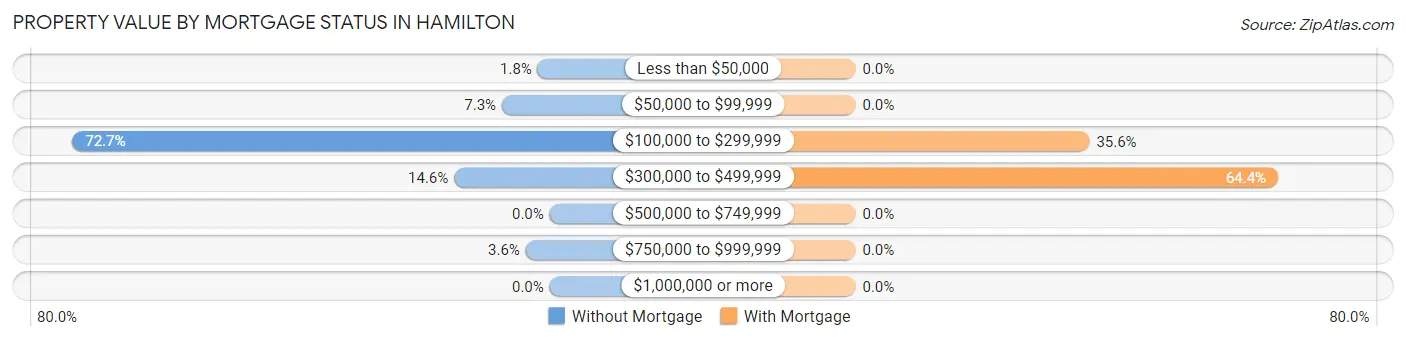
| Property Value | Without Mortgage | With Mortgage |
| Less than $50,000 | 1 (1.8%) | 0 (0.0%) |
| $50,000 to $99,999 | 4 (7.3%) | 0 (0.0%) |
| $100,000 to $299,999 | 40 (72.7%) | 36 (35.6%) |
| $300,000 to $499,999 | 8 (14.5%) | 65 (64.4%) |
| $500,000 to $749,999 | 0 (0.0%) | 0 (0.0%) |
| $750,000 to $999,999 | 2 (3.6%) | 0 (0.0%) |
| $1,000,000 or more | 0 (0.0%) | 0 (0.0%) |
| Total | 55 (100.0%) | 101 (100.0%) |
Household Income by Mortgage Status in Hamilton
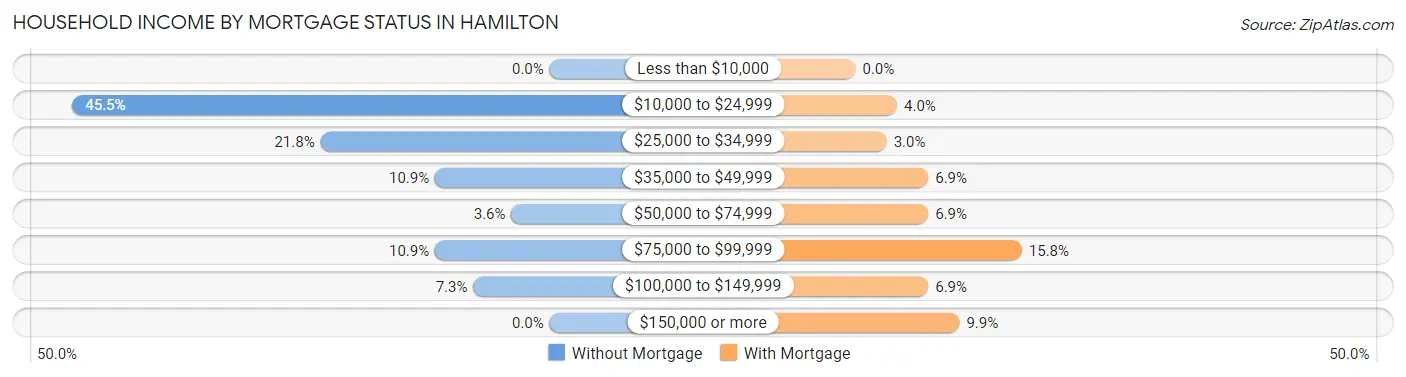
| Household Income | Without Mortgage | With Mortgage |
| Less than $10,000 | 0 (0.0%) | 0 (0.0%) |
| $10,000 to $24,999 | 25 (45.5%) | 4 (4.0%) |
| $25,000 to $34,999 | 12 (21.8%) | 3 (3.0%) |
| $35,000 to $49,999 | 6 (10.9%) | 7 (6.9%) |
| $50,000 to $74,999 | 2 (3.6%) | 7 (6.9%) |
| $75,000 to $99,999 | 6 (10.9%) | 16 (15.8%) |
| $100,000 to $149,999 | 4 (7.3%) | 7 (6.9%) |
| $150,000 or more | 0 (0.0%) | 10 (9.9%) |
| Total | 55 (100.0%) | 101 (100.0%) |
Property Value to Household Income Ratio in Hamilton
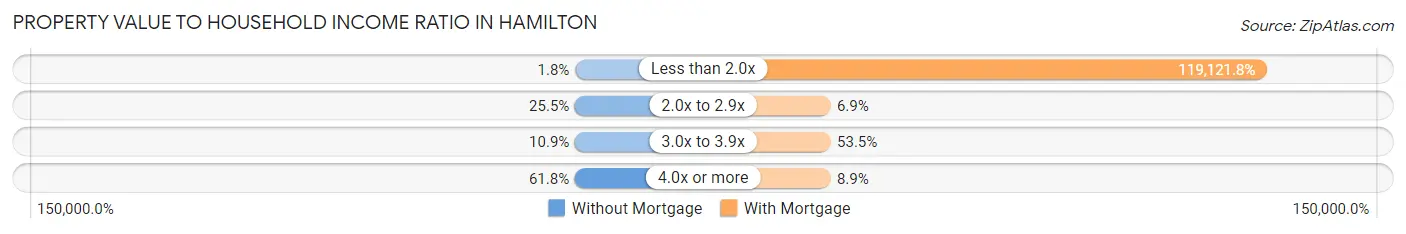
| Value-to-Income Ratio | Without Mortgage | With Mortgage |
| Less than 2.0x | 1 (1.8%) | 120,313 (119,121.8%) |
| 2.0x to 2.9x | 14 (25.5%) | 7 (6.9%) |
| 3.0x to 3.9x | 6 (10.9%) | 54 (53.5%) |
| 4.0x or more | 34 (61.8%) | 9 (8.9%) |
| Total | 55 (100.0%) | 101 (100.0%) |
Real Estate Taxes by Mortgage Status in Hamilton
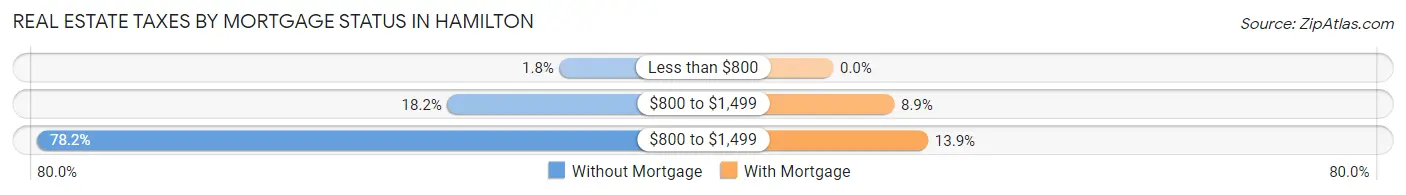
| Property Taxes | Without Mortgage | With Mortgage |
| Less than $800 | 1 (1.8%) | 0 (0.0%) |
| $800 to $1,499 | 10 (18.2%) | 9 (8.9%) |
| $800 to $1,499 | 43 (78.2%) | 14 (13.9%) |
| Total | 55 (100.0%) | 101 (100.0%) |
Health & Disability in Hamilton
Health Insurance Coverage by Age in Hamilton
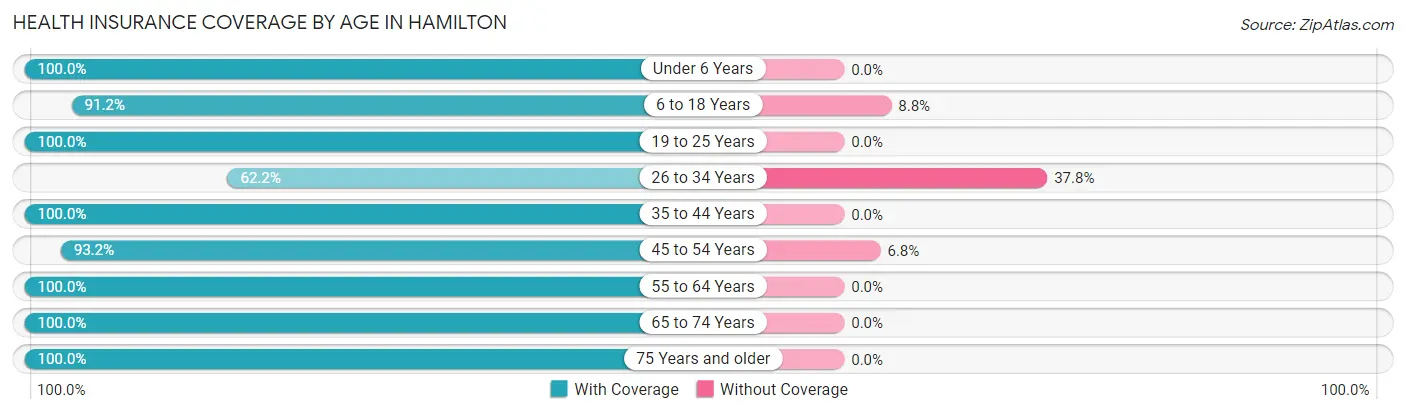
| Age Bracket | With Coverage | Without Coverage |
| Under 6 Years | 11 (100.0%) | 0 (0.0%) |
| 6 to 18 Years | 52 (91.2%) | 5 (8.8%) |
| 19 to 25 Years | 6 (100.0%) | 0 (0.0%) |
| 26 to 34 Years | 23 (62.2%) | 14 (37.8%) |
| 35 to 44 Years | 60 (100.0%) | 0 (0.0%) |
| 45 to 54 Years | 69 (93.2%) | 5 (6.8%) |
| 55 to 64 Years | 78 (100.0%) | 0 (0.0%) |
| 65 to 74 Years | 40 (100.0%) | 0 (0.0%) |
| 75 Years and older | 13 (100.0%) | 0 (0.0%) |
| Total | 352 (93.6%) | 24 (6.4%) |
Health Insurance Coverage by Citizenship Status in Hamilton
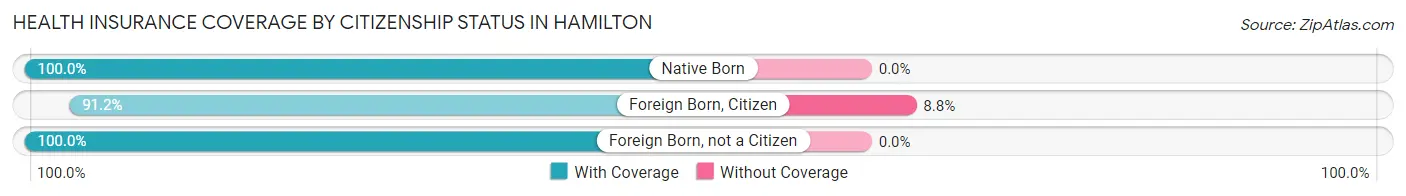
| Citizenship Status | With Coverage | Without Coverage |
| Native Born | 11 (100.0%) | 0 (0.0%) |
| Foreign Born, Citizen | 52 (91.2%) | 5 (8.8%) |
| Foreign Born, not a Citizen | 6 (100.0%) | 0 (0.0%) |
Health Insurance Coverage by Household Income in Hamilton
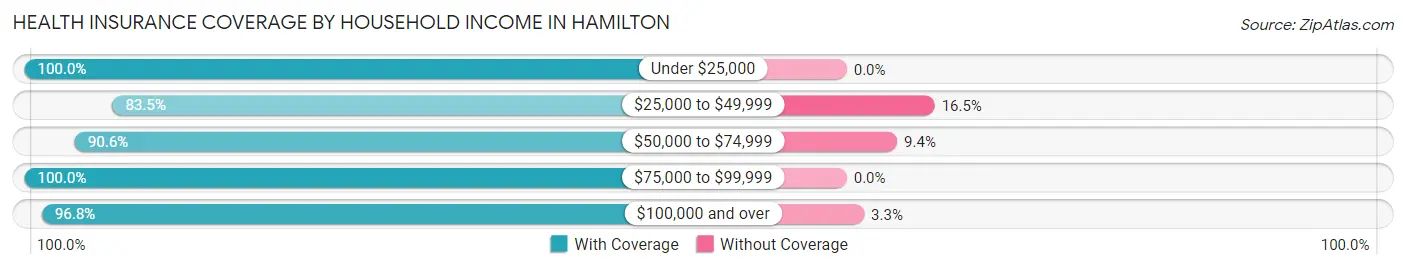
| Household Income | With Coverage | Without Coverage |
| Under $25,000 | 57 (100.0%) | 0 (0.0%) |
| $25,000 to $49,999 | 71 (83.5%) | 14 (16.5%) |
| $50,000 to $74,999 | 48 (90.6%) | 5 (9.4%) |
| $75,000 to $99,999 | 27 (100.0%) | 0 (0.0%) |
| $100,000 and over | 149 (96.8%) | 5 (3.3%) |
Public vs Private Health Insurance Coverage by Age in Hamilton
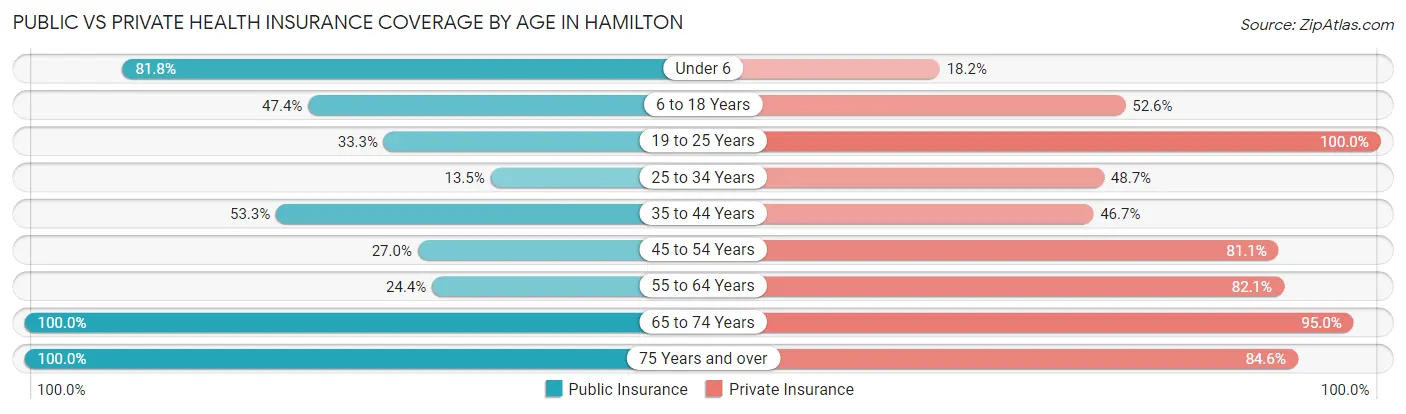
| Age Bracket | Public Insurance | Private Insurance |
| Under 6 | 9 (81.8%) | 2 (18.2%) |
| 6 to 18 Years | 27 (47.4%) | 30 (52.6%) |
| 19 to 25 Years | 2 (33.3%) | 6 (100.0%) |
| 25 to 34 Years | 5 (13.5%) | 18 (48.6%) |
| 35 to 44 Years | 32 (53.3%) | 28 (46.7%) |
| 45 to 54 Years | 20 (27.0%) | 60 (81.1%) |
| 55 to 64 Years | 19 (24.4%) | 64 (82.1%) |
| 65 to 74 Years | 40 (100.0%) | 38 (95.0%) |
| 75 Years and over | 13 (100.0%) | 11 (84.6%) |
| Total | 167 (44.4%) | 257 (68.3%) |
Disability Status by Sex by Age in Hamilton
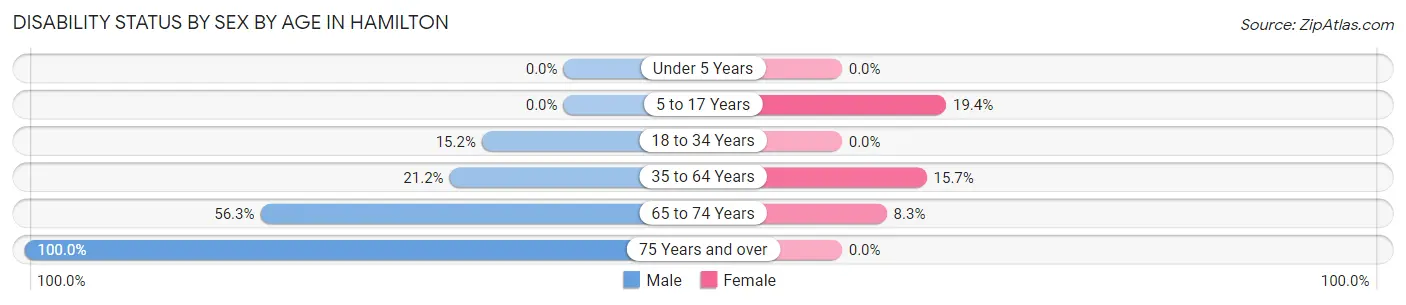
| Age Bracket | Male | Female |
| Under 5 Years | 0 (0.0%) | 0 (0.0%) |
| 5 to 17 Years | 0 (0.0%) | 6 (19.4%) |
| 18 to 34 Years | 5 (15.1%) | 0 (0.0%) |
| 35 to 64 Years | 22 (21.1%) | 17 (15.7%) |
| 65 to 74 Years | 9 (56.2%) | 2 (8.3%) |
| 75 Years and over | 4 (100.0%) | 0 (0.0%) |
Disability Class by Sex by Age in Hamilton
Disability Class: Hearing Difficulty
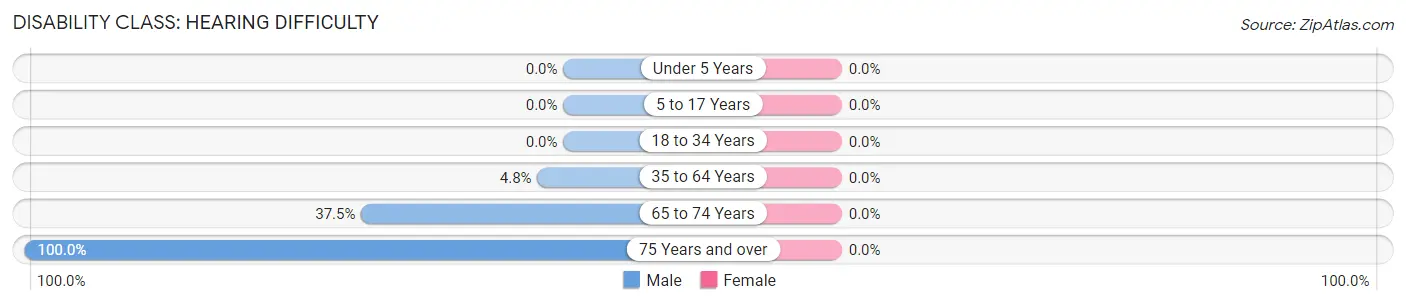
| Age Bracket | Male | Female |
| Under 5 Years | 0 (0.0%) | 0 (0.0%) |
| 5 to 17 Years | 0 (0.0%) | 0 (0.0%) |
| 18 to 34 Years | 0 (0.0%) | 0 (0.0%) |
| 35 to 64 Years | 5 (4.8%) | 0 (0.0%) |
| 65 to 74 Years | 6 (37.5%) | 0 (0.0%) |
| 75 Years and over | 4 (100.0%) | 0 (0.0%) |
Disability Class: Vision Difficulty
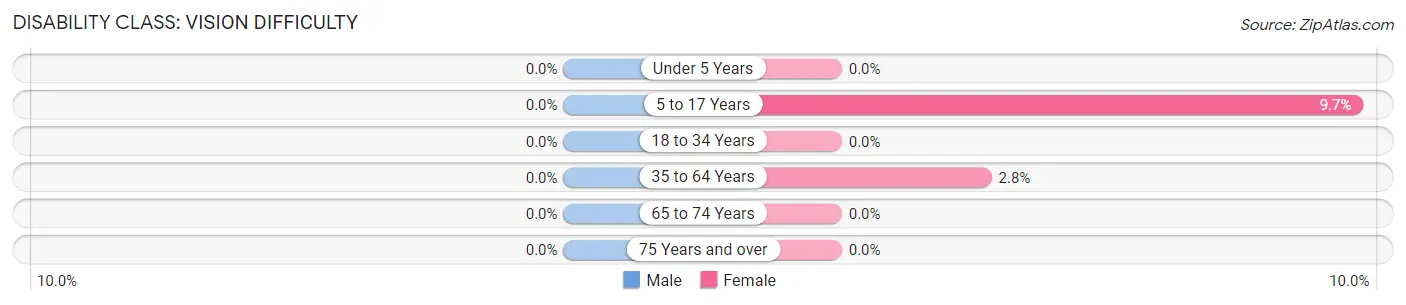
| Age Bracket | Male | Female |
| Under 5 Years | 0 (0.0%) | 0 (0.0%) |
| 5 to 17 Years | 0 (0.0%) | 3 (9.7%) |
| 18 to 34 Years | 0 (0.0%) | 0 (0.0%) |
| 35 to 64 Years | 0 (0.0%) | 3 (2.8%) |
| 65 to 74 Years | 0 (0.0%) | 0 (0.0%) |
| 75 Years and over | 0 (0.0%) | 0 (0.0%) |
Disability Class: Cognitive Difficulty
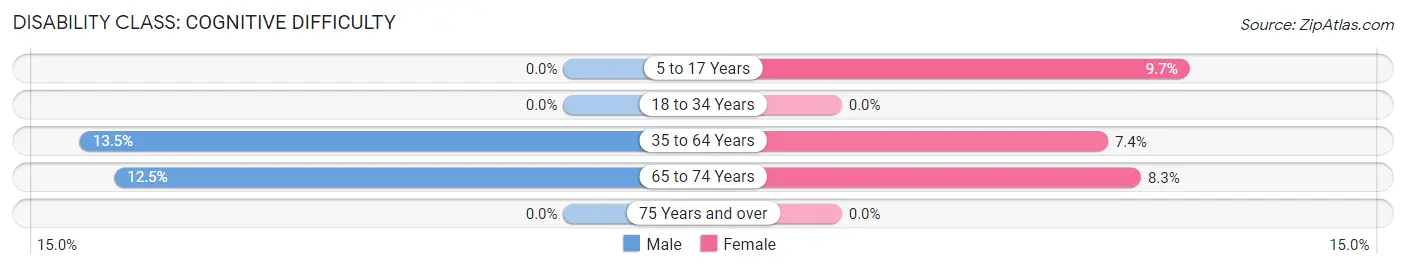
| Age Bracket | Male | Female |
| 5 to 17 Years | 0 (0.0%) | 3 (9.7%) |
| 18 to 34 Years | 0 (0.0%) | 0 (0.0%) |
| 35 to 64 Years | 14 (13.5%) | 8 (7.4%) |
| 65 to 74 Years | 2 (12.5%) | 2 (8.3%) |
| 75 Years and over | 0 (0.0%) | 0 (0.0%) |
Disability Class: Ambulatory Difficulty
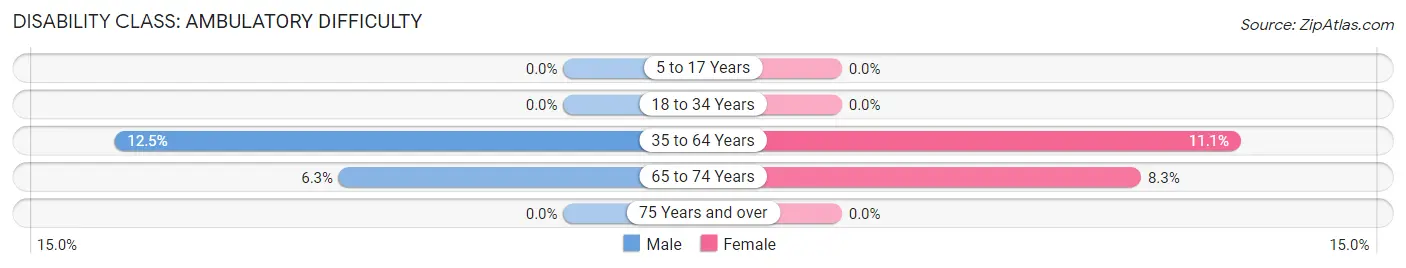
| Age Bracket | Male | Female |
| 5 to 17 Years | 0 (0.0%) | 0 (0.0%) |
| 18 to 34 Years | 0 (0.0%) | 0 (0.0%) |
| 35 to 64 Years | 13 (12.5%) | 12 (11.1%) |
| 65 to 74 Years | 1 (6.2%) | 2 (8.3%) |
| 75 Years and over | 0 (0.0%) | 0 (0.0%) |
Disability Class: Self-Care Difficulty
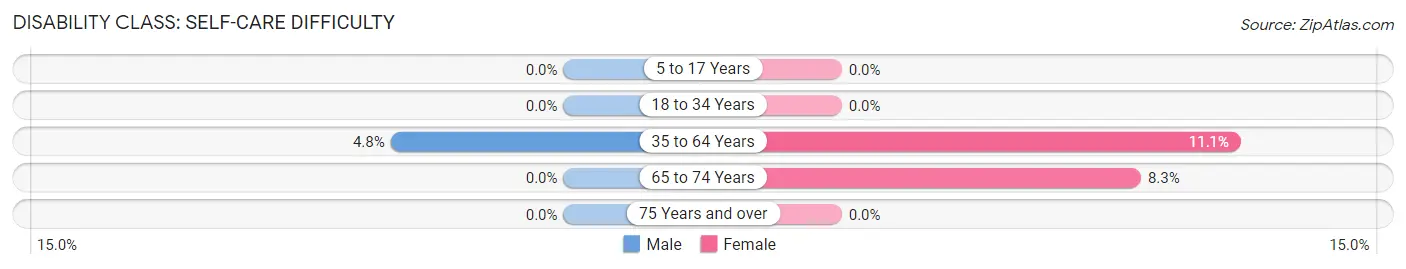
| Age Bracket | Male | Female |
| 5 to 17 Years | 0 (0.0%) | 0 (0.0%) |
| 18 to 34 Years | 0 (0.0%) | 0 (0.0%) |
| 35 to 64 Years | 5 (4.8%) | 12 (11.1%) |
| 65 to 74 Years | 0 (0.0%) | 2 (8.3%) |
| 75 Years and over | 0 (0.0%) | 0 (0.0%) |
Technology Access in Hamilton
Computing Device Access in Hamilton
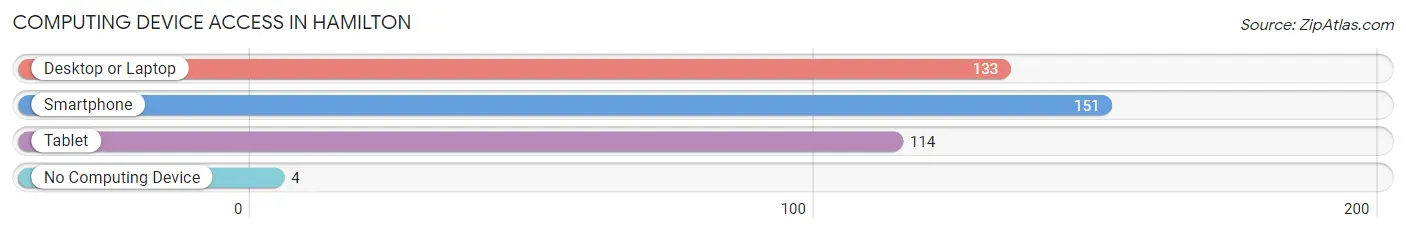
| Device Type | # Households | % Households |
| Desktop or Laptop | 133 | 74.3% |
| Smartphone | 151 | 84.4% |
| Tablet | 114 | 63.7% |
| No Computing Device | 4 | 2.2% |
| Total | 179 | 100.0% |
Internet Access in Hamilton
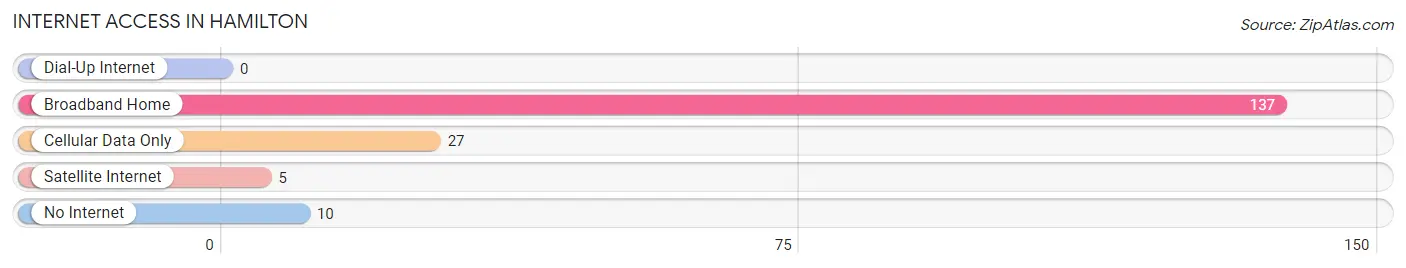
| Internet Type | # Households | % Households |
| Dial-Up Internet | 0 | 0.0% |
| Broadband Home | 137 | 76.5% |
| Cellular Data Only | 27 | 15.1% |
| Satellite Internet | 5 | 2.8% |
| No Internet | 10 | 5.6% |
| Total | 179 | 100.0% |
Hamilton Summary
Hamilton, Washington is a small town located in the Skagit Valley of Washington State. It is situated on the banks of the Skagit River, approximately 25 miles north of Seattle. The town was founded in 1875 by William Hamilton, a settler from Scotland. Hamilton is a rural community with a population of approximately 1,000 people.
History
The area around Hamilton was first inhabited by the Coast Salish people, who lived in the area for thousands of years before the arrival of European settlers. The first European settlers arrived in the area in the late 1800s, and the town of Hamilton was officially founded in 1875 by William Hamilton, a settler from Scotland. Hamilton was originally a logging and farming community, and the town grew steadily over the years. In the early 1900s, the town was home to a number of businesses, including a sawmill, a general store, a hotel, and a post office.
Geography
Hamilton is located in the Skagit Valley of Washington State, approximately 25 miles north of Seattle. The town is situated on the banks of the Skagit River, and is surrounded by rolling hills and farmland. The town is located in a temperate climate, with mild winters and warm summers.
Economy
The economy of Hamilton is largely based on agriculture and tourism. The town is home to a number of farms, which produce a variety of crops, including apples, cherries, and vegetables. The town is also home to a number of tourist attractions, including the Skagit Valley Museum, the Hamilton Historical Museum, and the Hamilton Farmers Market.
Demographics
As of the 2010 census, the population of Hamilton was 1,000 people. The racial makeup of the town was 94.2% White, 0.7% African American, 0.7% Native American, 0.7% Asian, 0.3% Pacific Islander, and 3.1% from other races. The median household income in Hamilton was $45,000, and the median age was 44.
Conclusion
Hamilton, Washington is a small rural town located in the Skagit Valley of Washington State. The town was founded in 1875 by William Hamilton, a settler from Scotland. The economy of Hamilton is largely based on agriculture and tourism, and the town is home to a number of farms and tourist attractions. The population of Hamilton is approximately 1,000 people, and the median household income is $45,000.
Common Questions
What is Per Capita Income in Hamilton?
Per Capita income in Hamilton is $38,535.
What is the Median Family Income in Hamilton?
Median Family Income in Hamilton is $100,625.
What is the Median Household income in Hamilton?
Median Household Income in Hamilton is $64,063.
What is Inequality or Gini Index in Hamilton?
Inequality or Gini Index in Hamilton is 0.40.
What is the Total Population of Hamilton?
Total Population of Hamilton is 376.
What is the Total Male Population of Hamilton?
Total Male Population of Hamilton is 187.
What is the Total Female Population of Hamilton?
Total Female Population of Hamilton is 189.
What is the Ratio of Males per 100 Females in Hamilton?
There are 98.94 Males per 100 Females in Hamilton.
What is the Ratio of Females per 100 Males in Hamilton?
There are 101.07 Females per 100 Males in Hamilton.
What is the Median Population Age in Hamilton?
Median Population Age in Hamilton is 52.9 Years.
What is the Average Family Size in Hamilton
Average Family Size in Hamilton is 2.3 People.
What is the Average Household Size in Hamilton
Average Household Size in Hamilton is 2.1 People.
How Large is the Labor Force in Hamilton?
There are 155 People in the Labor Forcein in Hamilton.
What is the Percentage of People in the Labor Force in Hamilton?
46.1% of People are in the Labor Force in Hamilton.
What is the Unemployment Rate in Hamilton?
Unemployment Rate in Hamilton is 8.4%.