South Prairie, WA Map & Demographics
South Prairie Map
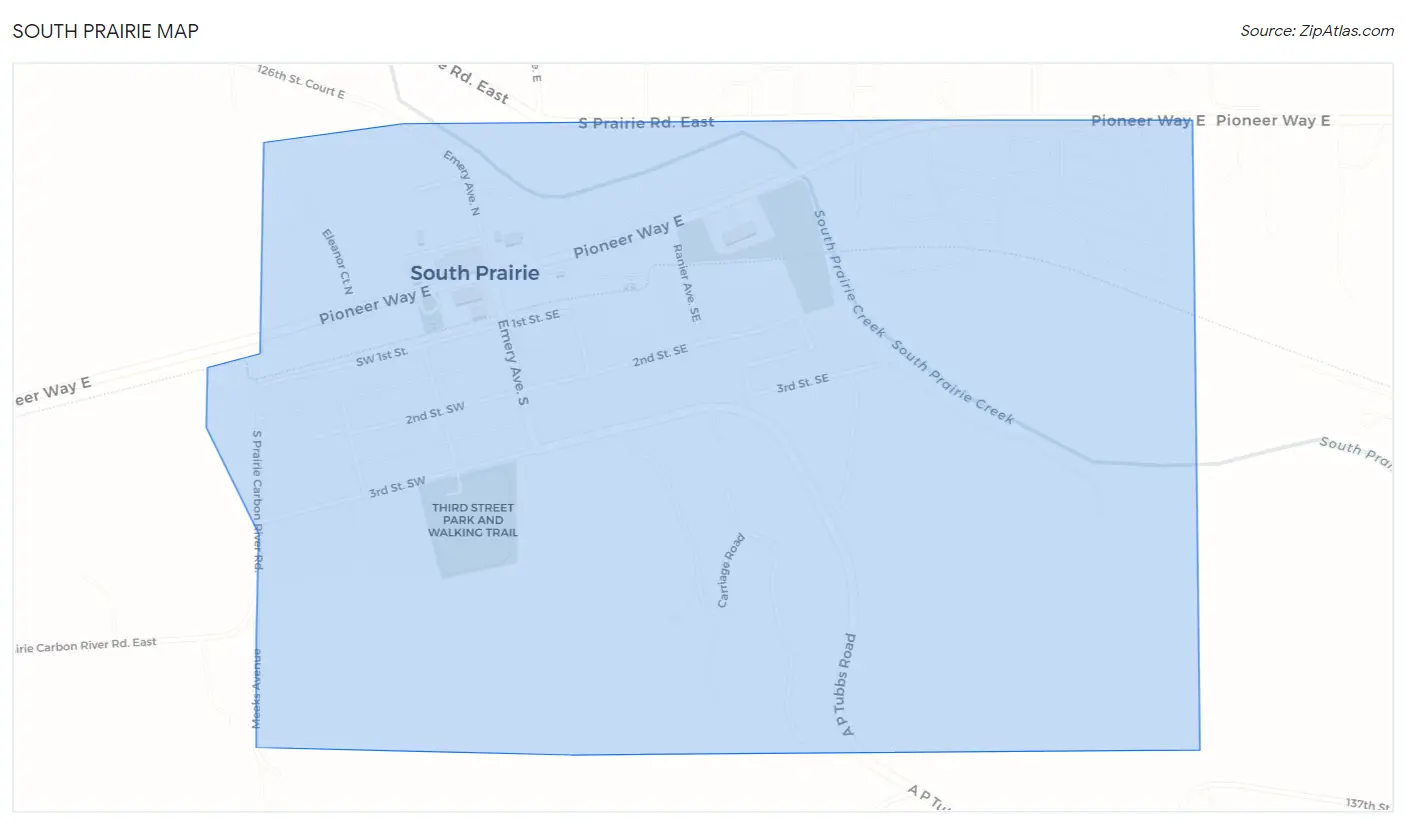
South Prairie Overview
$42,016
PER CAPITA INCOME
$101,563
AVG FAMILY INCOME
$94,167
AVG HOUSEHOLD INCOME
47.8%
WAGE / INCOME GAP [ % ]
52.2¢/ $1
WAGE / INCOME GAP [ $ ]
0.34
INEQUALITY / GINI INDEX
353
TOTAL POPULATION
203
MALE POPULATION
150
FEMALE POPULATION
135.33
MALES / 100 FEMALES
73.89
FEMALES / 100 MALES
50.1
MEDIAN AGE
2.9
AVG FAMILY SIZE
2.6
AVG HOUSEHOLD SIZE
181
LABOR FORCE [ PEOPLE ]
63.5%
PERCENT IN LABOR FORCE
4.4%
UNEMPLOYMENT RATE
South Prairie Zip Codes
Income in South Prairie
Income Overview in South Prairie
Per Capita Income in South Prairie is $42,016, while median incomes of families and households are $101,563 and $94,167 respectively.
| Characteristic | Number | Measure |
| Per Capita Income | 353 | $42,016 |
| Median Family Income | 105 | $101,563 |
| Mean Family Income | 105 | $100,596 |
| Median Household Income | 138 | $94,167 |
| Mean Household Income | 138 | $107,542 |
| Income Deficit | 105 | $0 |
| Wage / Income Gap (%) | 353 | 47.83% |
| Wage / Income Gap ($) | 353 | 52.17¢ per $1 |
| Gini / Inequality Index | 353 | 0.34 |
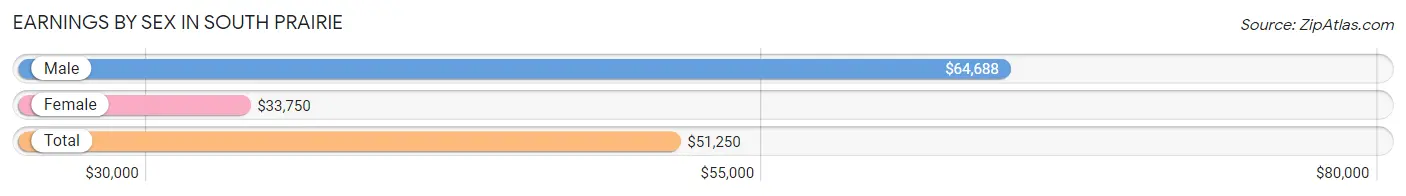
Earnings by Sex in South Prairie
Average Earnings in South Prairie are $51,250, $64,688 for men and $33,750 for women, a difference of 47.8%.
| Sex | Number | Average Earnings |
| Male | 101 (56.4%) | $64,688 |
| Female | 78 (43.6%) | $33,750 |
| Total | 179 (100.0%) | $51,250 |
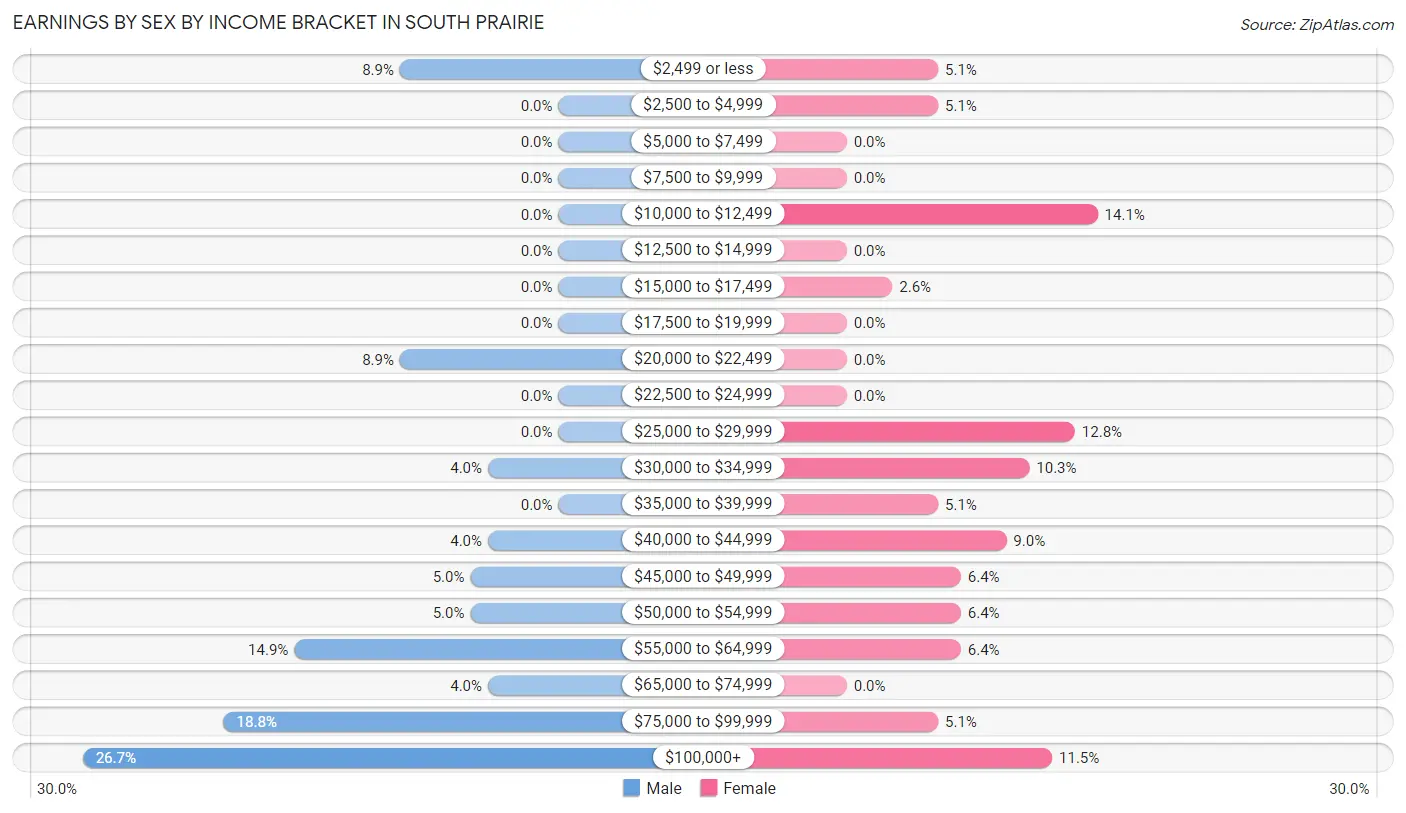
Earnings by Sex by Income Bracket in South Prairie
The most common earnings brackets in South Prairie are $100,000+ for men (27 | 26.7%) and $10,000 to $12,499 for women (11 | 14.1%).
| Income | Male | Female |
| $2,499 or less | 9 (8.9%) | 4 (5.1%) |
| $2,500 to $4,999 | 0 (0.0%) | 4 (5.1%) |
| $5,000 to $7,499 | 0 (0.0%) | 0 (0.0%) |
| $7,500 to $9,999 | 0 (0.0%) | 0 (0.0%) |
| $10,000 to $12,499 | 0 (0.0%) | 11 (14.1%) |
| $12,500 to $14,999 | 0 (0.0%) | 0 (0.0%) |
| $15,000 to $17,499 | 0 (0.0%) | 2 (2.6%) |
| $17,500 to $19,999 | 0 (0.0%) | 0 (0.0%) |
| $20,000 to $22,499 | 9 (8.9%) | 0 (0.0%) |
| $22,500 to $24,999 | 0 (0.0%) | 0 (0.0%) |
| $25,000 to $29,999 | 0 (0.0%) | 10 (12.8%) |
| $30,000 to $34,999 | 4 (4.0%) | 8 (10.3%) |
| $35,000 to $39,999 | 0 (0.0%) | 4 (5.1%) |
| $40,000 to $44,999 | 4 (4.0%) | 7 (9.0%) |
| $45,000 to $49,999 | 5 (5.0%) | 5 (6.4%) |
| $50,000 to $54,999 | 5 (5.0%) | 5 (6.4%) |
| $55,000 to $64,999 | 15 (14.8%) | 5 (6.4%) |
| $65,000 to $74,999 | 4 (4.0%) | 0 (0.0%) |
| $75,000 to $99,999 | 19 (18.8%) | 4 (5.1%) |
| $100,000+ | 27 (26.7%) | 9 (11.5%) |
| Total | 101 (100.0%) | 78 (100.0%) |
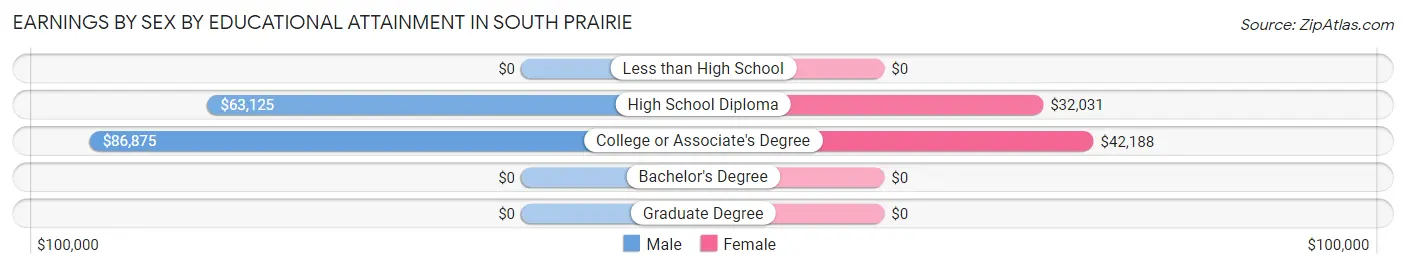
Earnings by Sex by Educational Attainment in South Prairie
Average earnings in South Prairie are $73,750 for men and $42,188 for women, a difference of 42.8%. Men with an educational attainment of college or associate's degree enjoy the highest average annual earnings of $86,875, while those with high school diploma education earn the least with $63,125. Women with an educational attainment of college or associate's degree earn the most with the average annual earnings of $42,188, while those with high school diploma education have the smallest earnings of $32,031.
| Educational Attainment | Male Income | Female Income |
| Less than High School | - | - |
| High School Diploma | $63,125 | $32,031 |
| College or Associate's Degree | $86,875 | $42,188 |
| Bachelor's Degree | - | - |
| Graduate Degree | - | - |
| Total | $73,750 | $42,188 |
Family Income in South Prairie
Family Income Brackets in South Prairie
According to the South Prairie family income data, there are 36 families falling into the $100,000 to $149,999 income range, which is the most common income bracket and makes up 34.3% of all families.
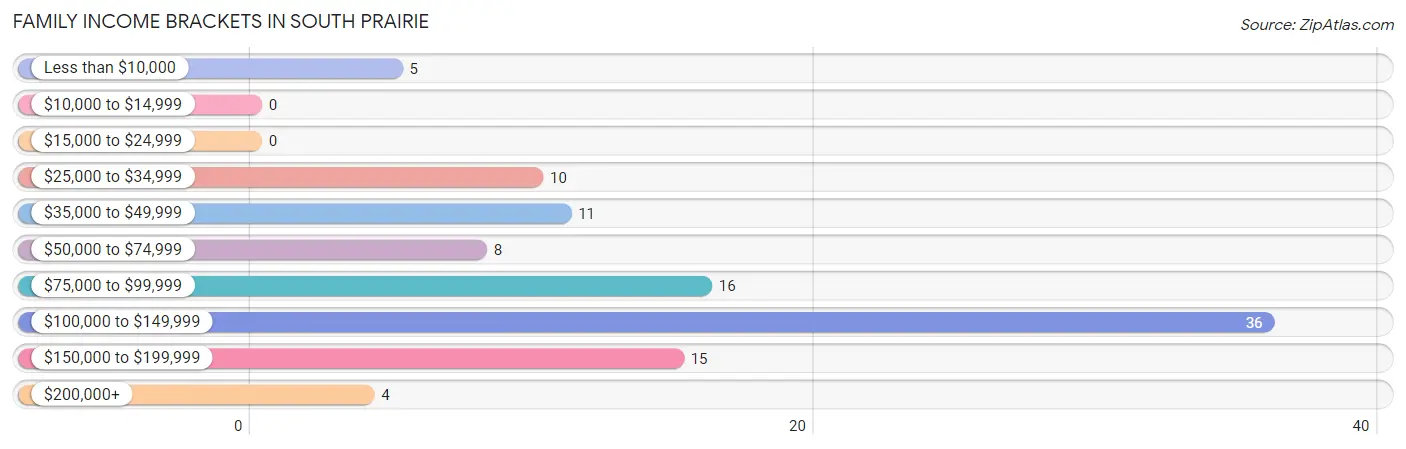
| Income Bracket | # Families | % Families |
| Less than $10,000 | 5 | 4.8% |
| $10,000 to $14,999 | 0 | 0.0% |
| $15,000 to $24,999 | 0 | 0.0% |
| $25,000 to $34,999 | 10 | 9.5% |
| $35,000 to $49,999 | 11 | 10.5% |
| $50,000 to $74,999 | 8 | 7.6% |
| $75,000 to $99,999 | 16 | 15.2% |
| $100,000 to $149,999 | 36 | 34.3% |
| $150,000 to $199,999 | 15 | 14.3% |
| $200,000+ | 4 | 3.8% |
Family Income by Famaliy Size in South Prairie
5-person families (17 | 16.2%) account for the highest median family income in South Prairie with $126,406 per family, while 2-person families (68 | 64.8%) have the highest median income of $46,666 per family member.
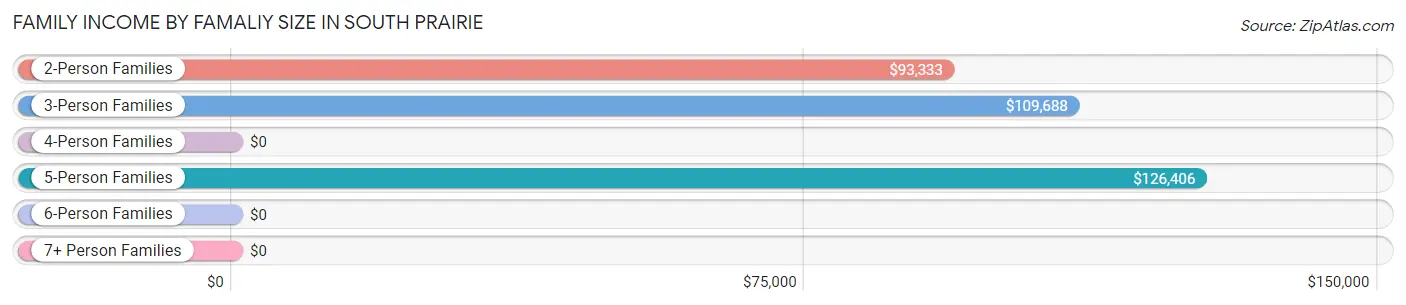
| Income Bracket | # Families | Median Income |
| 2-Person Families | 68 (64.8%) | $93,333 |
| 3-Person Families | 9 (8.6%) | $109,688 |
| 4-Person Families | 11 (10.5%) | $0 |
| 5-Person Families | 17 (16.2%) | $126,406 |
| 6-Person Families | 0 (0.0%) | $0 |
| 7+ Person Families | 0 (0.0%) | $0 |
| Total | 105 (100.0%) | $101,563 |
Family Income by Number of Earners in South Prairie
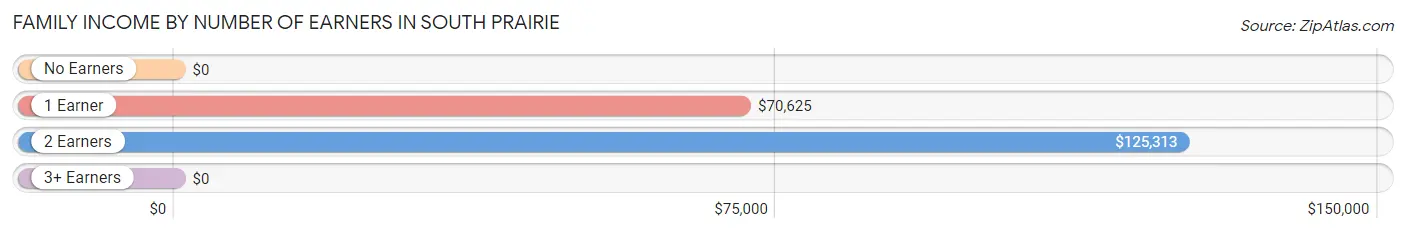
| Number of Earners | # Families | Median Income |
| No Earners | 19 (18.1%) | $0 |
| 1 Earner | 34 (32.4%) | $70,625 |
| 2 Earners | 46 (43.8%) | $125,313 |
| 3+ Earners | 6 (5.7%) | $0 |
| Total | 105 (100.0%) | $101,563 |
Household Income in South Prairie
Household Income Brackets in South Prairie
With 36 households falling in the category, the $100,000 to $149,999 income range is the most frequent in South Prairie, accounting for 26.1% of all households.
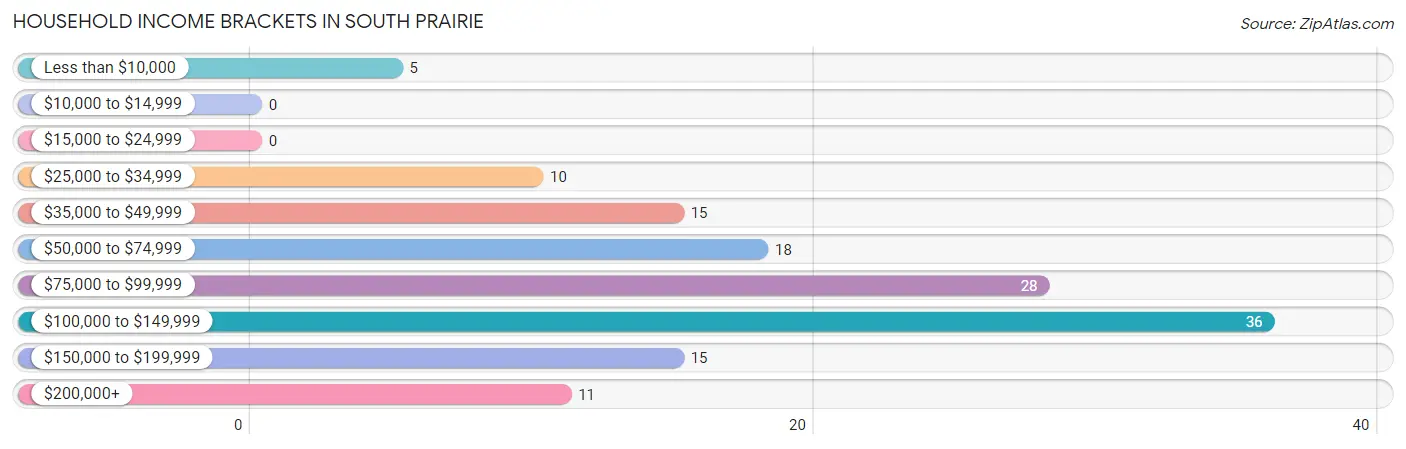
| Income Bracket | # Households | % Households |
| Less than $10,000 | 5 | 3.6% |
| $10,000 to $14,999 | 0 | 0.0% |
| $15,000 to $24,999 | 0 | 0.0% |
| $25,000 to $34,999 | 10 | 7.2% |
| $35,000 to $49,999 | 15 | 10.9% |
| $50,000 to $74,999 | 18 | 13.0% |
| $75,000 to $99,999 | 28 | 20.3% |
| $100,000 to $149,999 | 36 | 26.1% |
| $150,000 to $199,999 | 15 | 10.9% |
| $200,000+ | 11 | 8.0% |
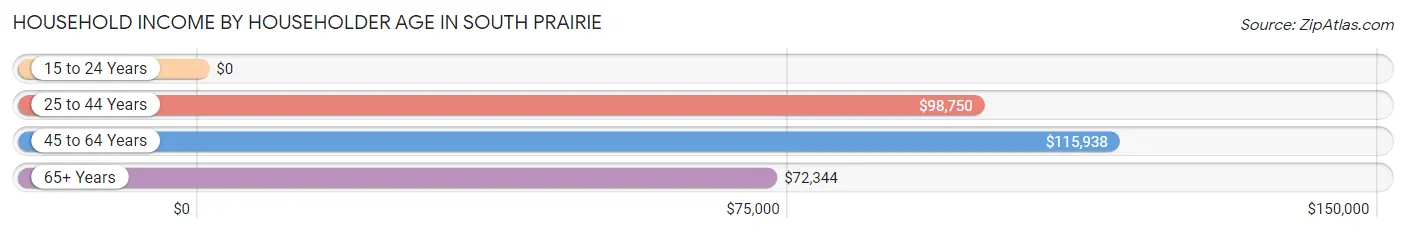
Household Income by Householder Age in South Prairie
The median household income in South Prairie is $94,167, with the highest median household income of $115,938 found in the 45 to 64 years age bracket for the primary householder. A total of 71 households (51.4%) fall into this category.
| Income Bracket | # Households | Median Income |
| 15 to 24 Years | 0 (0.0%) | $0 |
| 25 to 44 Years | 34 (24.6%) | $98,750 |
| 45 to 64 Years | 71 (51.4%) | $115,938 |
| 65+ Years | 33 (23.9%) | $72,344 |
| Total | 138 (100.0%) | $94,167 |
Poverty in South Prairie
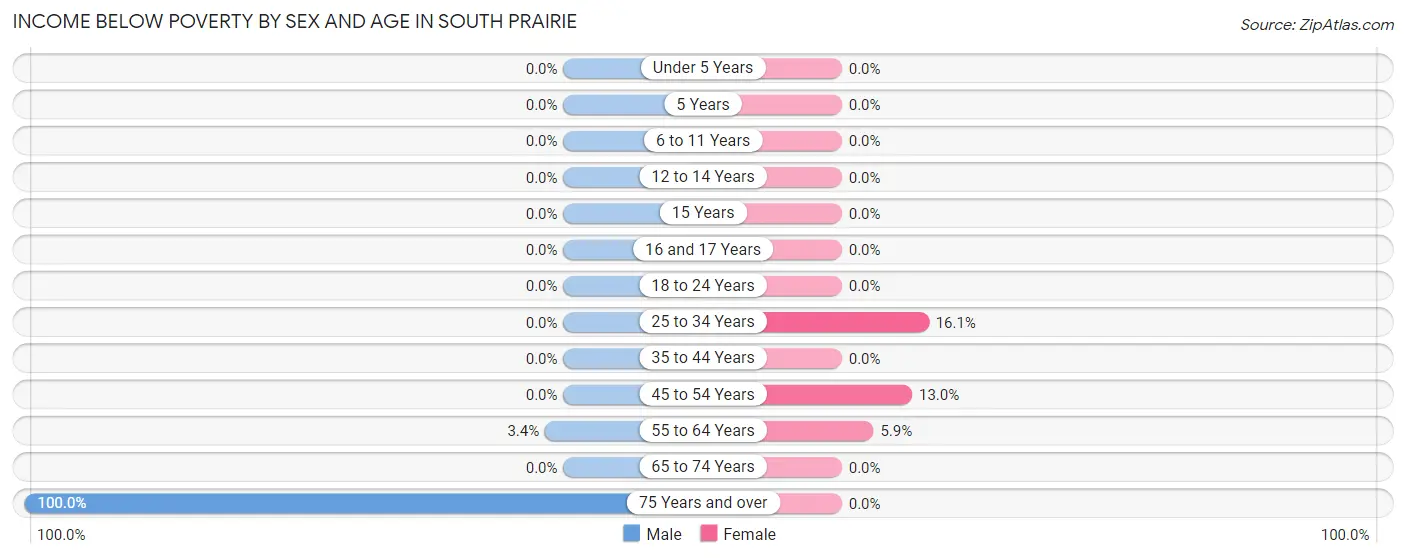
Income Below Poverty by Sex and Age in South Prairie
With 2.0% poverty level for males and 6.7% for females among the residents of South Prairie, 75 year old and over males and 25 to 34 year old females are the most vulnerable to poverty, with 2 males (100.0%) and 5 females (16.1%) in their respective age groups living below the poverty level.
| Age Bracket | Male | Female |
| Under 5 Years | 0 (0.0%) | 0 (0.0%) |
| 5 Years | 0 (0.0%) | 0 (0.0%) |
| 6 to 11 Years | 0 (0.0%) | 0 (0.0%) |
| 12 to 14 Years | 0 (0.0%) | 0 (0.0%) |
| 15 Years | 0 (0.0%) | 0 (0.0%) |
| 16 and 17 Years | 0 (0.0%) | 0 (0.0%) |
| 18 to 24 Years | 0 (0.0%) | 0 (0.0%) |
| 25 to 34 Years | 0 (0.0%) | 5 (16.1%) |
| 35 to 44 Years | 0 (0.0%) | 0 (0.0%) |
| 45 to 54 Years | 0 (0.0%) | 3 (13.0%) |
| 55 to 64 Years | 2 (3.4%) | 2 (5.9%) |
| 65 to 74 Years | 0 (0.0%) | 0 (0.0%) |
| 75 Years and over | 2 (100.0%) | 0 (0.0%) |
| Total | 4 (2.0%) | 10 (6.7%) |
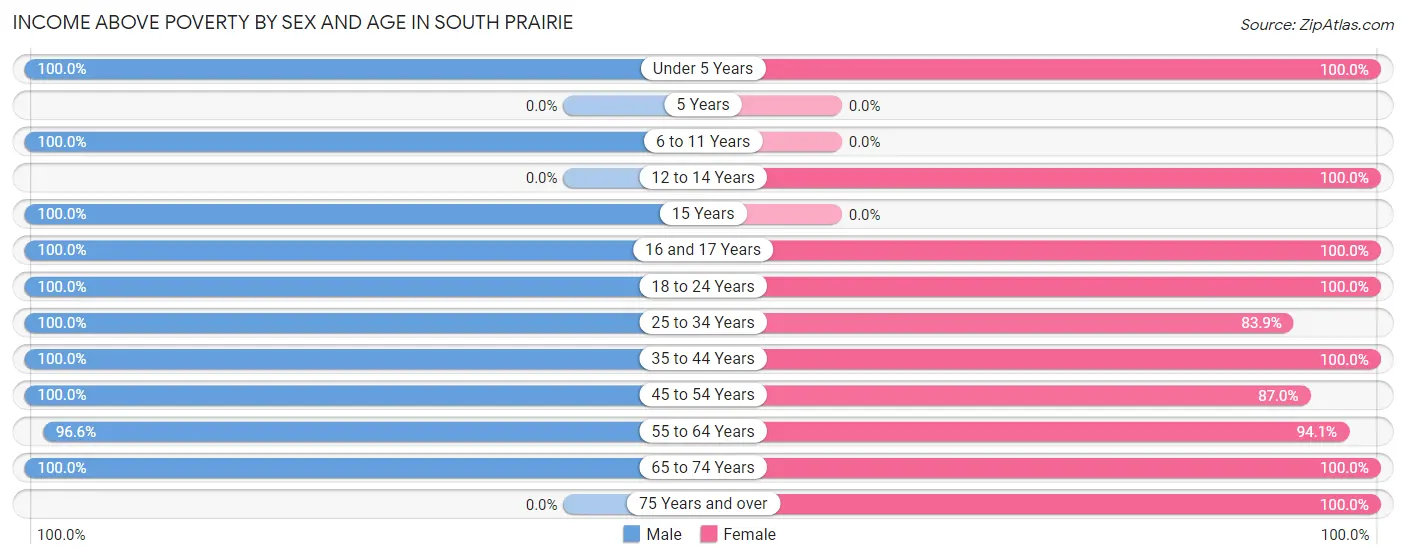
Income Above Poverty by Sex and Age in South Prairie
According to the poverty statistics in South Prairie, males aged under 5 years and females aged under 5 years are the age groups that are most secure financially, with 100.0% of males and 100.0% of females in these age groups living above the poverty line.
| Age Bracket | Male | Female |
| Under 5 Years | 21 (100.0%) | 4 (100.0%) |
| 5 Years | 0 (0.0%) | 0 (0.0%) |
| 6 to 11 Years | 29 (100.0%) | 0 (0.0%) |
| 12 to 14 Years | 0 (0.0%) | 5 (100.0%) |
| 15 Years | 9 (100.0%) | 0 (0.0%) |
| 16 and 17 Years | 3 (100.0%) | 6 (100.0%) |
| 18 to 24 Years | 14 (100.0%) | 11 (100.0%) |
| 25 to 34 Years | 15 (100.0%) | 26 (83.9%) |
| 35 to 44 Years | 10 (100.0%) | 11 (100.0%) |
| 45 to 54 Years | 14 (100.0%) | 20 (87.0%) |
| 55 to 64 Years | 57 (96.6%) | 32 (94.1%) |
| 65 to 74 Years | 27 (100.0%) | 10 (100.0%) |
| 75 Years and over | 0 (0.0%) | 15 (100.0%) |
| Total | 199 (98.0%) | 140 (93.3%) |
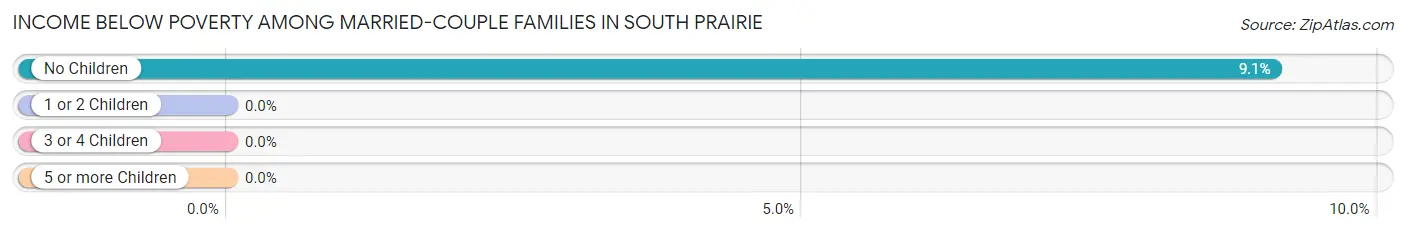
Income Below Poverty Among Married-Couple Families in South Prairie
The poverty statistics for married-couple families in South Prairie show that 6.6% or 5 of the total 76 families live below the poverty line. Families with no children have the highest poverty rate of 9.1%, comprising of 5 families. On the other hand, families with 1 or 2 children have the lowest poverty rate of 0.0%, which includes 0 families.
| Children | Above Poverty | Below Poverty |
| No Children | 50 (90.9%) | 5 (9.1%) |
| 1 or 2 Children | 13 (100.0%) | 0 (0.0%) |
| 3 or 4 Children | 8 (100.0%) | 0 (0.0%) |
| 5 or more Children | 0 (0.0%) | 0 (0.0%) |
| Total | 71 (93.4%) | 5 (6.6%) |
Income Below Poverty Among Single-Parent Households in South Prairie
| Children | Single Father | Single Mother |
| No Children | 0 (0.0%) | 0 (0.0%) |
| 1 or 2 Children | 0 (0.0%) | 0 (0.0%) |
| 3 or 4 Children | 0 (0.0%) | 0 (0.0%) |
| 5 or more Children | 0 (0.0%) | 0 (0.0%) |
| Total | 0 (0.0%) | 0 (0.0%) |
Income Below Poverty Among Married-Couple vs Single-Parent Households in South Prairie
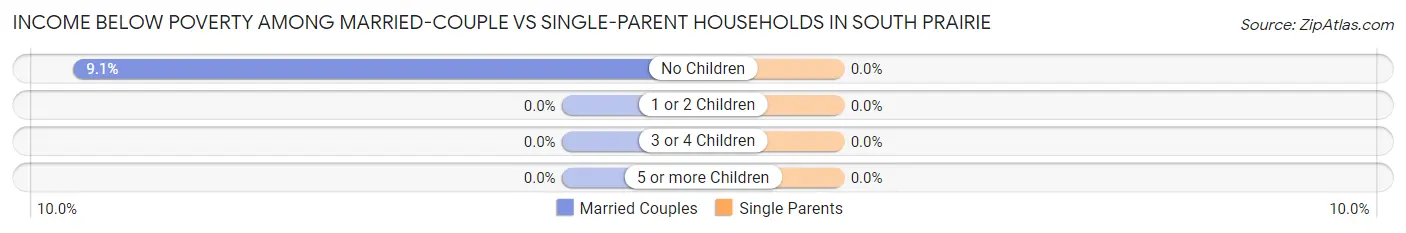
| Children | Married-Couple Families | Single-Parent Households |
| No Children | 5 (9.1%) | 0 (0.0%) |
| 1 or 2 Children | 0 (0.0%) | 0 (0.0%) |
| 3 or 4 Children | 0 (0.0%) | 0 (0.0%) |
| 5 or more Children | 0 (0.0%) | 0 (0.0%) |
| Total | 5 (6.6%) | 0 (0.0%) |
Race in South Prairie
The most populous races in South Prairie are White / Caucasian (326 | 92.3%), Hispanic or Latino (62 | 17.6%), and Two or more Races (17 | 4.8%).
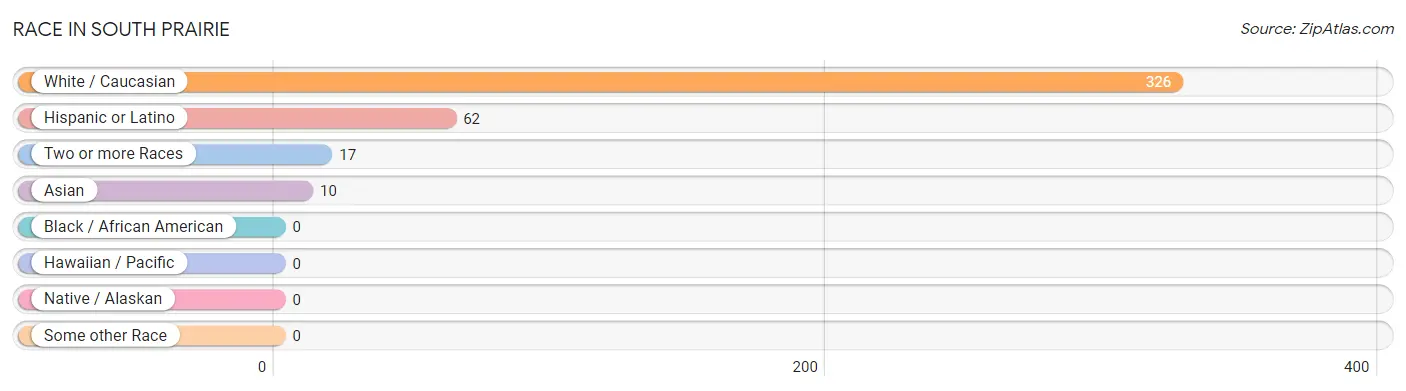
| Race | # Population | % Population |
| Asian | 10 | 2.8% |
| Black / African American | 0 | 0.0% |
| Hawaiian / Pacific | 0 | 0.0% |
| Hispanic or Latino | 62 | 17.6% |
| Native / Alaskan | 0 | 0.0% |
| White / Caucasian | 326 | 92.3% |
| Two or more Races | 17 | 4.8% |
| Some other Race | 0 | 0.0% |
| Total | 353 | 100.0% |
Ancestry in South Prairie
The most populous ancestries reported in South Prairie are German (92 | 26.1%), Irish (75 | 21.2%), English (30 | 8.5%), Norwegian (30 | 8.5%), and Central American (27 | 7.6%), together accounting for 72.0% of all South Prairie residents.
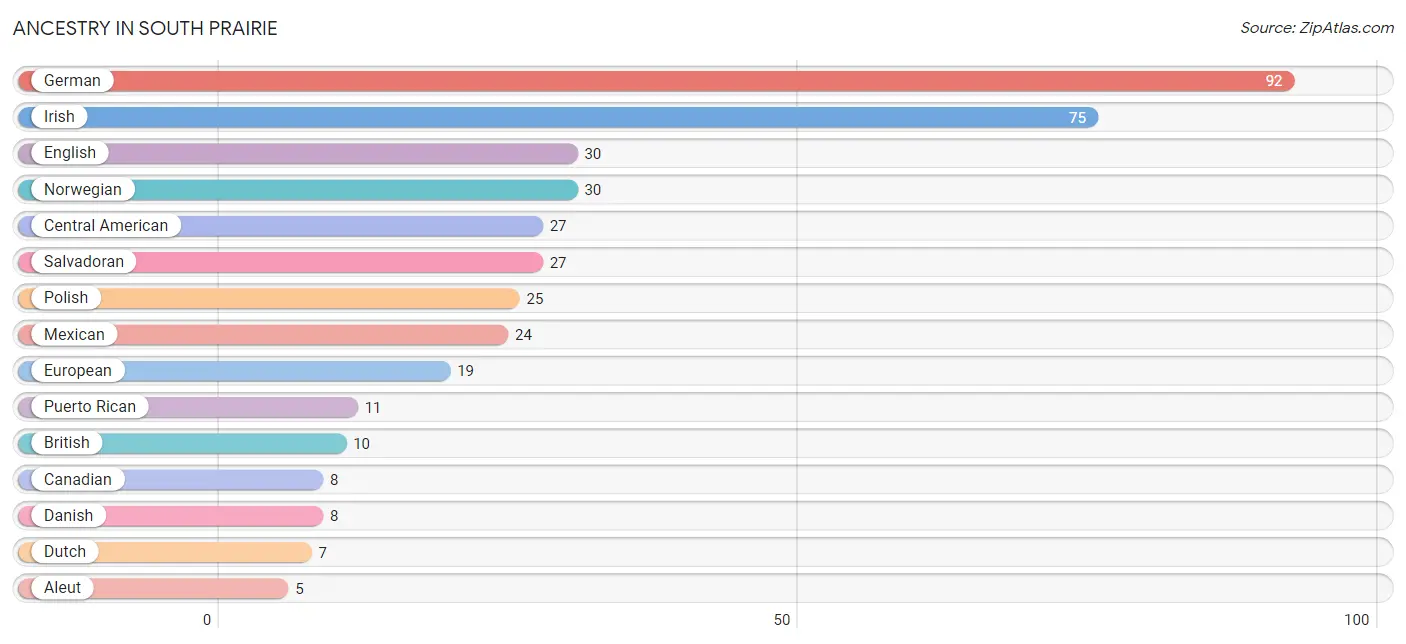
| Ancestry | # Population | % Population |
| Aleut | 5 | 1.4% |
| Austrian | 4 | 1.1% |
| British | 10 | 2.8% |
| Burmese | 4 | 1.1% |
| Canadian | 8 | 2.3% |
| Central American | 27 | 7.6% |
| Danish | 8 | 2.3% |
| Dutch | 7 | 2.0% |
| English | 30 | 8.5% |
| European | 19 | 5.4% |
| French Canadian | 4 | 1.1% |
| German | 92 | 26.1% |
| Hungarian | 3 | 0.9% |
| Irish | 75 | 21.2% |
| Italian | 4 | 1.1% |
| Korean | 4 | 1.1% |
| Mexican | 24 | 6.8% |
| Northern European | 4 | 1.1% |
| Norwegian | 30 | 8.5% |
| Polish | 25 | 7.1% |
| Puerto Rican | 11 | 3.1% |
| Salvadoran | 27 | 7.6% |
| Scandinavian | 4 | 1.1% |
| Scottish | 4 | 1.1% |
| Slovene | 4 | 1.1% |
| Sri Lankan | 2 | 0.6% |
| Swedish | 4 | 1.1% |
| Welsh | 4 | 1.1% | View All 28 Rows |
Immigrants in South Prairie
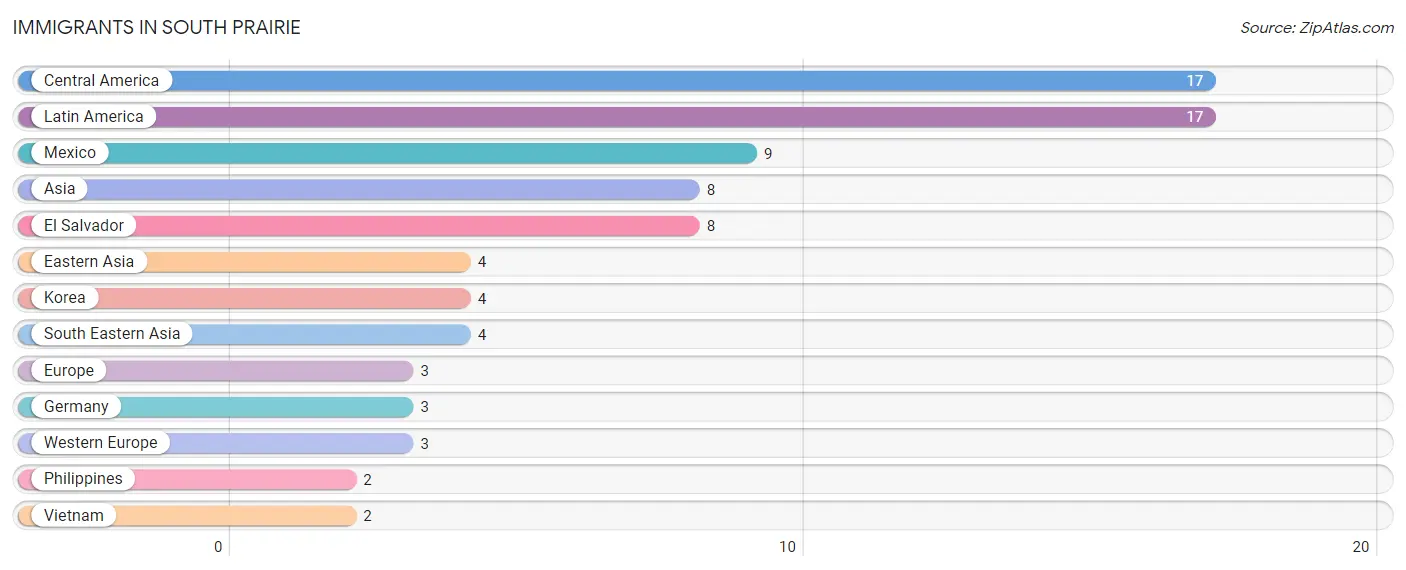
The most numerous immigrant groups reported in South Prairie came from Central America (17 | 4.8%), Latin America (17 | 4.8%), Mexico (9 | 2.5%), Asia (8 | 2.3%), and El Salvador (8 | 2.3%), together accounting for 16.7% of all South Prairie residents.
| Immigration Origin | # Population | % Population |
| Asia | 8 | 2.3% |
| Central America | 17 | 4.8% |
| Eastern Asia | 4 | 1.1% |
| El Salvador | 8 | 2.3% |
| Europe | 3 | 0.9% |
| Germany | 3 | 0.9% |
| Korea | 4 | 1.1% |
| Latin America | 17 | 4.8% |
| Mexico | 9 | 2.5% |
| Philippines | 2 | 0.6% |
| South Eastern Asia | 4 | 1.1% |
| Vietnam | 2 | 0.6% |
| Western Europe | 3 | 0.9% | View All 13 Rows |
Sex and Age in South Prairie
Sex and Age in South Prairie
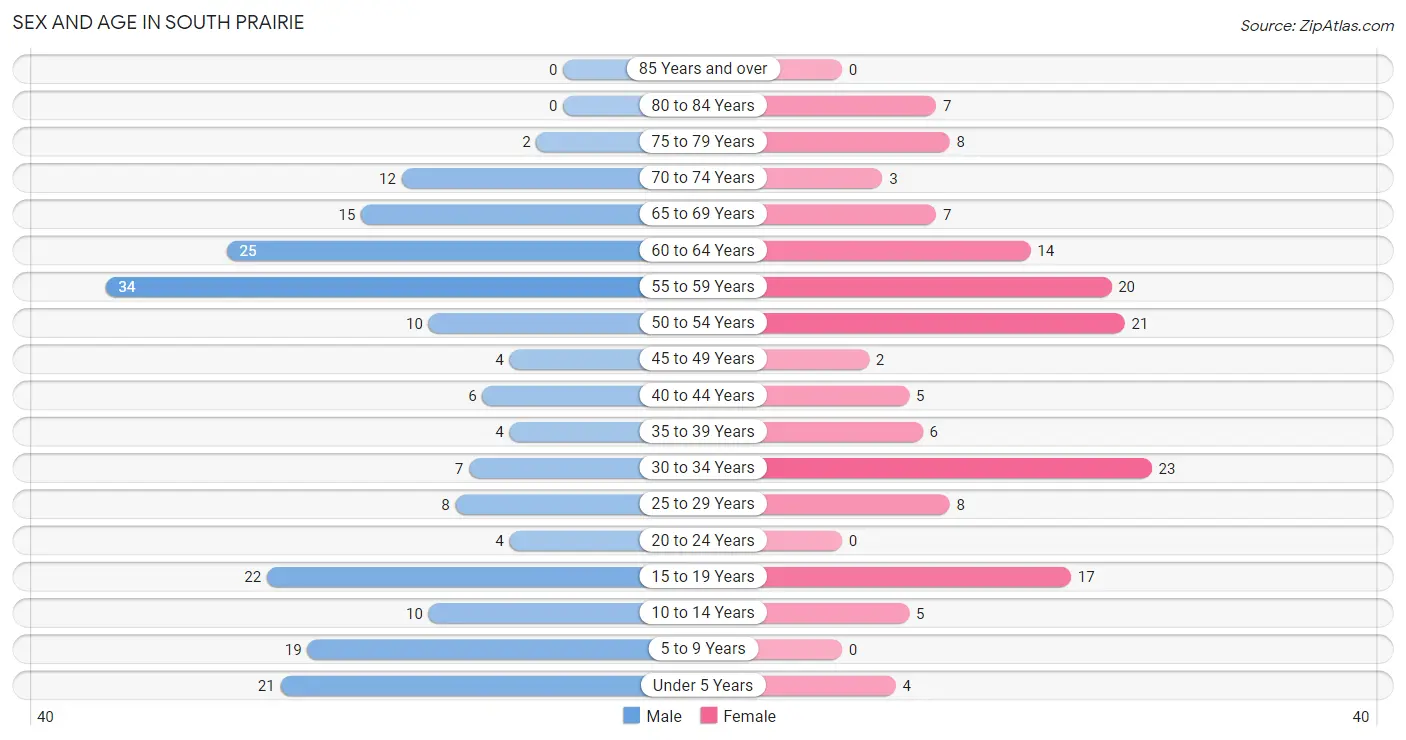
The most populous age groups in South Prairie are 55 to 59 Years (34 | 16.8%) for men and 30 to 34 Years (23 | 15.3%) for women.
| Age Bracket | Male | Female |
| Under 5 Years | 21 (10.3%) | 4 (2.7%) |
| 5 to 9 Years | 19 (9.4%) | 0 (0.0%) |
| 10 to 14 Years | 10 (4.9%) | 5 (3.3%) |
| 15 to 19 Years | 22 (10.8%) | 17 (11.3%) |
| 20 to 24 Years | 4 (2.0%) | 0 (0.0%) |
| 25 to 29 Years | 8 (3.9%) | 8 (5.3%) |
| 30 to 34 Years | 7 (3.5%) | 23 (15.3%) |
| 35 to 39 Years | 4 (2.0%) | 6 (4.0%) |
| 40 to 44 Years | 6 (3.0%) | 5 (3.3%) |
| 45 to 49 Years | 4 (2.0%) | 2 (1.3%) |
| 50 to 54 Years | 10 (4.9%) | 21 (14.0%) |
| 55 to 59 Years | 34 (16.8%) | 20 (13.3%) |
| 60 to 64 Years | 25 (12.3%) | 14 (9.3%) |
| 65 to 69 Years | 15 (7.4%) | 7 (4.7%) |
| 70 to 74 Years | 12 (5.9%) | 3 (2.0%) |
| 75 to 79 Years | 2 (1.0%) | 8 (5.3%) |
| 80 to 84 Years | 0 (0.0%) | 7 (4.7%) |
| 85 Years and over | 0 (0.0%) | 0 (0.0%) |
| Total | 203 (100.0%) | 150 (100.0%) |
Families and Households in South Prairie
Median Family Size in South Prairie
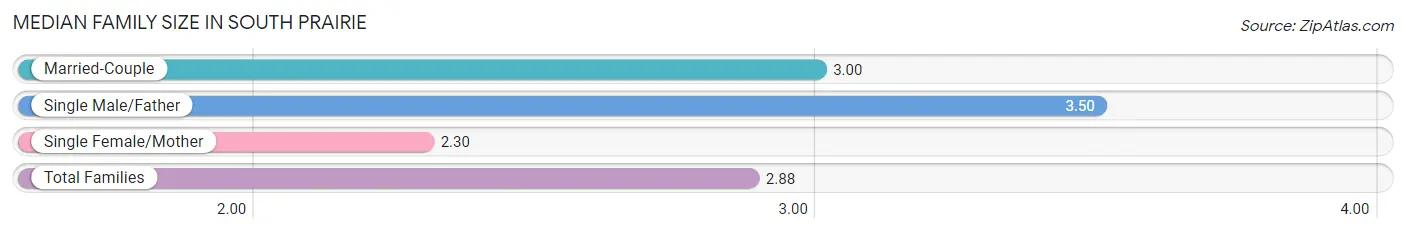
The median family size in South Prairie is 2.88 persons per family, with single male/father families (6 | 5.7%) accounting for the largest median family size of 3.5 persons per family. On the other hand, single female/mother families (23 | 21.9%) represent the smallest median family size with 2.30 persons per family.
| Family Type | # Families | Family Size |
| Married-Couple | 76 (72.4%) | 3.00 |
| Single Male/Father | 6 (5.7%) | 3.50 |
| Single Female/Mother | 23 (21.9%) | 2.30 |
| Total Families | 105 (100.0%) | 2.88 |
Median Household Size in South Prairie
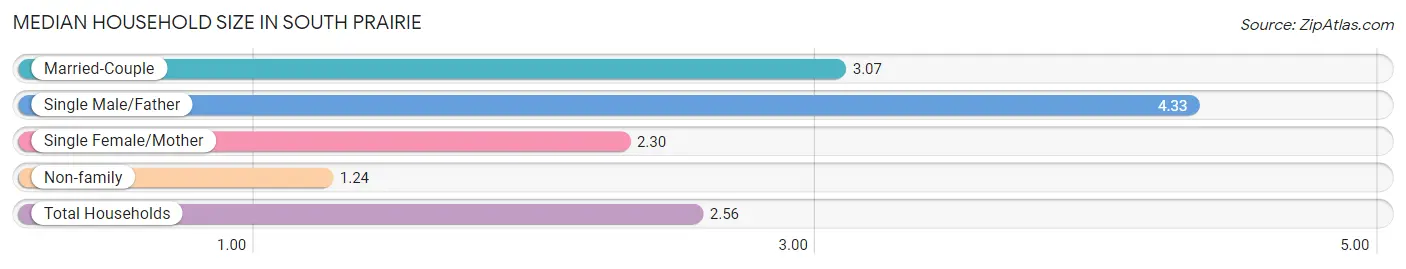
The median household size in South Prairie is 2.56 persons per household, with single male/father households (6 | 4.3%) accounting for the largest median household size of 4.33 persons per household. non-family households (33 | 23.9%) represent the smallest median household size with 1.24 persons per household.
| Household Type | # Households | Household Size |
| Married-Couple | 76 (55.1%) | 3.07 |
| Single Male/Father | 6 (4.3%) | 4.33 |
| Single Female/Mother | 23 (16.7%) | 2.30 |
| Non-family | 33 (23.9%) | 1.24 |
| Total Households | 138 (100.0%) | 2.56 |
Household Size by Marriage Status in South Prairie
Out of a total of 138 households in South Prairie, 105 (76.1%) are family households, while 33 (23.9%) are nonfamily households. The most numerous type of family households are 2-person households, comprising 65, and the most common type of nonfamily households are 1-person households, comprising 26.
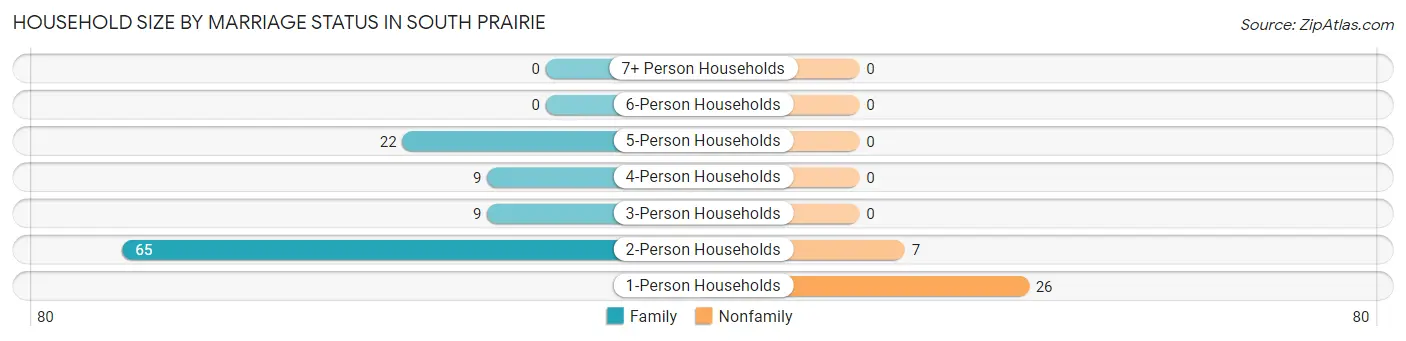
| Household Size | Family Households | Nonfamily Households |
| 1-Person Households | - | 26 (18.8%) |
| 2-Person Households | 65 (47.1%) | 7 (5.1%) |
| 3-Person Households | 9 (6.5%) | 0 (0.0%) |
| 4-Person Households | 9 (6.5%) | 0 (0.0%) |
| 5-Person Households | 22 (15.9%) | 0 (0.0%) |
| 6-Person Households | 0 (0.0%) | 0 (0.0%) |
| 7+ Person Households | 0 (0.0%) | 0 (0.0%) |
| Total | 105 (76.1%) | 33 (23.9%) |
Female Fertility in South Prairie
Fertility by Age in South Prairie
Average fertility rate in South Prairie is 65.0 births per 1,000 women. Women in the age bracket of 20 to 34 years have the highest fertility rate with 161.0 births per 1,000 women. Women in the age bracket of 20 to 34 years acount for 100.0% of all women with births.
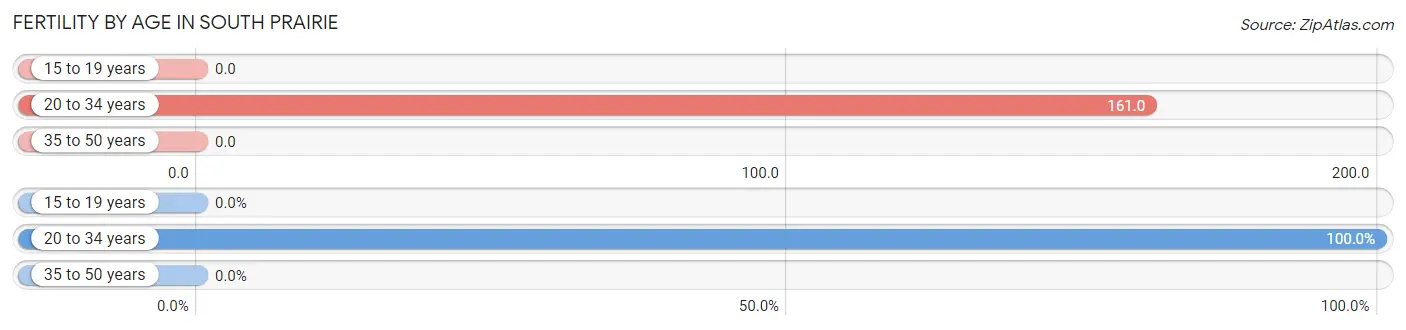
| Age Bracket | Women with Births | Births / 1,000 Women |
| 15 to 19 years | 0 (0.0%) | 0.0 |
| 20 to 34 years | 5 (100.0%) | 161.0 |
| 35 to 50 years | 0 (0.0%) | 0.0 |
| Total | 5 (100.0%) | 65.0 |
Fertility by Age by Marriage Status in South Prairie
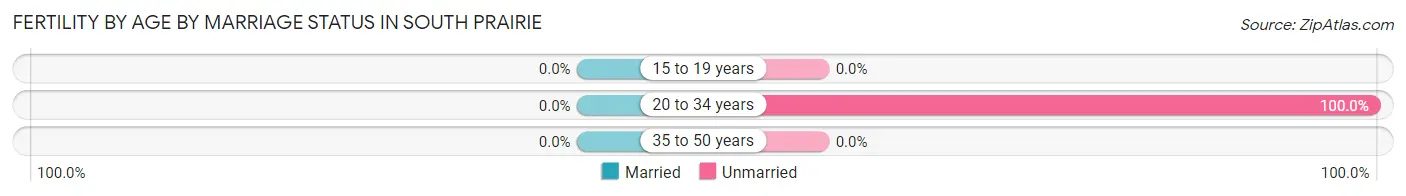
| Age Bracket | Married | Unmarried |
| 15 to 19 years | 0 (0.0%) | 0 (0.0%) |
| 20 to 34 years | 0 (0.0%) | 5 (100.0%) |
| 35 to 50 years | 0 (0.0%) | 0 (0.0%) |
| Total | 0 (0.0%) | 5 (100.0%) |
Fertility by Education in South Prairie
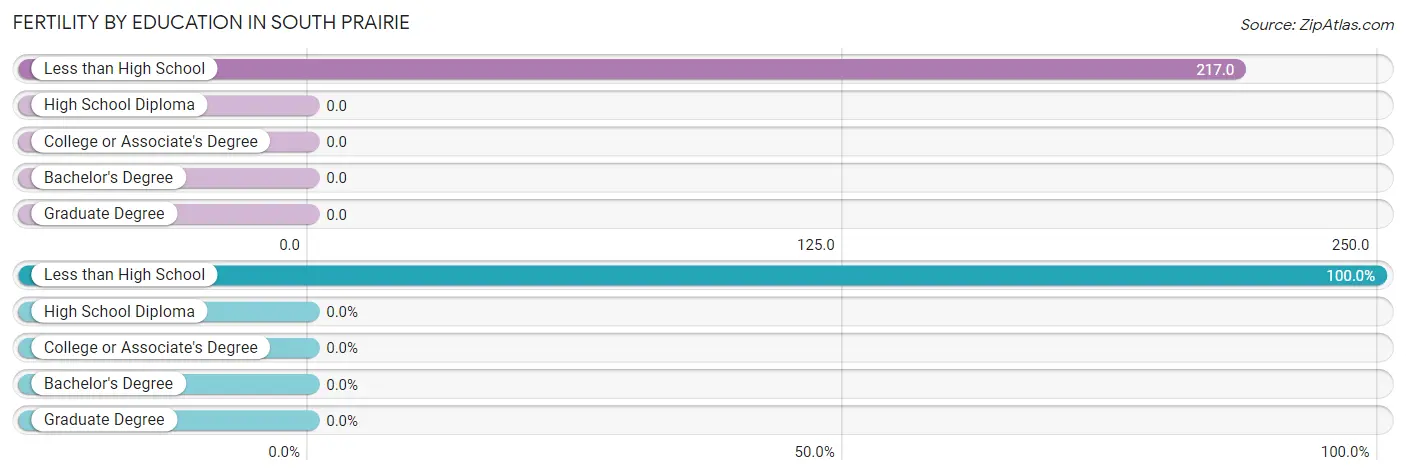
| Educational Attainment | Women with Births | Births / 1,000 Women |
| Less than High School | 5 (100.0%) | 217.0 |
| High School Diploma | 0 (0.0%) | 0.0 |
| College or Associate's Degree | 0 (0.0%) | 0.0 |
| Bachelor's Degree | 0 (0.0%) | 0.0 |
| Graduate Degree | 0 (0.0%) | 0.0 |
| Total | 5 (100.0%) | 65.0 |
Fertility by Education by Marriage Status in South Prairie
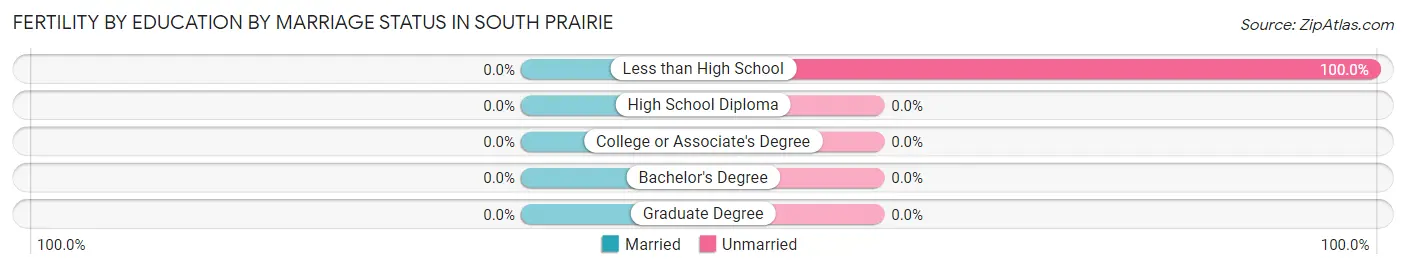
| Educational Attainment | Married | Unmarried |
| Less than High School | 0 (0.0%) | 5 (100.0%) |
| High School Diploma | 0 (0.0%) | 0 (0.0%) |
| College or Associate's Degree | 0 (0.0%) | 0 (0.0%) |
| Bachelor's Degree | 0 (0.0%) | 0 (0.0%) |
| Graduate Degree | 0 (0.0%) | 0 (0.0%) |
| Total | 0 (0.0%) | 5 (100.0%) |
Employment Characteristics in South Prairie
Employment by Class of Employer in South Prairie
Among the 165 employed individuals in South Prairie, private company employees (125 | 75.8%), not-for-profit organizations (11 | 6.7%), and local government employees (9 | 5.4%) make up the most common classes of employment.
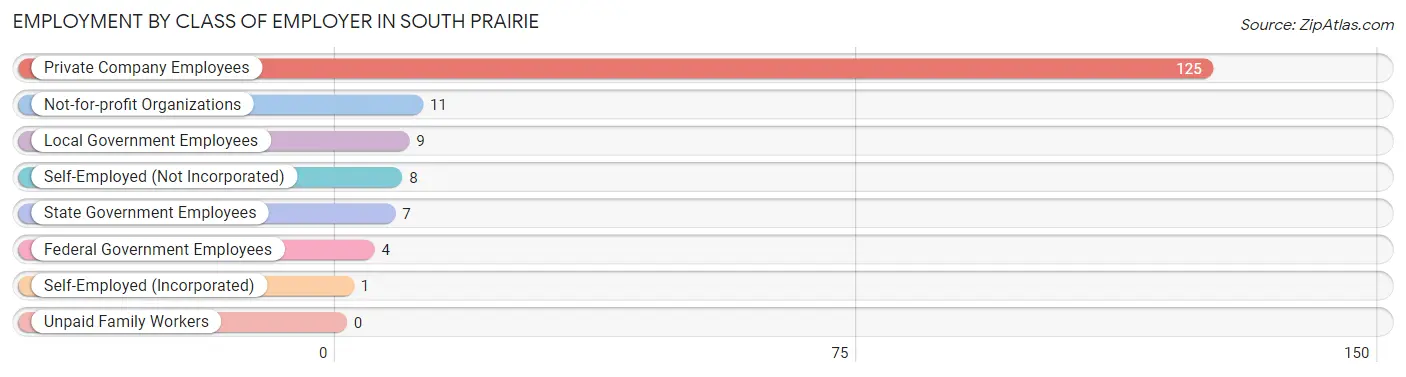
| Employer Class | # Employees | % Employees |
| Private Company Employees | 125 | 75.8% |
| Self-Employed (Incorporated) | 1 | 0.6% |
| Self-Employed (Not Incorporated) | 8 | 4.9% |
| Not-for-profit Organizations | 11 | 6.7% |
| Local Government Employees | 9 | 5.4% |
| State Government Employees | 7 | 4.2% |
| Federal Government Employees | 4 | 2.4% |
| Unpaid Family Workers | 0 | 0.0% |
| Total | 165 | 100.0% |
Employment Status by Age in South Prairie
According to the labor force statistics for South Prairie, out of the total population over 16 years of age (285), 63.5% or 181 individuals are in the labor force, with 4.4% or 8 of them unemployed. The age group with the highest labor force participation rate is 20 to 24 years, with 100.0% or 4 individuals in the labor force. Within the labor force, the 20 to 24 years age range has the highest percentage of unemployed individuals, with 100.0% or 4 of them being unemployed.
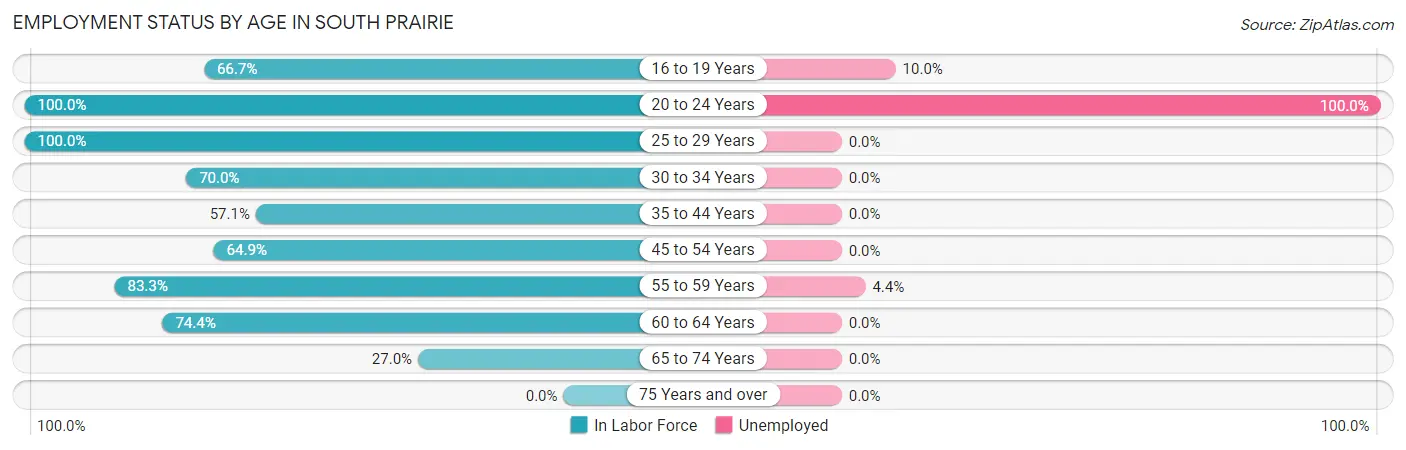
| Age Bracket | In Labor Force | Unemployed |
| 16 to 19 Years | 20 (66.7%) | 2 (10.0%) |
| 20 to 24 Years | 4 (100.0%) | 4 (100.0%) |
| 25 to 29 Years | 16 (100.0%) | 0 (0.0%) |
| 30 to 34 Years | 21 (70.0%) | 0 (0.0%) |
| 35 to 44 Years | 12 (57.1%) | 0 (0.0%) |
| 45 to 54 Years | 24 (64.9%) | 0 (0.0%) |
| 55 to 59 Years | 45 (83.3%) | 2 (4.4%) |
| 60 to 64 Years | 29 (74.4%) | 0 (0.0%) |
| 65 to 74 Years | 10 (27.0%) | 0 (0.0%) |
| 75 Years and over | 0 (0.0%) | 0 (0.0%) |
| Total | 181 (63.5%) | 8 (4.4%) |
Employment Status by Educational Attainment in South Prairie
According to labor force statistics for South Prairie, 74.6% of individuals (147) out of the total population between 25 and 64 years of age (197) are in the labor force, with 1.4% or 2 of them being unemployed. The group with the highest labor force participation rate are those with the educational attainment of bachelor's degree or higher, with 100.0% or 20 individuals in the labor force. Within the labor force, individuals with high school diploma education have the highest percentage of unemployment, with 2.6% or 2 of them being unemployed.
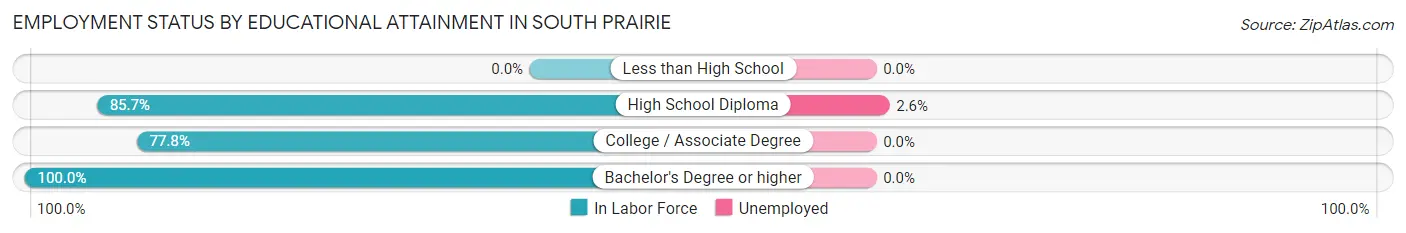
| Educational Attainment | In Labor Force | Unemployed |
| Less than High School | 0 (0.0%) | 0 (0.0%) |
| High School Diploma | 78 (85.7%) | 2 (2.6%) |
| College / Associate Degree | 49 (77.8%) | 0 (0.0%) |
| Bachelor's Degree or higher | 20 (100.0%) | 0 (0.0%) |
| Total | 147 (74.6%) | 3 (1.4%) |
Employment Occupations by Sex in South Prairie
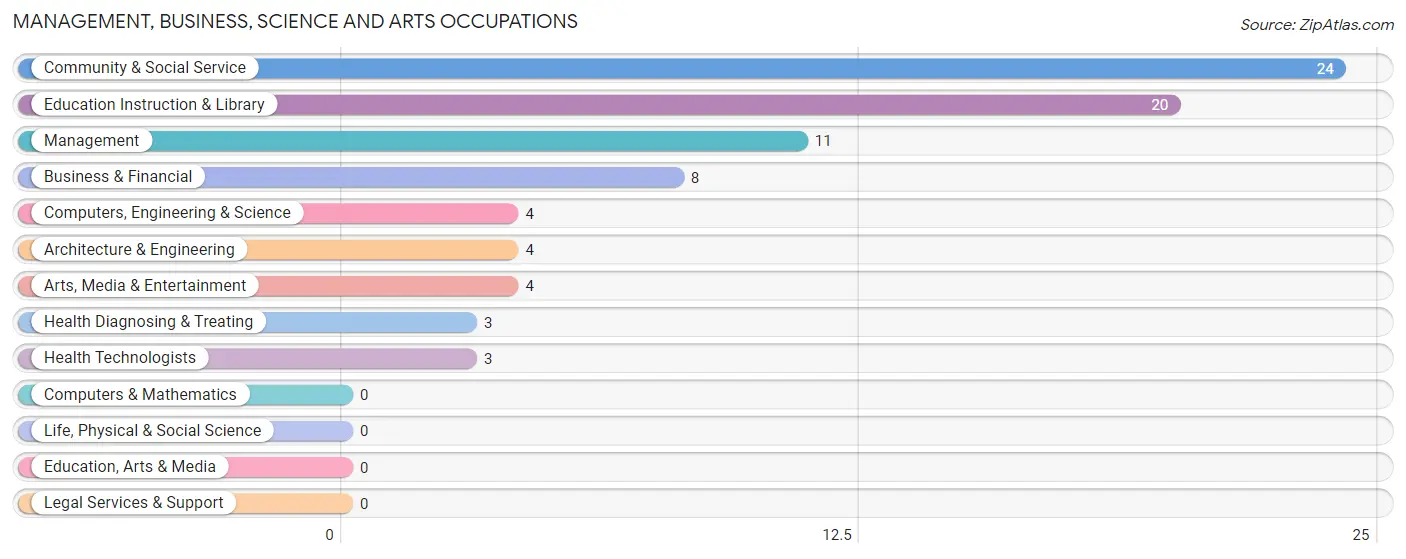
Management, Business, Science and Arts Occupations
The most common Management, Business, Science and Arts occupations in South Prairie are Community & Social Service (24 | 13.9%), Education Instruction & Library (20 | 11.6%), Management (11 | 6.4%), Business & Financial (8 | 4.6%), and Computers, Engineering & Science (4 | 2.3%).
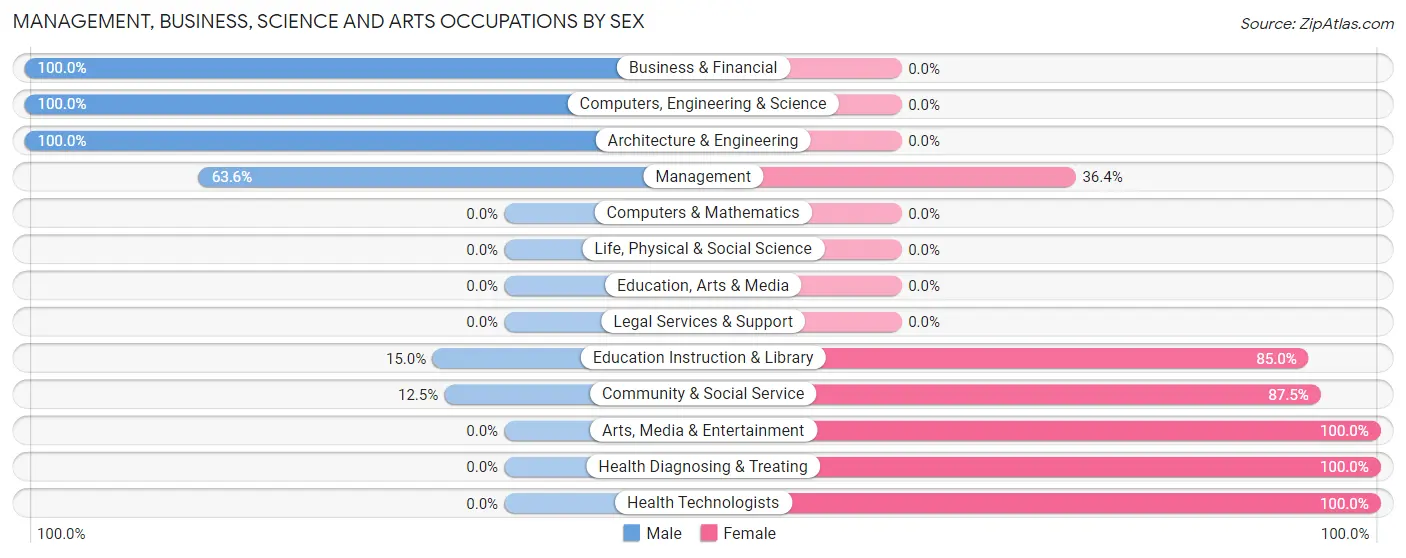
Management, Business, Science and Arts Occupations by Sex
Within the Management, Business, Science and Arts occupations in South Prairie, the most male-oriented occupations are Business & Financial (100.0%), Computers, Engineering & Science (100.0%), and Architecture & Engineering (100.0%), while the most female-oriented occupations are Arts, Media & Entertainment (100.0%), Health Diagnosing & Treating (100.0%), and Health Technologists (100.0%).
| Occupation | Male | Female |
| Management | 7 (63.6%) | 4 (36.4%) |
| Business & Financial | 8 (100.0%) | 0 (0.0%) |
| Computers, Engineering & Science | 4 (100.0%) | 0 (0.0%) |
| Computers & Mathematics | 0 (0.0%) | 0 (0.0%) |
| Architecture & Engineering | 4 (100.0%) | 0 (0.0%) |
| Life, Physical & Social Science | 0 (0.0%) | 0 (0.0%) |
| Community & Social Service | 3 (12.5%) | 21 (87.5%) |
| Education, Arts & Media | 0 (0.0%) | 0 (0.0%) |
| Legal Services & Support | 0 (0.0%) | 0 (0.0%) |
| Education Instruction & Library | 3 (15.0%) | 17 (85.0%) |
| Arts, Media & Entertainment | 0 (0.0%) | 4 (100.0%) |
| Health Diagnosing & Treating | 0 (0.0%) | 3 (100.0%) |
| Health Technologists | 0 (0.0%) | 3 (100.0%) |
| Total (Category) | 22 (44.0%) | 28 (56.0%) |
| Total (Overall) | 95 (54.9%) | 78 (45.1%) |
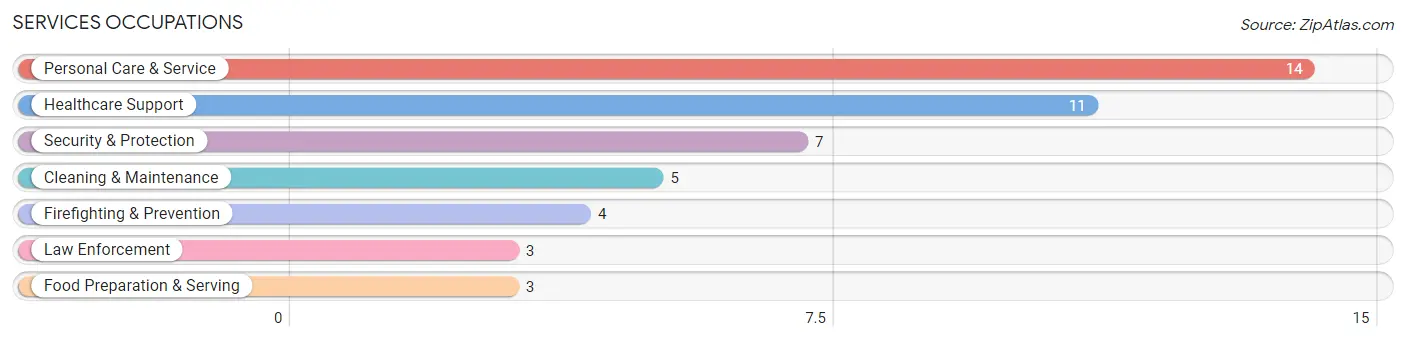
Services Occupations
The most common Services occupations in South Prairie are Personal Care & Service (14 | 8.1%), Healthcare Support (11 | 6.4%), Security & Protection (7 | 4.1%), Cleaning & Maintenance (5 | 2.9%), and Firefighting & Prevention (4 | 2.3%).
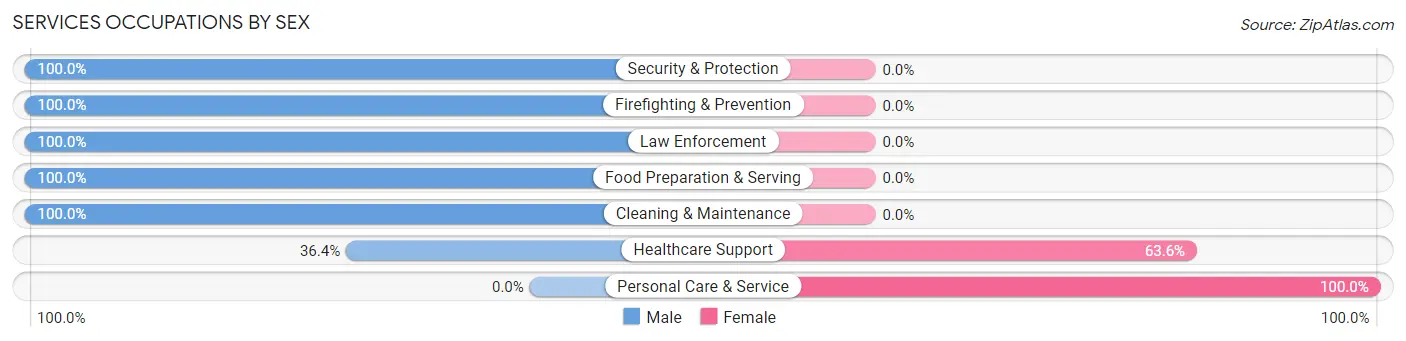
Services Occupations by Sex
Within the Services occupations in South Prairie, the most male-oriented occupations are Security & Protection (100.0%), Firefighting & Prevention (100.0%), and Law Enforcement (100.0%), while the most female-oriented occupations are Personal Care & Service (100.0%), and Healthcare Support (63.6%).
| Occupation | Male | Female |
| Healthcare Support | 4 (36.4%) | 7 (63.6%) |
| Security & Protection | 7 (100.0%) | 0 (0.0%) |
| Firefighting & Prevention | 4 (100.0%) | 0 (0.0%) |
| Law Enforcement | 3 (100.0%) | 0 (0.0%) |
| Food Preparation & Serving | 3 (100.0%) | 0 (0.0%) |
| Cleaning & Maintenance | 5 (100.0%) | 0 (0.0%) |
| Personal Care & Service | 0 (0.0%) | 14 (100.0%) |
| Total (Category) | 19 (47.5%) | 21 (52.5%) |
| Total (Overall) | 95 (54.9%) | 78 (45.1%) |
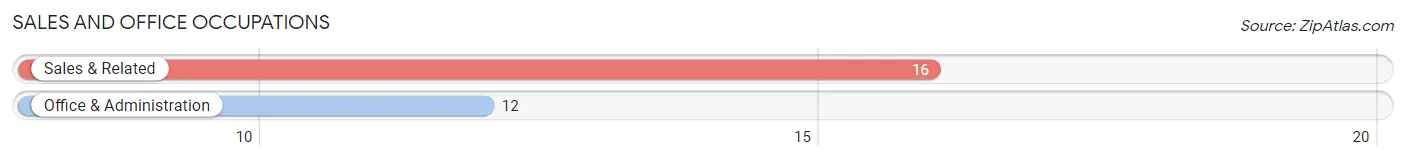
Sales and Office Occupations
The most common Sales and Office occupations in South Prairie are Sales & Related (16 | 9.2%), and Office & Administration (12 | 6.9%).
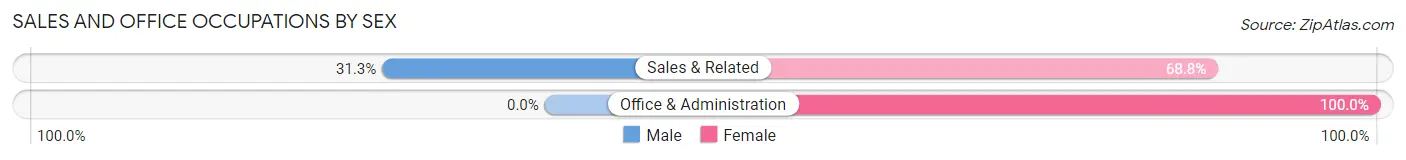
Sales and Office Occupations by Sex
| Occupation | Male | Female |
| Sales & Related | 5 (31.2%) | 11 (68.8%) |
| Office & Administration | 0 (0.0%) | 12 (100.0%) |
| Total (Category) | 5 (17.9%) | 23 (82.1%) |
| Total (Overall) | 95 (54.9%) | 78 (45.1%) |
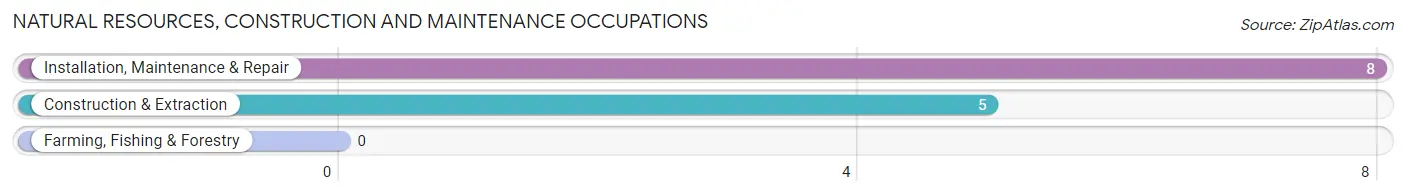
Natural Resources, Construction and Maintenance Occupations
The most common Natural Resources, Construction and Maintenance occupations in South Prairie are Installation, Maintenance & Repair (8 | 4.6%), and Construction & Extraction (5 | 2.9%).
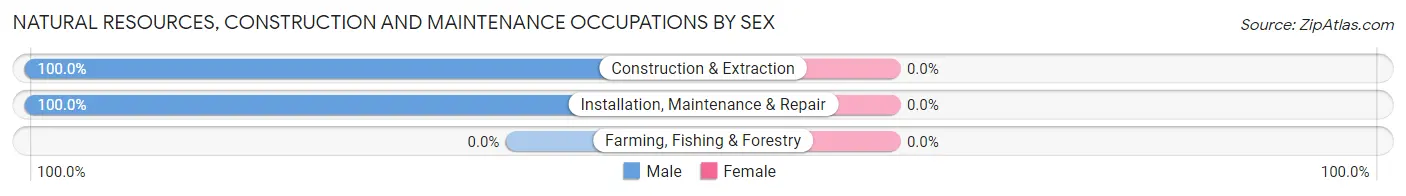
Natural Resources, Construction and Maintenance Occupations by Sex
| Occupation | Male | Female |
| Farming, Fishing & Forestry | 0 (0.0%) | 0 (0.0%) |
| Construction & Extraction | 5 (100.0%) | 0 (0.0%) |
| Installation, Maintenance & Repair | 8 (100.0%) | 0 (0.0%) |
| Total (Category) | 13 (100.0%) | 0 (0.0%) |
| Total (Overall) | 95 (54.9%) | 78 (45.1%) |
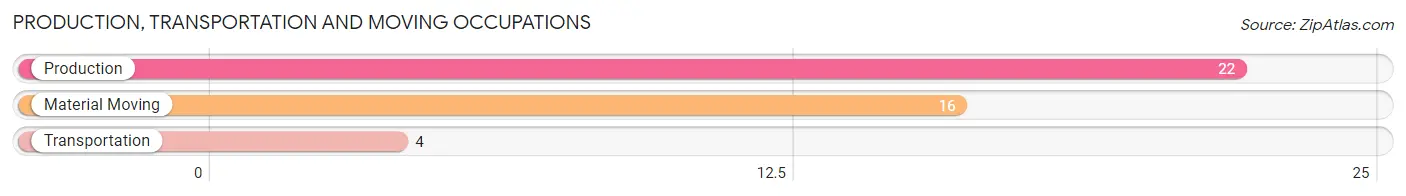
Production, Transportation and Moving Occupations
The most common Production, Transportation and Moving occupations in South Prairie are Production (22 | 12.7%), Material Moving (16 | 9.2%), and Transportation (4 | 2.3%).
Production, Transportation and Moving Occupations by Sex
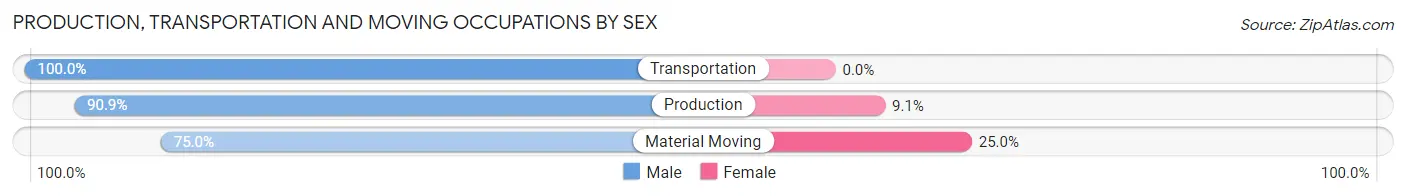
| Occupation | Male | Female |
| Production | 20 (90.9%) | 2 (9.1%) |
| Transportation | 4 (100.0%) | 0 (0.0%) |
| Material Moving | 12 (75.0%) | 4 (25.0%) |
| Total (Category) | 36 (85.7%) | 6 (14.3%) |
| Total (Overall) | 95 (54.9%) | 78 (45.1%) |
Employment Industries by Sex in South Prairie
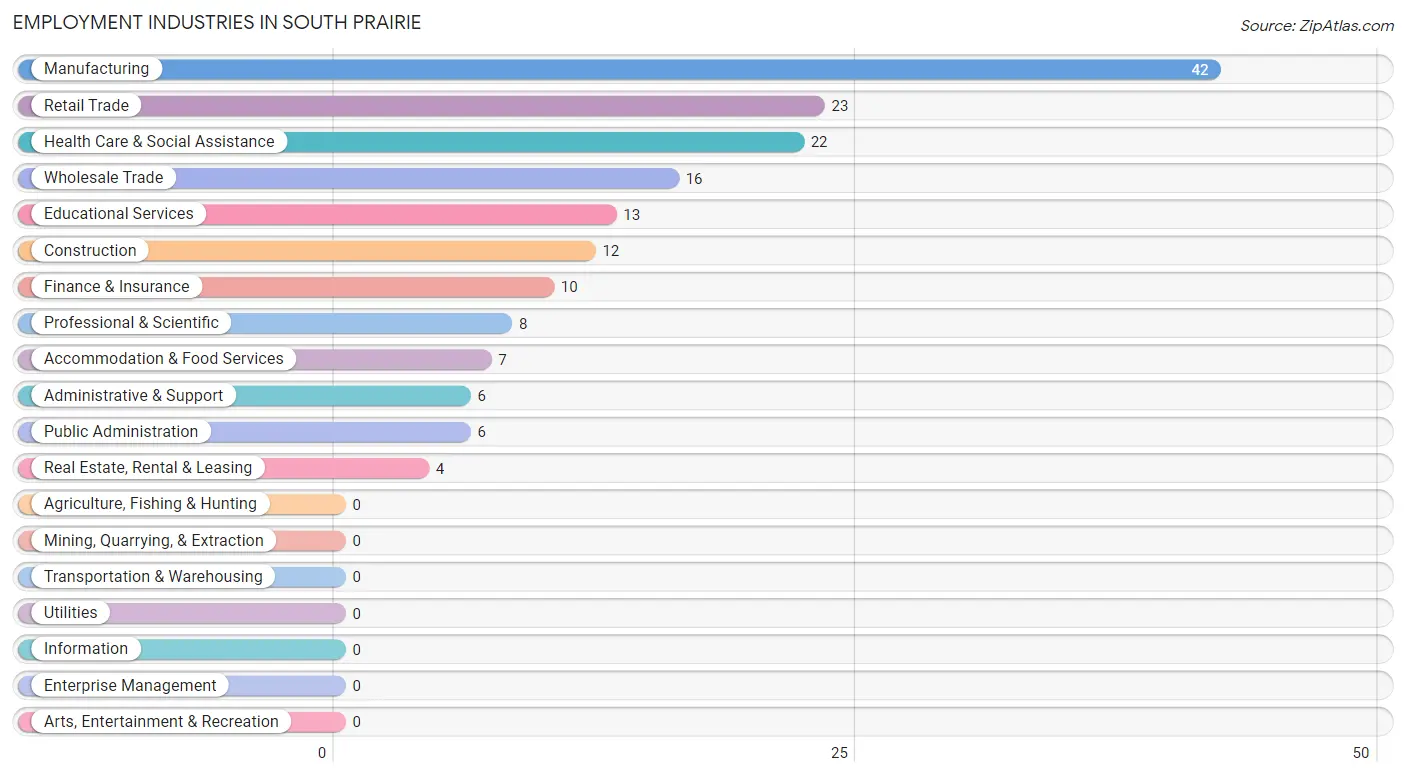
Employment Industries in South Prairie
The major employment industries in South Prairie include Manufacturing (42 | 24.3%), Retail Trade (23 | 13.3%), Health Care & Social Assistance (22 | 12.7%), Wholesale Trade (16 | 9.2%), and Educational Services (13 | 7.5%).
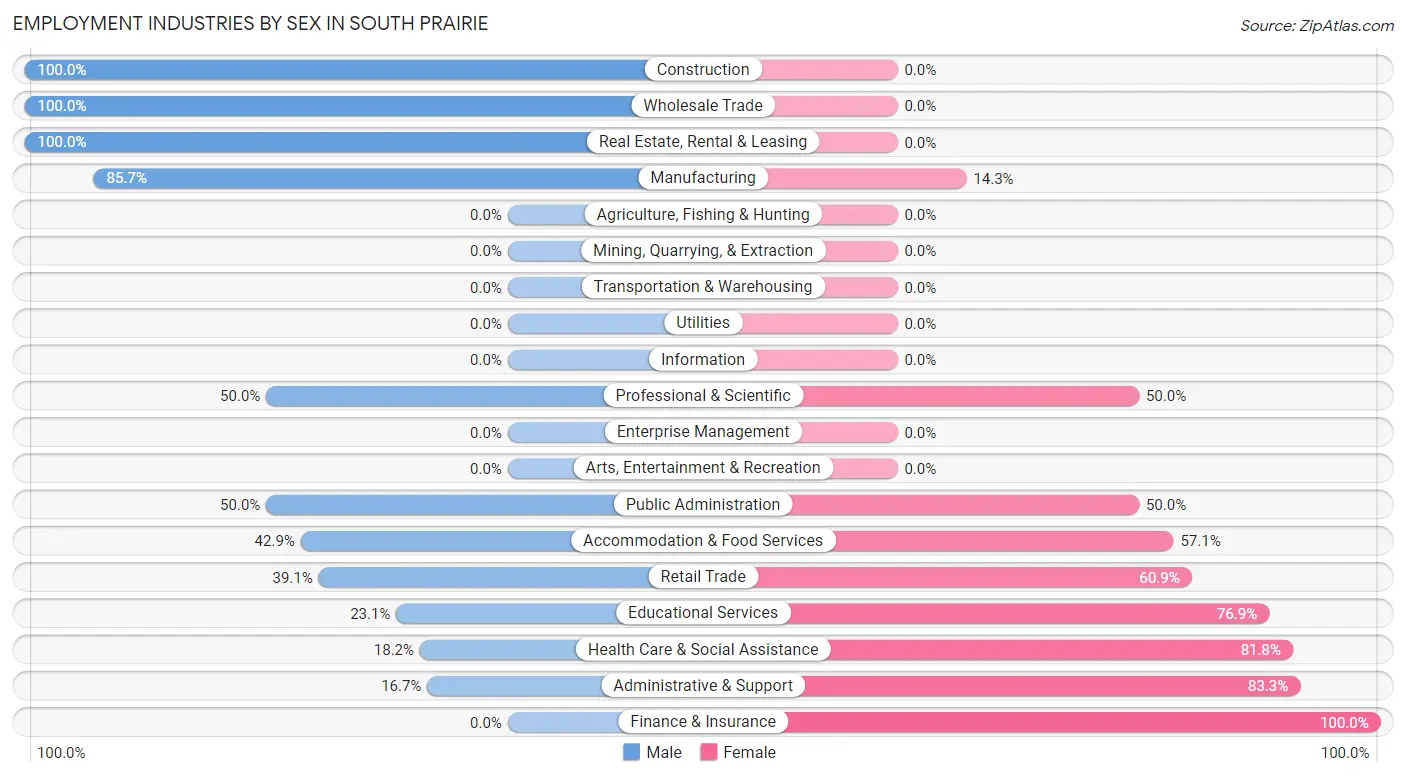
Employment Industries by Sex in South Prairie
The South Prairie industries that see more men than women are Construction (100.0%), Wholesale Trade (100.0%), and Real Estate, Rental & Leasing (100.0%), whereas the industries that tend to have a higher number of women are Finance & Insurance (100.0%), Administrative & Support (83.3%), and Health Care & Social Assistance (81.8%).
| Industry | Male | Female |
| Agriculture, Fishing & Hunting | 0 (0.0%) | 0 (0.0%) |
| Mining, Quarrying, & Extraction | 0 (0.0%) | 0 (0.0%) |
| Construction | 12 (100.0%) | 0 (0.0%) |
| Manufacturing | 36 (85.7%) | 6 (14.3%) |
| Wholesale Trade | 16 (100.0%) | 0 (0.0%) |
| Retail Trade | 9 (39.1%) | 14 (60.9%) |
| Transportation & Warehousing | 0 (0.0%) | 0 (0.0%) |
| Utilities | 0 (0.0%) | 0 (0.0%) |
| Information | 0 (0.0%) | 0 (0.0%) |
| Finance & Insurance | 0 (0.0%) | 10 (100.0%) |
| Real Estate, Rental & Leasing | 4 (100.0%) | 0 (0.0%) |
| Professional & Scientific | 4 (50.0%) | 4 (50.0%) |
| Enterprise Management | 0 (0.0%) | 0 (0.0%) |
| Administrative & Support | 1 (16.7%) | 5 (83.3%) |
| Educational Services | 3 (23.1%) | 10 (76.9%) |
| Health Care & Social Assistance | 4 (18.2%) | 18 (81.8%) |
| Arts, Entertainment & Recreation | 0 (0.0%) | 0 (0.0%) |
| Accommodation & Food Services | 3 (42.9%) | 4 (57.1%) |
| Public Administration | 3 (50.0%) | 3 (50.0%) |
| Total | 95 (54.9%) | 78 (45.1%) |
Education in South Prairie
School Enrollment in South Prairie
The most common levels of schooling among the 78 students in South Prairie are elementary school (23 | 29.5%), high school (23 | 29.5%), and college / undergraduate (18 | 23.1%).
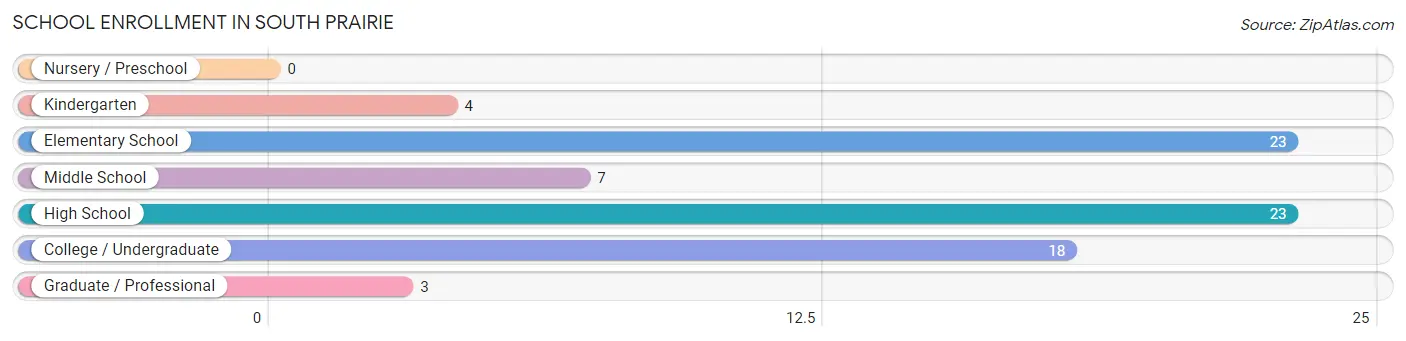
| School Level | # Students | % Students |
| Nursery / Preschool | 0 | 0.0% |
| Kindergarten | 4 | 5.1% |
| Elementary School | 23 | 29.5% |
| Middle School | 7 | 9.0% |
| High School | 23 | 29.5% |
| College / Undergraduate | 18 | 23.1% |
| Graduate / Professional | 3 | 3.8% |
| Total | 78 | 100.0% |
School Enrollment by Age by Funding Source in South Prairie
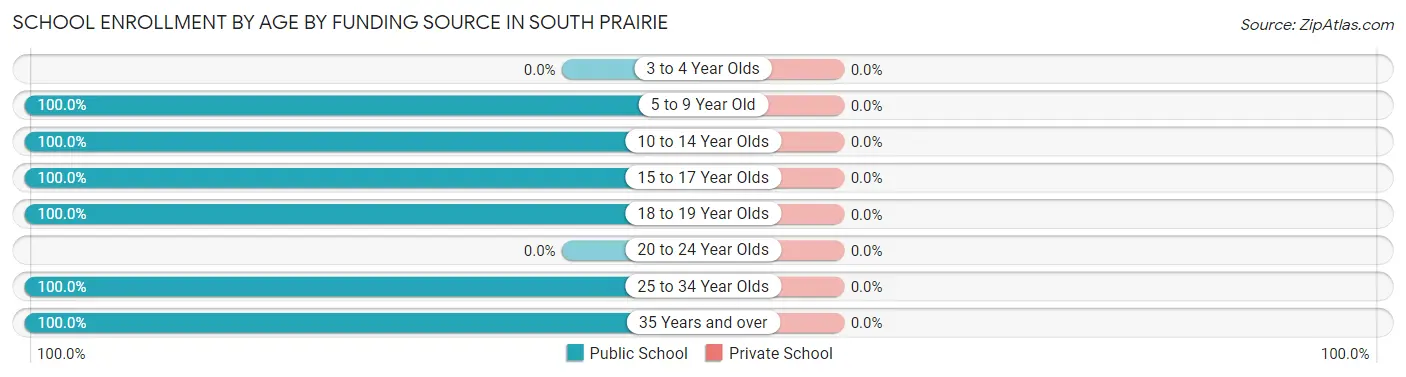
| Age Bracket | Public School | Private School |
| 3 to 4 Year Olds | 0 (0.0%) | 0 (0.0%) |
| 5 to 9 Year Old | 19 (100.0%) | 0 (0.0%) |
| 10 to 14 Year Olds | 15 (100.0%) | 0 (0.0%) |
| 15 to 17 Year Olds | 15 (100.0%) | 0 (0.0%) |
| 18 to 19 Year Olds | 19 (100.0%) | 0 (0.0%) |
| 20 to 24 Year Olds | 0 (0.0%) | 0 (0.0%) |
| 25 to 34 Year Olds | 7 (100.0%) | 0 (0.0%) |
| 35 Years and over | 3 (100.0%) | 0 (0.0%) |
| Total | 78 (100.0%) | 0 (0.0%) |
Educational Attainment by Field of Study in South Prairie
Business (6 | 24.0%), engineering (4 | 16.0%), literature & languages (4 | 16.0%), visual & performing arts (4 | 16.0%), and science & technology (3 | 12.0%) are the most common fields of study among 25 individuals in South Prairie who have obtained a bachelor's degree or higher.
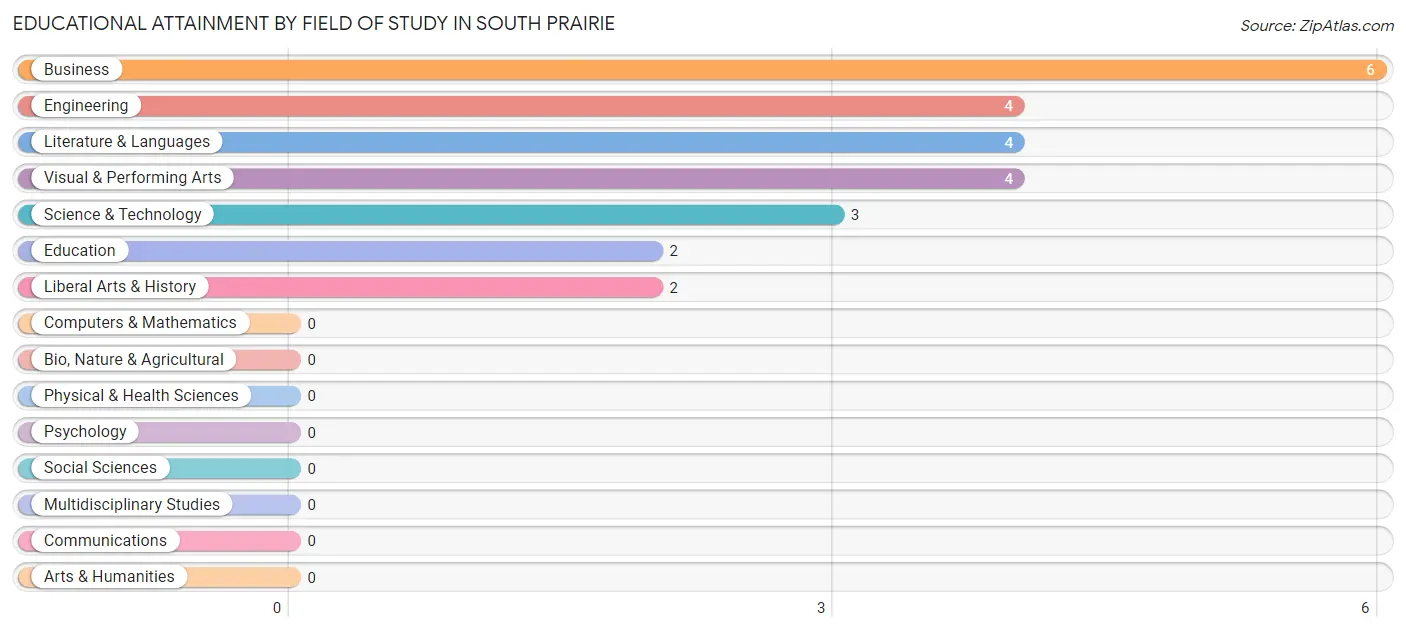
| Field of Study | # Graduates | % Graduates |
| Computers & Mathematics | 0 | 0.0% |
| Bio, Nature & Agricultural | 0 | 0.0% |
| Physical & Health Sciences | 0 | 0.0% |
| Psychology | 0 | 0.0% |
| Social Sciences | 0 | 0.0% |
| Engineering | 4 | 16.0% |
| Multidisciplinary Studies | 0 | 0.0% |
| Science & Technology | 3 | 12.0% |
| Business | 6 | 24.0% |
| Education | 2 | 8.0% |
| Literature & Languages | 4 | 16.0% |
| Liberal Arts & History | 2 | 8.0% |
| Visual & Performing Arts | 4 | 16.0% |
| Communications | 0 | 0.0% |
| Arts & Humanities | 0 | 0.0% |
| Total | 25 | 100.0% |
Transportation & Commute in South Prairie
Vehicle Availability by Sex in South Prairie
The most prevalent vehicle ownership categories in South Prairie are males with 3 vehicles (34, accounting for 39.1%) and females with 3 vehicles (25, making up 43.6%).
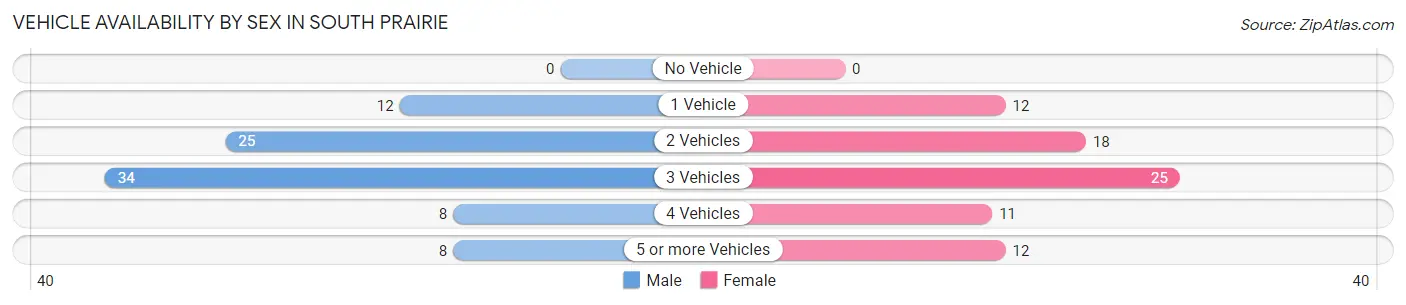
| Vehicles Available | Male | Female |
| No Vehicle | 0 (0.0%) | 0 (0.0%) |
| 1 Vehicle | 12 (13.8%) | 12 (15.4%) |
| 2 Vehicles | 25 (28.7%) | 18 (23.1%) |
| 3 Vehicles | 34 (39.1%) | 25 (32.1%) |
| 4 Vehicles | 8 (9.2%) | 11 (14.1%) |
| 5 or more Vehicles | 8 (9.2%) | 12 (15.4%) |
| Total | 87 (100.0%) | 78 (100.0%) |
Commute Time in South Prairie
The most frequently occuring commute durations in South Prairie are 45 to 59 minutes (45 commuters, 27.8%), 60 to 89 minutes (34 commuters, 21.0%), and 30 to 34 minutes (19 commuters, 11.7%).
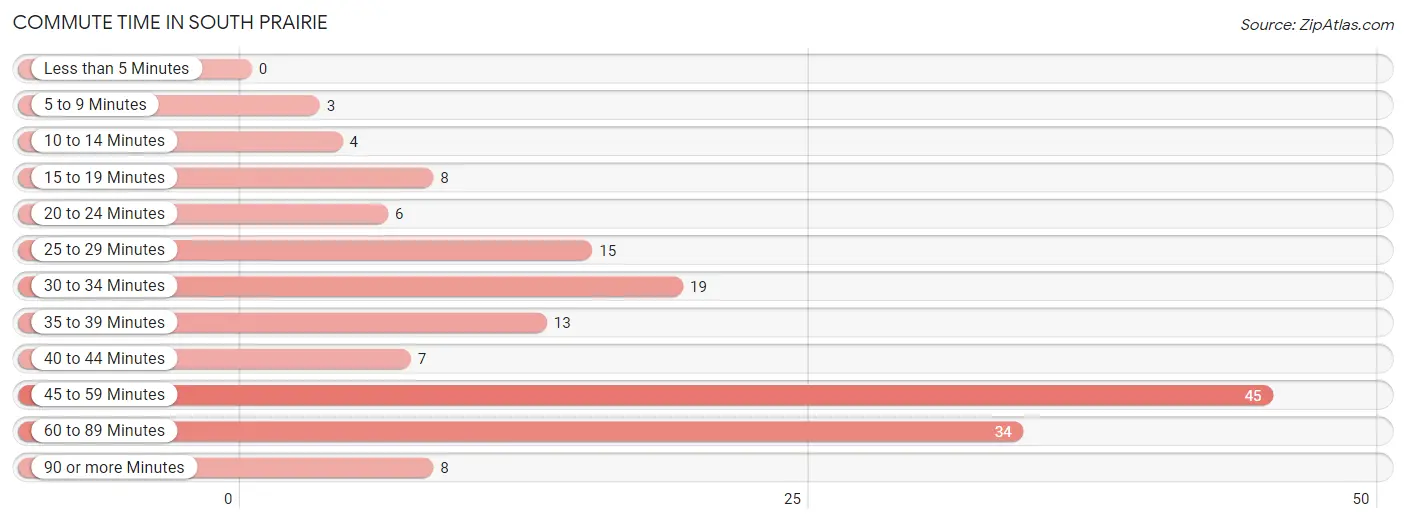
| Commute Time | # Commuters | % Commuters |
| Less than 5 Minutes | 0 | 0.0% |
| 5 to 9 Minutes | 3 | 1.8% |
| 10 to 14 Minutes | 4 | 2.5% |
| 15 to 19 Minutes | 8 | 4.9% |
| 20 to 24 Minutes | 6 | 3.7% |
| 25 to 29 Minutes | 15 | 9.3% |
| 30 to 34 Minutes | 19 | 11.7% |
| 35 to 39 Minutes | 13 | 8.0% |
| 40 to 44 Minutes | 7 | 4.3% |
| 45 to 59 Minutes | 45 | 27.8% |
| 60 to 89 Minutes | 34 | 21.0% |
| 90 or more Minutes | 8 | 4.9% |
Commute Time by Sex in South Prairie
The most common commute times in South Prairie are 45 to 59 minutes (24 commuters, 27.6%) for males and 45 to 59 minutes (21 commuters, 28.0%) for females.
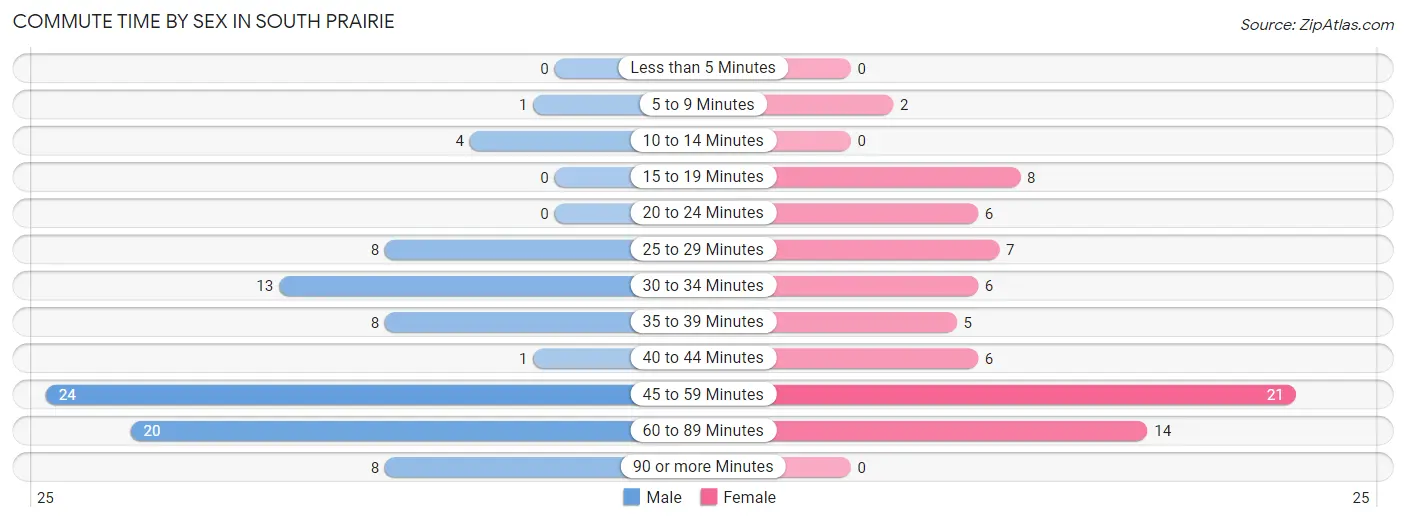
| Commute Time | Male | Female |
| Less than 5 Minutes | 0 (0.0%) | 0 (0.0%) |
| 5 to 9 Minutes | 1 (1.1%) | 2 (2.7%) |
| 10 to 14 Minutes | 4 (4.6%) | 0 (0.0%) |
| 15 to 19 Minutes | 0 (0.0%) | 8 (10.7%) |
| 20 to 24 Minutes | 0 (0.0%) | 6 (8.0%) |
| 25 to 29 Minutes | 8 (9.2%) | 7 (9.3%) |
| 30 to 34 Minutes | 13 (14.9%) | 6 (8.0%) |
| 35 to 39 Minutes | 8 (9.2%) | 5 (6.7%) |
| 40 to 44 Minutes | 1 (1.1%) | 6 (8.0%) |
| 45 to 59 Minutes | 24 (27.6%) | 21 (28.0%) |
| 60 to 89 Minutes | 20 (23.0%) | 14 (18.7%) |
| 90 or more Minutes | 8 (9.2%) | 0 (0.0%) |
Time of Departure to Work by Sex in South Prairie
The most frequent times of departure to work in South Prairie are 12:00 AM to 4:59 AM (20, 23.0%) for males and 6:30 AM to 6:59 AM (17, 22.7%) for females.
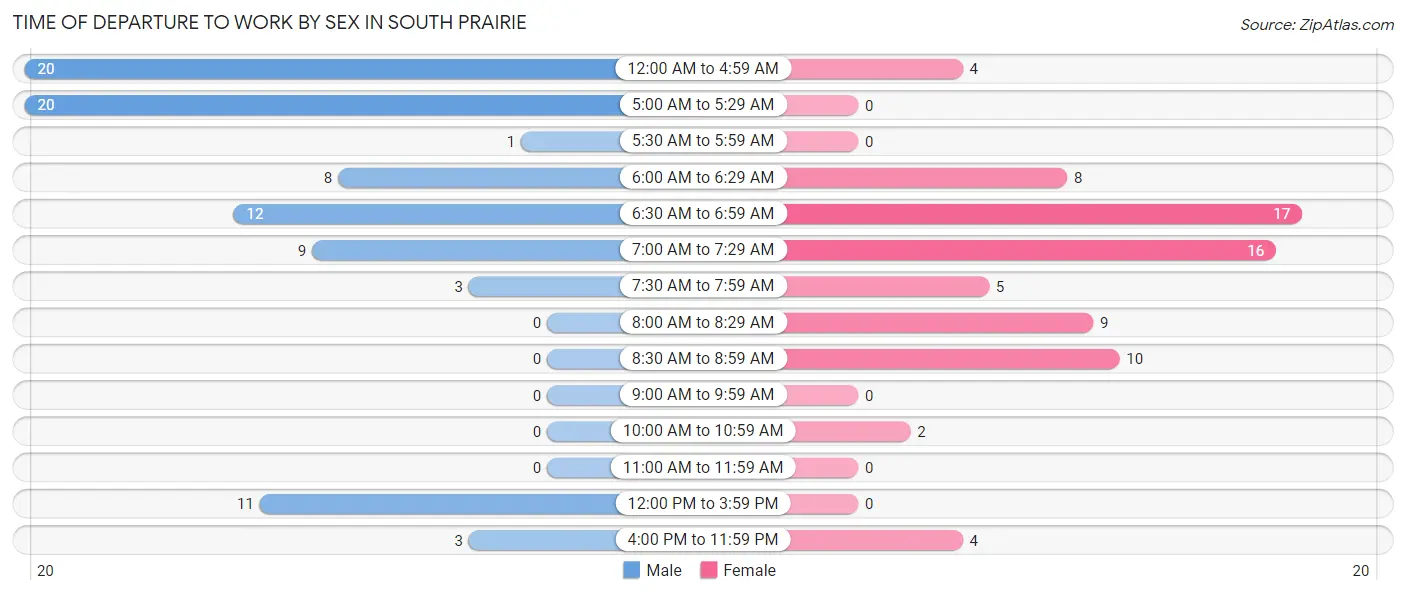
| Time of Departure | Male | Female |
| 12:00 AM to 4:59 AM | 20 (23.0%) | 4 (5.3%) |
| 5:00 AM to 5:29 AM | 20 (23.0%) | 0 (0.0%) |
| 5:30 AM to 5:59 AM | 1 (1.1%) | 0 (0.0%) |
| 6:00 AM to 6:29 AM | 8 (9.2%) | 8 (10.7%) |
| 6:30 AM to 6:59 AM | 12 (13.8%) | 17 (22.7%) |
| 7:00 AM to 7:29 AM | 9 (10.3%) | 16 (21.3%) |
| 7:30 AM to 7:59 AM | 3 (3.5%) | 5 (6.7%) |
| 8:00 AM to 8:29 AM | 0 (0.0%) | 9 (12.0%) |
| 8:30 AM to 8:59 AM | 0 (0.0%) | 10 (13.3%) |
| 9:00 AM to 9:59 AM | 0 (0.0%) | 0 (0.0%) |
| 10:00 AM to 10:59 AM | 0 (0.0%) | 2 (2.7%) |
| 11:00 AM to 11:59 AM | 0 (0.0%) | 0 (0.0%) |
| 12:00 PM to 3:59 PM | 11 (12.6%) | 0 (0.0%) |
| 4:00 PM to 11:59 PM | 3 (3.5%) | 4 (5.3%) |
| Total | 87 (100.0%) | 75 (100.0%) |
Housing Occupancy in South Prairie
Occupancy by Ownership in South Prairie
Of the total 138 dwellings in South Prairie, owner-occupied units account for 129 (93.5%), while renter-occupied units make up 9 (6.5%).
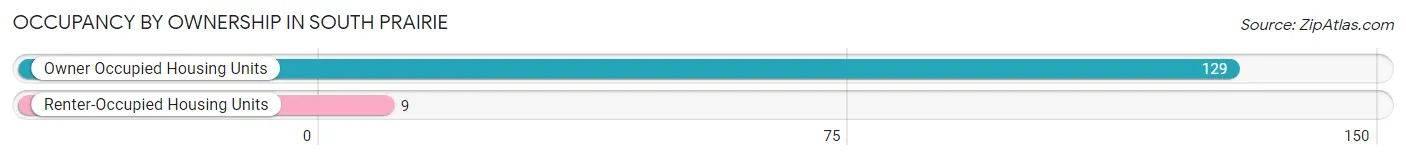
| Occupancy | # Housing Units | % Housing Units |
| Owner Occupied Housing Units | 129 | 93.5% |
| Renter-Occupied Housing Units | 9 | 6.5% |
| Total Occupied Housing Units | 138 | 100.0% |
Occupancy by Household Size in South Prairie
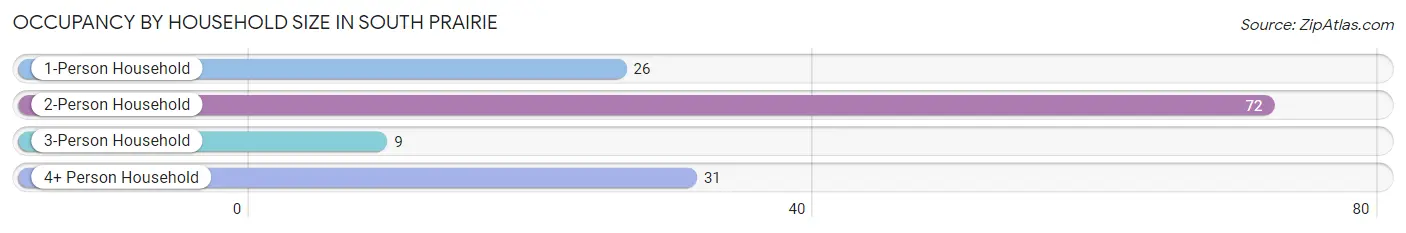
| Household Size | # Housing Units | % Housing Units |
| 1-Person Household | 26 | 18.8% |
| 2-Person Household | 72 | 52.2% |
| 3-Person Household | 9 | 6.5% |
| 4+ Person Household | 31 | 22.5% |
| Total Housing Units | 138 | 100.0% |
Occupancy by Ownership by Household Size in South Prairie
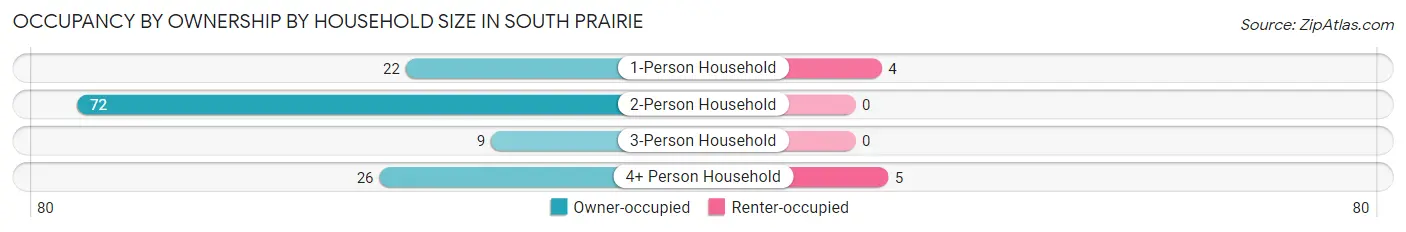
| Household Size | Owner-occupied | Renter-occupied |
| 1-Person Household | 22 (84.6%) | 4 (15.4%) |
| 2-Person Household | 72 (100.0%) | 0 (0.0%) |
| 3-Person Household | 9 (100.0%) | 0 (0.0%) |
| 4+ Person Household | 26 (83.9%) | 5 (16.1%) |
| Total Housing Units | 129 (93.5%) | 9 (6.5%) |
Occupancy by Educational Attainment in South Prairie
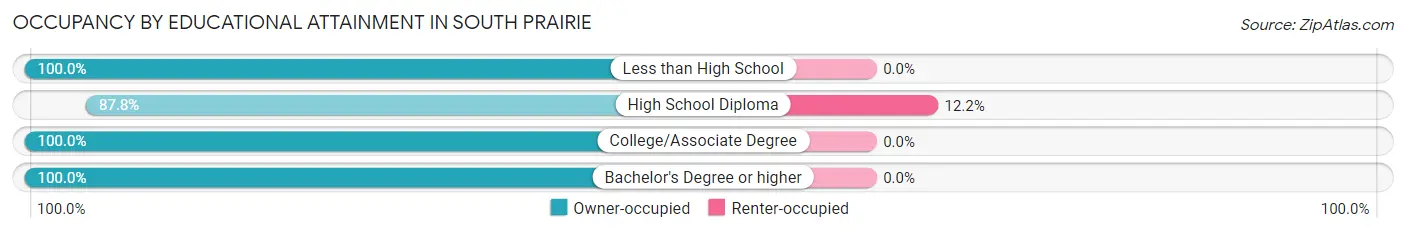
| Household Size | Owner-occupied | Renter-occupied |
| Less than High School | 3 (100.0%) | 0 (0.0%) |
| High School Diploma | 65 (87.8%) | 9 (12.2%) |
| College/Associate Degree | 47 (100.0%) | 0 (0.0%) |
| Bachelor's Degree or higher | 14 (100.0%) | 0 (0.0%) |
Occupancy by Age of Householder in South Prairie
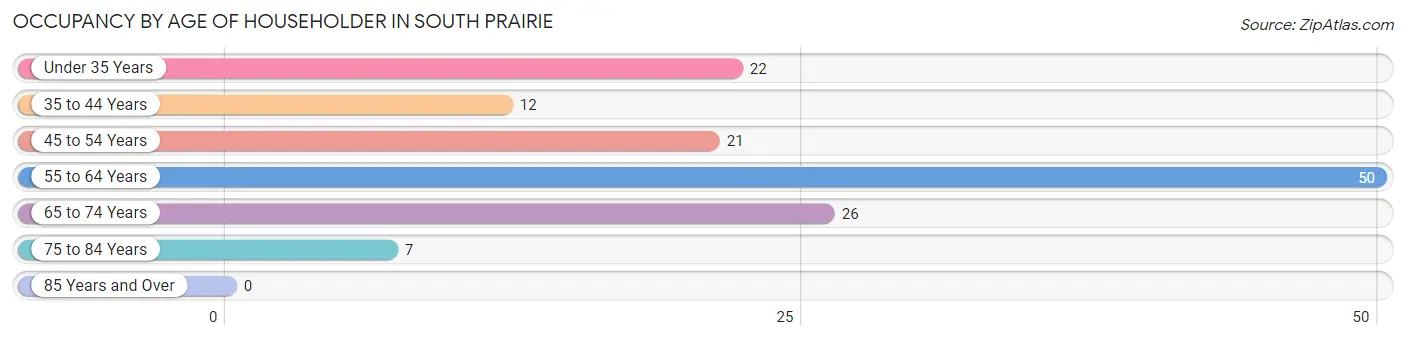
| Age Bracket | # Households | % Households |
| Under 35 Years | 22 | 15.9% |
| 35 to 44 Years | 12 | 8.7% |
| 45 to 54 Years | 21 | 15.2% |
| 55 to 64 Years | 50 | 36.2% |
| 65 to 74 Years | 26 | 18.8% |
| 75 to 84 Years | 7 | 5.1% |
| 85 Years and Over | 0 | 0.0% |
| Total | 138 | 100.0% |
Housing Finances in South Prairie
Median Income by Occupancy in South Prairie
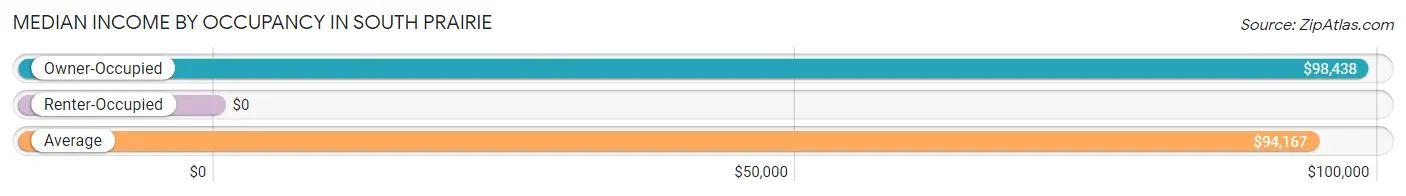
| Occupancy Type | # Households | Median Income |
| Owner-Occupied | 129 (93.5%) | $98,438 |
| Renter-Occupied | 9 (6.5%) | $0 |
| Average | 138 (100.0%) | $94,167 |
Occupancy by Householder Income Bracket in South Prairie
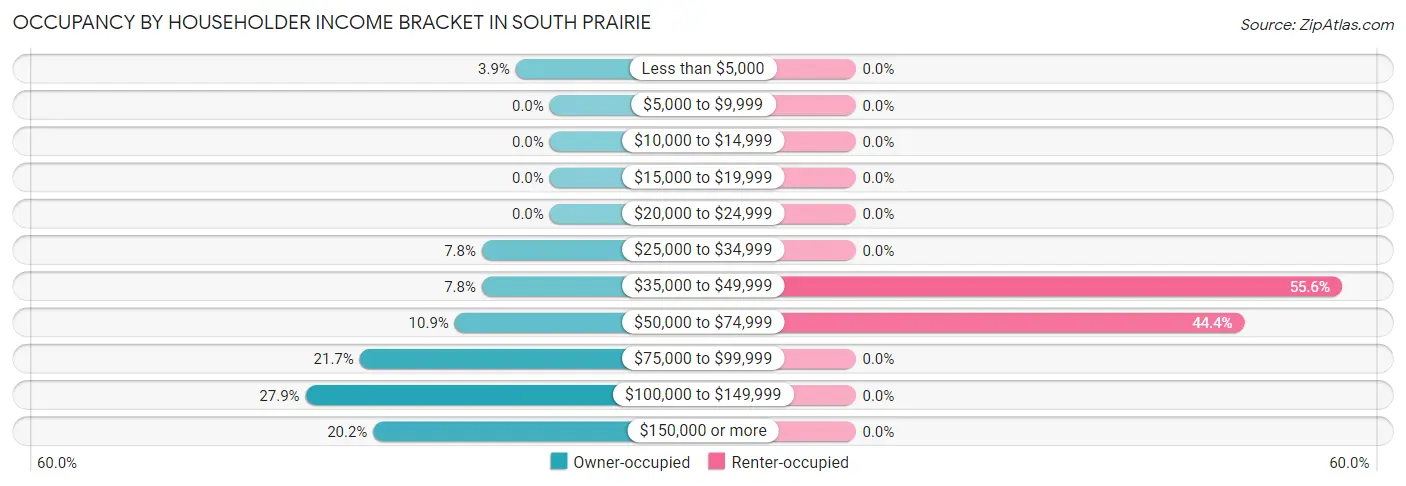
| Income Bracket | Owner-occupied | Renter-occupied |
| Less than $5,000 | 5 (3.9%) | 0 (0.0%) |
| $5,000 to $9,999 | 0 (0.0%) | 0 (0.0%) |
| $10,000 to $14,999 | 0 (0.0%) | 0 (0.0%) |
| $15,000 to $19,999 | 0 (0.0%) | 0 (0.0%) |
| $20,000 to $24,999 | 0 (0.0%) | 0 (0.0%) |
| $25,000 to $34,999 | 10 (7.7%) | 0 (0.0%) |
| $35,000 to $49,999 | 10 (7.7%) | 5 (55.6%) |
| $50,000 to $74,999 | 14 (10.8%) | 4 (44.4%) |
| $75,000 to $99,999 | 28 (21.7%) | 0 (0.0%) |
| $100,000 to $149,999 | 36 (27.9%) | 0 (0.0%) |
| $150,000 or more | 26 (20.2%) | 0 (0.0%) |
| Total | 129 (100.0%) | 9 (100.0%) |
Monthly Housing Cost Tiers in South Prairie
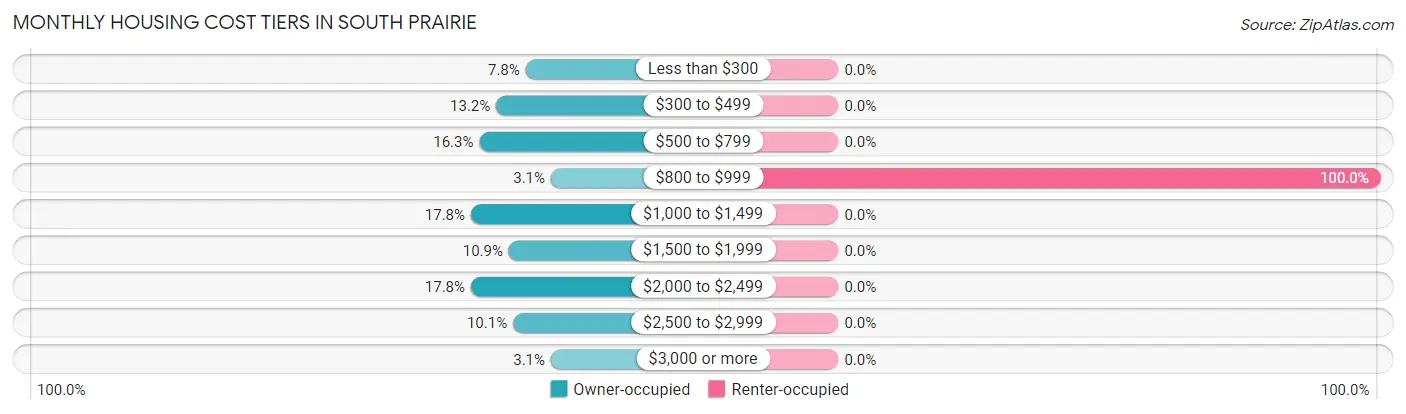
| Monthly Cost | Owner-occupied | Renter-occupied |
| Less than $300 | 10 (7.7%) | 0 (0.0%) |
| $300 to $499 | 17 (13.2%) | 0 (0.0%) |
| $500 to $799 | 21 (16.3%) | 0 (0.0%) |
| $800 to $999 | 4 (3.1%) | 9 (100.0%) |
| $1,000 to $1,499 | 23 (17.8%) | 0 (0.0%) |
| $1,500 to $1,999 | 14 (10.8%) | 0 (0.0%) |
| $2,000 to $2,499 | 23 (17.8%) | 0 (0.0%) |
| $2,500 to $2,999 | 13 (10.1%) | 0 (0.0%) |
| $3,000 or more | 4 (3.1%) | 0 (0.0%) |
| Total | 129 (100.0%) | 9 (100.0%) |
Physical Housing Characteristics in South Prairie
Housing Structures in South Prairie
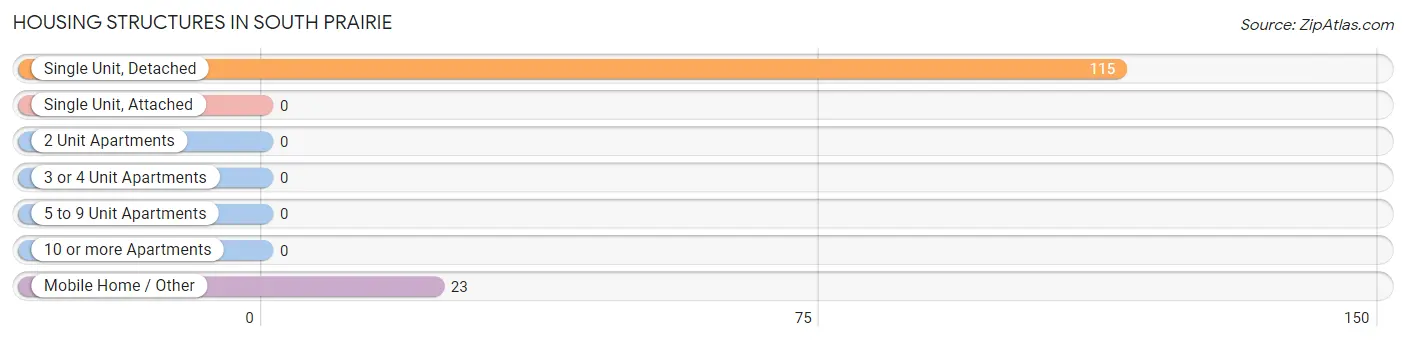
| Structure Type | # Housing Units | % Housing Units |
| Single Unit, Detached | 115 | 83.3% |
| Single Unit, Attached | 0 | 0.0% |
| 2 Unit Apartments | 0 | 0.0% |
| 3 or 4 Unit Apartments | 0 | 0.0% |
| 5 to 9 Unit Apartments | 0 | 0.0% |
| 10 or more Apartments | 0 | 0.0% |
| Mobile Home / Other | 23 | 16.7% |
| Total | 138 | 100.0% |
Housing Structures by Occupancy in South Prairie
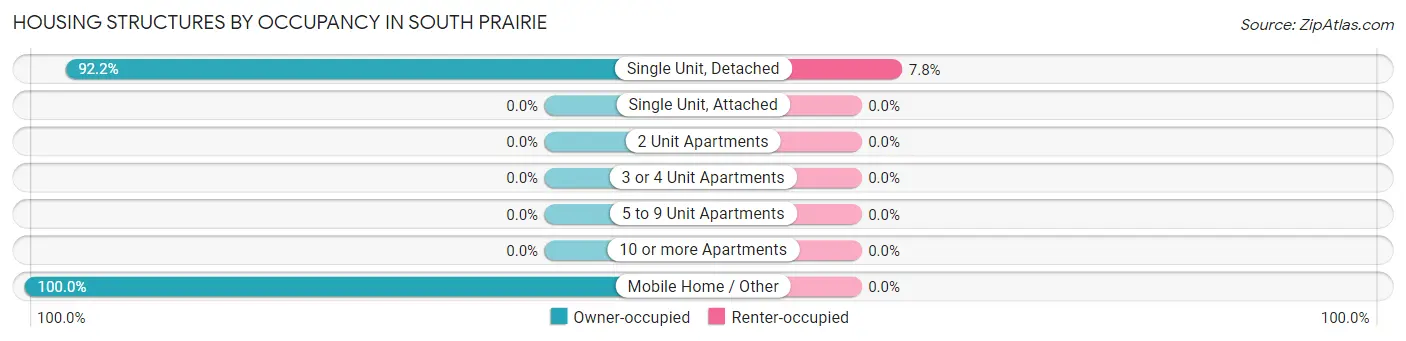
| Structure Type | Owner-occupied | Renter-occupied |
| Single Unit, Detached | 106 (92.2%) | 9 (7.8%) |
| Single Unit, Attached | 0 (0.0%) | 0 (0.0%) |
| 2 Unit Apartments | 0 (0.0%) | 0 (0.0%) |
| 3 or 4 Unit Apartments | 0 (0.0%) | 0 (0.0%) |
| 5 to 9 Unit Apartments | 0 (0.0%) | 0 (0.0%) |
| 10 or more Apartments | 0 (0.0%) | 0 (0.0%) |
| Mobile Home / Other | 23 (100.0%) | 0 (0.0%) |
| Total | 129 (93.5%) | 9 (6.5%) |
Housing Structures by Number of Rooms in South Prairie
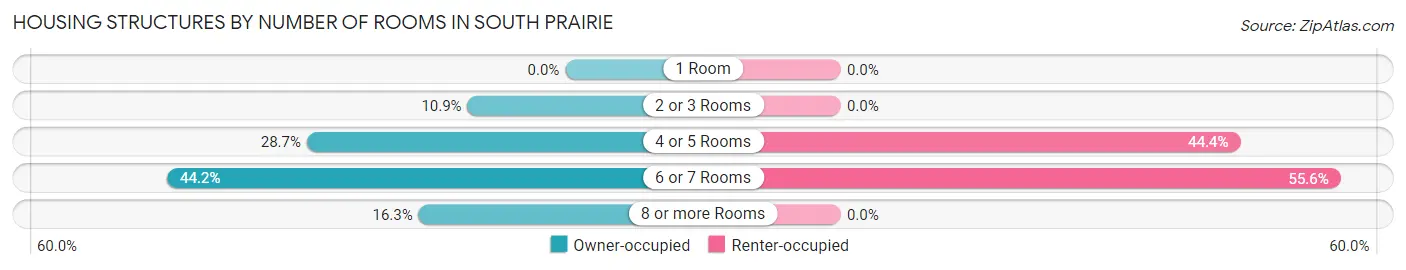
| Number of Rooms | Owner-occupied | Renter-occupied |
| 1 Room | 0 (0.0%) | 0 (0.0%) |
| 2 or 3 Rooms | 14 (10.8%) | 0 (0.0%) |
| 4 or 5 Rooms | 37 (28.7%) | 4 (44.4%) |
| 6 or 7 Rooms | 57 (44.2%) | 5 (55.6%) |
| 8 or more Rooms | 21 (16.3%) | 0 (0.0%) |
| Total | 129 (100.0%) | 9 (100.0%) |
Housing Structure by Heating Type in South Prairie
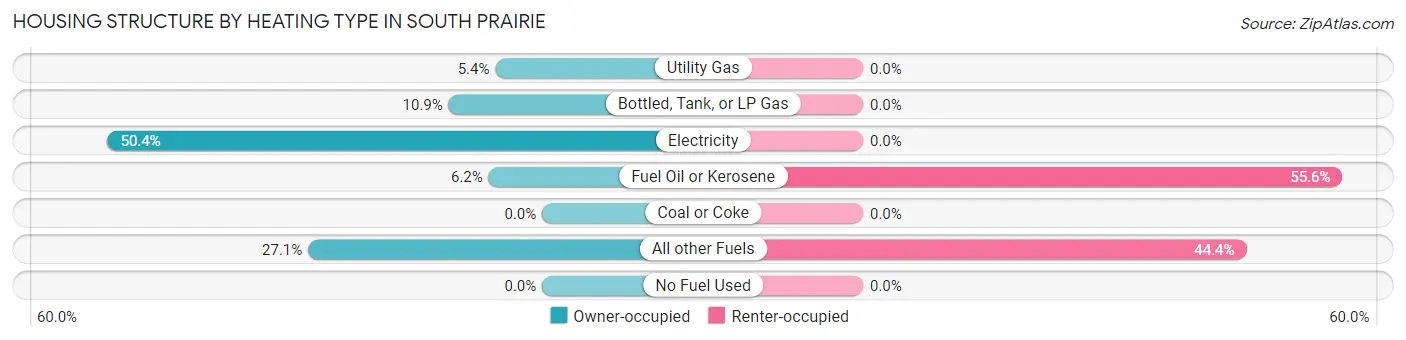
| Heating Type | Owner-occupied | Renter-occupied |
| Utility Gas | 7 (5.4%) | 0 (0.0%) |
| Bottled, Tank, or LP Gas | 14 (10.8%) | 0 (0.0%) |
| Electricity | 65 (50.4%) | 0 (0.0%) |
| Fuel Oil or Kerosene | 8 (6.2%) | 5 (55.6%) |
| Coal or Coke | 0 (0.0%) | 0 (0.0%) |
| All other Fuels | 35 (27.1%) | 4 (44.4%) |
| No Fuel Used | 0 (0.0%) | 0 (0.0%) |
| Total | 129 (100.0%) | 9 (100.0%) |
Household Vehicle Usage in South Prairie
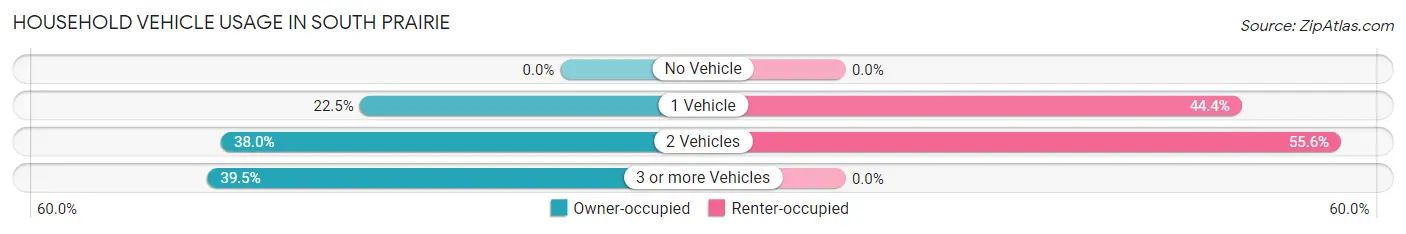
| Vehicles per Household | Owner-occupied | Renter-occupied |
| No Vehicle | 0 (0.0%) | 0 (0.0%) |
| 1 Vehicle | 29 (22.5%) | 4 (44.4%) |
| 2 Vehicles | 49 (38.0%) | 5 (55.6%) |
| 3 or more Vehicles | 51 (39.5%) | 0 (0.0%) |
| Total | 129 (100.0%) | 9 (100.0%) |
Real Estate & Mortgages in South Prairie
Real Estate and Mortgage Overview in South Prairie
| Characteristic | Without Mortgage | With Mortgage |
| Housing Units | 56 | 73 |
| Median Property Value | $175,000 | $364,600 |
| Median Household Income | $73,750 | $26 |
| Monthly Housing Costs | $590 | $4 |
| Real Estate Taxes | $2,763 | $0 |
Property Value by Mortgage Status in South Prairie
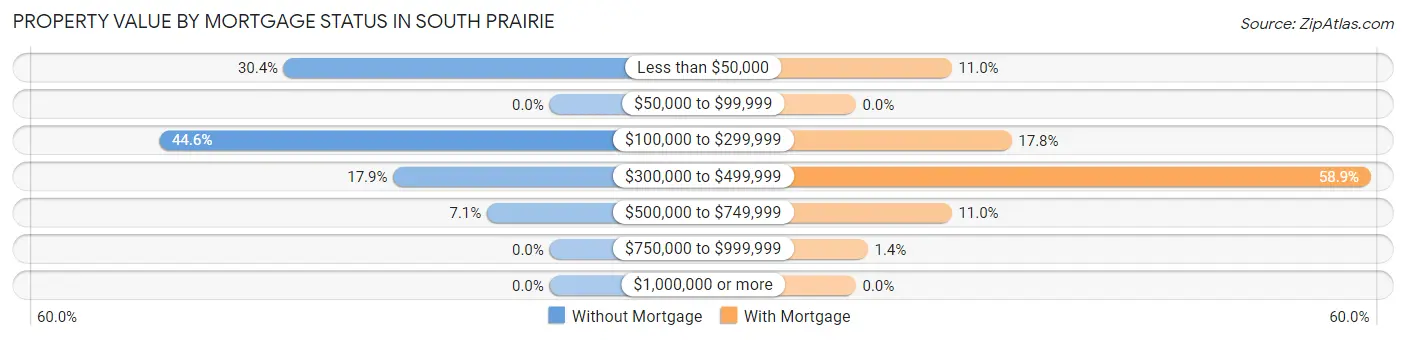
| Property Value | Without Mortgage | With Mortgage |
| Less than $50,000 | 17 (30.4%) | 8 (11.0%) |
| $50,000 to $99,999 | 0 (0.0%) | 0 (0.0%) |
| $100,000 to $299,999 | 25 (44.6%) | 13 (17.8%) |
| $300,000 to $499,999 | 10 (17.9%) | 43 (58.9%) |
| $500,000 to $749,999 | 4 (7.1%) | 8 (11.0%) |
| $750,000 to $999,999 | 0 (0.0%) | 1 (1.4%) |
| $1,000,000 or more | 0 (0.0%) | 0 (0.0%) |
| Total | 56 (100.0%) | 73 (100.0%) |
Household Income by Mortgage Status in South Prairie
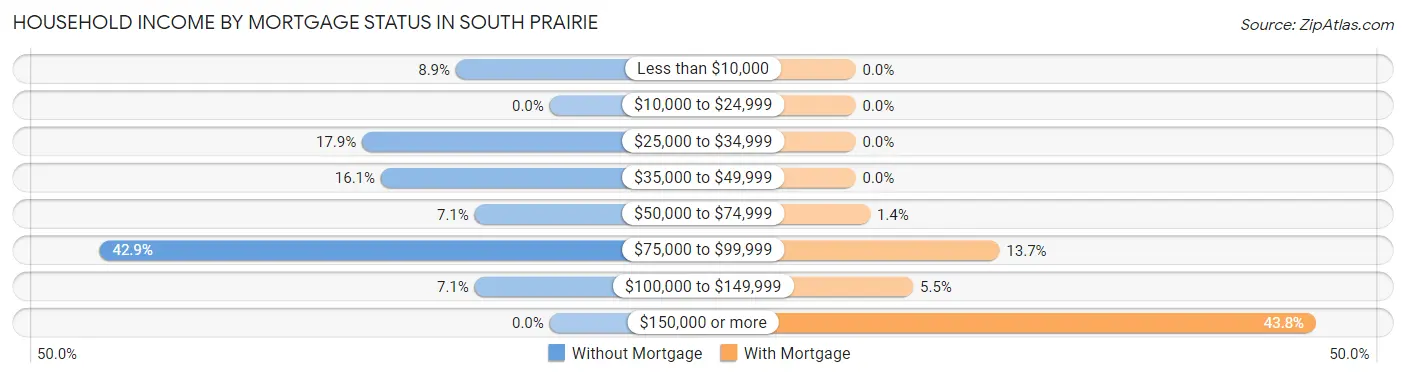
| Household Income | Without Mortgage | With Mortgage |
| Less than $10,000 | 5 (8.9%) | 0 (0.0%) |
| $10,000 to $24,999 | 0 (0.0%) | 0 (0.0%) |
| $25,000 to $34,999 | 10 (17.9%) | 0 (0.0%) |
| $35,000 to $49,999 | 9 (16.1%) | 0 (0.0%) |
| $50,000 to $74,999 | 4 (7.1%) | 1 (1.4%) |
| $75,000 to $99,999 | 24 (42.9%) | 10 (13.7%) |
| $100,000 to $149,999 | 4 (7.1%) | 4 (5.5%) |
| $150,000 or more | 0 (0.0%) | 32 (43.8%) |
| Total | 56 (100.0%) | 73 (100.0%) |
Property Value to Household Income Ratio in South Prairie
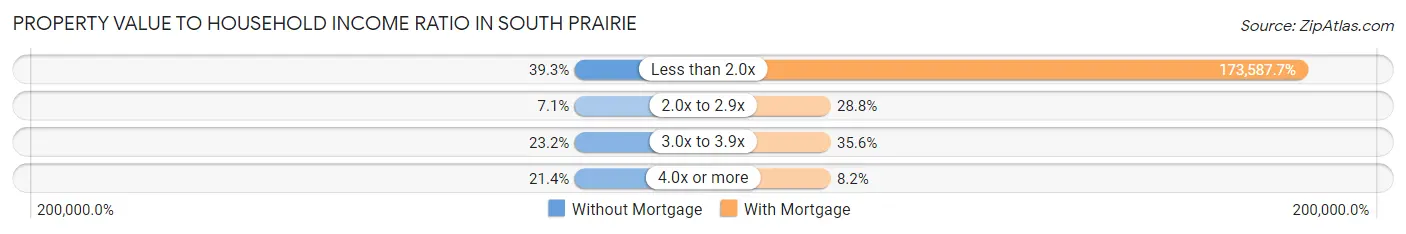
| Value-to-Income Ratio | Without Mortgage | With Mortgage |
| Less than 2.0x | 22 (39.3%) | 126,719 (173,587.7%) |
| 2.0x to 2.9x | 4 (7.1%) | 21 (28.8%) |
| 3.0x to 3.9x | 13 (23.2%) | 26 (35.6%) |
| 4.0x or more | 12 (21.4%) | 6 (8.2%) |
| Total | 56 (100.0%) | 73 (100.0%) |
Real Estate Taxes by Mortgage Status in South Prairie
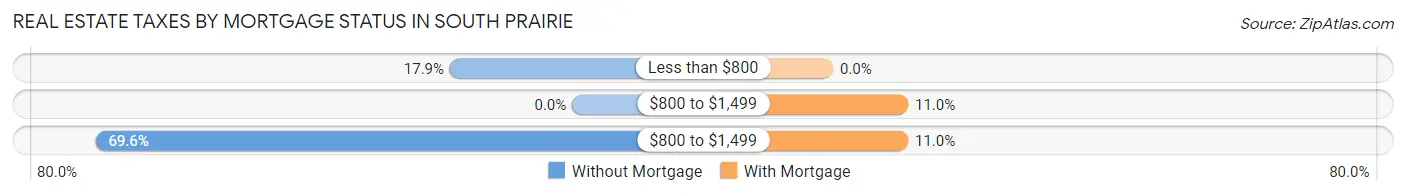
| Property Taxes | Without Mortgage | With Mortgage |
| Less than $800 | 10 (17.9%) | 0 (0.0%) |
| $800 to $1,499 | 0 (0.0%) | 8 (11.0%) |
| $800 to $1,499 | 39 (69.6%) | 8 (11.0%) |
| Total | 56 (100.0%) | 73 (100.0%) |
Health & Disability in South Prairie
Health Insurance Coverage by Age in South Prairie
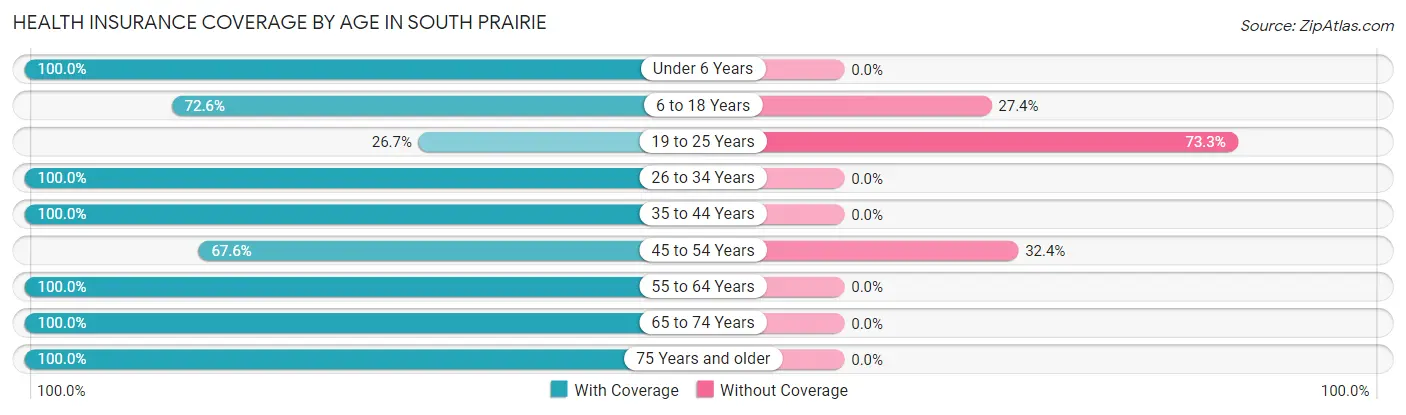
| Age Bracket | With Coverage | Without Coverage |
| Under 6 Years | 25 (100.0%) | 0 (0.0%) |
| 6 to 18 Years | 45 (72.6%) | 17 (27.4%) |
| 19 to 25 Years | 4 (26.7%) | 11 (73.3%) |
| 26 to 34 Years | 46 (100.0%) | 0 (0.0%) |
| 35 to 44 Years | 21 (100.0%) | 0 (0.0%) |
| 45 to 54 Years | 25 (67.6%) | 12 (32.4%) |
| 55 to 64 Years | 93 (100.0%) | 0 (0.0%) |
| 65 to 74 Years | 37 (100.0%) | 0 (0.0%) |
| 75 Years and older | 17 (100.0%) | 0 (0.0%) |
| Total | 313 (88.7%) | 40 (11.3%) |
Health Insurance Coverage by Citizenship Status in South Prairie
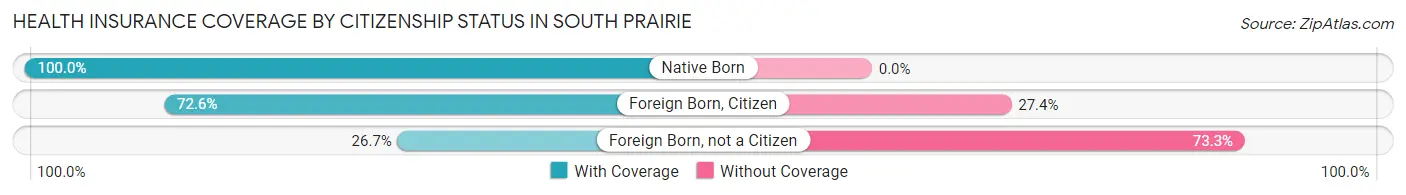
| Citizenship Status | With Coverage | Without Coverage |
| Native Born | 25 (100.0%) | 0 (0.0%) |
| Foreign Born, Citizen | 45 (72.6%) | 17 (27.4%) |
| Foreign Born, not a Citizen | 4 (26.7%) | 11 (73.3%) |
Health Insurance Coverage by Household Income in South Prairie
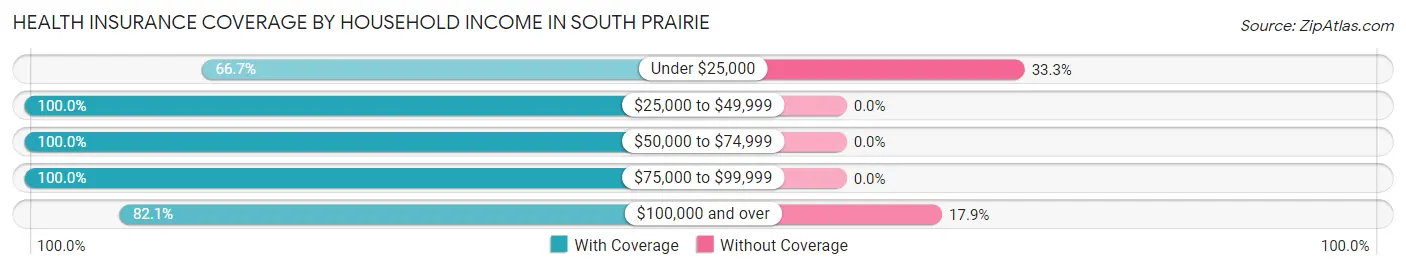
| Household Income | With Coverage | Without Coverage |
| Under $25,000 | 6 (66.7%) | 3 (33.3%) |
| $25,000 to $49,999 | 62 (100.0%) | 0 (0.0%) |
| $50,000 to $74,999 | 26 (100.0%) | 0 (0.0%) |
| $75,000 to $99,999 | 49 (100.0%) | 0 (0.0%) |
| $100,000 and over | 170 (82.1%) | 37 (17.9%) |
Public vs Private Health Insurance Coverage by Age in South Prairie
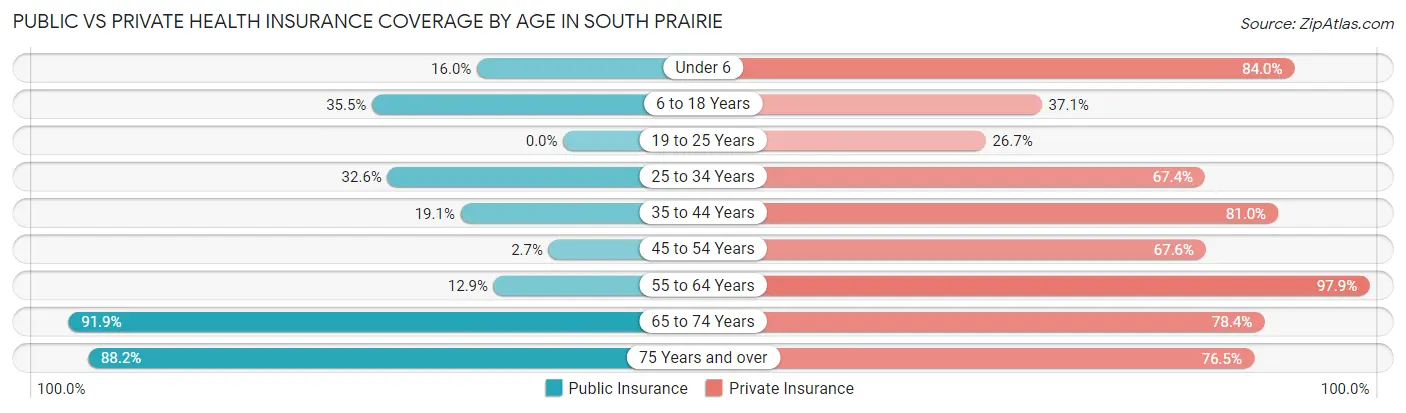
| Age Bracket | Public Insurance | Private Insurance |
| Under 6 | 4 (16.0%) | 21 (84.0%) |
| 6 to 18 Years | 22 (35.5%) | 23 (37.1%) |
| 19 to 25 Years | 0 (0.0%) | 4 (26.7%) |
| 25 to 34 Years | 15 (32.6%) | 31 (67.4%) |
| 35 to 44 Years | 4 (19.1%) | 17 (80.9%) |
| 45 to 54 Years | 1 (2.7%) | 25 (67.6%) |
| 55 to 64 Years | 12 (12.9%) | 91 (97.9%) |
| 65 to 74 Years | 34 (91.9%) | 29 (78.4%) |
| 75 Years and over | 15 (88.2%) | 13 (76.5%) |
| Total | 107 (30.3%) | 254 (72.0%) |
Disability Status by Sex by Age in South Prairie
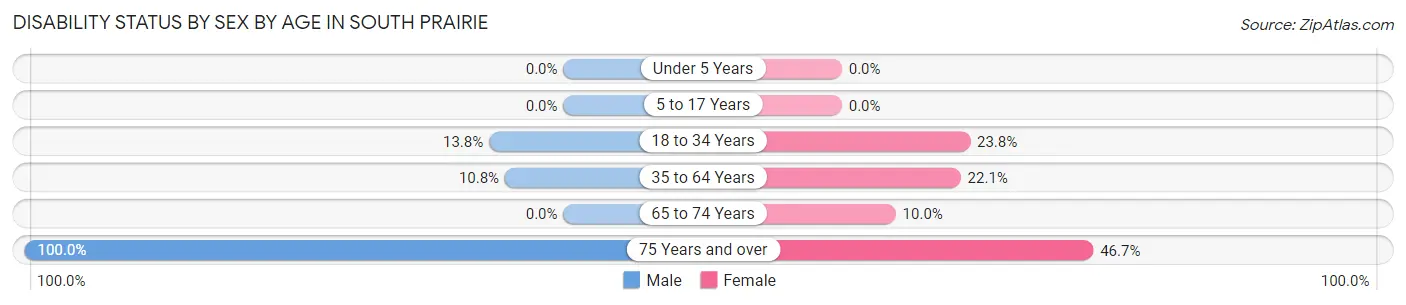
| Age Bracket | Male | Female |
| Under 5 Years | 0 (0.0%) | 0 (0.0%) |
| 5 to 17 Years | 0 (0.0%) | 0 (0.0%) |
| 18 to 34 Years | 4 (13.8%) | 10 (23.8%) |
| 35 to 64 Years | 9 (10.8%) | 15 (22.1%) |
| 65 to 74 Years | 0 (0.0%) | 1 (10.0%) |
| 75 Years and over | 2 (100.0%) | 7 (46.7%) |
Disability Class by Sex by Age in South Prairie
Disability Class: Hearing Difficulty
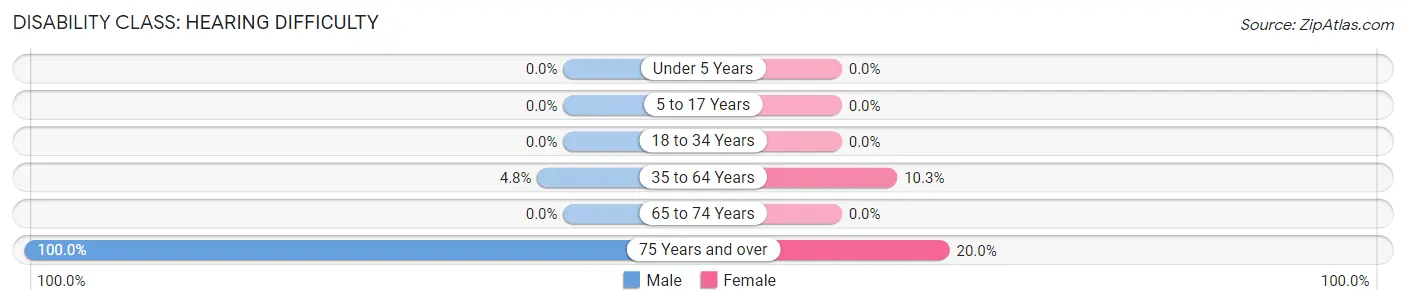
| Age Bracket | Male | Female |
| Under 5 Years | 0 (0.0%) | 0 (0.0%) |
| 5 to 17 Years | 0 (0.0%) | 0 (0.0%) |
| 18 to 34 Years | 0 (0.0%) | 0 (0.0%) |
| 35 to 64 Years | 4 (4.8%) | 7 (10.3%) |
| 65 to 74 Years | 0 (0.0%) | 0 (0.0%) |
| 75 Years and over | 2 (100.0%) | 3 (20.0%) |
Disability Class: Vision Difficulty
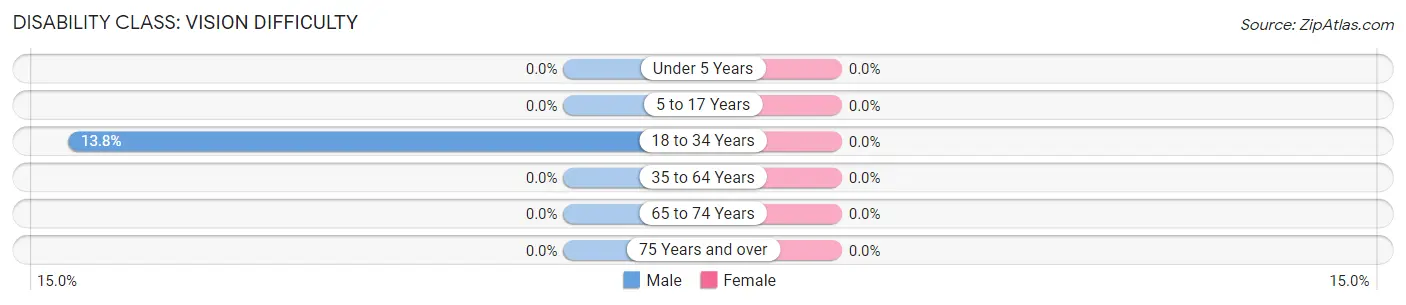
| Age Bracket | Male | Female |
| Under 5 Years | 0 (0.0%) | 0 (0.0%) |
| 5 to 17 Years | 0 (0.0%) | 0 (0.0%) |
| 18 to 34 Years | 4 (13.8%) | 0 (0.0%) |
| 35 to 64 Years | 0 (0.0%) | 0 (0.0%) |
| 65 to 74 Years | 0 (0.0%) | 0 (0.0%) |
| 75 Years and over | 0 (0.0%) | 0 (0.0%) |
Disability Class: Cognitive Difficulty
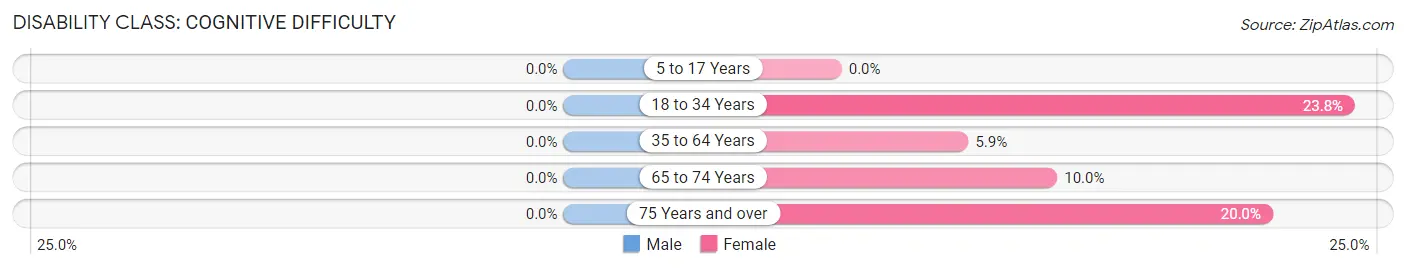
| Age Bracket | Male | Female |
| 5 to 17 Years | 0 (0.0%) | 0 (0.0%) |
| 18 to 34 Years | 0 (0.0%) | 10 (23.8%) |
| 35 to 64 Years | 0 (0.0%) | 4 (5.9%) |
| 65 to 74 Years | 0 (0.0%) | 1 (10.0%) |
| 75 Years and over | 0 (0.0%) | 3 (20.0%) |
Disability Class: Ambulatory Difficulty
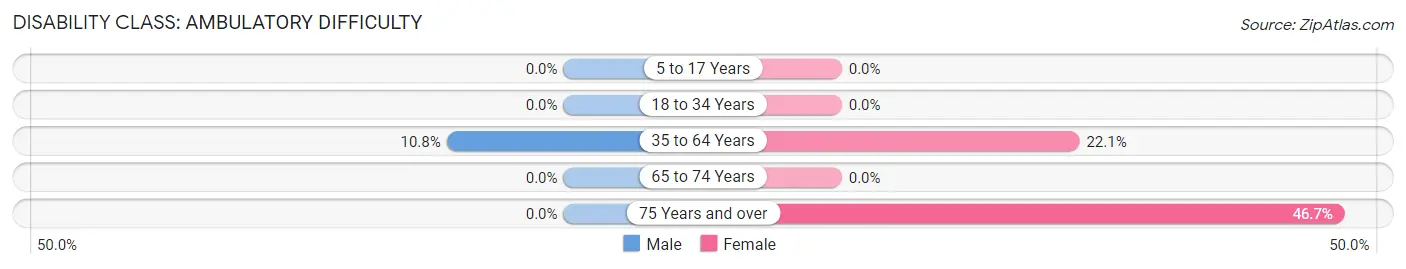
| Age Bracket | Male | Female |
| 5 to 17 Years | 0 (0.0%) | 0 (0.0%) |
| 18 to 34 Years | 0 (0.0%) | 0 (0.0%) |
| 35 to 64 Years | 9 (10.8%) | 15 (22.1%) |
| 65 to 74 Years | 0 (0.0%) | 0 (0.0%) |
| 75 Years and over | 0 (0.0%) | 7 (46.7%) |
Disability Class: Self-Care Difficulty
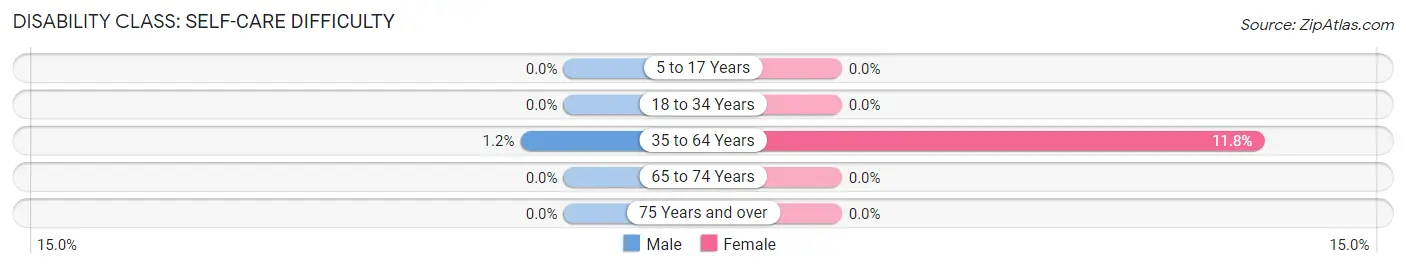
| Age Bracket | Male | Female |
| 5 to 17 Years | 0 (0.0%) | 0 (0.0%) |
| 18 to 34 Years | 0 (0.0%) | 0 (0.0%) |
| 35 to 64 Years | 1 (1.2%) | 8 (11.8%) |
| 65 to 74 Years | 0 (0.0%) | 0 (0.0%) |
| 75 Years and over | 0 (0.0%) | 0 (0.0%) |
Technology Access in South Prairie
Computing Device Access in South Prairie
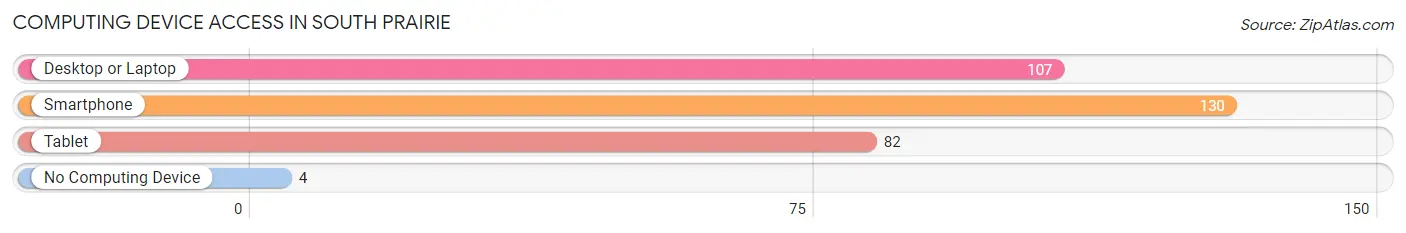
| Device Type | # Households | % Households |
| Desktop or Laptop | 107 | 77.5% |
| Smartphone | 130 | 94.2% |
| Tablet | 82 | 59.4% |
| No Computing Device | 4 | 2.9% |
| Total | 138 | 100.0% |
Internet Access in South Prairie
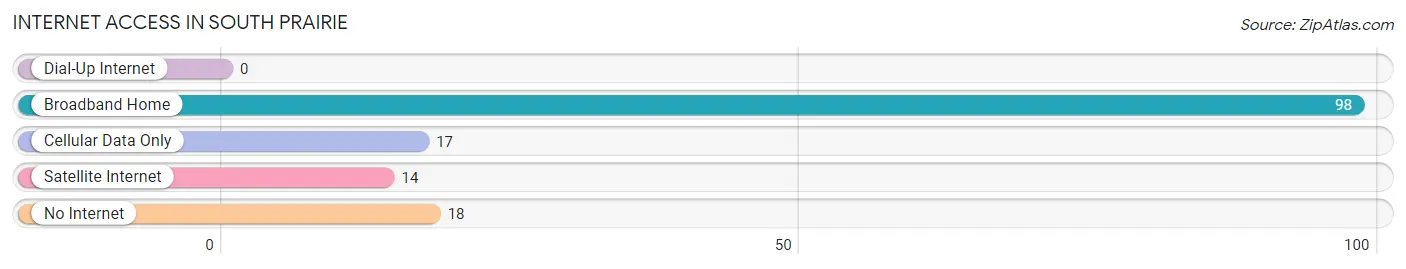
| Internet Type | # Households | % Households |
| Dial-Up Internet | 0 | 0.0% |
| Broadband Home | 98 | 71.0% |
| Cellular Data Only | 17 | 12.3% |
| Satellite Internet | 14 | 10.1% |
| No Internet | 18 | 13.0% |
| Total | 138 | 100.0% |
South Prairie Summary
History
South Prairie is a small unincorporated community located in Pierce County, Washington. It is situated in the foothills of the Cascade Mountains, approximately 25 miles east of Tacoma. The area was first settled in the late 1800s by homesteaders who were drawn to the area by its abundant natural resources. The town was officially established in 1891 and was named after the nearby South Prairie Creek.
The early settlers of South Prairie were primarily farmers and loggers. The area was known for its rich soil and abundant timber, which made it an ideal place for farming and logging. The town also had a thriving dairy industry, with several local dairies producing milk, butter, and cheese.
In the early 1900s, the town began to grow and develop. The first school was built in 1906, and the first post office opened in 1907. The town also had a general store, a blacksmith shop, and a hotel.
In the 1920s, the town began to decline as the timber industry moved away and the dairy industry declined. The Great Depression further exacerbated the town’s economic woes, and by the 1940s, the population had dwindled to just a few hundred people.
In the 1950s, the town began to experience a resurgence. The timber industry returned, and the town’s population began to grow again. The town also began to attract new businesses, including a sawmill, a lumber mill, and a feed store.
Today, South Prairie is a small, rural community with a population of just over 1,000 people. The town is still primarily agricultural, with many of the local farms producing hay, wheat, and other crops. The town also has a few small businesses, including a gas station, a grocery store, and a few restaurants.
Geography
South Prairie is located in the foothills of the Cascade Mountains in Pierce County, Washington. The town is situated at an elevation of 1,000 feet and is surrounded by rolling hills and lush forests. The nearby South Prairie Creek runs through the town and is a popular spot for fishing and swimming.
The town is located approximately 25 miles east of Tacoma and is accessible via State Route 162. The nearest major cities are Seattle, which is about 50 miles to the north, and Spokane, which is about 150 miles to the east.
Economy
South Prairie’s economy is primarily agricultural. The town is home to several local farms, which produce hay, wheat, and other crops. The town also has a few small businesses, including a gas station, a grocery store, and a few restaurants.
The town is also home to a sawmill and a lumber mill, which provide jobs for many of the town’s residents. The town also has a few small manufacturing businesses, which produce items such as furniture and clothing.
Demographics
As of the 2010 census, South Prairie had a population of 1,072 people. The town is predominantly white, with 94.3% of the population identifying as such. The town also has a small Hispanic population, with 4.2% of the population identifying as Hispanic or Latino.
The median household income in South Prairie is $50,000, and the median home value is $170,000. The town has a low unemployment rate of 4.2%, and the poverty rate is 8.2%.
Common Questions
What is Per Capita Income in South Prairie?
Per Capita income in South Prairie is $42,016.
What is the Median Family Income in South Prairie?
Median Family Income in South Prairie is $101,563.
What is the Median Household income in South Prairie?
Median Household Income in South Prairie is $94,167.
What is Income or Wage Gap in South Prairie?
Income or Wage Gap in South Prairie is 47.8%.
Women in South Prairie earn 52.2 cents for every dollar earned by a man.
What is Inequality or Gini Index in South Prairie?
Inequality or Gini Index in South Prairie is 0.34.
What is the Total Population of South Prairie?
Total Population of South Prairie is 353.
What is the Total Male Population of South Prairie?
Total Male Population of South Prairie is 203.
What is the Total Female Population of South Prairie?
Total Female Population of South Prairie is 150.
What is the Ratio of Males per 100 Females in South Prairie?
There are 135.33 Males per 100 Females in South Prairie.
What is the Ratio of Females per 100 Males in South Prairie?
There are 73.89 Females per 100 Males in South Prairie.
What is the Median Population Age in South Prairie?
Median Population Age in South Prairie is 50.1 Years.
What is the Average Family Size in South Prairie
Average Family Size in South Prairie is 2.9 People.
What is the Average Household Size in South Prairie
Average Household Size in South Prairie is 2.6 People.
How Large is the Labor Force in South Prairie?
There are 181 People in the Labor Forcein in South Prairie.
What is the Percentage of People in the Labor Force in South Prairie?
63.5% of People are in the Labor Force in South Prairie.
What is the Unemployment Rate in South Prairie?
Unemployment Rate in South Prairie is 4.4%.