Kendall, WA Map & Demographics
Kendall Map
Kendall Overview
$19,556
PER CAPITA INCOME
$61,897
AVG FAMILY INCOME
$90,045
AVG HOUSEHOLD INCOME
0.33
INEQUALITY / GINI INDEX
959
TOTAL POPULATION
396
MALE POPULATION
563
FEMALE POPULATION
70.34
MALES / 100 FEMALES
142.17
FEMALES / 100 MALES
39.2
MEDIAN AGE
3.7
AVG FAMILY SIZE
3.4
AVG HOUSEHOLD SIZE
502
LABOR FORCE [ PEOPLE ]
62.2%
PERCENT IN LABOR FORCE
21.3%
UNEMPLOYMENT RATE
Income in Kendall
Income Overview in Kendall
Per Capita Income in Kendall is $19,556, while median incomes of families and households are $61,897 and $90,045 respectively.
| Characteristic | Number | Measure |
| Per Capita Income | 959 | $19,556 |
| Median Family Income | 203 | $61,897 |
| Mean Family Income | 203 | $73,743 |
| Median Household Income | 286 | $90,045 |
| Mean Household Income | 286 | $64,764 |
| Income Deficit | 203 | $0 |
| Wage / Income Gap (%) | 959 | 0.00% |
| Wage / Income Gap ($) | 959 | 100.00¢ per $1 |
| Gini / Inequality Index | 959 | 0.33 |
Earnings by Sex in Kendall
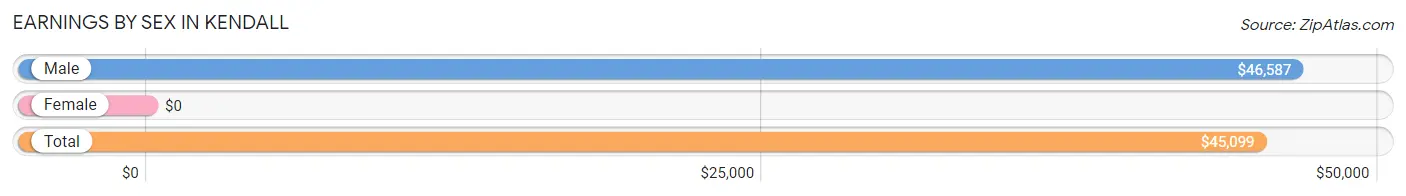
| Sex | Number | Average Earnings |
| Male | 286 (58.5%) | $46,587 |
| Female | 203 (41.5%) | $0 |
| Total | 489 (100.0%) | $45,099 |
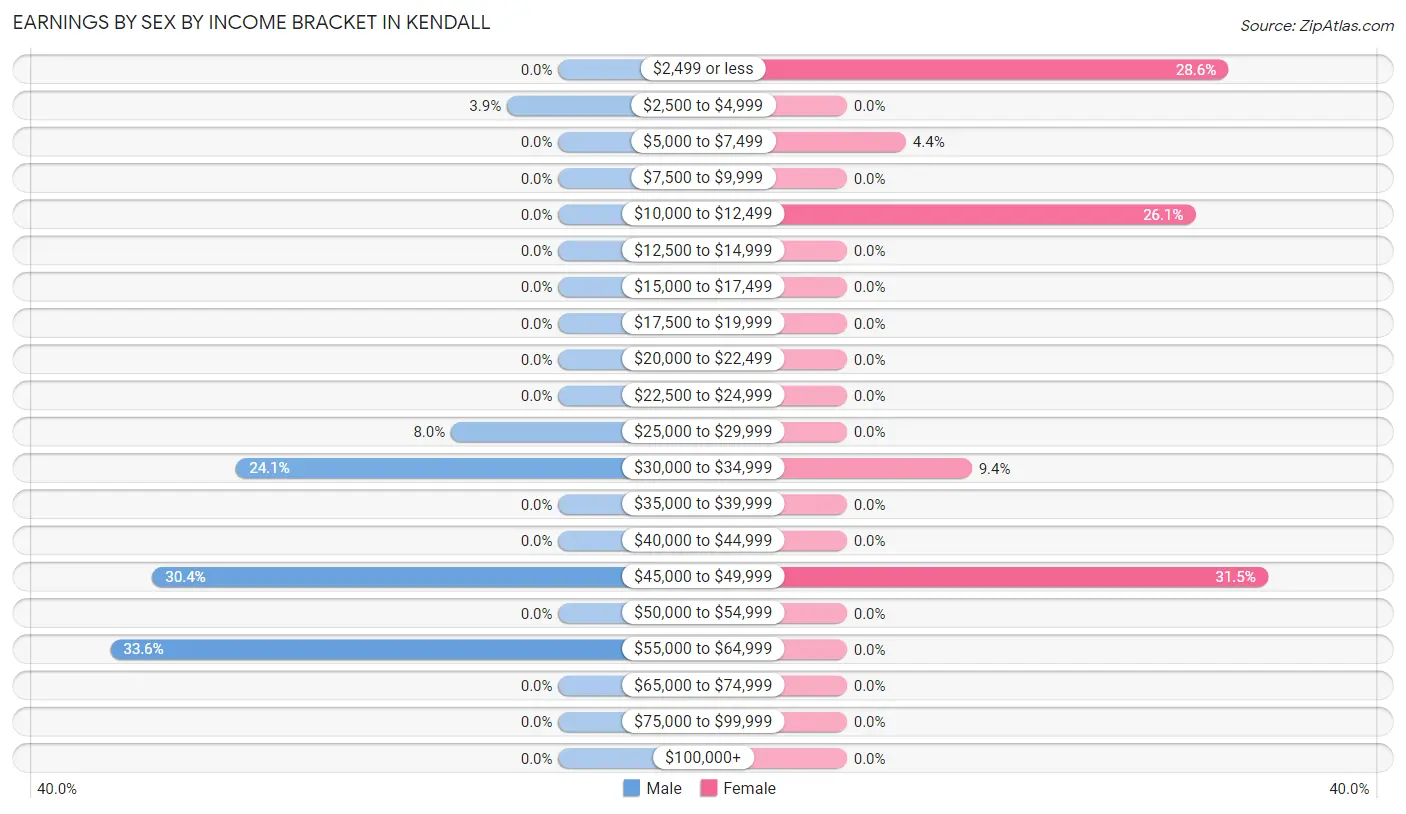
Earnings by Sex by Income Bracket in Kendall
The most common earnings brackets in Kendall are $55,000 to $64,999 for men (96 | 33.6%) and $45,000 to $49,999 for women (64 | 31.5%).
| Income | Male | Female |
| $2,499 or less | 0 (0.0%) | 58 (28.6%) |
| $2,500 to $4,999 | 11 (3.8%) | 0 (0.0%) |
| $5,000 to $7,499 | 0 (0.0%) | 9 (4.4%) |
| $7,500 to $9,999 | 0 (0.0%) | 0 (0.0%) |
| $10,000 to $12,499 | 0 (0.0%) | 53 (26.1%) |
| $12,500 to $14,999 | 0 (0.0%) | 0 (0.0%) |
| $15,000 to $17,499 | 0 (0.0%) | 0 (0.0%) |
| $17,500 to $19,999 | 0 (0.0%) | 0 (0.0%) |
| $20,000 to $22,499 | 0 (0.0%) | 0 (0.0%) |
| $22,500 to $24,999 | 0 (0.0%) | 0 (0.0%) |
| $25,000 to $29,999 | 23 (8.0%) | 0 (0.0%) |
| $30,000 to $34,999 | 69 (24.1%) | 19 (9.4%) |
| $35,000 to $39,999 | 0 (0.0%) | 0 (0.0%) |
| $40,000 to $44,999 | 0 (0.0%) | 0 (0.0%) |
| $45,000 to $49,999 | 87 (30.4%) | 64 (31.5%) |
| $50,000 to $54,999 | 0 (0.0%) | 0 (0.0%) |
| $55,000 to $64,999 | 96 (33.6%) | 0 (0.0%) |
| $65,000 to $74,999 | 0 (0.0%) | 0 (0.0%) |
| $75,000 to $99,999 | 0 (0.0%) | 0 (0.0%) |
| $100,000+ | 0 (0.0%) | 0 (0.0%) |
| Total | 286 (100.0%) | 203 (100.0%) |
Earnings by Sex by Educational Attainment in Kendall
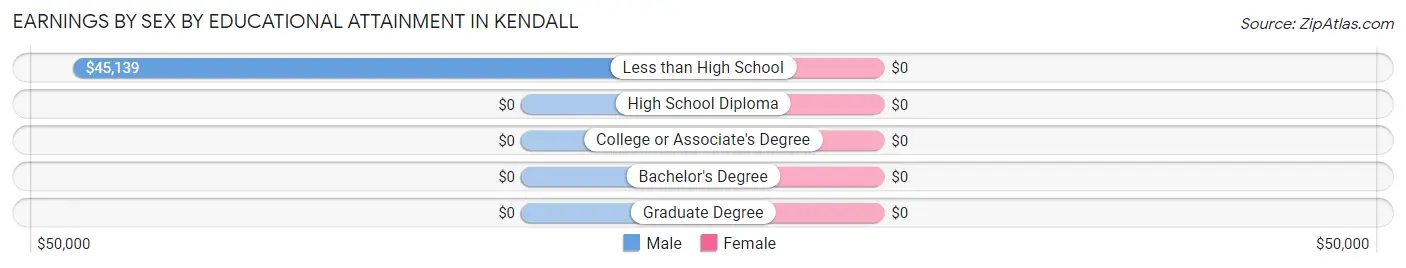
| Educational Attainment | Male Income | Female Income |
| Less than High School | $45,139 | $0 |
| High School Diploma | - | - |
| College or Associate's Degree | - | - |
| Bachelor's Degree | - | - |
| Graduate Degree | - | - |
| Total | $47,044 | $0 |
Family Income in Kendall
Family Income Brackets in Kendall
According to the Kendall family income data, there are 79 families falling into the $50,000 to $74,999 income range, which is the most common income bracket and makes up 38.9% of all families.
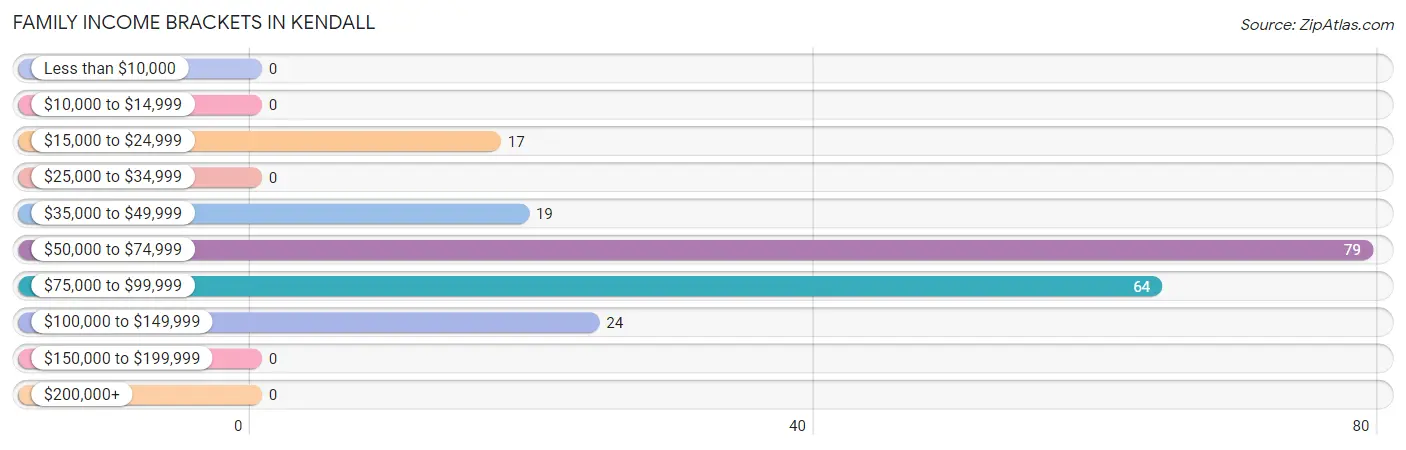
| Income Bracket | # Families | % Families |
| Less than $10,000 | 0 | 0.0% |
| $10,000 to $14,999 | 0 | 0.0% |
| $15,000 to $24,999 | 17 | 8.4% |
| $25,000 to $34,999 | 0 | 0.0% |
| $35,000 to $49,999 | 19 | 9.4% |
| $50,000 to $74,999 | 79 | 38.9% |
| $75,000 to $99,999 | 64 | 31.5% |
| $100,000 to $149,999 | 24 | 11.8% |
| $150,000 to $199,999 | 0 | 0.0% |
| $200,000+ | 0 | 0.0% |
Family Income by Famaliy Size in Kendall
| Income Bracket | # Families | Median Income |
| 2-Person Families | 17 (8.4%) | $0 |
| 3-Person Families | 87 (42.9%) | $0 |
| 4-Person Families | 43 (21.2%) | $0 |
| 5-Person Families | 56 (27.6%) | $0 |
| 6-Person Families | 0 (0.0%) | $0 |
| 7+ Person Families | 0 (0.0%) | $0 |
| Total | 203 (100.0%) | $61,897 |
Family Income by Number of Earners in Kendall
| Number of Earners | # Families | Median Income |
| No Earners | 17 (8.4%) | $0 |
| 1 Earner | 42 (20.7%) | $0 |
| 2 Earners | 120 (59.1%) | $0 |
| 3+ Earners | 24 (11.8%) | $0 |
| Total | 203 (100.0%) | $61,897 |
Household Income in Kendall
Household Income Brackets in Kendall
With 120 households falling in the category, the $75,000 to $99,999 income range is the most frequent in Kendall, accounting for 42.0% of all households.
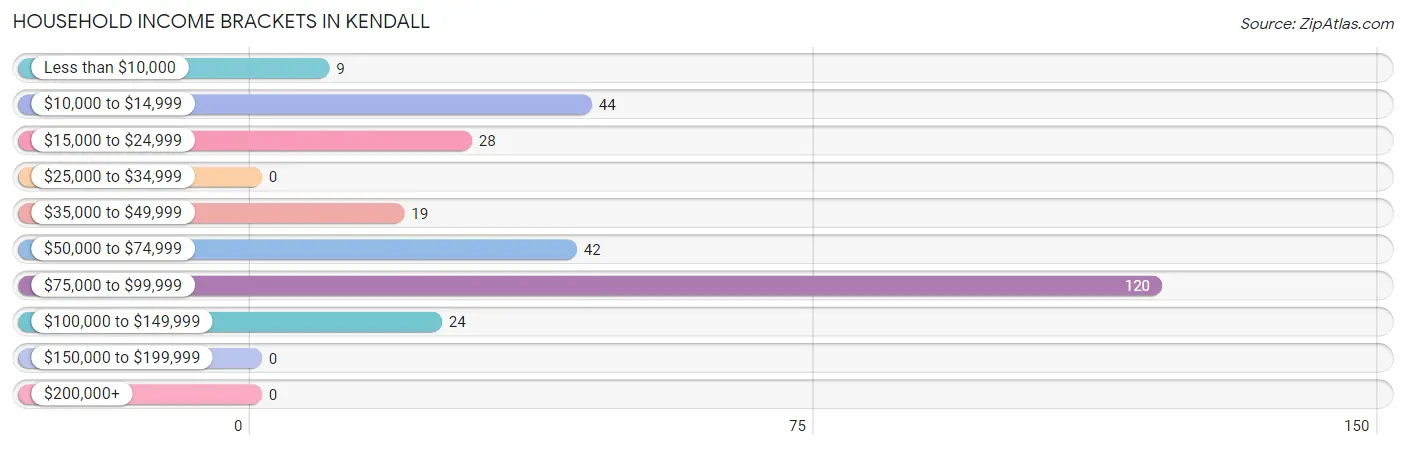
| Income Bracket | # Households | % Households |
| Less than $10,000 | 9 | 3.1% |
| $10,000 to $14,999 | 44 | 15.4% |
| $15,000 to $24,999 | 28 | 9.8% |
| $25,000 to $34,999 | 0 | 0.0% |
| $35,000 to $49,999 | 19 | 6.6% |
| $50,000 to $74,999 | 42 | 14.7% |
| $75,000 to $99,999 | 120 | 42.0% |
| $100,000 to $149,999 | 24 | 8.4% |
| $150,000 to $199,999 | 0 | 0.0% |
| $200,000+ | 0 | 0.0% |
Household Income by Householder Age in Kendall
The median household income in Kendall is $90,045, with the highest median household income of $91,228 found in the 45 to 64 years age bracket for the primary householder. A total of 233 households (81.5%) fall into this category.
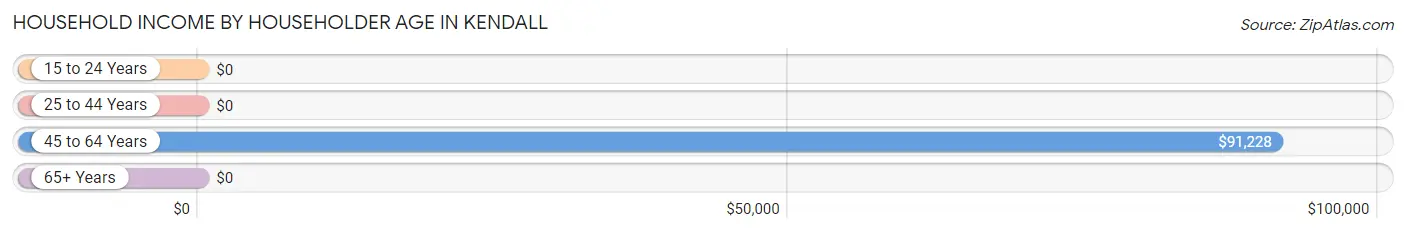
| Income Bracket | # Households | Median Income |
| 15 to 24 Years | 0 (0.0%) | $0 |
| 25 to 44 Years | 23 (8.0%) | $0 |
| 45 to 64 Years | 233 (81.5%) | $91,228 |
| 65+ Years | 30 (10.5%) | $0 |
| Total | 286 (100.0%) | $90,045 |
Poverty in Kendall
Income Below Poverty by Sex and Age in Kendall
With 18.2% poverty level for males and 11.7% for females among the residents of Kendall, 55 to 64 year old males and 55 to 64 year old females are the most vulnerable to poverty, with 55 males (41.3%) and 48 females (100.0%) in their respective age groups living below the poverty level.
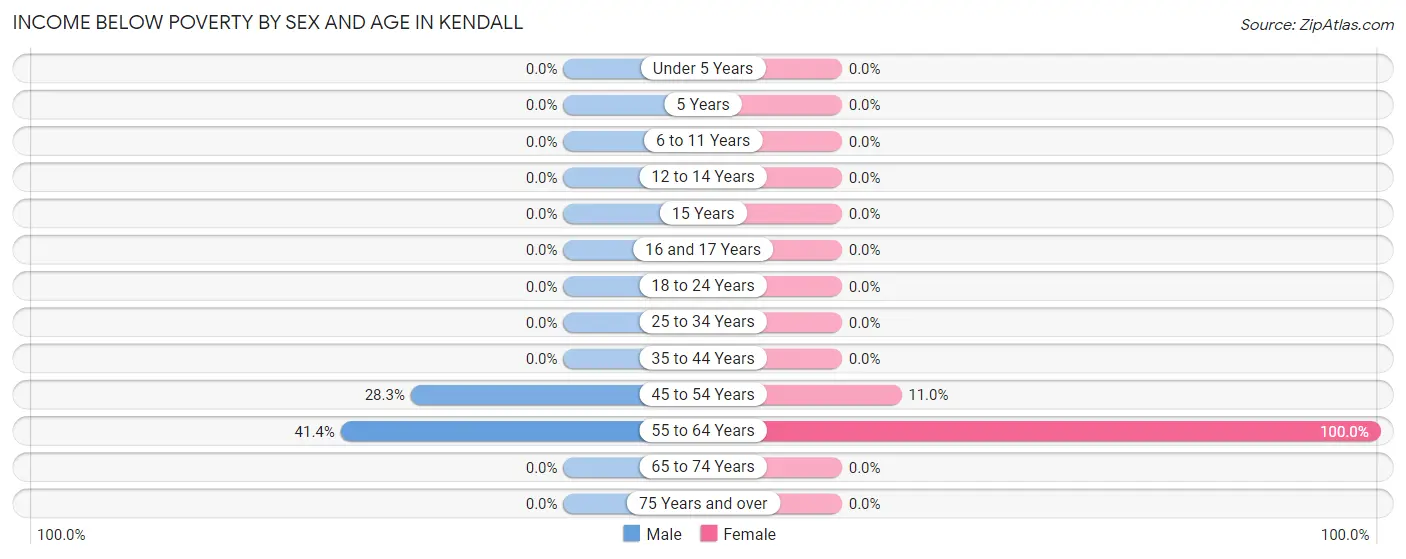
| Age Bracket | Male | Female |
| Under 5 Years | 0 (0.0%) | 0 (0.0%) |
| 5 Years | 0 (0.0%) | 0 (0.0%) |
| 6 to 11 Years | 0 (0.0%) | 0 (0.0%) |
| 12 to 14 Years | 0 (0.0%) | 0 (0.0%) |
| 15 Years | 0 (0.0%) | 0 (0.0%) |
| 16 and 17 Years | 0 (0.0%) | 0 (0.0%) |
| 18 to 24 Years | 0 (0.0%) | 0 (0.0%) |
| 25 to 34 Years | 0 (0.0%) | 0 (0.0%) |
| 35 to 44 Years | 0 (0.0%) | 0 (0.0%) |
| 45 to 54 Years | 17 (28.3%) | 18 (11.0%) |
| 55 to 64 Years | 55 (41.3%) | 48 (100.0%) |
| 65 to 74 Years | 0 (0.0%) | 0 (0.0%) |
| 75 Years and over | 0 (0.0%) | 0 (0.0%) |
| Total | 72 (18.2%) | 66 (11.7%) |
Income Above Poverty by Sex and Age in Kendall
According to the poverty statistics in Kendall, males aged 6 to 11 years and females aged 6 to 11 years are the age groups that are most secure financially, with 100.0% of males and 100.0% of females in these age groups living above the poverty line.
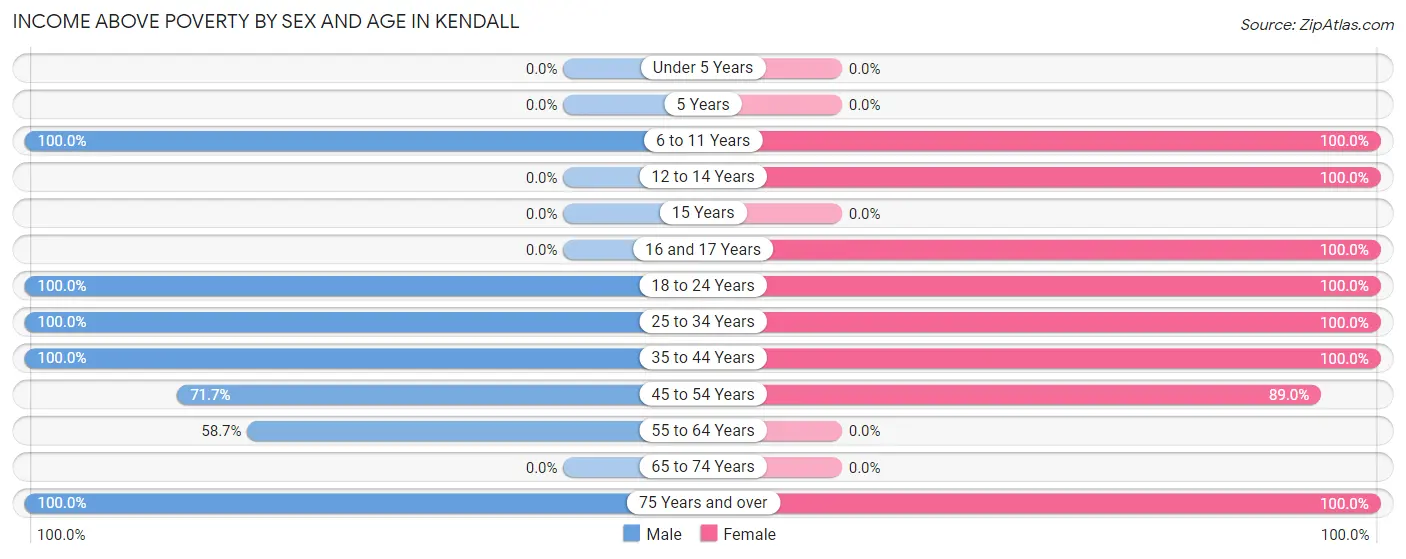
| Age Bracket | Male | Female |
| Under 5 Years | 0 (0.0%) | 0 (0.0%) |
| 5 Years | 0 (0.0%) | 0 (0.0%) |
| 6 to 11 Years | 14 (100.0%) | 115 (100.0%) |
| 12 to 14 Years | 0 (0.0%) | 23 (100.0%) |
| 15 Years | 0 (0.0%) | 0 (0.0%) |
| 16 and 17 Years | 0 (0.0%) | 58 (100.0%) |
| 18 to 24 Years | 23 (100.0%) | 73 (100.0%) |
| 25 to 34 Years | 69 (100.0%) | 36 (100.0%) |
| 35 to 44 Years | 86 (100.0%) | 28 (100.0%) |
| 45 to 54 Years | 43 (71.7%) | 145 (89.0%) |
| 55 to 64 Years | 78 (58.7%) | 0 (0.0%) |
| 65 to 74 Years | 0 (0.0%) | 0 (0.0%) |
| 75 Years and over | 11 (100.0%) | 19 (100.0%) |
| Total | 324 (81.8%) | 497 (88.3%) |
Income Below Poverty Among Married-Couple Families in Kendall
The poverty statistics for married-couple families in Kendall show that 9.2% or 17 of the total 184 families live below the poverty line. Families with no children have the highest poverty rate of 41.5%, comprising of 17 families. On the other hand, families with 1 or 2 children have the lowest poverty rate of 0.0%, which includes 0 families.
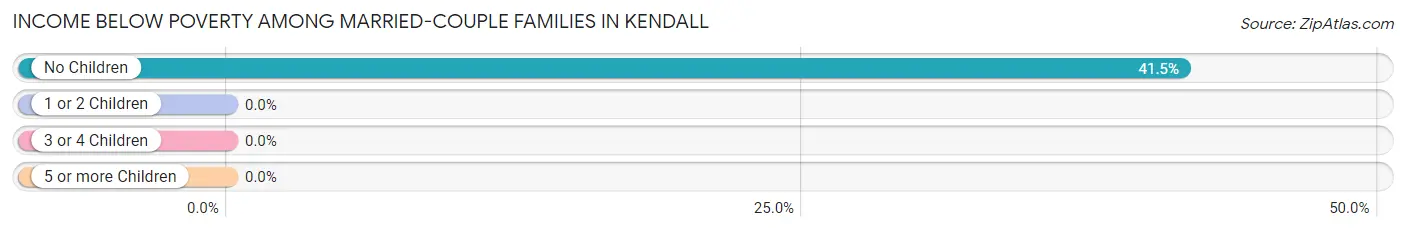
| Children | Above Poverty | Below Poverty |
| No Children | 24 (58.5%) | 17 (41.5%) |
| 1 or 2 Children | 143 (100.0%) | 0 (0.0%) |
| 3 or 4 Children | 0 (0.0%) | 0 (0.0%) |
| 5 or more Children | 0 (0.0%) | 0 (0.0%) |
| Total | 167 (90.8%) | 17 (9.2%) |
Income Below Poverty Among Single-Parent Households in Kendall
| Children | Single Father | Single Mother |
| No Children | 0 (0.0%) | 0 (0.0%) |
| 1 or 2 Children | 0 (0.0%) | 0 (0.0%) |
| 3 or 4 Children | 0 (0.0%) | 0 (0.0%) |
| 5 or more Children | 0 (0.0%) | 0 (0.0%) |
| Total | 0 (0.0%) | 0 (0.0%) |
Income Below Poverty Among Married-Couple vs Single-Parent Households in Kendall
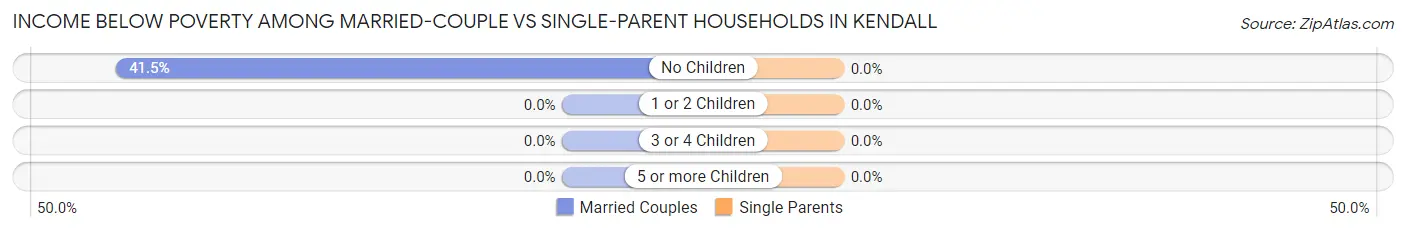
| Children | Married-Couple Families | Single-Parent Households |
| No Children | 17 (41.5%) | 0 (0.0%) |
| 1 or 2 Children | 0 (0.0%) | 0 (0.0%) |
| 3 or 4 Children | 0 (0.0%) | 0 (0.0%) |
| 5 or more Children | 0 (0.0%) | 0 (0.0%) |
| Total | 17 (9.2%) | 0 (0.0%) |
Race in Kendall
The most populous races in Kendall are White / Caucasian (959 | 100.0%), and Hispanic or Latino (69 | 7.2%).
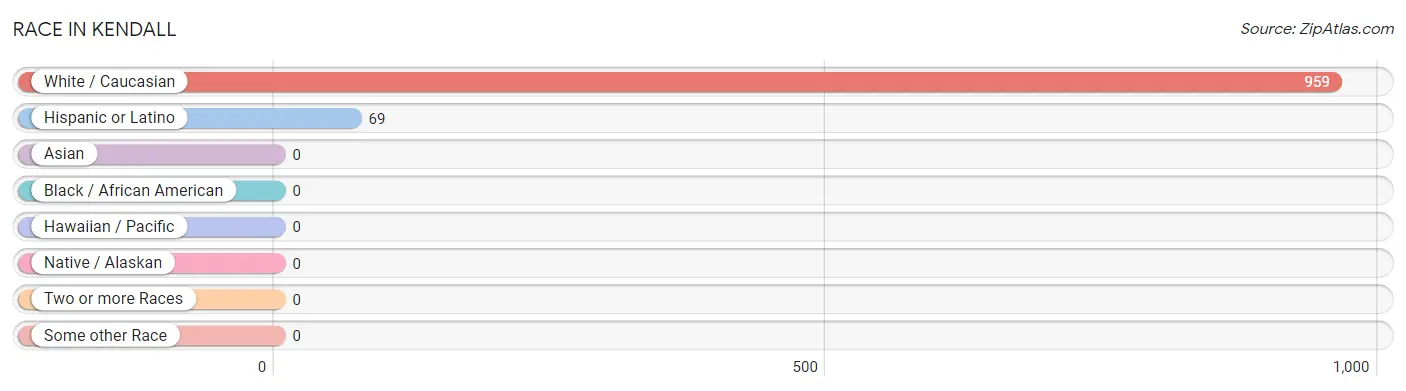
| Race | # Population | % Population |
| Asian | 0 | 0.0% |
| Black / African American | 0 | 0.0% |
| Hawaiian / Pacific | 0 | 0.0% |
| Hispanic or Latino | 69 | 7.2% |
| Native / Alaskan | 0 | 0.0% |
| White / Caucasian | 959 | 100.0% |
| Two or more Races | 0 | 0.0% |
| Some other Race | 0 | 0.0% |
| Total | 959 | 100.0% |
Ancestry in Kendall
The most populous ancestries reported in Kendall are Hungarian (242 | 25.2%), Italian (242 | 25.2%), German (166 | 17.3%), English (156 | 16.3%), and Irish (101 | 10.5%), together accounting for 94.6% of all Kendall residents.
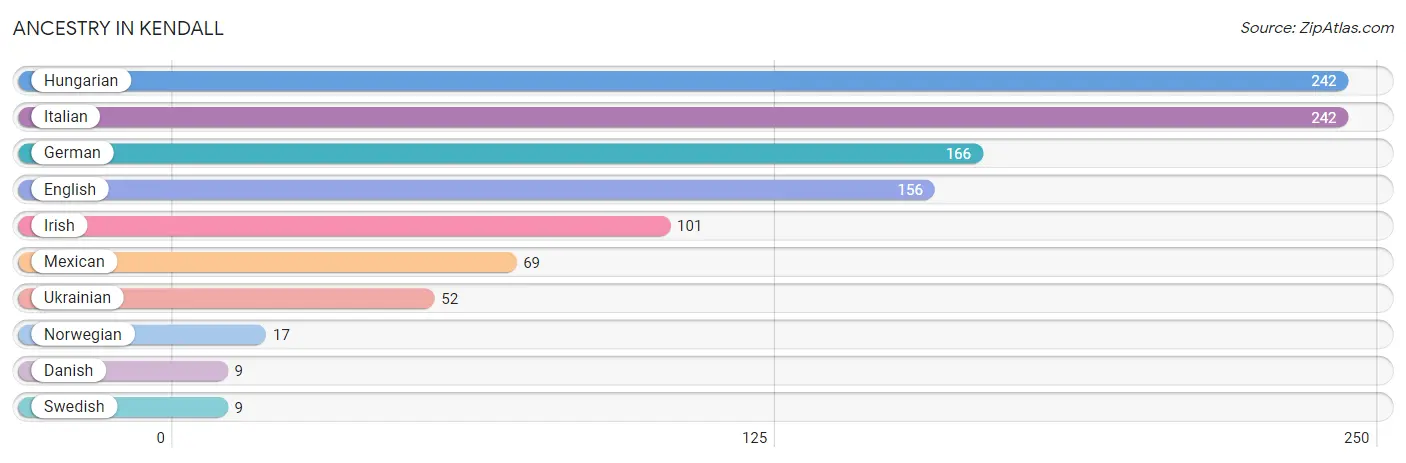
| Ancestry | # Population | % Population |
| Danish | 9 | 0.9% |
| English | 156 | 16.3% |
| German | 166 | 17.3% |
| Hungarian | 242 | 25.2% |
| Irish | 101 | 10.5% |
| Italian | 242 | 25.2% |
| Mexican | 69 | 7.2% |
| Norwegian | 17 | 1.8% |
| Swedish | 9 | 0.9% |
| Ukrainian | 52 | 5.4% | View All 10 Rows |
Immigrants in Kendall
The most numerous immigrant groups reported in Kendall came from Eastern Europe (52 | 5.4%), Europe (52 | 5.4%), and Ukraine (52 | 5.4%), together accounting for 16.3% of all Kendall residents.
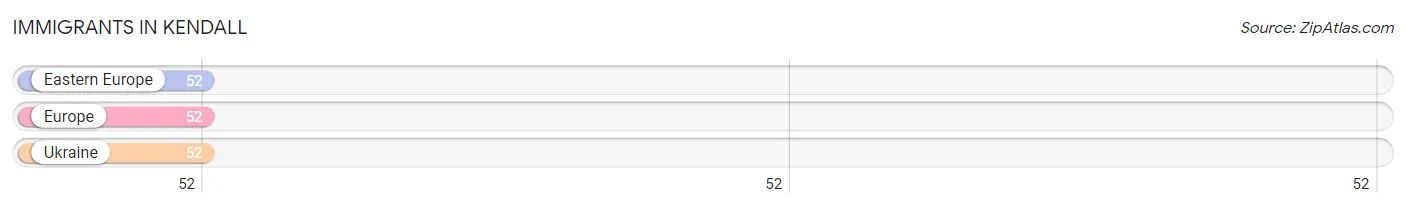
| Immigration Origin | # Population | % Population |
| Eastern Europe | 52 | 5.4% |
| Europe | 52 | 5.4% |
| Ukraine | 52 | 5.4% | View All 3 Rows |
Sex and Age in Kendall
Sex and Age in Kendall
The most populous age groups in Kendall are 55 to 59 Years (89 | 22.5%) for men and 50 to 54 Years (99 | 17.6%) for women.
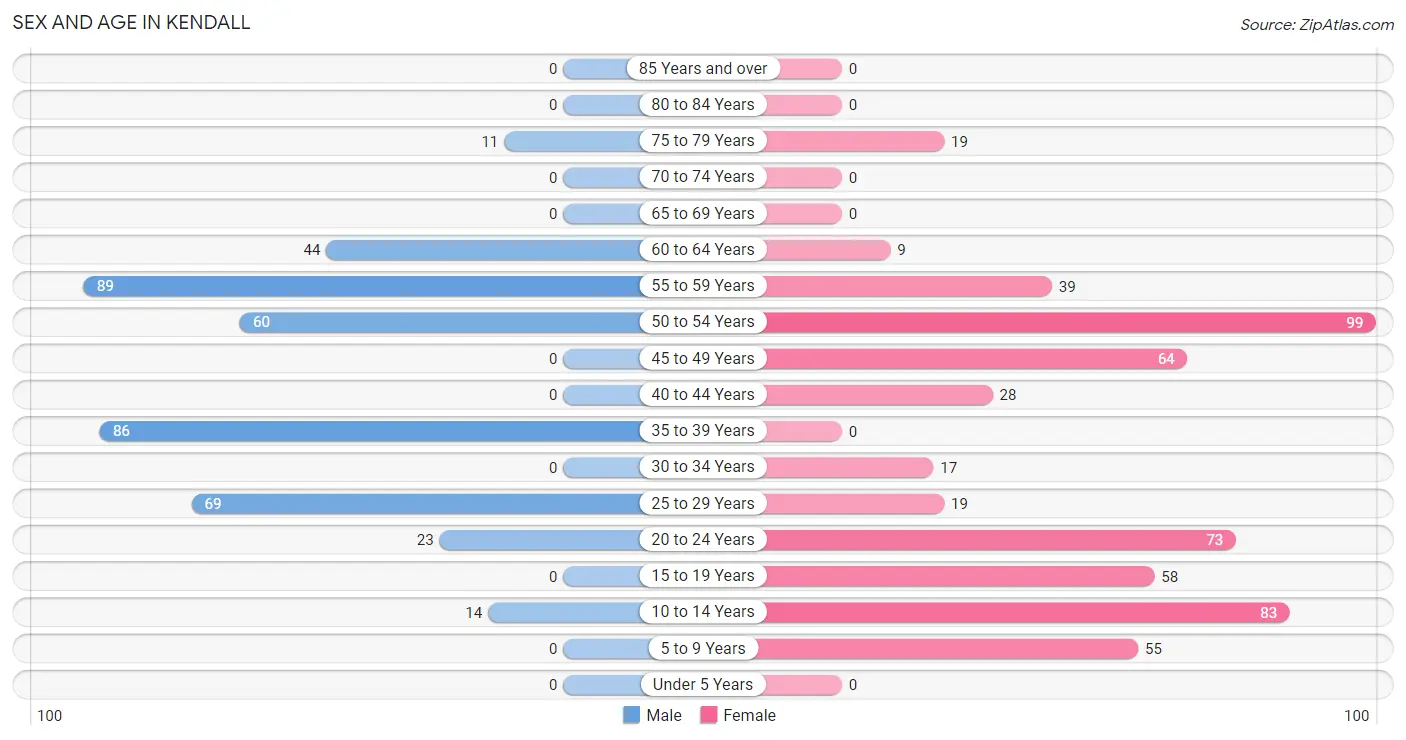
| Age Bracket | Male | Female |
| Under 5 Years | 0 (0.0%) | 0 (0.0%) |
| 5 to 9 Years | 0 (0.0%) | 55 (9.8%) |
| 10 to 14 Years | 14 (3.5%) | 83 (14.7%) |
| 15 to 19 Years | 0 (0.0%) | 58 (10.3%) |
| 20 to 24 Years | 23 (5.8%) | 73 (13.0%) |
| 25 to 29 Years | 69 (17.4%) | 19 (3.4%) |
| 30 to 34 Years | 0 (0.0%) | 17 (3.0%) |
| 35 to 39 Years | 86 (21.7%) | 0 (0.0%) |
| 40 to 44 Years | 0 (0.0%) | 28 (5.0%) |
| 45 to 49 Years | 0 (0.0%) | 64 (11.4%) |
| 50 to 54 Years | 60 (15.1%) | 99 (17.6%) |
| 55 to 59 Years | 89 (22.5%) | 39 (6.9%) |
| 60 to 64 Years | 44 (11.1%) | 9 (1.6%) |
| 65 to 69 Years | 0 (0.0%) | 0 (0.0%) |
| 70 to 74 Years | 0 (0.0%) | 0 (0.0%) |
| 75 to 79 Years | 11 (2.8%) | 19 (3.4%) |
| 80 to 84 Years | 0 (0.0%) | 0 (0.0%) |
| 85 Years and over | 0 (0.0%) | 0 (0.0%) |
| Total | 396 (100.0%) | 563 (100.0%) |
Families and Households in Kendall
Median Family Size in Kendall
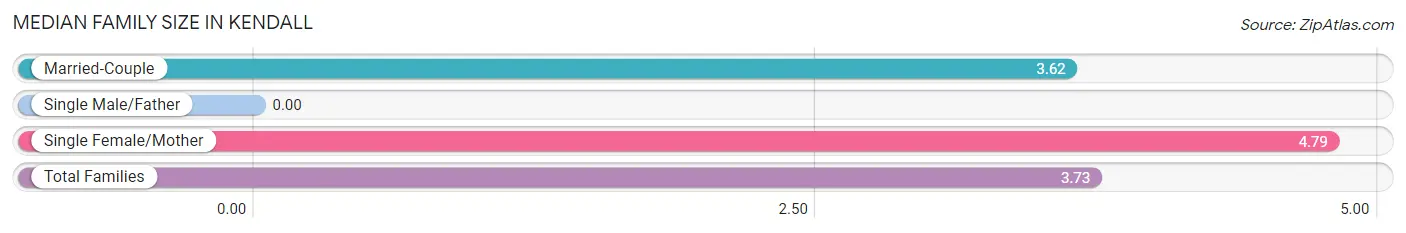
| Family Type | # Families | Family Size |
| Married-Couple | 184 (90.6%) | 3.62 |
| Single Male/Father | 0 (0.0%) | - |
| Single Female/Mother | 19 (9.4%) | 4.79 |
| Total Families | 203 (100.0%) | 3.73 |
Median Household Size in Kendall
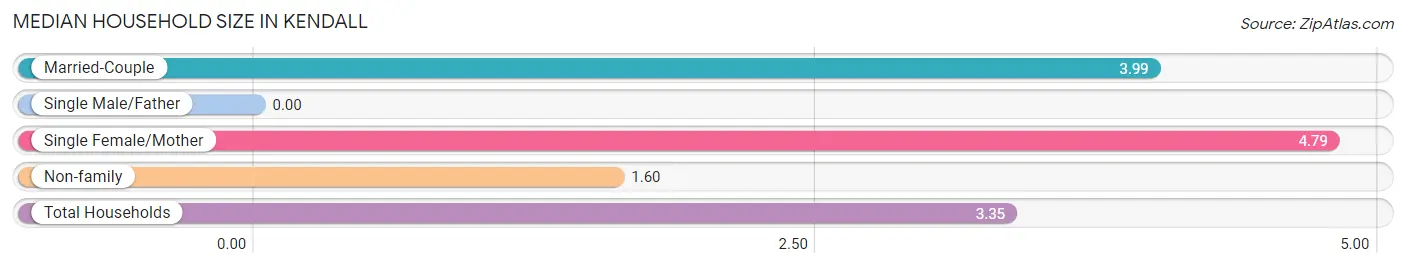
| Household Type | # Households | Household Size |
| Married-Couple | 184 (64.3%) | 3.99 |
| Single Male/Father | 0 (0.0%) | - |
| Single Female/Mother | 19 (6.6%) | 4.79 |
| Non-family | 83 (29.0%) | 1.60 |
| Total Households | 286 (100.0%) | 3.35 |
Household Size by Marriage Status in Kendall
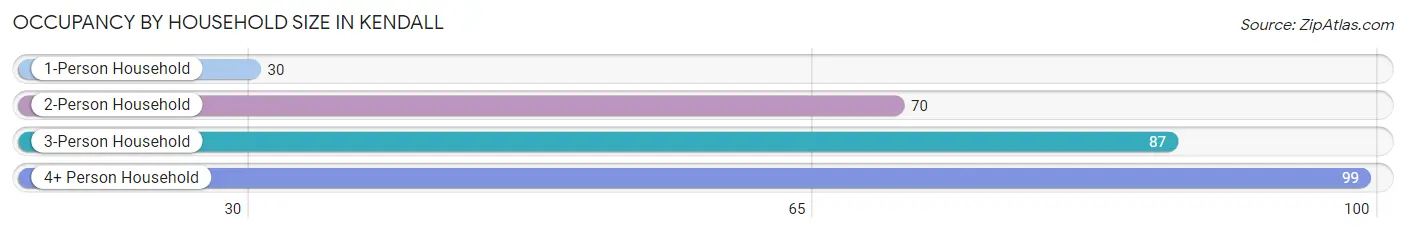
Out of a total of 286 households in Kendall, 203 (71.0%) are family households, while 83 (29.0%) are nonfamily households. The most numerous type of family households are 3-person households, comprising 87, and the most common type of nonfamily households are 2-person households, comprising 53.
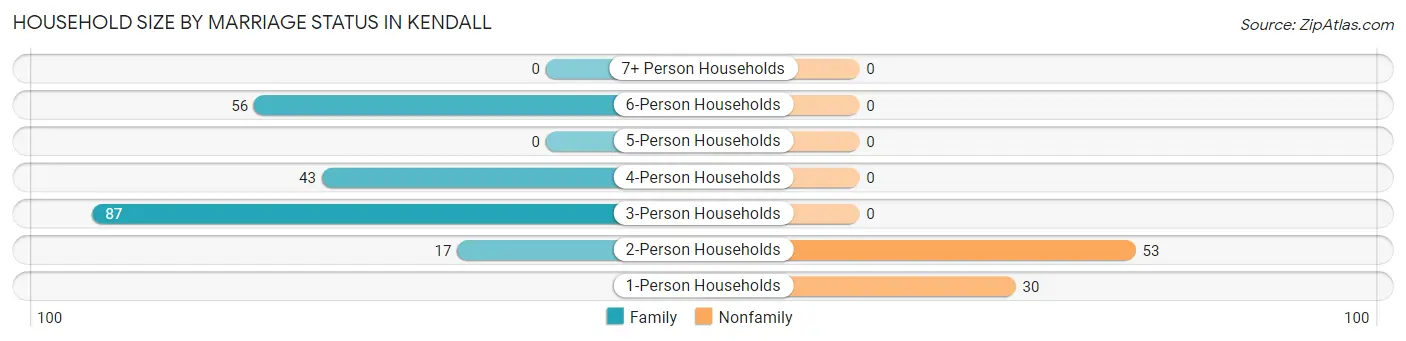
| Household Size | Family Households | Nonfamily Households |
| 1-Person Households | - | 30 (10.5%) |
| 2-Person Households | 17 (5.9%) | 53 (18.5%) |
| 3-Person Households | 87 (30.4%) | 0 (0.0%) |
| 4-Person Households | 43 (15.0%) | 0 (0.0%) |
| 5-Person Households | 0 (0.0%) | 0 (0.0%) |
| 6-Person Households | 56 (19.6%) | 0 (0.0%) |
| 7+ Person Households | 0 (0.0%) | 0 (0.0%) |
| Total | 203 (71.0%) | 83 (29.0%) |
Female Fertility in Kendall
Fertility by Age in Kendall
| Age Bracket | Women with Births | Births / 1,000 Women |
| 15 to 19 years | 0 (0.0%) | 0.0 |
| 20 to 34 years | 0 (0.0%) | 0.0 |
| 35 to 50 years | 0 (0.0%) | 0.0 |
| Total | 0 (0.0%) | 0.0 |
Fertility by Age by Marriage Status in Kendall
| Age Bracket | Married | Unmarried |
| 15 to 19 years | 0 (0.0%) | 0 (0.0%) |
| 20 to 34 years | 0 (0.0%) | 0 (0.0%) |
| 35 to 50 years | 0 (0.0%) | 0 (0.0%) |
| Total | 0 (0.0%) | 0 (0.0%) |
Fertility by Education in Kendall
| Educational Attainment | Women with Births | Births / 1,000 Women |
| Less than High School | 0 (0.0%) | 0.0 |
| High School Diploma | 0 (0.0%) | 0.0 |
| College or Associate's Degree | 0 (0.0%) | 0.0 |
| Bachelor's Degree | 0 (0.0%) | 0.0 |
| Graduate Degree | 0 (0.0%) | 0.0 |
| Total | 0 (0.0%) | 0.0 |
Fertility by Education by Marriage Status in Kendall
| Educational Attainment | Married | Unmarried |
| Less than High School | 0 (0.0%) | 0 (0.0%) |
| High School Diploma | 0 (0.0%) | 0 (0.0%) |
| College or Associate's Degree | 0 (0.0%) | 0 (0.0%) |
| Bachelor's Degree | 0 (0.0%) | 0 (0.0%) |
| Graduate Degree | 0 (0.0%) | 0 (0.0%) |
| Total | 0 (0.0%) | 0 (0.0%) |
Employment Characteristics in Kendall
Employment by Class of Employer in Kendall
Among the 395 employed individuals in Kendall, private company employees (358 | 90.6%), local government employees (28 | 7.1%), and state government employees (9 | 2.3%) make up the most common classes of employment.
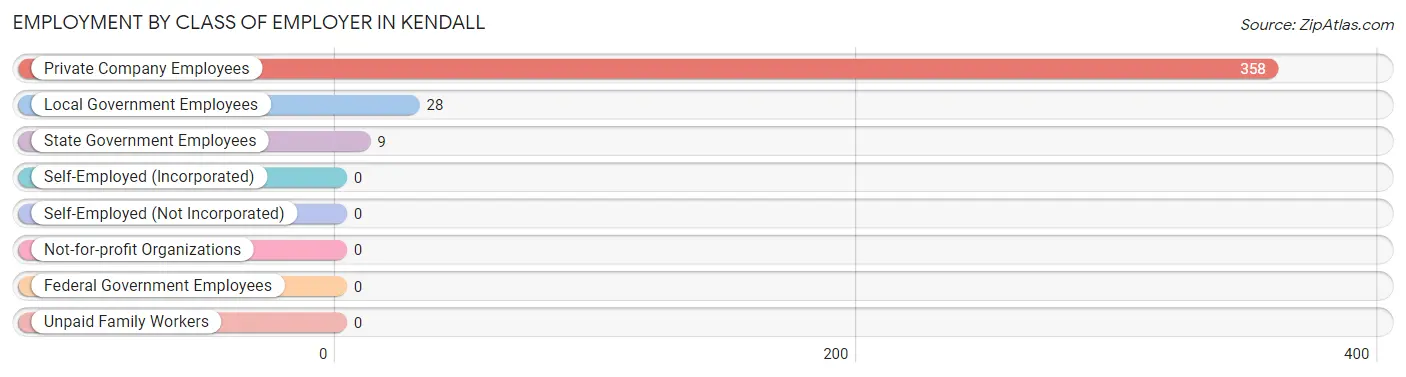
| Employer Class | # Employees | % Employees |
| Private Company Employees | 358 | 90.6% |
| Self-Employed (Incorporated) | 0 | 0.0% |
| Self-Employed (Not Incorporated) | 0 | 0.0% |
| Not-for-profit Organizations | 0 | 0.0% |
| Local Government Employees | 28 | 7.1% |
| State Government Employees | 9 | 2.3% |
| Federal Government Employees | 0 | 0.0% |
| Unpaid Family Workers | 0 | 0.0% |
| Total | 395 | 100.0% |
Employment Status by Age in Kendall
According to the labor force statistics for Kendall, out of the total population over 16 years of age (807), 62.2% or 502 individuals are in the labor force, with 21.3% or 107 of them unemployed. The age group with the highest labor force participation rate is 16 to 19 years, with 100.0% or 58 individuals in the labor force. Within the labor force, the 16 to 19 years age range has the highest percentage of unemployed individuals, with 100.0% or 58 of them being unemployed.
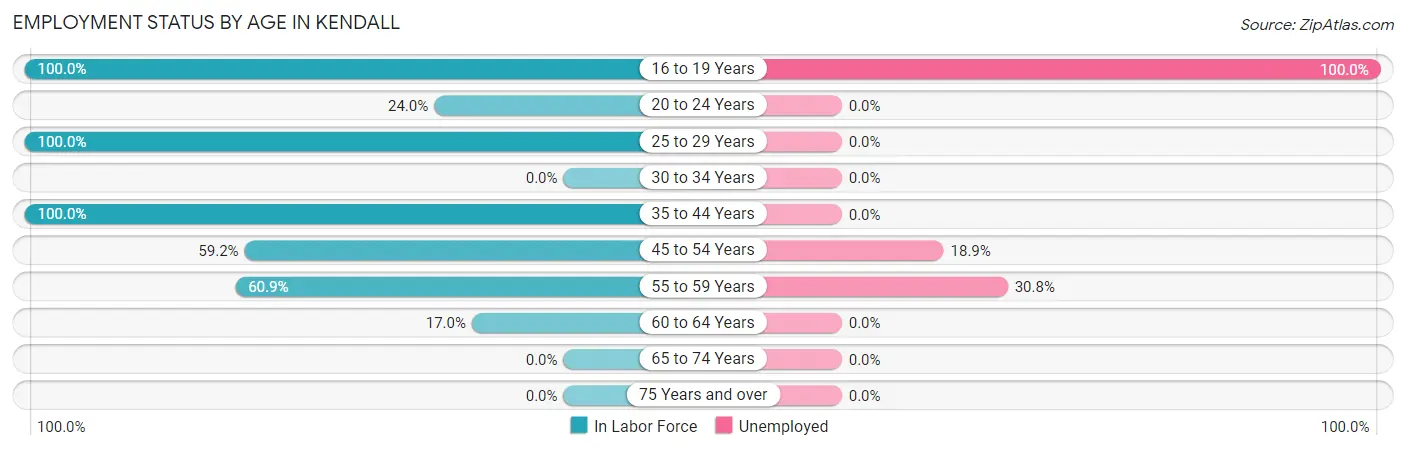
| Age Bracket | In Labor Force | Unemployed |
| 16 to 19 Years | 58 (100.0%) | 58 (100.0%) |
| 20 to 24 Years | 23 (24.0%) | 0 (0.0%) |
| 25 to 29 Years | 88 (100.0%) | 0 (0.0%) |
| 30 to 34 Years | 0 (0.0%) | 0 (0.0%) |
| 35 to 44 Years | 114 (100.0%) | 0 (0.0%) |
| 45 to 54 Years | 132 (59.2%) | 25 (18.9%) |
| 55 to 59 Years | 78 (60.9%) | 24 (30.8%) |
| 60 to 64 Years | 9 (17.0%) | 0 (0.0%) |
| 65 to 74 Years | 0 (0.0%) | 0 (0.0%) |
| 75 Years and over | 0 (0.0%) | 0 (0.0%) |
| Total | 502 (62.2%) | 107 (21.3%) |
Employment Status by Educational Attainment in Kendall
According to labor force statistics for Kendall, 67.6% of individuals (421) out of the total population between 25 and 64 years of age (623) are in the labor force, with 11.6% or 49 of them being unemployed. The group with the highest labor force participation rate are those with the educational attainment of less than high school, with 94.4% or 184 individuals in the labor force. Within the labor force, individuals with college / associate degree education have the highest percentage of unemployment, with 49.0% or 49 of them being unemployed.
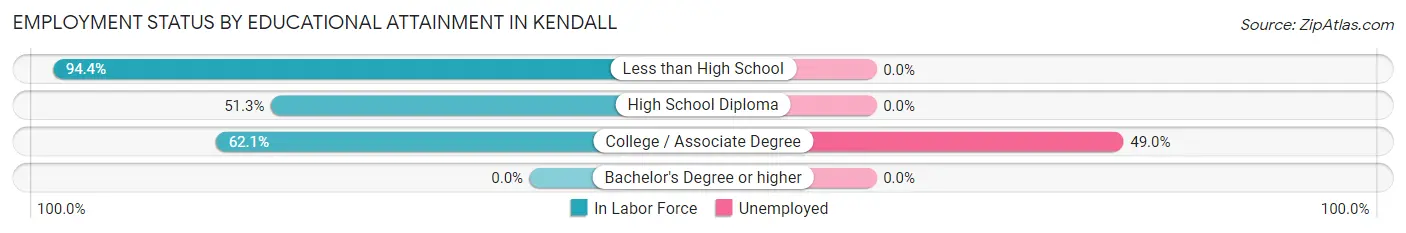
| Educational Attainment | In Labor Force | Unemployed |
| Less than High School | 184 (94.4%) | 0 (0.0%) |
| High School Diploma | 137 (51.3%) | 0 (0.0%) |
| College / Associate Degree | 100 (62.1%) | 79 (49.0%) |
| Bachelor's Degree or higher | 0 (0.0%) | 0 (0.0%) |
| Total | 421 (67.6%) | 72 (11.6%) |
Employment Occupations by Sex in Kendall
Management, Business, Science and Arts Occupations
The most common Management, Business, Science and Arts occupations in Kendall are Management (54 | 13.7%), Community & Social Service (28 | 7.1%), and Education Instruction & Library (28 | 7.1%).
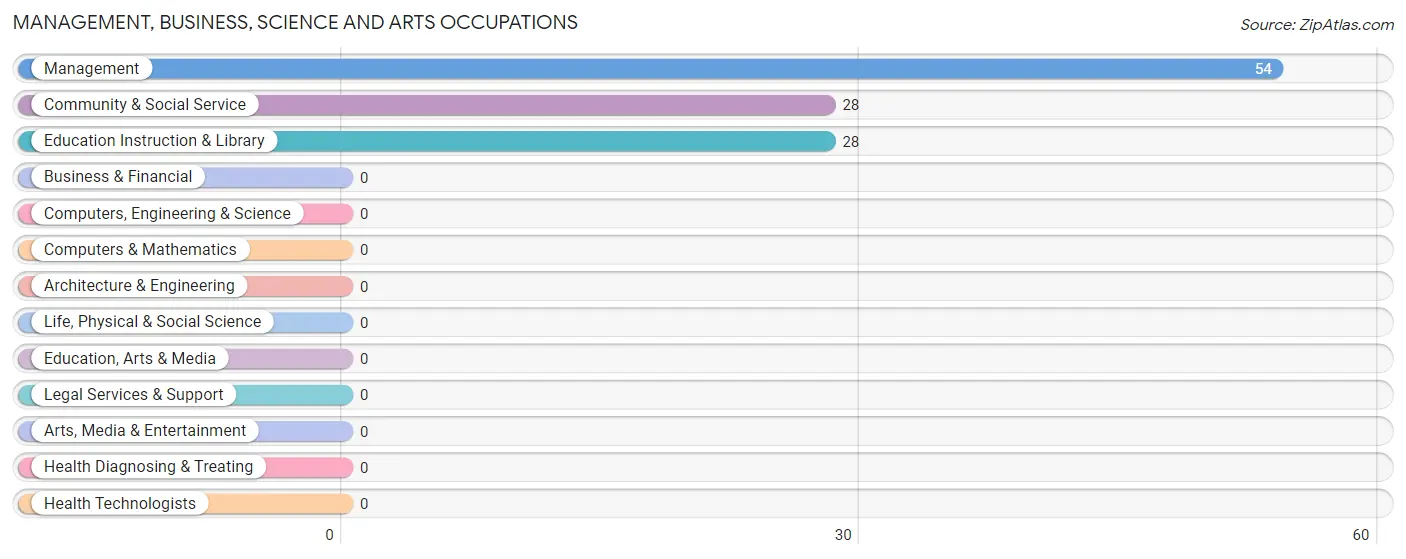
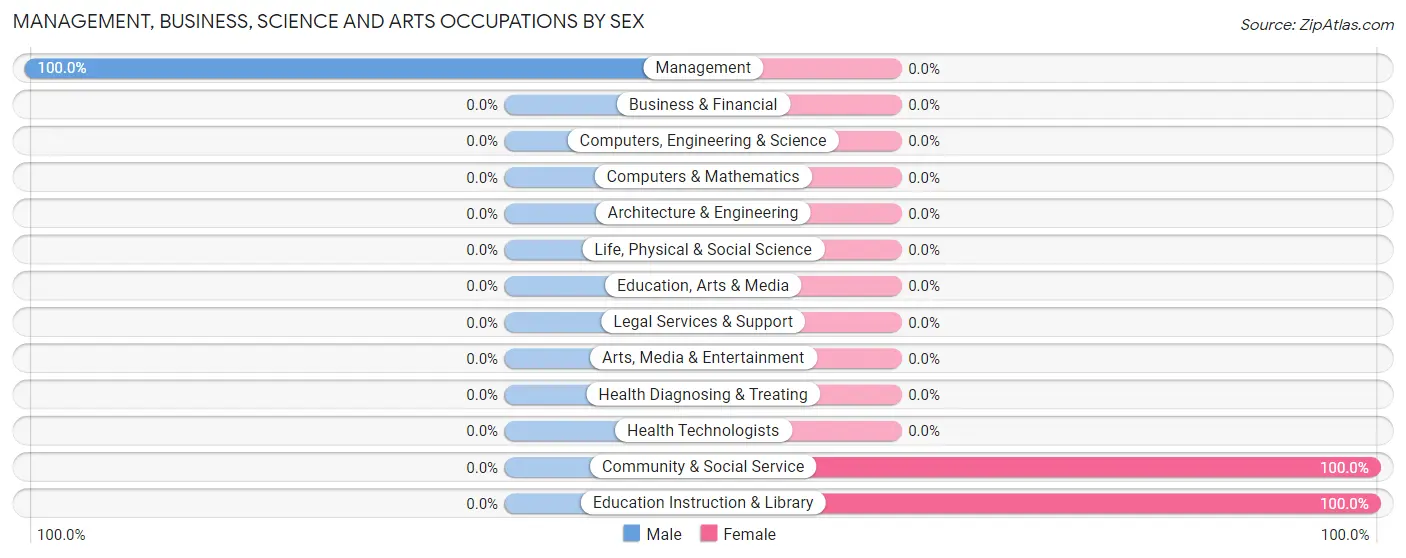
Management, Business, Science and Arts Occupations by Sex
| Occupation | Male | Female |
| Management | 54 (100.0%) | 0 (0.0%) |
| Business & Financial | 0 (0.0%) | 0 (0.0%) |
| Computers, Engineering & Science | 0 (0.0%) | 0 (0.0%) |
| Computers & Mathematics | 0 (0.0%) | 0 (0.0%) |
| Architecture & Engineering | 0 (0.0%) | 0 (0.0%) |
| Life, Physical & Social Science | 0 (0.0%) | 0 (0.0%) |
| Community & Social Service | 0 (0.0%) | 28 (100.0%) |
| Education, Arts & Media | 0 (0.0%) | 0 (0.0%) |
| Legal Services & Support | 0 (0.0%) | 0 (0.0%) |
| Education Instruction & Library | 0 (0.0%) | 28 (100.0%) |
| Arts, Media & Entertainment | 0 (0.0%) | 0 (0.0%) |
| Health Diagnosing & Treating | 0 (0.0%) | 0 (0.0%) |
| Health Technologists | 0 (0.0%) | 0 (0.0%) |
| Total (Category) | 54 (65.8%) | 28 (34.2%) |
| Total (Overall) | 275 (69.6%) | 120 (30.4%) |
Services Occupations
The most common Services occupations in Kendall are , and Healthcare Support (9 | 2.3%).
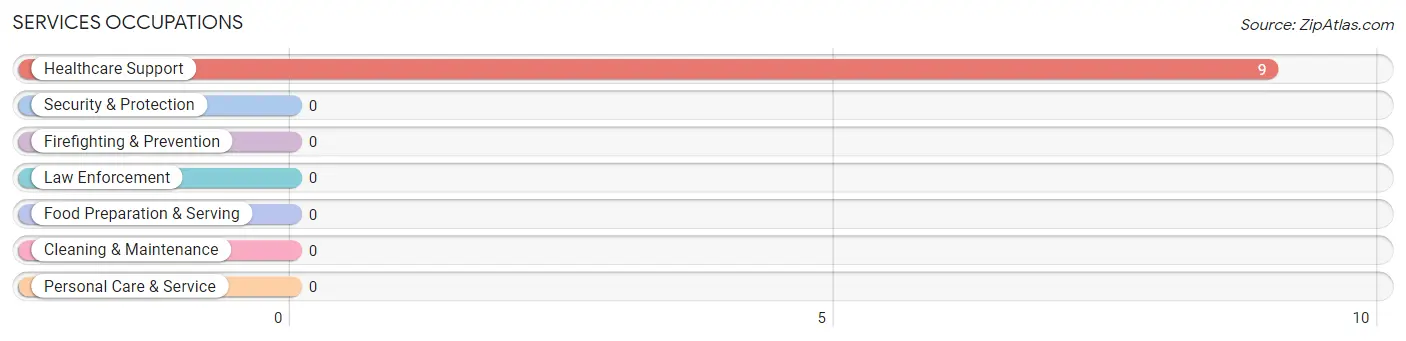
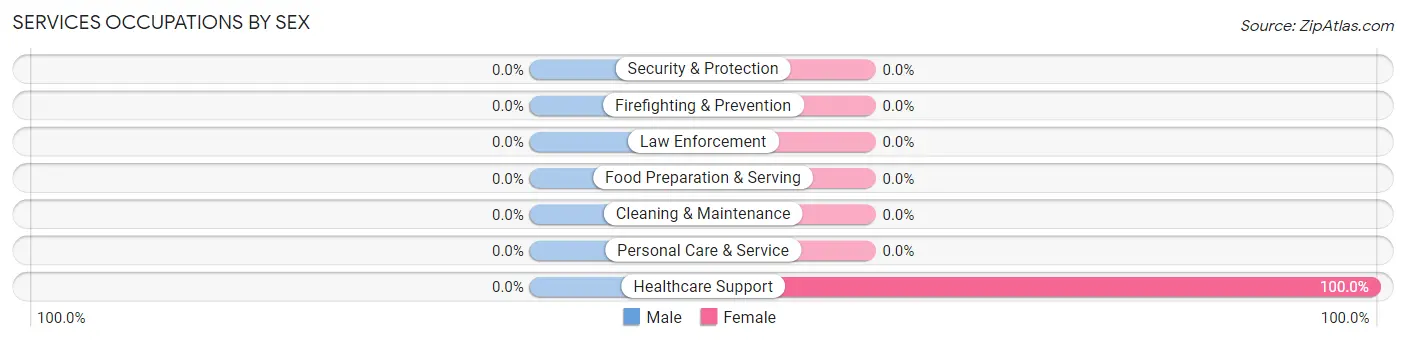
Services Occupations by Sex
| Occupation | Male | Female |
| Healthcare Support | 0 (0.0%) | 9 (100.0%) |
| Security & Protection | 0 (0.0%) | 0 (0.0%) |
| Firefighting & Prevention | 0 (0.0%) | 0 (0.0%) |
| Law Enforcement | 0 (0.0%) | 0 (0.0%) |
| Food Preparation & Serving | 0 (0.0%) | 0 (0.0%) |
| Cleaning & Maintenance | 0 (0.0%) | 0 (0.0%) |
| Personal Care & Service | 0 (0.0%) | 0 (0.0%) |
| Total (Category) | 0 (0.0%) | 9 (100.0%) |
| Total (Overall) | 275 (69.6%) | 120 (30.4%) |
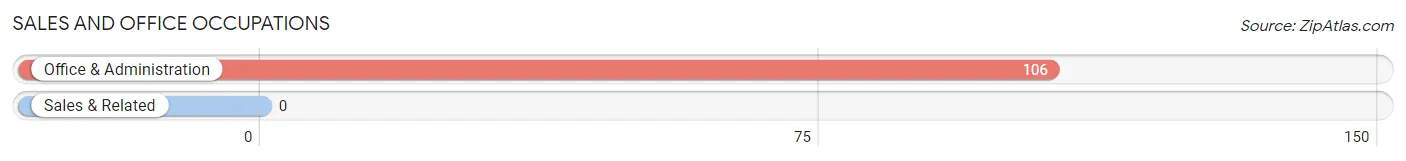
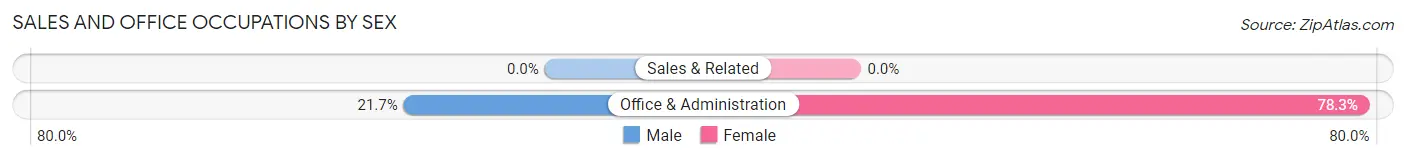
Sales and Office Occupations
The most common Sales and Office occupations in Kendall are , and Office & Administration (106 | 26.8%).
Sales and Office Occupations by Sex
| Occupation | Male | Female |
| Sales & Related | 0 (0.0%) | 0 (0.0%) |
| Office & Administration | 23 (21.7%) | 83 (78.3%) |
| Total (Category) | 23 (21.7%) | 83 (78.3%) |
| Total (Overall) | 275 (69.6%) | 120 (30.4%) |
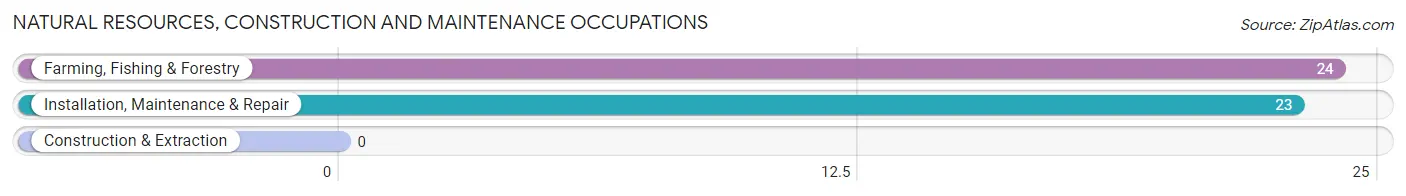
Natural Resources, Construction and Maintenance Occupations
The most common Natural Resources, Construction and Maintenance occupations in Kendall are Farming, Fishing & Forestry (24 | 6.1%), and Installation, Maintenance & Repair (23 | 5.8%).
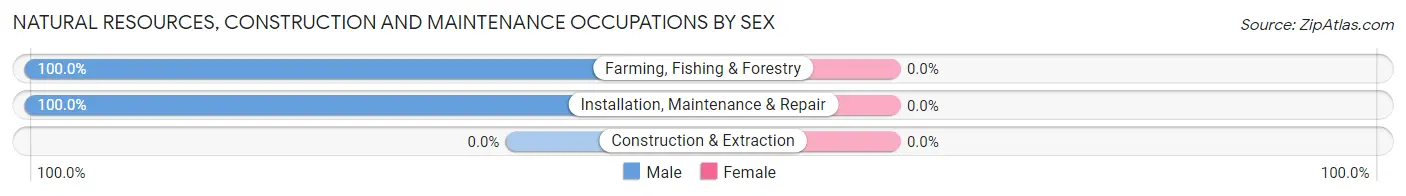
Natural Resources, Construction and Maintenance Occupations by Sex
| Occupation | Male | Female |
| Farming, Fishing & Forestry | 24 (100.0%) | 0 (0.0%) |
| Construction & Extraction | 0 (0.0%) | 0 (0.0%) |
| Installation, Maintenance & Repair | 23 (100.0%) | 0 (0.0%) |
| Total (Category) | 47 (100.0%) | 0 (0.0%) |
| Total (Overall) | 275 (69.6%) | 120 (30.4%) |
Production, Transportation and Moving Occupations
The most common Production, Transportation and Moving occupations in Kendall are Material Moving (69 | 17.5%), Transportation (63 | 16.0%), and Production (19 | 4.8%).
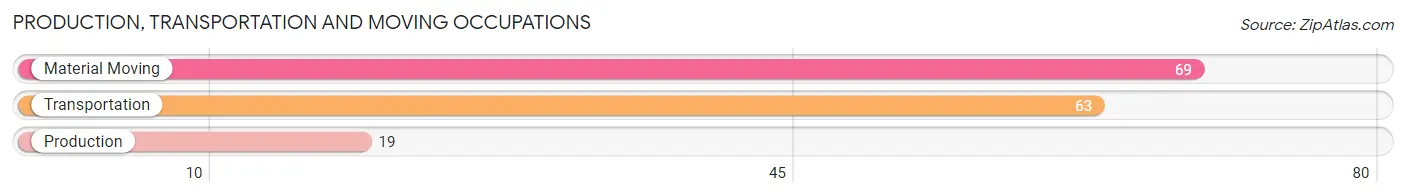
Production, Transportation and Moving Occupations by Sex
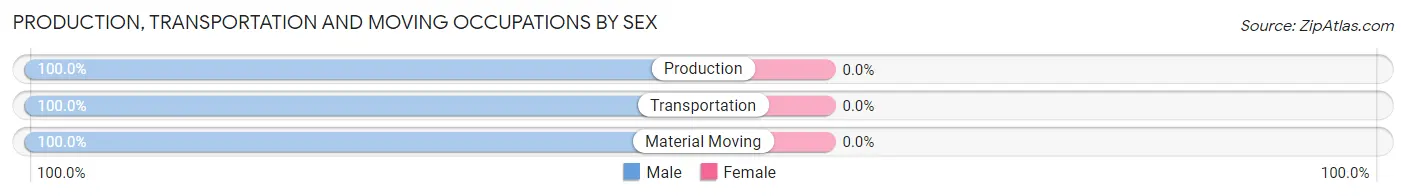
| Occupation | Male | Female |
| Production | 19 (100.0%) | 0 (0.0%) |
| Transportation | 63 (100.0%) | 0 (0.0%) |
| Material Moving | 69 (100.0%) | 0 (0.0%) |
| Total (Category) | 151 (100.0%) | 0 (0.0%) |
| Total (Overall) | 275 (69.6%) | 120 (30.4%) |
Employment Industries by Sex in Kendall
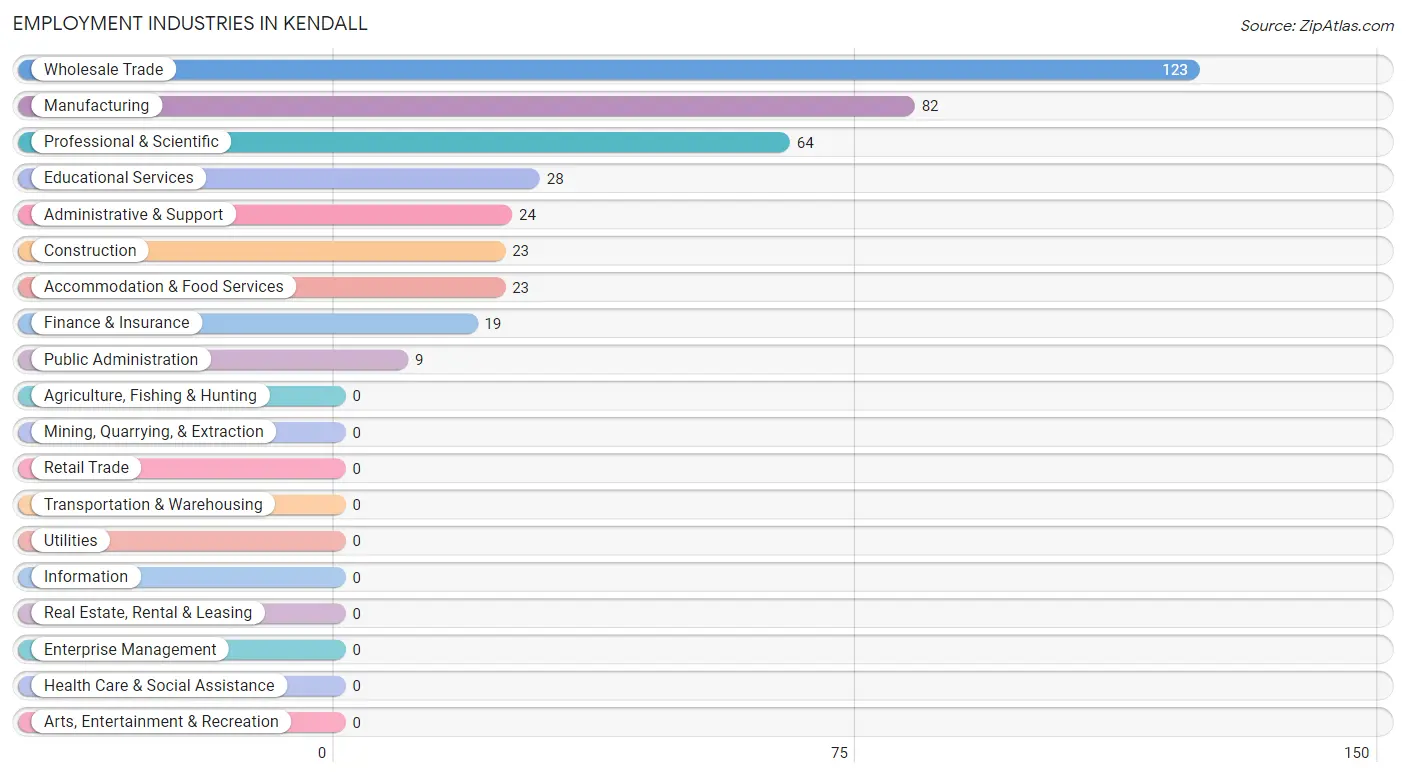
Employment Industries in Kendall
The major employment industries in Kendall include Wholesale Trade (123 | 31.1%), Manufacturing (82 | 20.8%), Professional & Scientific (64 | 16.2%), Educational Services (28 | 7.1%), and Administrative & Support (24 | 6.1%).
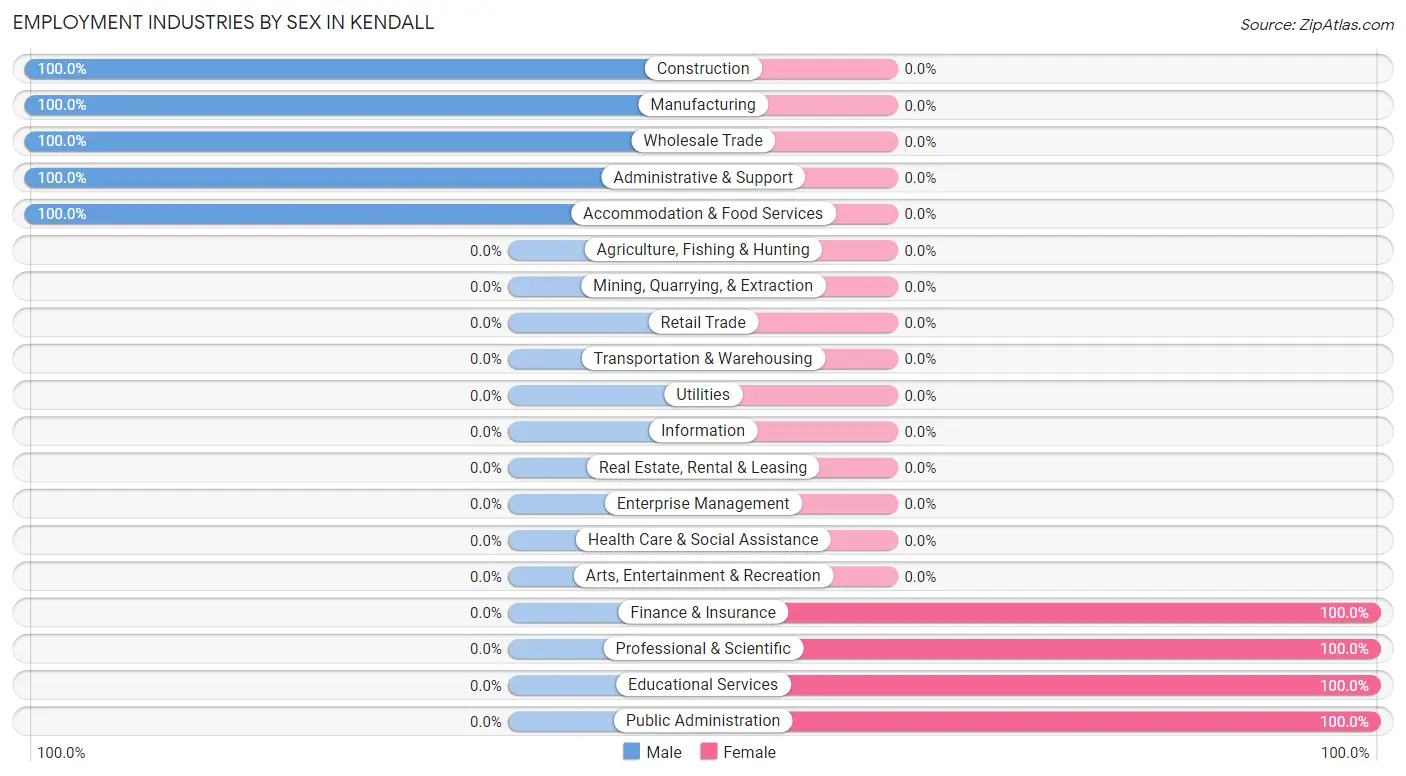
Employment Industries by Sex in Kendall
The Kendall industries that see more men than women are Construction (100.0%), Manufacturing (100.0%), and Wholesale Trade (100.0%), whereas the industries that tend to have a higher number of women are Finance & Insurance (100.0%), Professional & Scientific (100.0%), and Educational Services (100.0%).
| Industry | Male | Female |
| Agriculture, Fishing & Hunting | 0 (0.0%) | 0 (0.0%) |
| Mining, Quarrying, & Extraction | 0 (0.0%) | 0 (0.0%) |
| Construction | 23 (100.0%) | 0 (0.0%) |
| Manufacturing | 82 (100.0%) | 0 (0.0%) |
| Wholesale Trade | 123 (100.0%) | 0 (0.0%) |
| Retail Trade | 0 (0.0%) | 0 (0.0%) |
| Transportation & Warehousing | 0 (0.0%) | 0 (0.0%) |
| Utilities | 0 (0.0%) | 0 (0.0%) |
| Information | 0 (0.0%) | 0 (0.0%) |
| Finance & Insurance | 0 (0.0%) | 19 (100.0%) |
| Real Estate, Rental & Leasing | 0 (0.0%) | 0 (0.0%) |
| Professional & Scientific | 0 (0.0%) | 64 (100.0%) |
| Enterprise Management | 0 (0.0%) | 0 (0.0%) |
| Administrative & Support | 24 (100.0%) | 0 (0.0%) |
| Educational Services | 0 (0.0%) | 28 (100.0%) |
| Health Care & Social Assistance | 0 (0.0%) | 0 (0.0%) |
| Arts, Entertainment & Recreation | 0 (0.0%) | 0 (0.0%) |
| Accommodation & Food Services | 23 (100.0%) | 0 (0.0%) |
| Public Administration | 0 (0.0%) | 9 (100.0%) |
| Total | 275 (69.6%) | 120 (30.4%) |
Education in Kendall
School Enrollment in Kendall
The most common levels of schooling among the 210 students in Kendall are middle school (83 | 39.5%), elementary school (69 | 32.9%), and high school (58 | 27.6%).
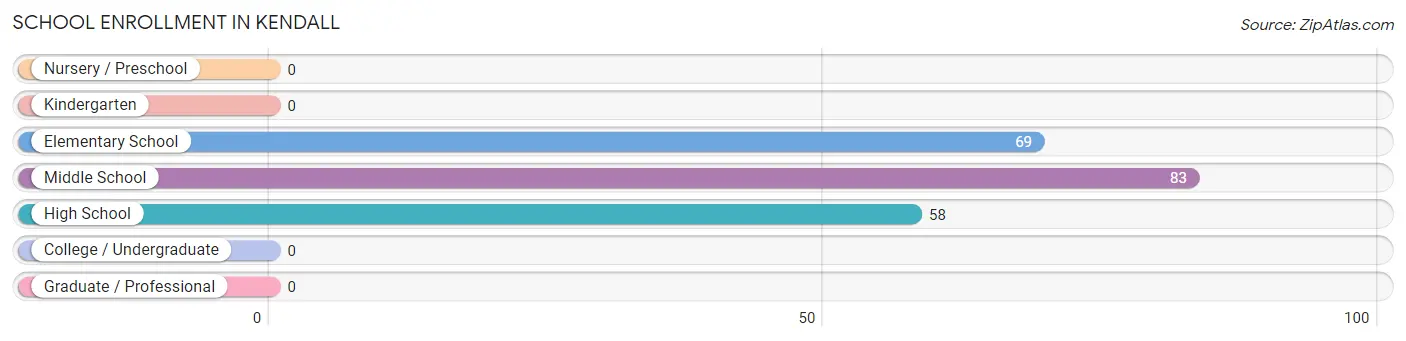
| School Level | # Students | % Students |
| Nursery / Preschool | 0 | 0.0% |
| Kindergarten | 0 | 0.0% |
| Elementary School | 69 | 32.9% |
| Middle School | 83 | 39.5% |
| High School | 58 | 27.6% |
| College / Undergraduate | 0 | 0.0% |
| Graduate / Professional | 0 | 0.0% |
| Total | 210 | 100.0% |
School Enrollment by Age by Funding Source in Kendall
Out of a total of 210 students who are enrolled in schools in Kendall, 141 (67.1%) attend a private institution, while the remaining 69 (32.9%) are enrolled in public schools. The age group of 15 to 17 year olds has the highest likelihood of being enrolled in private schools, with 58 (100.0% in the age bracket) enrolled. Conversely, the age group of 5 to 9 year old has the lowest likelihood of being enrolled in a private school, with 55 (100.0% in the age bracket) attending a public institution.
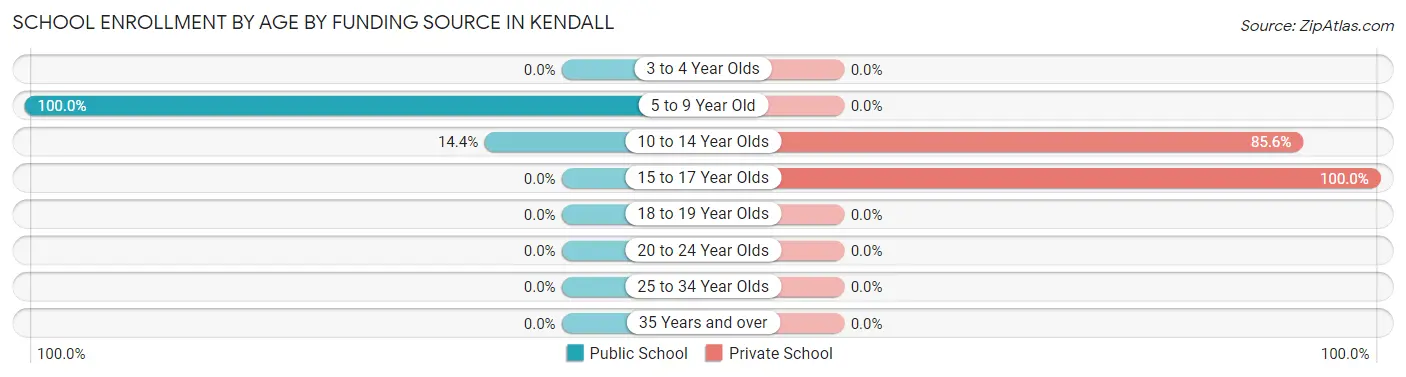
| Age Bracket | Public School | Private School |
| 3 to 4 Year Olds | 0 (0.0%) | 0 (0.0%) |
| 5 to 9 Year Old | 55 (100.0%) | 0 (0.0%) |
| 10 to 14 Year Olds | 14 (14.4%) | 83 (85.6%) |
| 15 to 17 Year Olds | 0 (0.0%) | 58 (100.0%) |
| 18 to 19 Year Olds | 0 (0.0%) | 0 (0.0%) |
| 20 to 24 Year Olds | 0 (0.0%) | 0 (0.0%) |
| 25 to 34 Year Olds | 0 (0.0%) | 0 (0.0%) |
| 35 Years and over | 0 (0.0%) | 0 (0.0%) |
| Total | 69 (32.9%) | 141 (67.1%) |
Educational Attainment by Field of Study in Kendall
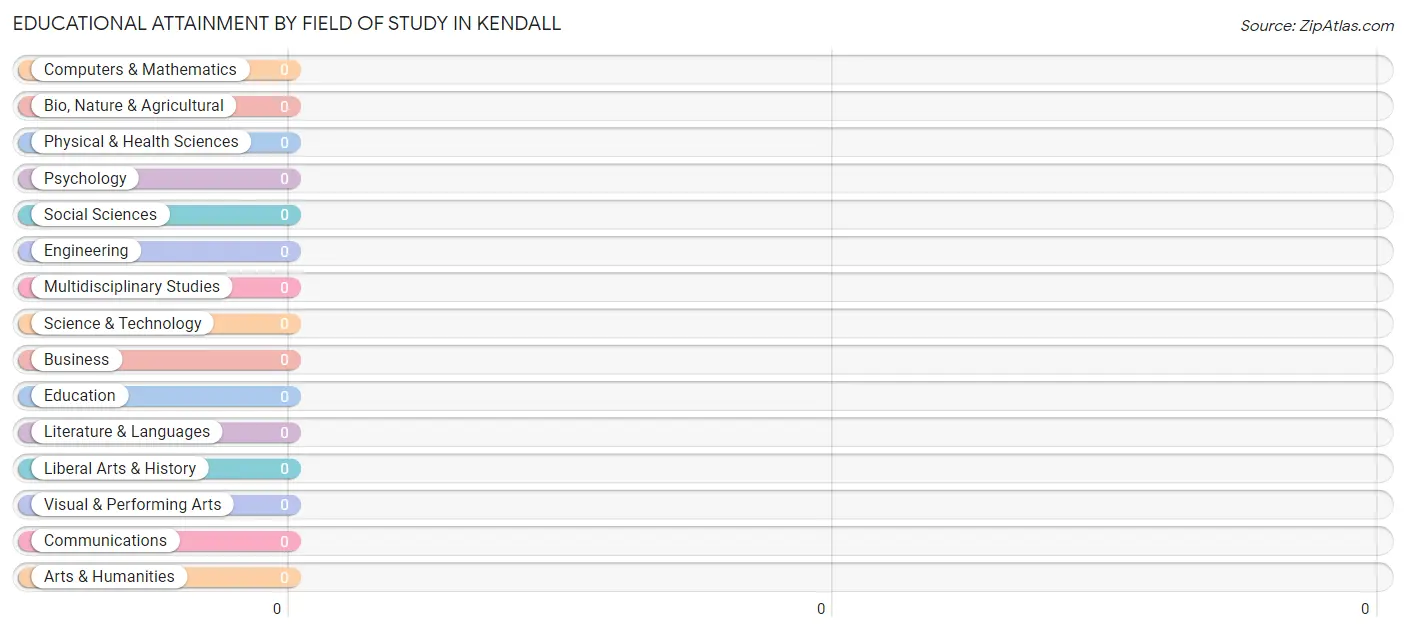
| Field of Study | # Graduates | % Graduates |
| Computers & Mathematics | 0 | 0.0% |
| Bio, Nature & Agricultural | 0 | 0.0% |
| Physical & Health Sciences | 0 | 0.0% |
| Psychology | 0 | 0.0% |
| Social Sciences | 0 | 0.0% |
| Engineering | 0 | 0.0% |
| Multidisciplinary Studies | 0 | 0.0% |
| Science & Technology | 0 | 0.0% |
| Business | 0 | 0.0% |
| Education | 0 | 0.0% |
| Literature & Languages | 0 | 0.0% |
| Liberal Arts & History | 0 | 0.0% |
| Visual & Performing Arts | 0 | 0.0% |
| Communications | 0 | 0.0% |
| Arts & Humanities | 0 | 0.0% |
| Total | 0 | 0.0% |
Transportation & Commute in Kendall
Vehicle Availability by Sex in Kendall
The most prevalent vehicle ownership categories in Kendall are males with 3 vehicles (146, accounting for 53.1%) and females with 3 vehicles (0, making up 121.7%).
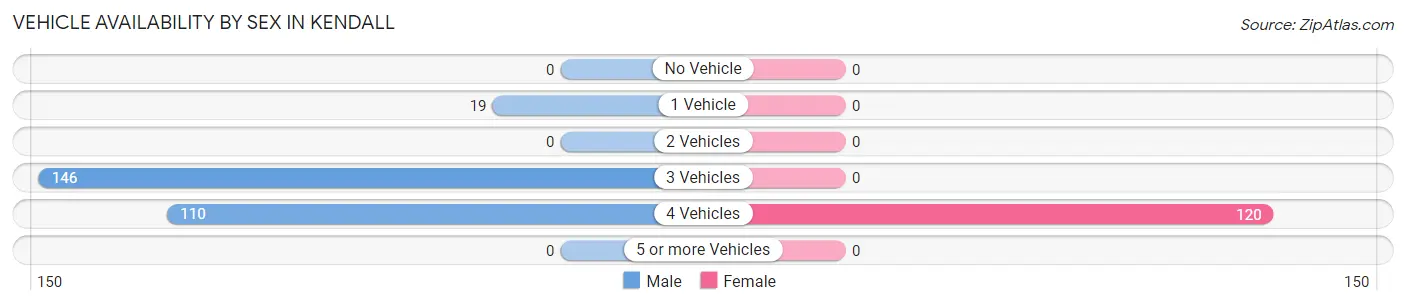
| Vehicles Available | Male | Female |
| No Vehicle | 0 (0.0%) | 0 (0.0%) |
| 1 Vehicle | 19 (6.9%) | 0 (0.0%) |
| 2 Vehicles | 0 (0.0%) | 0 (0.0%) |
| 3 Vehicles | 146 (53.1%) | 0 (0.0%) |
| 4 Vehicles | 110 (40.0%) | 120 (100.0%) |
| 5 or more Vehicles | 0 (0.0%) | 0 (0.0%) |
| Total | 275 (100.0%) | 120 (100.0%) |
Commute Time in Kendall
The most frequently occuring commute durations in Kendall are 45 to 59 minutes (144 commuters, 37.3%), 35 to 39 minutes (64 commuters, 16.6%), and 20 to 24 minutes (63 commuters, 16.3%).
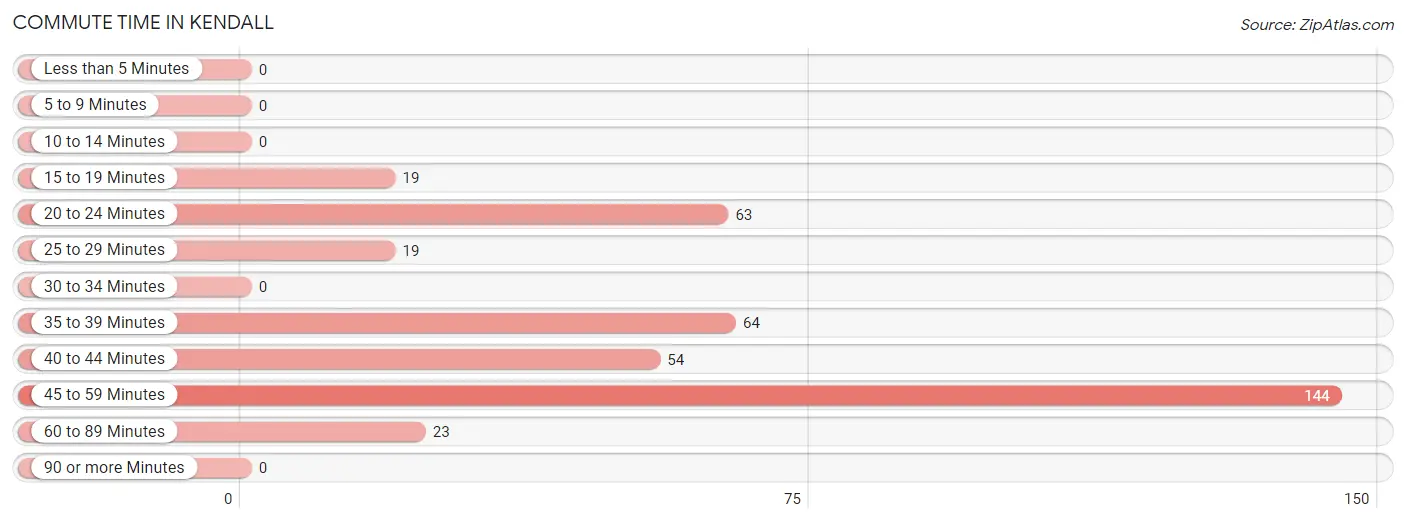
| Commute Time | # Commuters | % Commuters |
| Less than 5 Minutes | 0 | 0.0% |
| 5 to 9 Minutes | 0 | 0.0% |
| 10 to 14 Minutes | 0 | 0.0% |
| 15 to 19 Minutes | 19 | 4.9% |
| 20 to 24 Minutes | 63 | 16.3% |
| 25 to 29 Minutes | 19 | 4.9% |
| 30 to 34 Minutes | 0 | 0.0% |
| 35 to 39 Minutes | 64 | 16.6% |
| 40 to 44 Minutes | 54 | 14.0% |
| 45 to 59 Minutes | 144 | 37.3% |
| 60 to 89 Minutes | 23 | 6.0% |
| 90 or more Minutes | 0 | 0.0% |
Commute Time by Sex in Kendall
The most common commute times in Kendall are 45 to 59 minutes (116 commuters, 42.2%) for males and 35 to 39 minutes (64 commuters, 57.7%) for females.
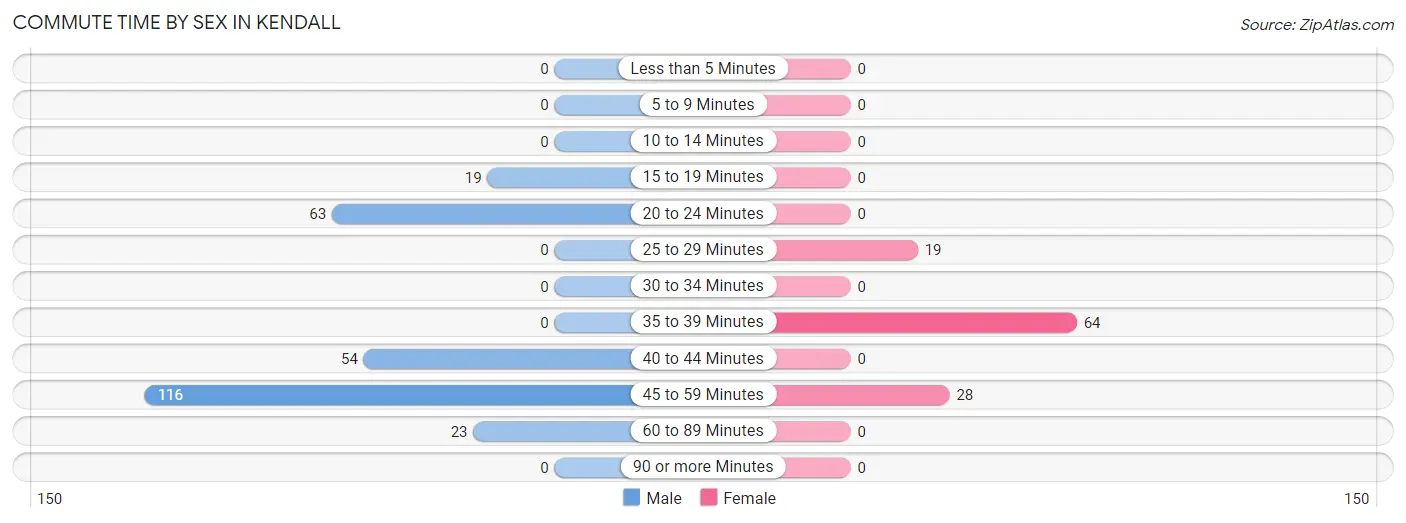
| Commute Time | Male | Female |
| Less than 5 Minutes | 0 (0.0%) | 0 (0.0%) |
| 5 to 9 Minutes | 0 (0.0%) | 0 (0.0%) |
| 10 to 14 Minutes | 0 (0.0%) | 0 (0.0%) |
| 15 to 19 Minutes | 19 (6.9%) | 0 (0.0%) |
| 20 to 24 Minutes | 63 (22.9%) | 0 (0.0%) |
| 25 to 29 Minutes | 0 (0.0%) | 19 (17.1%) |
| 30 to 34 Minutes | 0 (0.0%) | 0 (0.0%) |
| 35 to 39 Minutes | 0 (0.0%) | 64 (57.7%) |
| 40 to 44 Minutes | 54 (19.6%) | 0 (0.0%) |
| 45 to 59 Minutes | 116 (42.2%) | 28 (25.2%) |
| 60 to 89 Minutes | 23 (8.4%) | 0 (0.0%) |
| 90 or more Minutes | 0 (0.0%) | 0 (0.0%) |
Time of Departure to Work by Sex in Kendall
The most frequent times of departure to work in Kendall are 5:00 AM to 5:29 AM (123, 44.7%) for males and 8:00 AM to 8:29 AM (83, 74.8%) for females.
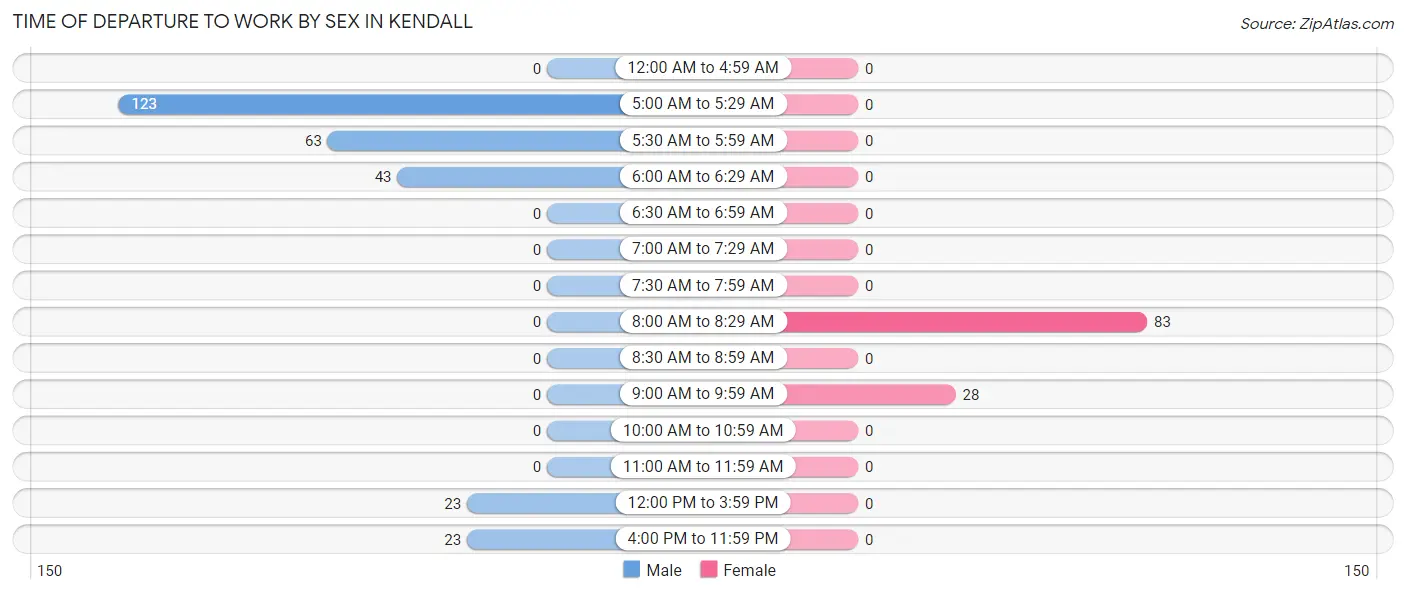
| Time of Departure | Male | Female |
| 12:00 AM to 4:59 AM | 0 (0.0%) | 0 (0.0%) |
| 5:00 AM to 5:29 AM | 123 (44.7%) | 0 (0.0%) |
| 5:30 AM to 5:59 AM | 63 (22.9%) | 0 (0.0%) |
| 6:00 AM to 6:29 AM | 43 (15.6%) | 0 (0.0%) |
| 6:30 AM to 6:59 AM | 0 (0.0%) | 0 (0.0%) |
| 7:00 AM to 7:29 AM | 0 (0.0%) | 0 (0.0%) |
| 7:30 AM to 7:59 AM | 0 (0.0%) | 0 (0.0%) |
| 8:00 AM to 8:29 AM | 0 (0.0%) | 83 (74.8%) |
| 8:30 AM to 8:59 AM | 0 (0.0%) | 0 (0.0%) |
| 9:00 AM to 9:59 AM | 0 (0.0%) | 28 (25.2%) |
| 10:00 AM to 10:59 AM | 0 (0.0%) | 0 (0.0%) |
| 11:00 AM to 11:59 AM | 0 (0.0%) | 0 (0.0%) |
| 12:00 PM to 3:59 PM | 23 (8.4%) | 0 (0.0%) |
| 4:00 PM to 11:59 PM | 23 (8.4%) | 0 (0.0%) |
| Total | 275 (100.0%) | 111 (100.0%) |
Housing Occupancy in Kendall
Occupancy by Ownership in Kendall
Of the total 286 dwellings in Kendall, owner-occupied units account for 142 (49.6%), while renter-occupied units make up 144 (50.3%).
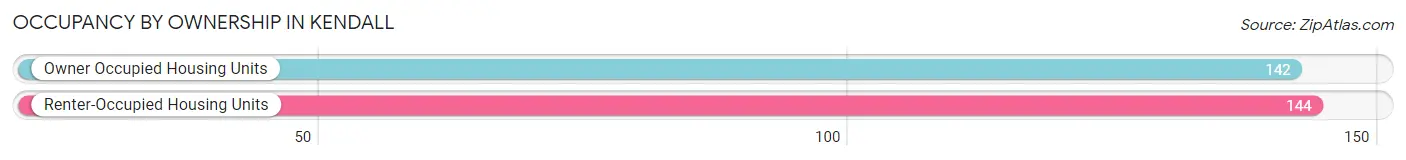
| Occupancy | # Housing Units | % Housing Units |
| Owner Occupied Housing Units | 142 | 49.6% |
| Renter-Occupied Housing Units | 144 | 50.3% |
| Total Occupied Housing Units | 286 | 100.0% |
Occupancy by Household Size in Kendall
| Household Size | # Housing Units | % Housing Units |
| 1-Person Household | 30 | 10.5% |
| 2-Person Household | 70 | 24.5% |
| 3-Person Household | 87 | 30.4% |
| 4+ Person Household | 99 | 34.6% |
| Total Housing Units | 286 | 100.0% |
Occupancy by Ownership by Household Size in Kendall
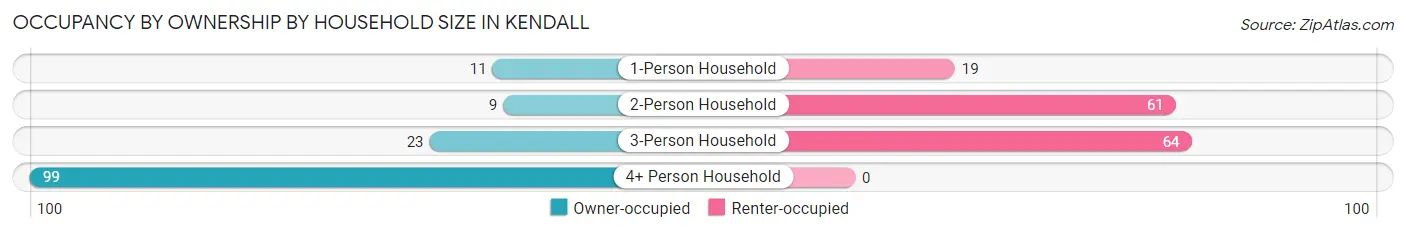
| Household Size | Owner-occupied | Renter-occupied |
| 1-Person Household | 11 (36.7%) | 19 (63.3%) |
| 2-Person Household | 9 (12.9%) | 61 (87.1%) |
| 3-Person Household | 23 (26.4%) | 64 (73.6%) |
| 4+ Person Household | 99 (100.0%) | 0 (0.0%) |
| Total Housing Units | 142 (49.6%) | 144 (50.3%) |
Occupancy by Educational Attainment in Kendall
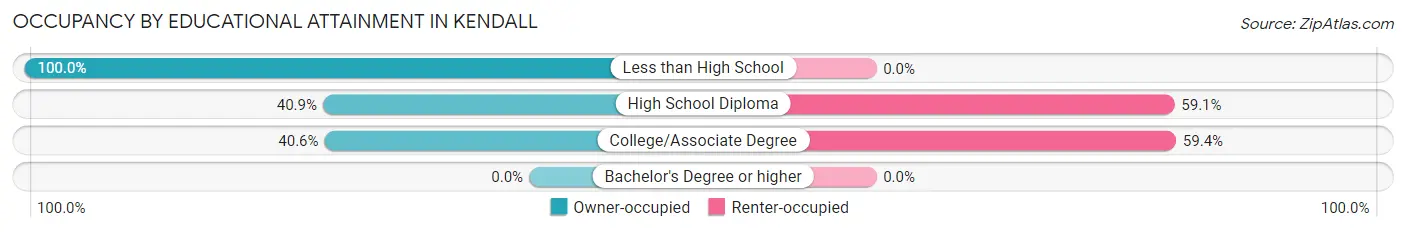
| Household Size | Owner-occupied | Renter-occupied |
| Less than High School | 43 (100.0%) | 0 (0.0%) |
| High School Diploma | 56 (40.9%) | 81 (59.1%) |
| College/Associate Degree | 43 (40.6%) | 63 (59.4%) |
| Bachelor's Degree or higher | 0 (0.0%) | 0 (0.0%) |
Occupancy by Age of Householder in Kendall
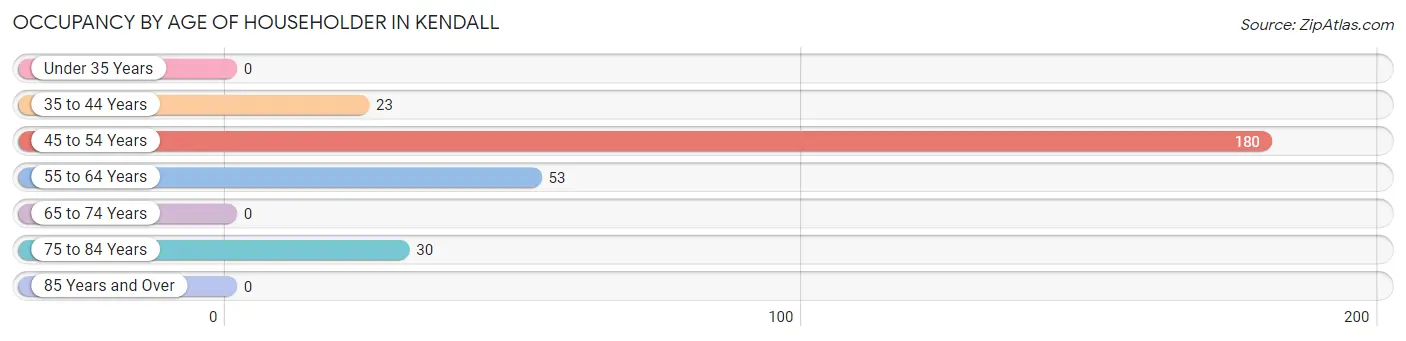
| Age Bracket | # Households | % Households |
| Under 35 Years | 0 | 0.0% |
| 35 to 44 Years | 23 | 8.0% |
| 45 to 54 Years | 180 | 62.9% |
| 55 to 64 Years | 53 | 18.5% |
| 65 to 74 Years | 0 | 0.0% |
| 75 to 84 Years | 30 | 10.5% |
| 85 Years and Over | 0 | 0.0% |
| Total | 286 | 100.0% |
Housing Finances in Kendall
Median Income by Occupancy in Kendall
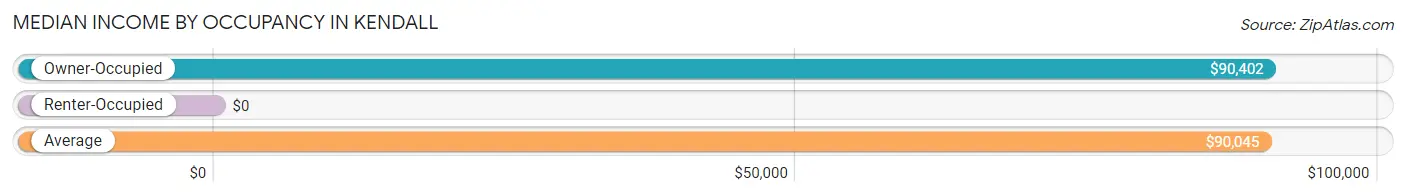
| Occupancy Type | # Households | Median Income |
| Owner-Occupied | 142 (49.6%) | $90,402 |
| Renter-Occupied | 144 (50.3%) | $0 |
| Average | 286 (100.0%) | $90,045 |
Occupancy by Householder Income Bracket in Kendall
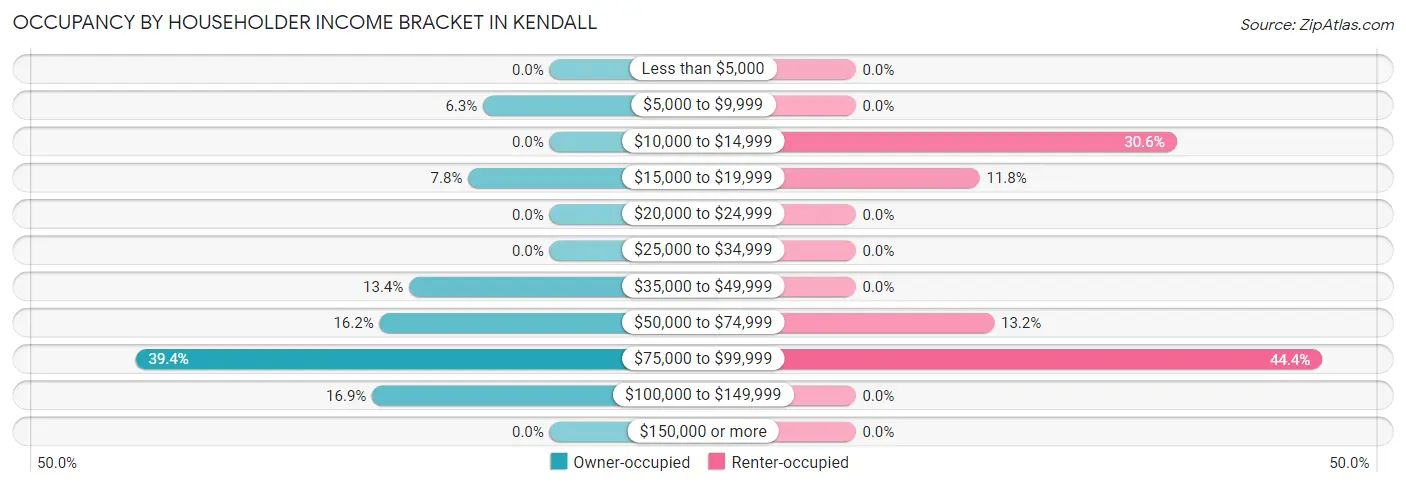
| Income Bracket | Owner-occupied | Renter-occupied |
| Less than $5,000 | 0 (0.0%) | 0 (0.0%) |
| $5,000 to $9,999 | 9 (6.3%) | 0 (0.0%) |
| $10,000 to $14,999 | 0 (0.0%) | 44 (30.6%) |
| $15,000 to $19,999 | 11 (7.7%) | 17 (11.8%) |
| $20,000 to $24,999 | 0 (0.0%) | 0 (0.0%) |
| $25,000 to $34,999 | 0 (0.0%) | 0 (0.0%) |
| $35,000 to $49,999 | 19 (13.4%) | 0 (0.0%) |
| $50,000 to $74,999 | 23 (16.2%) | 19 (13.2%) |
| $75,000 to $99,999 | 56 (39.4%) | 64 (44.4%) |
| $100,000 to $149,999 | 24 (16.9%) | 0 (0.0%) |
| $150,000 or more | 0 (0.0%) | 0 (0.0%) |
| Total | 142 (100.0%) | 144 (100.0%) |
Monthly Housing Cost Tiers in Kendall
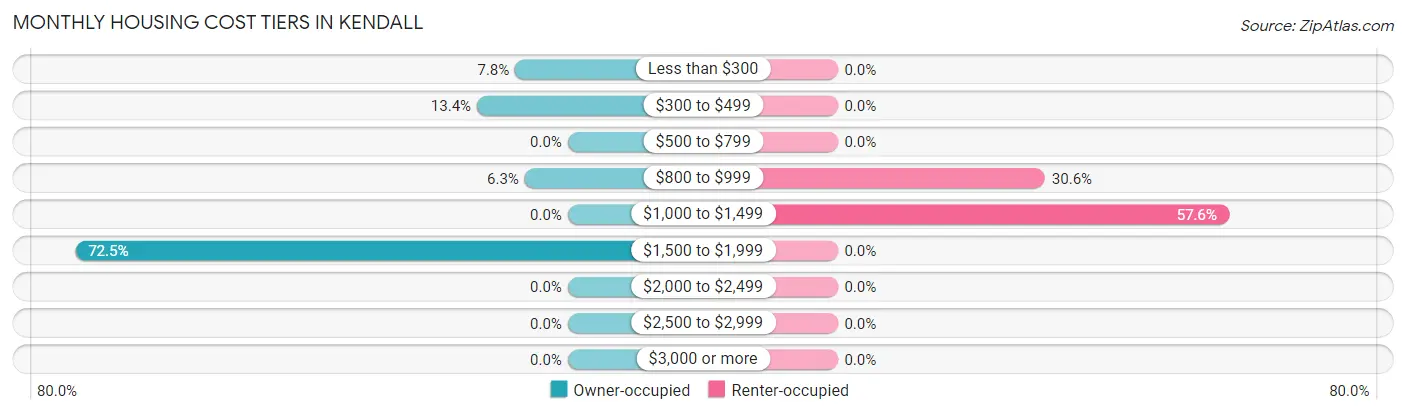
| Monthly Cost | Owner-occupied | Renter-occupied |
| Less than $300 | 11 (7.7%) | 0 (0.0%) |
| $300 to $499 | 19 (13.4%) | 0 (0.0%) |
| $500 to $799 | 0 (0.0%) | 0 (0.0%) |
| $800 to $999 | 9 (6.3%) | 44 (30.6%) |
| $1,000 to $1,499 | 0 (0.0%) | 83 (57.6%) |
| $1,500 to $1,999 | 103 (72.5%) | 0 (0.0%) |
| $2,000 to $2,499 | 0 (0.0%) | 0 (0.0%) |
| $2,500 to $2,999 | 0 (0.0%) | 0 (0.0%) |
| $3,000 or more | 0 (0.0%) | 0 (0.0%) |
| Total | 142 (100.0%) | 144 (100.0%) |
Physical Housing Characteristics in Kendall
Housing Structures in Kendall
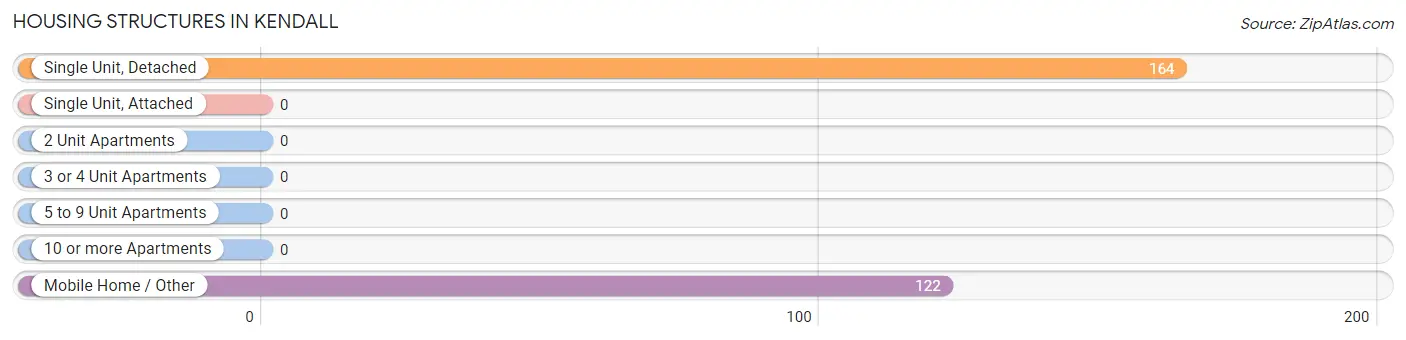
| Structure Type | # Housing Units | % Housing Units |
| Single Unit, Detached | 164 | 57.3% |
| Single Unit, Attached | 0 | 0.0% |
| 2 Unit Apartments | 0 | 0.0% |
| 3 or 4 Unit Apartments | 0 | 0.0% |
| 5 to 9 Unit Apartments | 0 | 0.0% |
| 10 or more Apartments | 0 | 0.0% |
| Mobile Home / Other | 122 | 42.7% |
| Total | 286 | 100.0% |
Housing Structures by Occupancy in Kendall
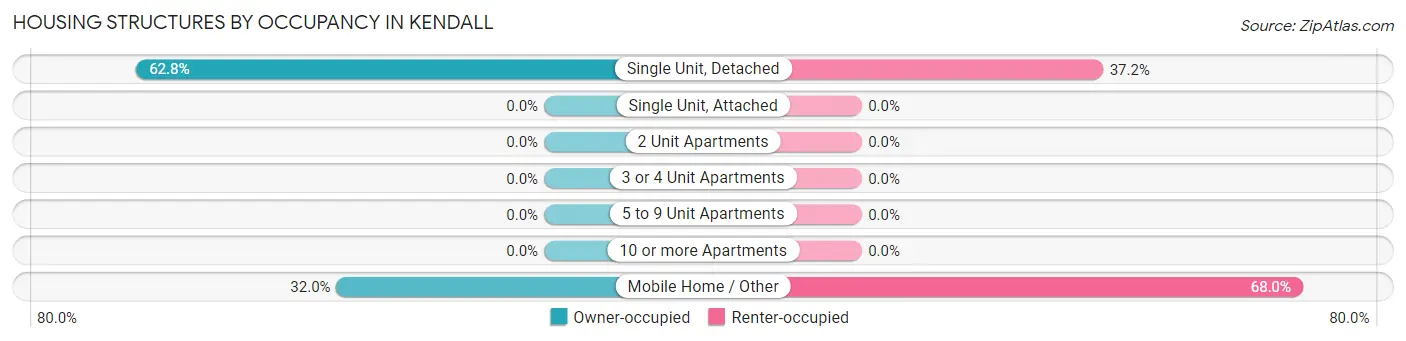
| Structure Type | Owner-occupied | Renter-occupied |
| Single Unit, Detached | 103 (62.8%) | 61 (37.2%) |
| Single Unit, Attached | 0 (0.0%) | 0 (0.0%) |
| 2 Unit Apartments | 0 (0.0%) | 0 (0.0%) |
| 3 or 4 Unit Apartments | 0 (0.0%) | 0 (0.0%) |
| 5 to 9 Unit Apartments | 0 (0.0%) | 0 (0.0%) |
| 10 or more Apartments | 0 (0.0%) | 0 (0.0%) |
| Mobile Home / Other | 39 (32.0%) | 83 (68.0%) |
| Total | 142 (49.6%) | 144 (50.3%) |
Housing Structures by Number of Rooms in Kendall
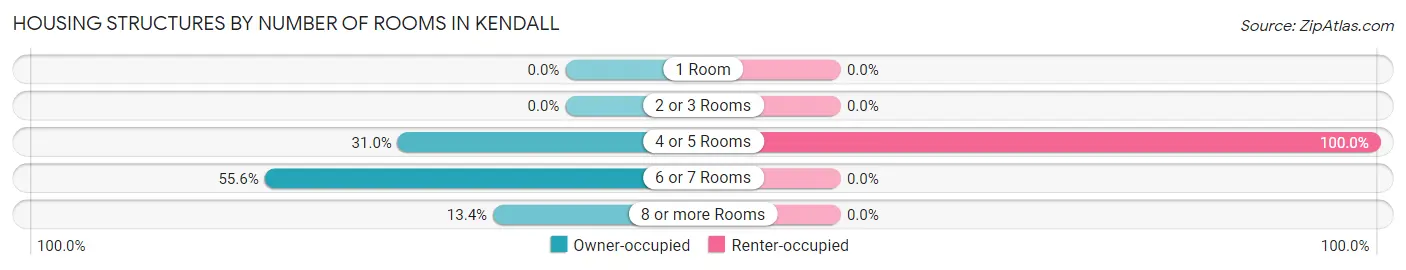
| Number of Rooms | Owner-occupied | Renter-occupied |
| 1 Room | 0 (0.0%) | 0 (0.0%) |
| 2 or 3 Rooms | 0 (0.0%) | 0 (0.0%) |
| 4 or 5 Rooms | 44 (31.0%) | 144 (100.0%) |
| 6 or 7 Rooms | 79 (55.6%) | 0 (0.0%) |
| 8 or more Rooms | 19 (13.4%) | 0 (0.0%) |
| Total | 142 (100.0%) | 144 (100.0%) |
Housing Structure by Heating Type in Kendall
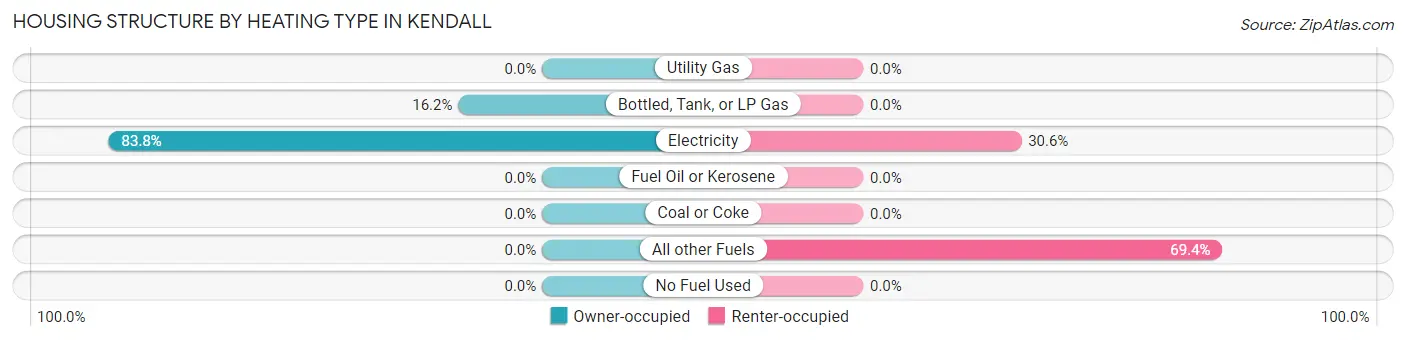
| Heating Type | Owner-occupied | Renter-occupied |
| Utility Gas | 0 (0.0%) | 0 (0.0%) |
| Bottled, Tank, or LP Gas | 23 (16.2%) | 0 (0.0%) |
| Electricity | 119 (83.8%) | 44 (30.6%) |
| Fuel Oil or Kerosene | 0 (0.0%) | 0 (0.0%) |
| Coal or Coke | 0 (0.0%) | 0 (0.0%) |
| All other Fuels | 0 (0.0%) | 100 (69.4%) |
| No Fuel Used | 0 (0.0%) | 0 (0.0%) |
| Total | 142 (100.0%) | 144 (100.0%) |
Household Vehicle Usage in Kendall
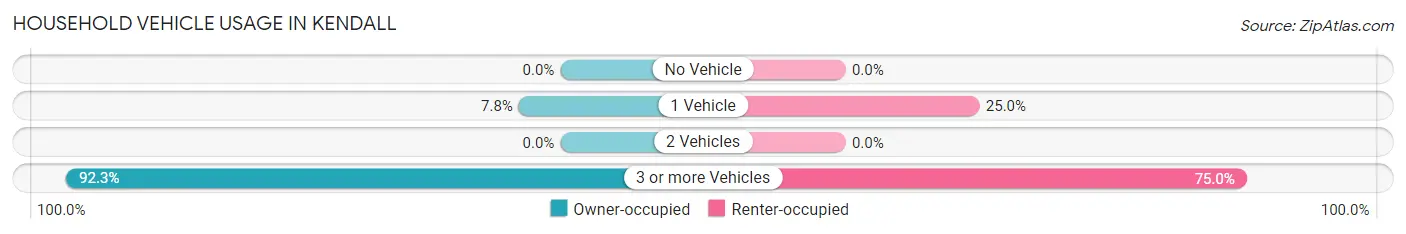
| Vehicles per Household | Owner-occupied | Renter-occupied |
| No Vehicle | 0 (0.0%) | 0 (0.0%) |
| 1 Vehicle | 11 (7.7%) | 36 (25.0%) |
| 2 Vehicles | 0 (0.0%) | 0 (0.0%) |
| 3 or more Vehicles | 131 (92.2%) | 108 (75.0%) |
| Total | 142 (100.0%) | 144 (100.0%) |
Real Estate & Mortgages in Kendall
Real Estate and Mortgage Overview in Kendall
| Characteristic | Without Mortgage | With Mortgage |
| Housing Units | 39 | 103 |
| Median Property Value | $50,500 | $0 |
| Median Household Income | - | - |
| Monthly Housing Costs | - | - |
| Real Estate Taxes | - | - |
Property Value by Mortgage Status in Kendall
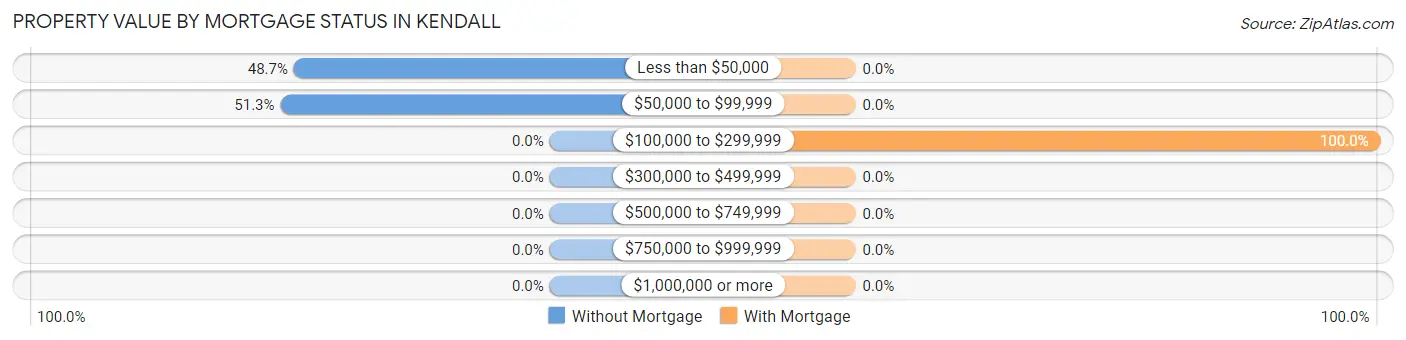
| Property Value | Without Mortgage | With Mortgage |
| Less than $50,000 | 19 (48.7%) | 0 (0.0%) |
| $50,000 to $99,999 | 20 (51.3%) | 0 (0.0%) |
| $100,000 to $299,999 | 0 (0.0%) | 103 (100.0%) |
| $300,000 to $499,999 | 0 (0.0%) | 0 (0.0%) |
| $500,000 to $749,999 | 0 (0.0%) | 0 (0.0%) |
| $750,000 to $999,999 | 0 (0.0%) | 0 (0.0%) |
| $1,000,000 or more | 0 (0.0%) | 0 (0.0%) |
| Total | 39 (100.0%) | 103 (100.0%) |
Household Income by Mortgage Status in Kendall
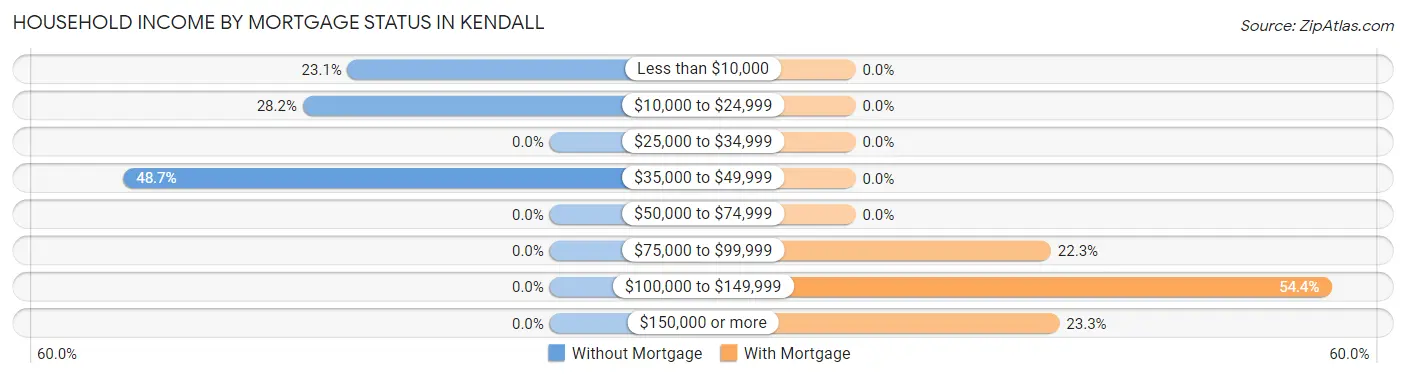
| Household Income | Without Mortgage | With Mortgage |
| Less than $10,000 | 9 (23.1%) | 0 (0.0%) |
| $10,000 to $24,999 | 11 (28.2%) | 0 (0.0%) |
| $25,000 to $34,999 | 0 (0.0%) | 0 (0.0%) |
| $35,000 to $49,999 | 19 (48.7%) | 0 (0.0%) |
| $50,000 to $74,999 | 0 (0.0%) | 0 (0.0%) |
| $75,000 to $99,999 | 0 (0.0%) | 23 (22.3%) |
| $100,000 to $149,999 | 0 (0.0%) | 56 (54.4%) |
| $150,000 or more | 0 (0.0%) | 24 (23.3%) |
| Total | 39 (100.0%) | 103 (100.0%) |
Property Value to Household Income Ratio in Kendall
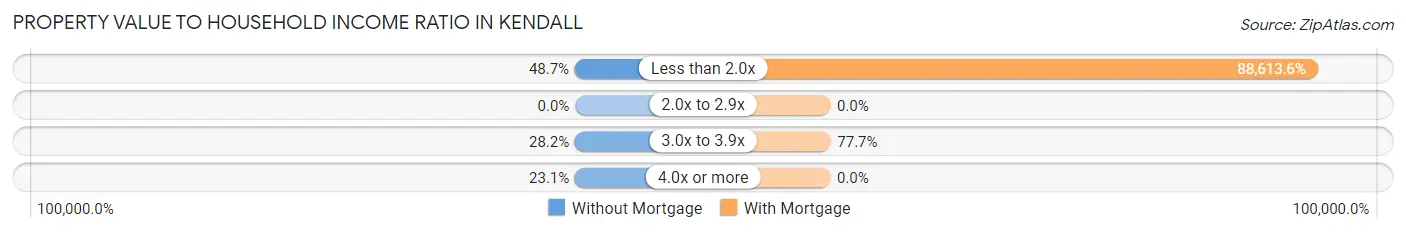
| Value-to-Income Ratio | Without Mortgage | With Mortgage |
| Less than 2.0x | 19 (48.7%) | 91,272 (88,613.6%) |
| 2.0x to 2.9x | 0 (0.0%) | 0 (0.0%) |
| 3.0x to 3.9x | 11 (28.2%) | 80 (77.7%) |
| 4.0x or more | 9 (23.1%) | 0 (0.0%) |
| Total | 39 (100.0%) | 103 (100.0%) |
Real Estate Taxes by Mortgage Status in Kendall
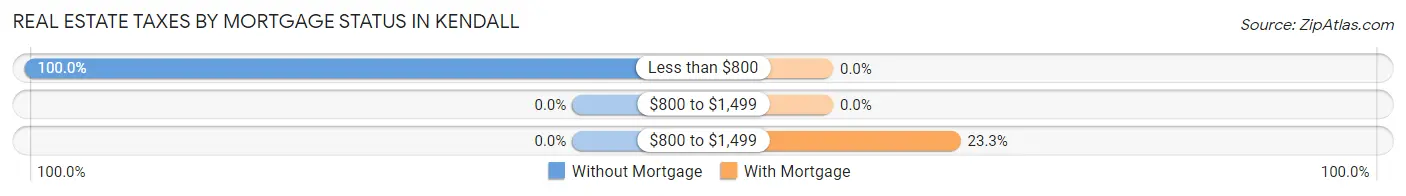
| Property Taxes | Without Mortgage | With Mortgage |
| Less than $800 | 39 (100.0%) | 0 (0.0%) |
| $800 to $1,499 | 0 (0.0%) | 0 (0.0%) |
| $800 to $1,499 | 0 (0.0%) | 24 (23.3%) |
| Total | 39 (100.0%) | 103 (100.0%) |
Health & Disability in Kendall
Health Insurance Coverage by Age in Kendall
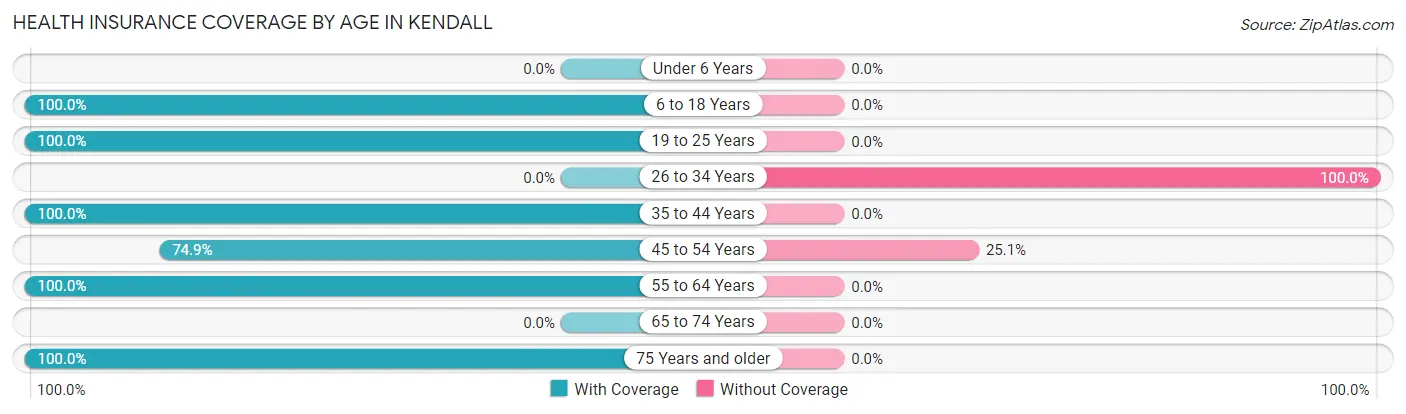
| Age Bracket | With Coverage | Without Coverage |
| Under 6 Years | 0 (0.0%) | 0 (0.0%) |
| 6 to 18 Years | 210 (100.0%) | 0 (0.0%) |
| 19 to 25 Years | 184 (100.0%) | 0 (0.0%) |
| 26 to 34 Years | 0 (0.0%) | 17 (100.0%) |
| 35 to 44 Years | 114 (100.0%) | 0 (0.0%) |
| 45 to 54 Years | 167 (74.9%) | 56 (25.1%) |
| 55 to 64 Years | 181 (100.0%) | 0 (0.0%) |
| 65 to 74 Years | 0 (0.0%) | 0 (0.0%) |
| 75 Years and older | 30 (100.0%) | 0 (0.0%) |
| Total | 886 (92.4%) | 73 (7.6%) |
Health Insurance Coverage by Citizenship Status in Kendall
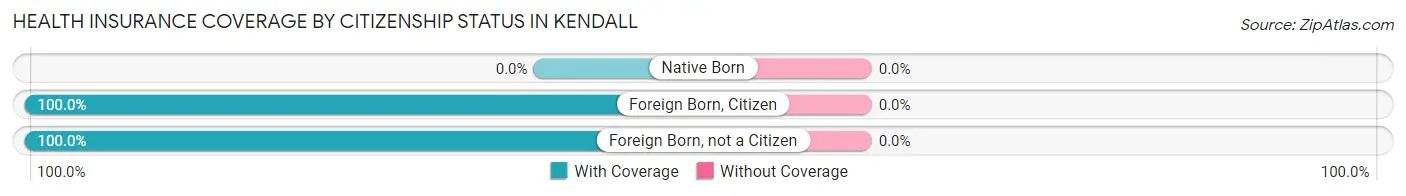
| Citizenship Status | With Coverage | Without Coverage |
| Native Born | 0 (0.0%) | 0 (0.0%) |
| Foreign Born, Citizen | 210 (100.0%) | 0 (0.0%) |
| Foreign Born, not a Citizen | 184 (100.0%) | 0 (0.0%) |
Health Insurance Coverage by Household Income in Kendall
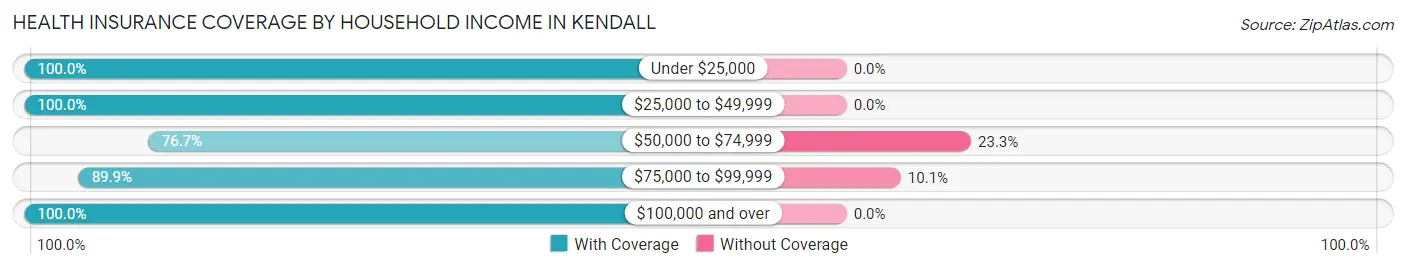
| Household Income | With Coverage | Without Coverage |
| Under $25,000 | 149 (100.0%) | 0 (0.0%) |
| $25,000 to $49,999 | 91 (100.0%) | 0 (0.0%) |
| $50,000 to $74,999 | 56 (76.7%) | 17 (23.3%) |
| $75,000 to $99,999 | 496 (89.9%) | 56 (10.1%) |
| $100,000 and over | 94 (100.0%) | 0 (0.0%) |
Public vs Private Health Insurance Coverage by Age in Kendall
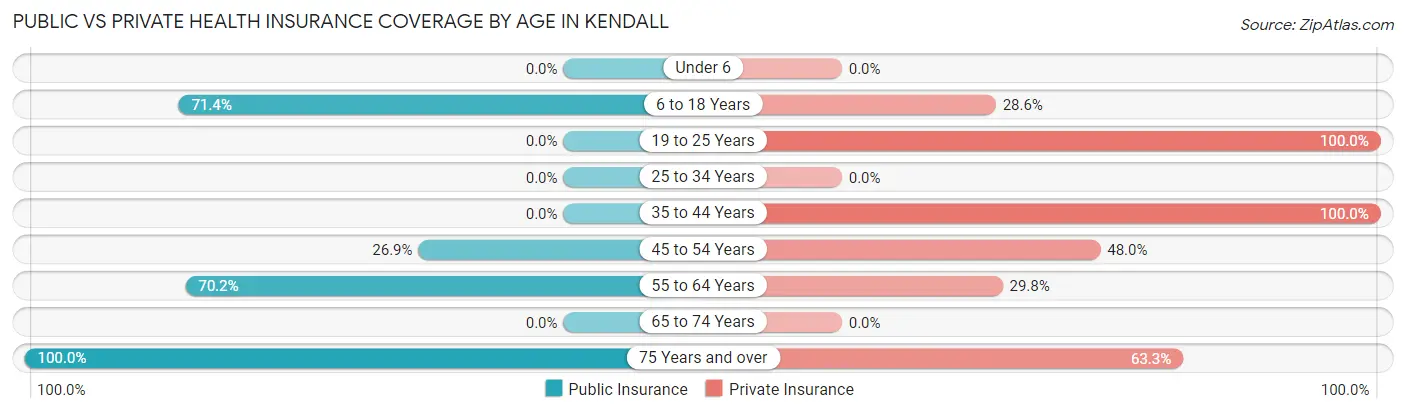
| Age Bracket | Public Insurance | Private Insurance |
| Under 6 | 0 (0.0%) | 0 (0.0%) |
| 6 to 18 Years | 150 (71.4%) | 60 (28.6%) |
| 19 to 25 Years | 0 (0.0%) | 184 (100.0%) |
| 25 to 34 Years | 0 (0.0%) | 0 (0.0%) |
| 35 to 44 Years | 0 (0.0%) | 114 (100.0%) |
| 45 to 54 Years | 60 (26.9%) | 107 (48.0%) |
| 55 to 64 Years | 127 (70.2%) | 54 (29.8%) |
| 65 to 74 Years | 0 (0.0%) | 0 (0.0%) |
| 75 Years and over | 30 (100.0%) | 19 (63.3%) |
| Total | 367 (38.3%) | 538 (56.1%) |
Disability Status by Sex by Age in Kendall
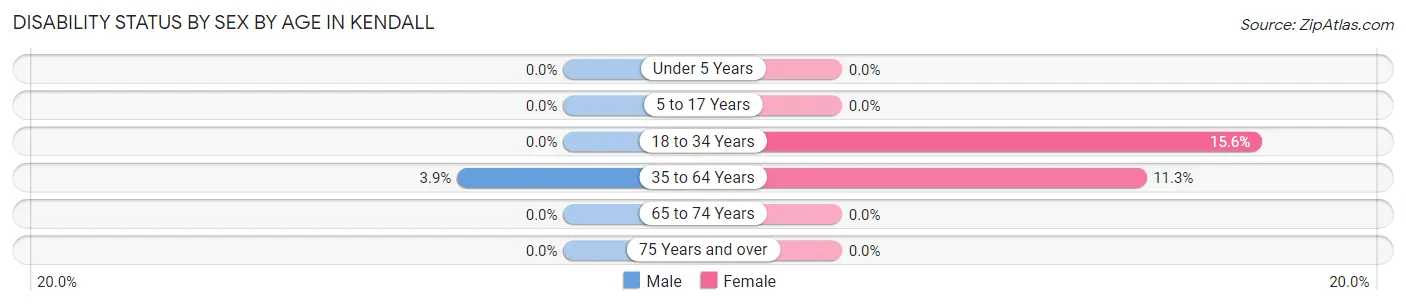
| Age Bracket | Male | Female |
| Under 5 Years | 0 (0.0%) | 0 (0.0%) |
| 5 to 17 Years | 0 (0.0%) | 0 (0.0%) |
| 18 to 34 Years | 0 (0.0%) | 17 (15.6%) |
| 35 to 64 Years | 11 (3.9%) | 27 (11.3%) |
| 65 to 74 Years | 0 (0.0%) | 0 (0.0%) |
| 75 Years and over | 0 (0.0%) | 0 (0.0%) |
Disability Class by Sex by Age in Kendall
Disability Class: Hearing Difficulty
| Age Bracket | Male | Female |
| Under 5 Years | 0 (0.0%) | 0 (0.0%) |
| 5 to 17 Years | 0 (0.0%) | 0 (0.0%) |
| 18 to 34 Years | 0 (0.0%) | 0 (0.0%) |
| 35 to 64 Years | 0 (0.0%) | 0 (0.0%) |
| 65 to 74 Years | 0 (0.0%) | 0 (0.0%) |
| 75 Years and over | 0 (0.0%) | 0 (0.0%) |
Disability Class: Vision Difficulty
| Age Bracket | Male | Female |
| Under 5 Years | 0 (0.0%) | 0 (0.0%) |
| 5 to 17 Years | 0 (0.0%) | 0 (0.0%) |
| 18 to 34 Years | 0 (0.0%) | 0 (0.0%) |
| 35 to 64 Years | 0 (0.0%) | 0 (0.0%) |
| 65 to 74 Years | 0 (0.0%) | 0 (0.0%) |
| 75 Years and over | 0 (0.0%) | 0 (0.0%) |
Disability Class: Cognitive Difficulty
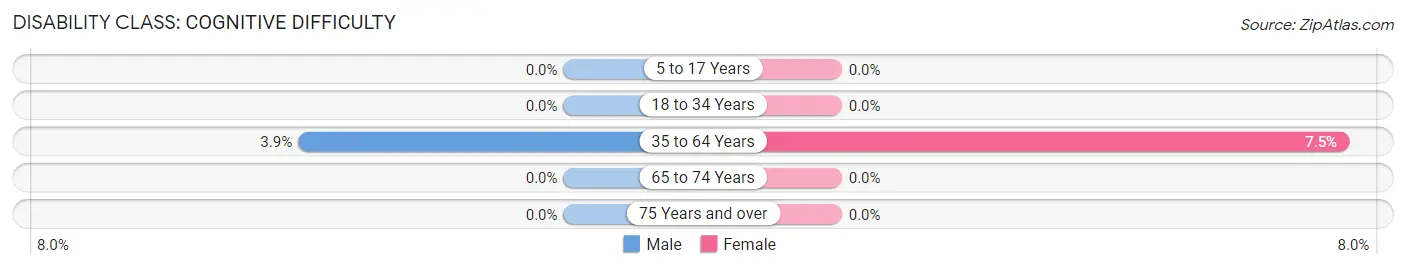
| Age Bracket | Male | Female |
| 5 to 17 Years | 0 (0.0%) | 0 (0.0%) |
| 18 to 34 Years | 0 (0.0%) | 0 (0.0%) |
| 35 to 64 Years | 11 (3.9%) | 18 (7.5%) |
| 65 to 74 Years | 0 (0.0%) | 0 (0.0%) |
| 75 Years and over | 0 (0.0%) | 0 (0.0%) |
Disability Class: Ambulatory Difficulty
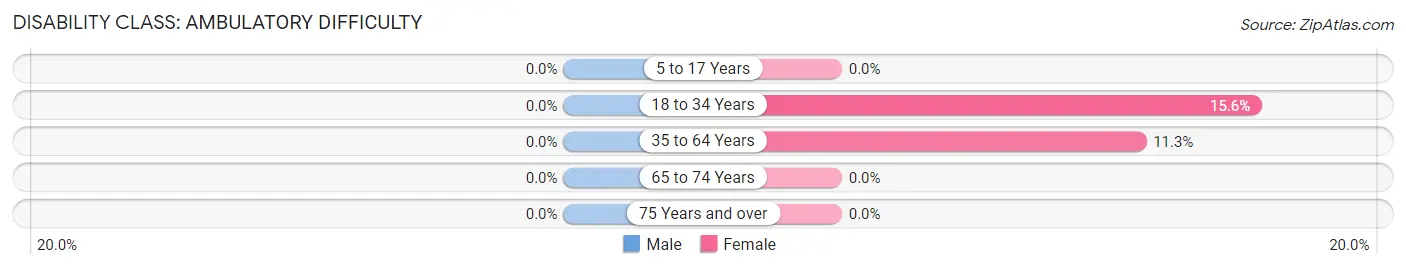
| Age Bracket | Male | Female |
| 5 to 17 Years | 0 (0.0%) | 0 (0.0%) |
| 18 to 34 Years | 0 (0.0%) | 17 (15.6%) |
| 35 to 64 Years | 0 (0.0%) | 27 (11.3%) |
| 65 to 74 Years | 0 (0.0%) | 0 (0.0%) |
| 75 Years and over | 0 (0.0%) | 0 (0.0%) |
Disability Class: Self-Care Difficulty
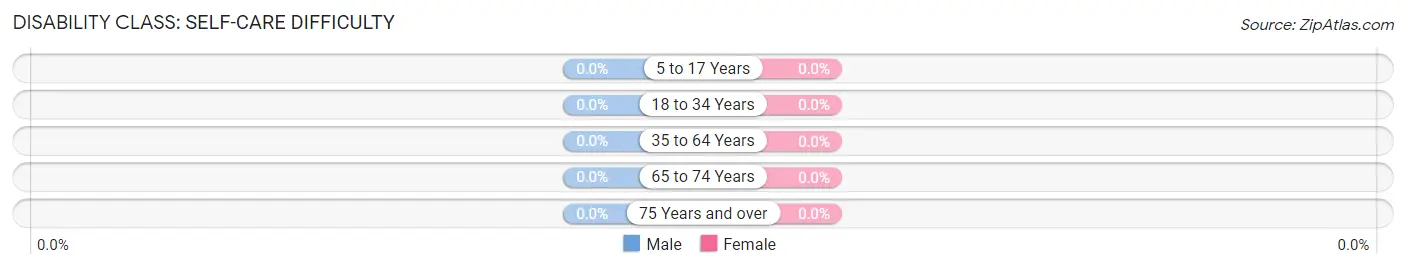
| Age Bracket | Male | Female |
| 5 to 17 Years | 0 (0.0%) | 0 (0.0%) |
| 18 to 34 Years | 0 (0.0%) | 0 (0.0%) |
| 35 to 64 Years | 0 (0.0%) | 0 (0.0%) |
| 65 to 74 Years | 0 (0.0%) | 0 (0.0%) |
| 75 Years and over | 0 (0.0%) | 0 (0.0%) |
Technology Access in Kendall
Computing Device Access in Kendall
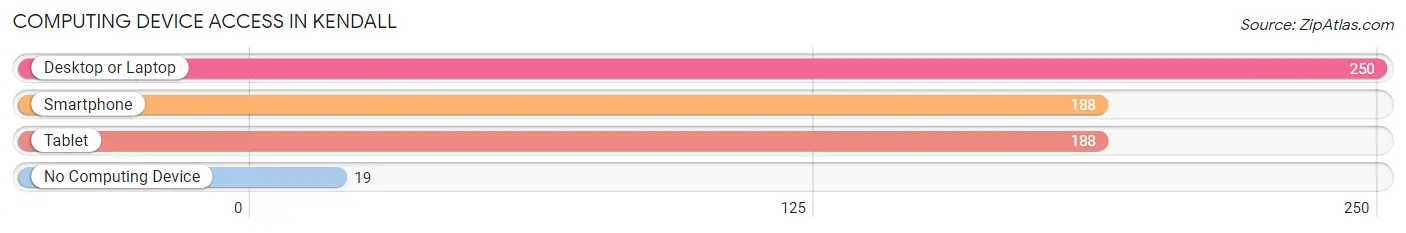
| Device Type | # Households | % Households |
| Desktop or Laptop | 250 | 87.4% |
| Smartphone | 188 | 65.7% |
| Tablet | 188 | 65.7% |
| No Computing Device | 19 | 6.6% |
| Total | 286 | 100.0% |
Internet Access in Kendall
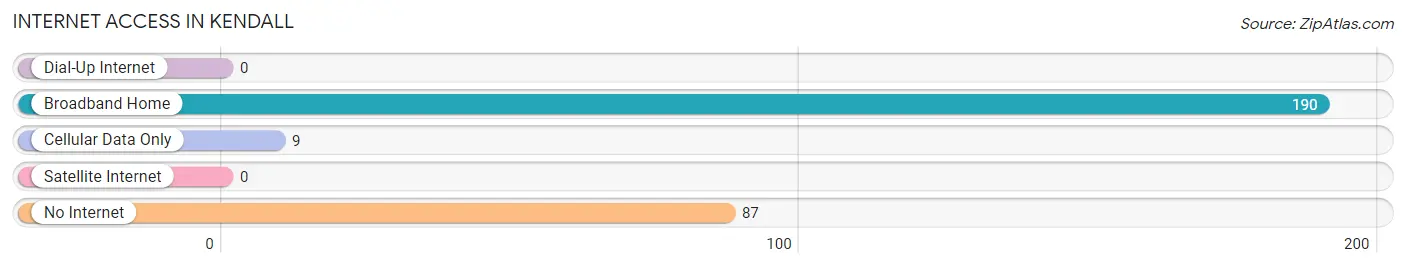
| Internet Type | # Households | % Households |
| Dial-Up Internet | 0 | 0.0% |
| Broadband Home | 190 | 66.4% |
| Cellular Data Only | 9 | 3.2% |
| Satellite Internet | 0 | 0.0% |
| No Internet | 87 | 30.4% |
| Total | 286 | 100.0% |
Kendall Summary
Kendall, Washington is a small unincorporated community located in the Cascade Mountains of King County, Washington. It is situated in the foothills of the Cascade Range, approximately 25 miles east of Seattle. The population of Kendall was estimated to be around 1,000 in 2020.
History
Kendall was first settled in the late 1800s by homesteaders who were attracted to the area by its abundant natural resources. The first settlers were mostly of Scandinavian descent, and the community was named after a prominent local family, the Kendalls. The first post office was established in 1891, and the town was officially incorporated in 1895.
The early settlers of Kendall were primarily farmers and loggers, and the town quickly grew to become a bustling center of commerce and industry. The town was home to several sawmills, a flour mill, a creamery, and a general store. In the early 1900s, the town was also home to a large number of saloons and gambling halls.
Geography
Kendall is located in the foothills of the Cascade Range, approximately 25 miles east of Seattle. The town is situated at an elevation of 1,000 feet, and is surrounded by lush forests and rolling hills. The nearby Snoqualmie River provides a source of recreation for the town's residents.
The climate in Kendall is mild and temperate, with warm summers and cool winters. The average annual temperature is around 50 degrees Fahrenheit, and the average annual precipitation is around 40 inches.
Economy
Kendall's economy is largely based on tourism and recreation. The town is home to several popular outdoor recreation areas, including the Snoqualmie River, which is a popular destination for fishing, rafting, and kayaking. The nearby Cascade Mountains provide a variety of outdoor activities, including hiking, camping, and skiing.
The town is also home to several small businesses, including restaurants, cafes, and retail stores. The town is also home to a number of small manufacturing companies, which produce a variety of products, including furniture, clothing, and electronics.
Demographics
Kendall is a predominantly white community, with a population of around 1,000 people. The median household income is around $50,000, and the median home value is around $250,000. The town is home to a variety of religious denominations, including Protestant, Catholic, and Jewish.
Kendall is a small, close-knit community, and the town's residents are known for their friendly and welcoming attitude. The town is home to a variety of cultural events, including an annual Fourth of July parade and a summer music festival. The town is also home to a number of local organizations, including a volunteer fire department and a community center.
Common Questions
What is Per Capita Income in Kendall?
Per Capita income in Kendall is $19,556.
What is the Median Family Income in Kendall?
Median Family Income in Kendall is $61,897.
What is the Median Household income in Kendall?
Median Household Income in Kendall is $90,045.
What is Inequality or Gini Index in Kendall?
Inequality or Gini Index in Kendall is 0.33.
What is the Total Population of Kendall?
Total Population of Kendall is 959.
What is the Total Male Population of Kendall?
Total Male Population of Kendall is 396.
What is the Total Female Population of Kendall?
Total Female Population of Kendall is 563.
What is the Ratio of Males per 100 Females in Kendall?
There are 70.34 Males per 100 Females in Kendall.
What is the Ratio of Females per 100 Males in Kendall?
There are 142.17 Females per 100 Males in Kendall.
What is the Median Population Age in Kendall?
Median Population Age in Kendall is 39.2 Years.
What is the Average Family Size in Kendall
Average Family Size in Kendall is 3.7 People.
What is the Average Household Size in Kendall
Average Household Size in Kendall is 3.4 People.
How Large is the Labor Force in Kendall?
There are 502 People in the Labor Forcein in Kendall.
What is the Percentage of People in the Labor Force in Kendall?
62.2% of People are in the Labor Force in Kendall.
What is the Unemployment Rate in Kendall?
Unemployment Rate in Kendall is 21.3%.