Summit, WA Map & Demographics
Summit Map
Summit Overview
$45,082
PER CAPITA INCOME
$132,750
AVG FAMILY INCOME
$101,157
AVG HOUSEHOLD INCOME
33.4%
WAGE / INCOME GAP [ % ]
66.6¢/ $1
WAGE / INCOME GAP [ $ ]
0.38
INEQUALITY / GINI INDEX
8,819
TOTAL POPULATION
4,458
MALE POPULATION
4,361
FEMALE POPULATION
102.22
MALES / 100 FEMALES
97.82
FEMALES / 100 MALES
44.5
MEDIAN AGE
3.0
AVG FAMILY SIZE
2.6
AVG HOUSEHOLD SIZE
4,489
LABOR FORCE [ PEOPLE ]
60.1%
PERCENT IN LABOR FORCE
6.6%
UNEMPLOYMENT RATE
Income in Summit
Income Overview in Summit
Per Capita Income in Summit is $45,082, while median incomes of families and households are $132,750 and $101,157 respectively.
| Characteristic | Number | Measure |
| Per Capita Income | 8,819 | $45,082 |
| Median Family Income | 2,411 | $132,750 |
| Mean Family Income | 2,411 | $140,489 |
| Median Household Income | 3,362 | $101,157 |
| Mean Household Income | 3,362 | $118,427 |
| Income Deficit | 2,411 | $0 |
| Wage / Income Gap (%) | 8,819 | 33.41% |
| Wage / Income Gap ($) | 8,819 | 66.59¢ per $1 |
| Gini / Inequality Index | 8,819 | 0.38 |
Earnings by Sex in Summit
Average Earnings in Summit are $53,036, $63,298 for men and $42,151 for women, a difference of 33.4%.
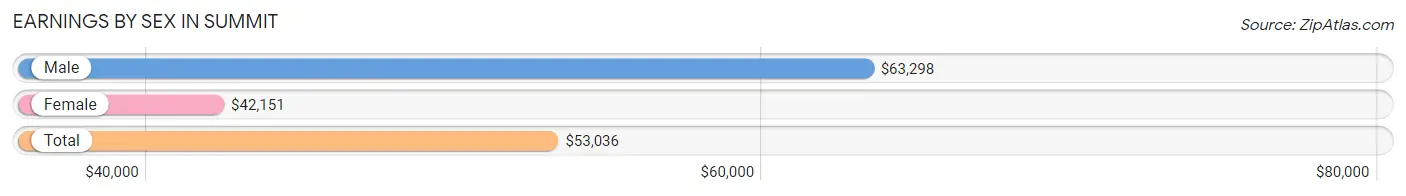
| Sex | Number | Average Earnings |
| Male | 2,534 (53.9%) | $63,298 |
| Female | 2,167 (46.1%) | $42,151 |
| Total | 4,701 (100.0%) | $53,036 |
Earnings by Sex by Income Bracket in Summit
The most common earnings brackets in Summit are $100,000+ for men (821 | 32.4%) and $75,000 to $99,999 for women (267 | 12.3%).
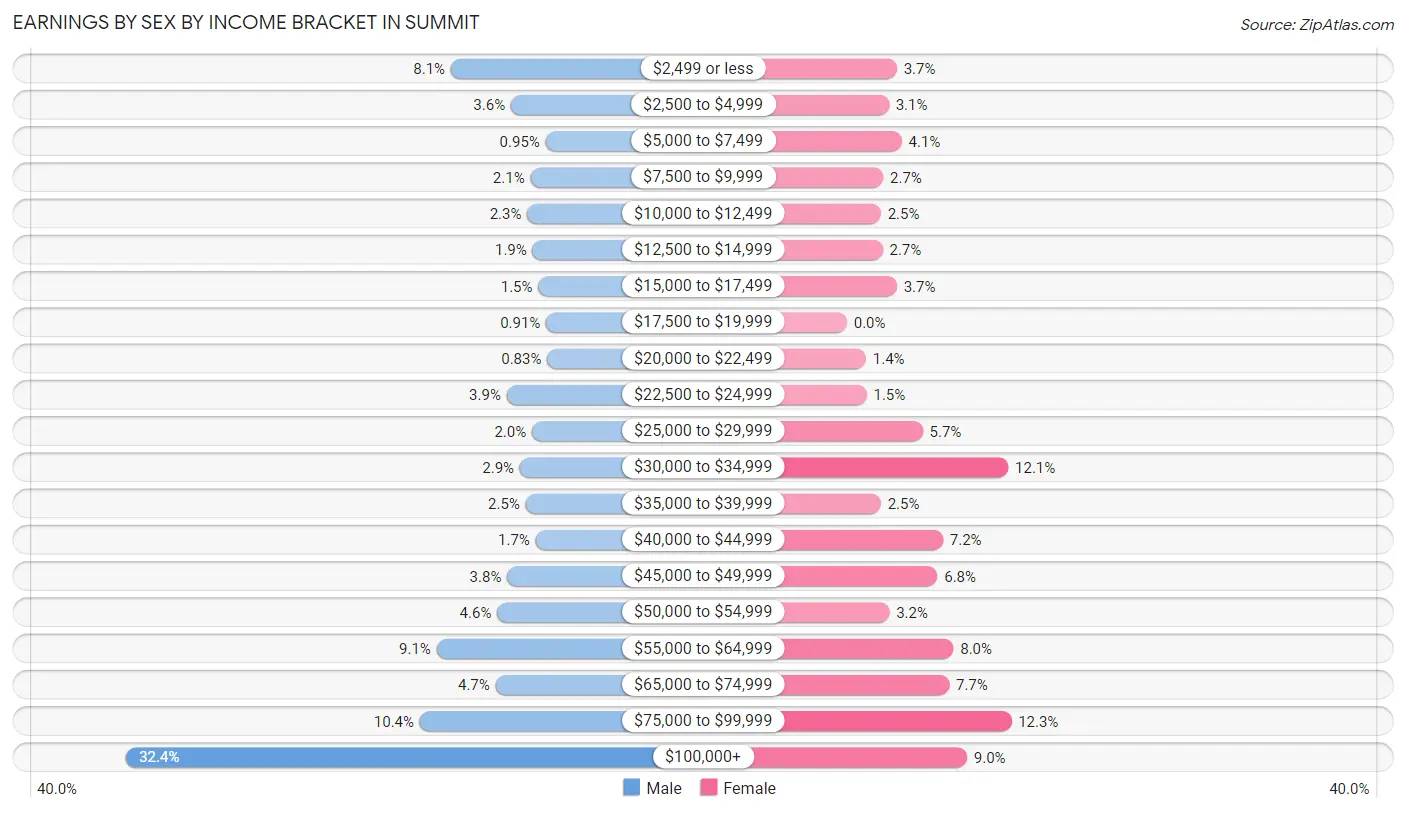
| Income | Male | Female |
| $2,499 or less | 204 (8.1%) | 81 (3.7%) |
| $2,500 to $4,999 | 90 (3.5%) | 68 (3.1%) |
| $5,000 to $7,499 | 24 (0.9%) | 89 (4.1%) |
| $7,500 to $9,999 | 53 (2.1%) | 59 (2.7%) |
| $10,000 to $12,499 | 59 (2.3%) | 55 (2.5%) |
| $12,500 to $14,999 | 49 (1.9%) | 58 (2.7%) |
| $15,000 to $17,499 | 38 (1.5%) | 81 (3.7%) |
| $17,500 to $19,999 | 23 (0.9%) | 0 (0.0%) |
| $20,000 to $22,499 | 21 (0.8%) | 31 (1.4%) |
| $22,500 to $24,999 | 98 (3.9%) | 32 (1.5%) |
| $25,000 to $29,999 | 50 (2.0%) | 123 (5.7%) |
| $30,000 to $34,999 | 73 (2.9%) | 262 (12.1%) |
| $35,000 to $39,999 | 62 (2.5%) | 55 (2.5%) |
| $40,000 to $44,999 | 43 (1.7%) | 156 (7.2%) |
| $45,000 to $49,999 | 97 (3.8%) | 147 (6.8%) |
| $50,000 to $54,999 | 116 (4.6%) | 69 (3.2%) |
| $55,000 to $64,999 | 231 (9.1%) | 173 (8.0%) |
| $65,000 to $74,999 | 119 (4.7%) | 166 (7.7%) |
| $75,000 to $99,999 | 263 (10.4%) | 267 (12.3%) |
| $100,000+ | 821 (32.4%) | 195 (9.0%) |
| Total | 2,534 (100.0%) | 2,167 (100.0%) |
Earnings by Sex by Educational Attainment in Summit
Average earnings in Summit are $78,563 for men and $43,726 for women, a difference of 44.3%. Men with an educational attainment of college or associate's degree enjoy the highest average annual earnings of $105,634, while those with high school diploma education earn the least with $55,202. Women with an educational attainment of graduate degree earn the most with the average annual earnings of $62,273, while those with less than high school education have the smallest earnings of $15,982.
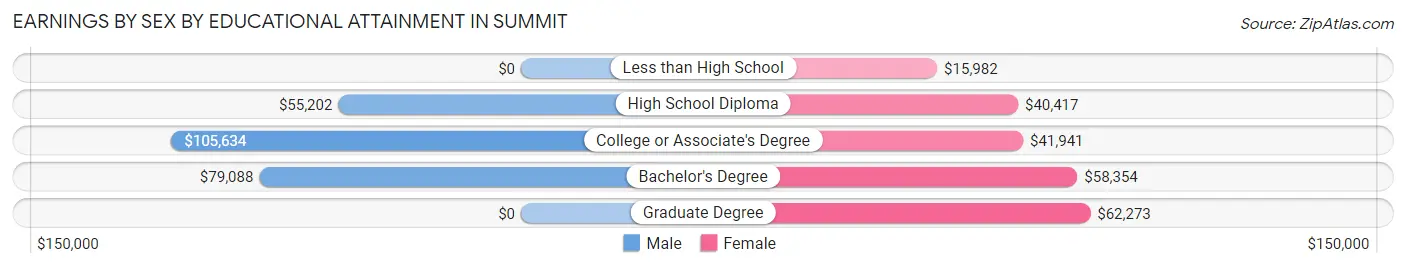
| Educational Attainment | Male Income | Female Income |
| Less than High School | - | - |
| High School Diploma | $55,202 | $40,417 |
| College or Associate's Degree | $105,634 | $41,941 |
| Bachelor's Degree | $79,088 | $58,354 |
| Graduate Degree | - | - |
| Total | $78,563 | $43,726 |
Family Income in Summit
Family Income Brackets in Summit
According to the Summit family income data, there are 581 families falling into the $100,000 to $149,999 income range, which is the most common income bracket and makes up 24.1% of all families. Conversely, the $10,000 to $14,999 income bracket is the least frequent group with only 2 families (0.1%) belonging to this category.
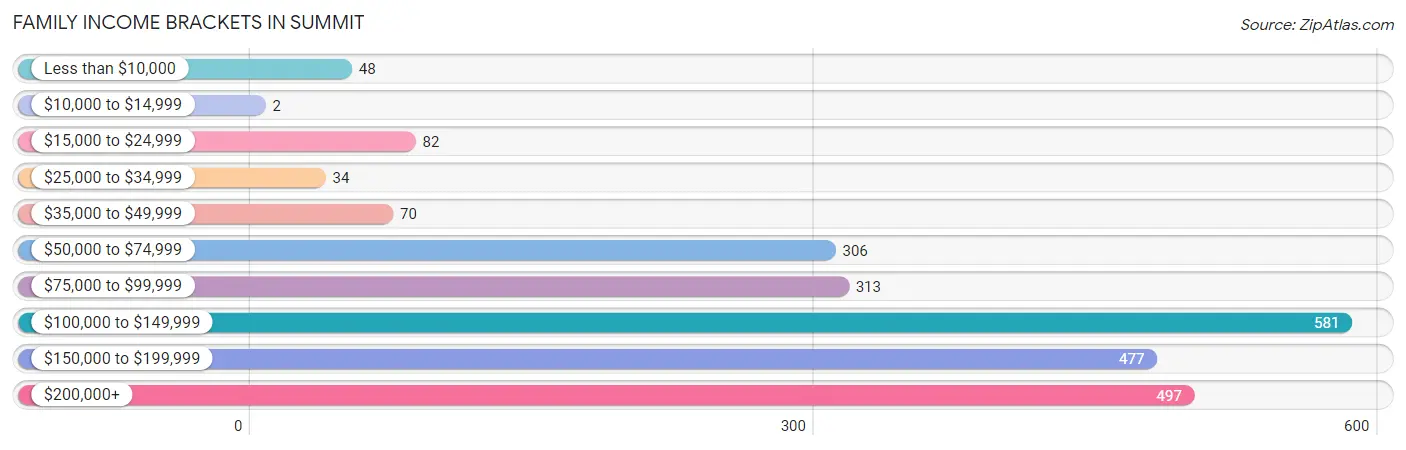
| Income Bracket | # Families | % Families |
| Less than $10,000 | 48 | 2.0% |
| $10,000 to $14,999 | 2 | 0.1% |
| $15,000 to $24,999 | 82 | 3.4% |
| $25,000 to $34,999 | 34 | 1.4% |
| $35,000 to $49,999 | 70 | 2.9% |
| $50,000 to $74,999 | 306 | 12.7% |
| $75,000 to $99,999 | 313 | 13.0% |
| $100,000 to $149,999 | 581 | 24.1% |
| $150,000 to $199,999 | 477 | 19.8% |
| $200,000+ | 497 | 20.6% |
Family Income by Famaliy Size in Summit
5-person families (195 | 8.1%) account for the highest median family income in Summit with $179,097 per family, while 2-person families (1,215 | 50.4%) have the highest median income of $51,820 per family member.
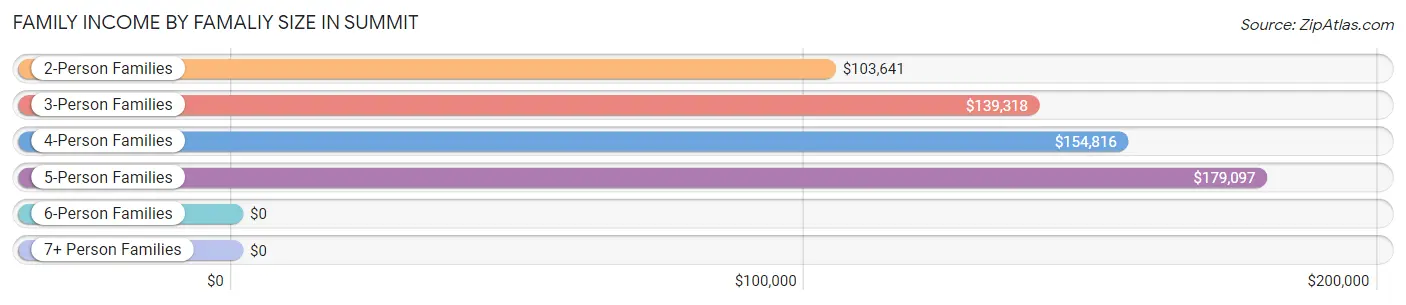
| Income Bracket | # Families | Median Income |
| 2-Person Families | 1,215 (50.4%) | $103,641 |
| 3-Person Families | 482 (20.0%) | $139,318 |
| 4-Person Families | 429 (17.8%) | $154,816 |
| 5-Person Families | 195 (8.1%) | $179,097 |
| 6-Person Families | 39 (1.6%) | $0 |
| 7+ Person Families | 51 (2.1%) | $0 |
| Total | 2,411 (100.0%) | $132,750 |
Family Income by Number of Earners in Summit
The median family income in Summit is $132,750, with families comprising 3+ earners (381) having the highest median family income of $181,806, while families with no earners (362) have the lowest median family income of $61,250, accounting for 15.8% and 15.0% of families, respectively.
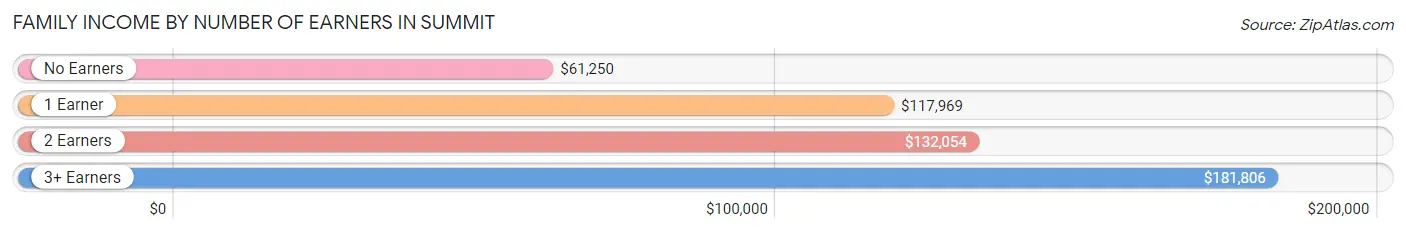
| Number of Earners | # Families | Median Income |
| No Earners | 362 (15.0%) | $61,250 |
| 1 Earner | 799 (33.1%) | $117,969 |
| 2 Earners | 869 (36.0%) | $132,054 |
| 3+ Earners | 381 (15.8%) | $181,806 |
| Total | 2,411 (100.0%) | $132,750 |
Household Income in Summit
Household Income Brackets in Summit
With 656 households falling in the category, the $100,000 to $149,999 income range is the most frequent in Summit, accounting for 19.5% of all households. In contrast, only 24 households (0.7%) fall into the $10,000 to $14,999 income bracket, making it the least populous group.
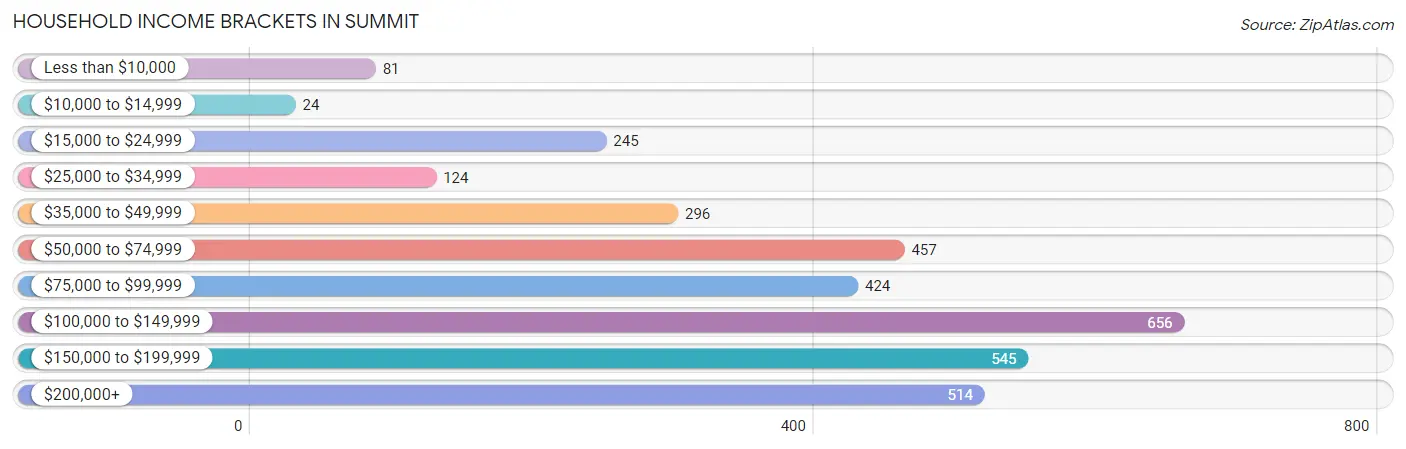
| Income Bracket | # Households | % Households |
| Less than $10,000 | 81 | 2.4% |
| $10,000 to $14,999 | 24 | 0.7% |
| $15,000 to $24,999 | 245 | 7.3% |
| $25,000 to $34,999 | 124 | 3.7% |
| $35,000 to $49,999 | 296 | 8.8% |
| $50,000 to $74,999 | 457 | 13.6% |
| $75,000 to $99,999 | 424 | 12.6% |
| $100,000 to $149,999 | 656 | 19.5% |
| $150,000 to $199,999 | 545 | 16.2% |
| $200,000+ | 514 | 15.3% |
Household Income by Householder Age in Summit
The median household income in Summit is $101,157, with the highest median household income of $145,153 found in the 25 to 44 years age bracket for the primary householder. A total of 880 households (26.2%) fall into this category. Meanwhile, the 65+ years age bracket for the primary householder has the lowest median household income of $65,089, with 1,137 households (33.8%) in this group.
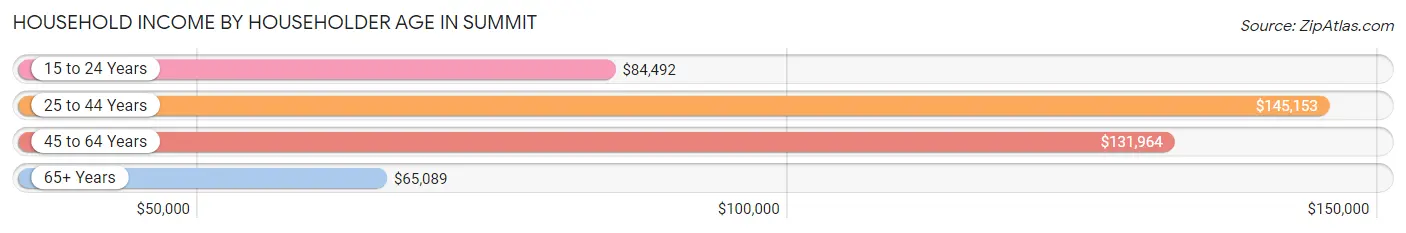
| Income Bracket | # Households | Median Income |
| 15 to 24 Years | 67 (2.0%) | $84,492 |
| 25 to 44 Years | 880 (26.2%) | $145,153 |
| 45 to 64 Years | 1,278 (38.0%) | $131,964 |
| 65+ Years | 1,137 (33.8%) | $65,089 |
| Total | 3,362 (100.0%) | $101,157 |
Poverty in Summit
Income Below Poverty by Sex and Age in Summit
With 3.6% poverty level for males and 7.2% for females among the residents of Summit, 18 to 24 year old males and 35 to 44 year old females are the most vulnerable to poverty, with 72 males (20.7%) and 95 females (13.3%) in their respective age groups living below the poverty level.
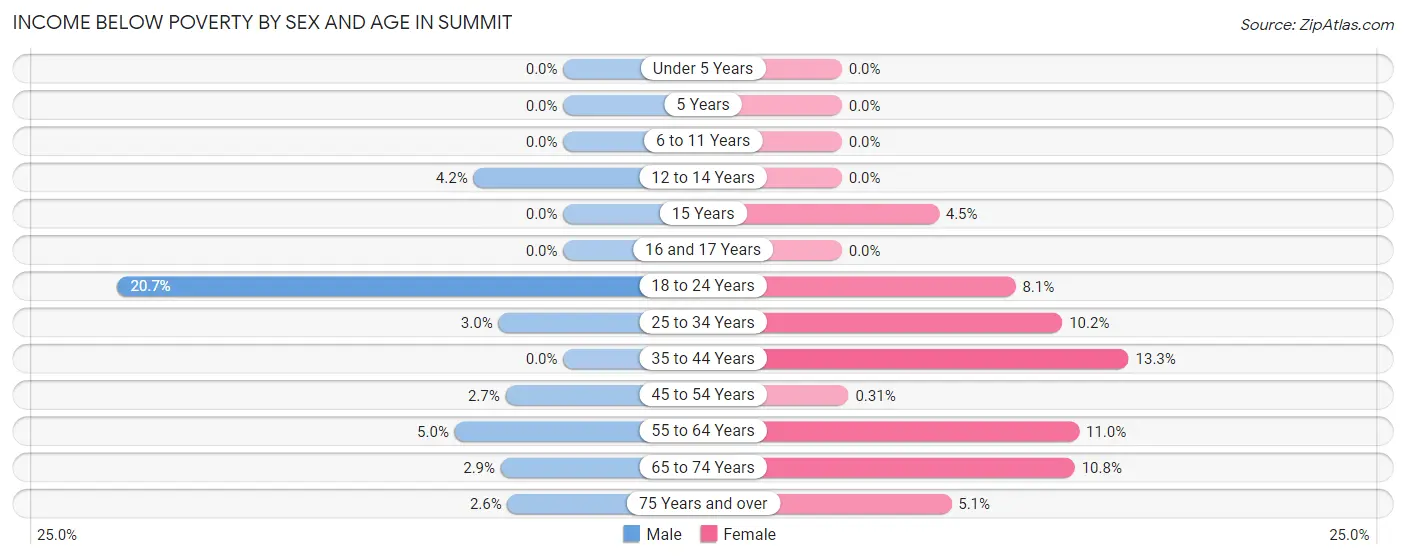
| Age Bracket | Male | Female |
| Under 5 Years | 0 (0.0%) | 0 (0.0%) |
| 5 Years | 0 (0.0%) | 0 (0.0%) |
| 6 to 11 Years | 0 (0.0%) | 0 (0.0%) |
| 12 to 14 Years | 6 (4.2%) | 0 (0.0%) |
| 15 Years | 0 (0.0%) | 5 (4.5%) |
| 16 and 17 Years | 0 (0.0%) | 0 (0.0%) |
| 18 to 24 Years | 72 (20.7%) | 15 (8.1%) |
| 25 to 34 Years | 13 (3.0%) | 35 (10.2%) |
| 35 to 44 Years | 0 (0.0%) | 95 (13.3%) |
| 45 to 54 Years | 12 (2.7%) | 2 (0.3%) |
| 55 to 64 Years | 34 (5.0%) | 76 (11.0%) |
| 65 to 74 Years | 14 (2.9%) | 63 (10.8%) |
| 75 Years and over | 9 (2.6%) | 25 (5.1%) |
| Total | 160 (3.6%) | 316 (7.2%) |
Income Above Poverty by Sex and Age in Summit
According to the poverty statistics in Summit, males aged under 5 years and females aged under 5 years are the age groups that are most secure financially, with 100.0% of males and 100.0% of females in these age groups living above the poverty line.
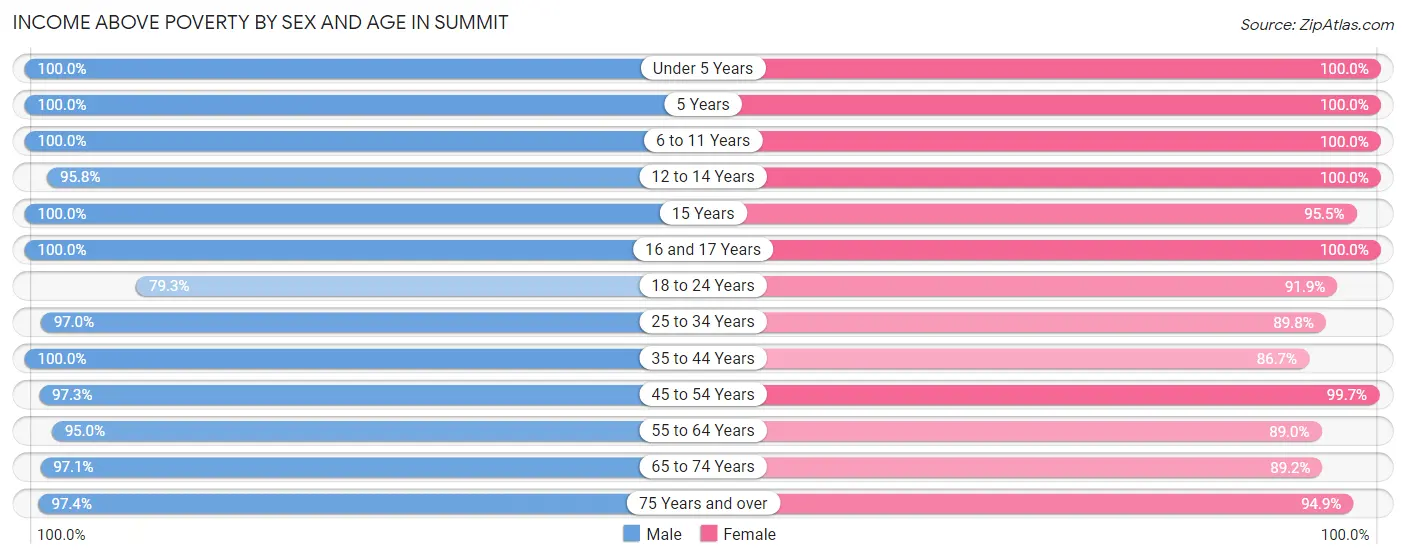
| Age Bracket | Male | Female |
| Under 5 Years | 233 (100.0%) | 102 (100.0%) |
| 5 Years | 54 (100.0%) | 7 (100.0%) |
| 6 to 11 Years | 355 (100.0%) | 243 (100.0%) |
| 12 to 14 Years | 138 (95.8%) | 46 (100.0%) |
| 15 Years | 38 (100.0%) | 106 (95.5%) |
| 16 and 17 Years | 315 (100.0%) | 197 (100.0%) |
| 18 to 24 Years | 276 (79.3%) | 171 (91.9%) |
| 25 to 34 Years | 419 (97.0%) | 307 (89.8%) |
| 35 to 44 Years | 573 (100.0%) | 619 (86.7%) |
| 45 to 54 Years | 435 (97.3%) | 646 (99.7%) |
| 55 to 64 Years | 640 (95.0%) | 614 (89.0%) |
| 65 to 74 Years | 468 (97.1%) | 520 (89.2%) |
| 75 Years and over | 338 (97.4%) | 467 (94.9%) |
| Total | 4,282 (96.4%) | 4,045 (92.7%) |
Income Below Poverty Among Married-Couple Families in Summit
The poverty statistics for married-couple families in Summit show that 2.9% or 55 of the total 1,877 families live below the poverty line. Families with no children have the highest poverty rate of 4.7%, comprising of 55 families. On the other hand, families with 1 or 2 children have the lowest poverty rate of 0.0%, which includes 0 families.
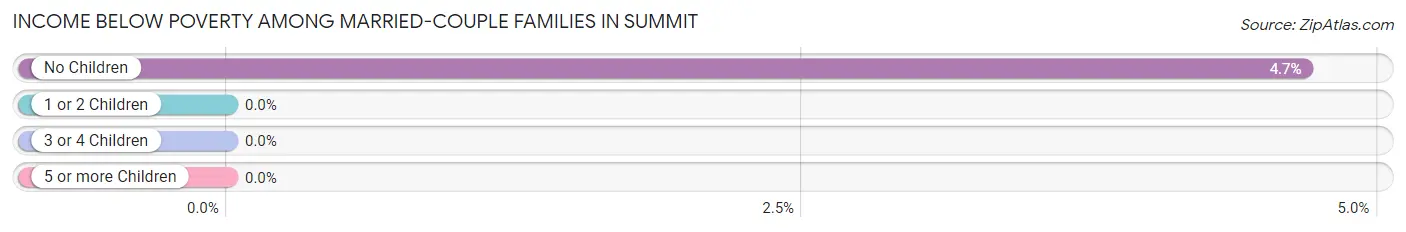
| Children | Above Poverty | Below Poverty |
| No Children | 1,120 (95.3%) | 55 (4.7%) |
| 1 or 2 Children | 570 (100.0%) | 0 (0.0%) |
| 3 or 4 Children | 125 (100.0%) | 0 (0.0%) |
| 5 or more Children | 7 (100.0%) | 0 (0.0%) |
| Total | 1,822 (97.1%) | 55 (2.9%) |
Income Below Poverty Among Single-Parent Households in Summit
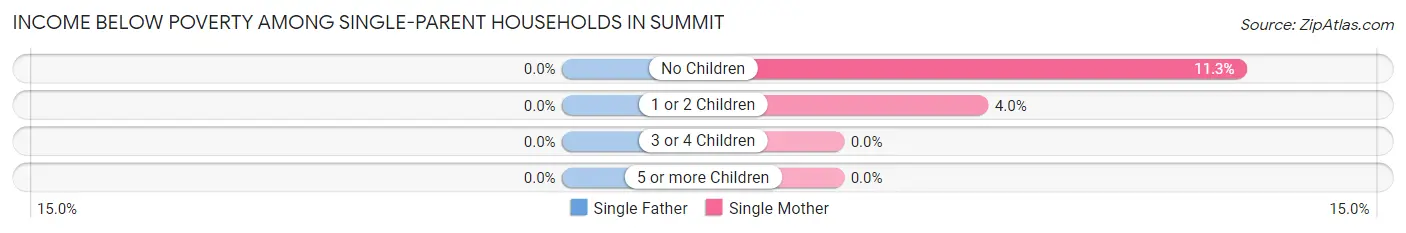
| Children | Single Father | Single Mother |
| No Children | 0 (0.0%) | 9 (11.3%) |
| 1 or 2 Children | 0 (0.0%) | 6 (4.0%) |
| 3 or 4 Children | 0 (0.0%) | 0 (0.0%) |
| 5 or more Children | 0 (0.0%) | 0 (0.0%) |
| Total | 0 (0.0%) | 15 (6.6%) |
Income Below Poverty Among Married-Couple vs Single-Parent Households in Summit
The poverty data for Summit shows that 55 of the married-couple family households (2.9%) and 15 of the single-parent households (2.8%) are living below the poverty level. Within the married-couple family households, those with no children have the highest poverty rate, with 55 households (4.7%) falling below the poverty line. Among the single-parent households, those with no children have the highest poverty rate, with 9 household (4.7%) living below poverty.
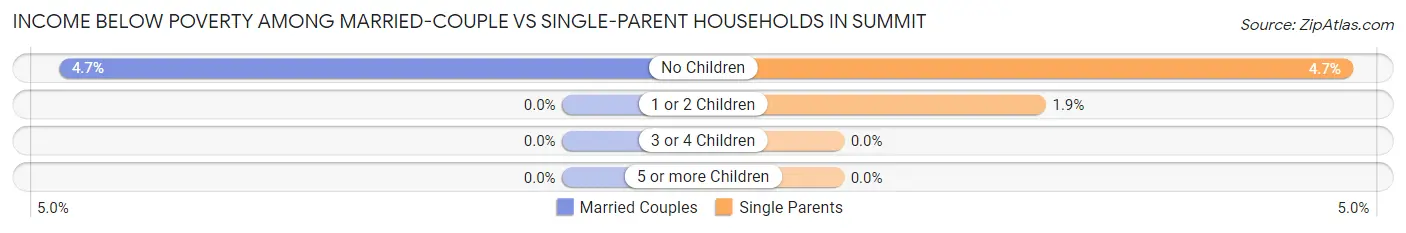
| Children | Married-Couple Families | Single-Parent Households |
| No Children | 55 (4.7%) | 9 (4.7%) |
| 1 or 2 Children | 0 (0.0%) | 6 (1.9%) |
| 3 or 4 Children | 0 (0.0%) | 0 (0.0%) |
| 5 or more Children | 0 (0.0%) | 0 (0.0%) |
| Total | 55 (2.9%) | 15 (2.8%) |
Race in Summit
The most populous races in Summit are White / Caucasian (7,420 | 84.1%), Hispanic or Latino (811 | 9.2%), and Two or more Races (769 | 8.7%).
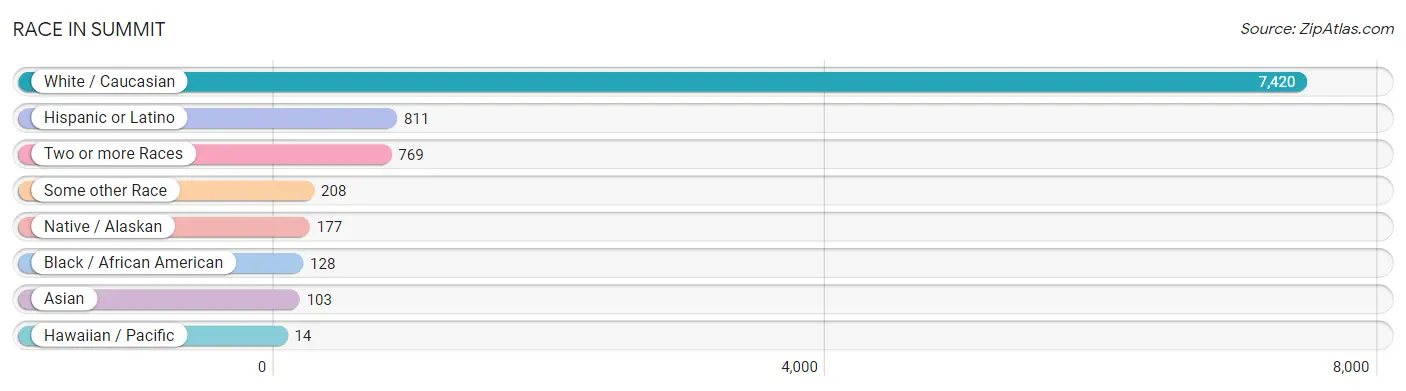
| Race | # Population | % Population |
| Asian | 103 | 1.2% |
| Black / African American | 128 | 1.5% |
| Hawaiian / Pacific | 14 | 0.2% |
| Hispanic or Latino | 811 | 9.2% |
| Native / Alaskan | 177 | 2.0% |
| White / Caucasian | 7,420 | 84.1% |
| Two or more Races | 769 | 8.7% |
| Some other Race | 208 | 2.4% |
| Total | 8,819 | 100.0% |
Ancestry in Summit
The most populous ancestries reported in Summit are German (1,923 | 21.8%), English (1,168 | 13.2%), Irish (1,045 | 11.8%), Norwegian (597 | 6.8%), and American (563 | 6.4%), together accounting for 60.0% of all Summit residents.
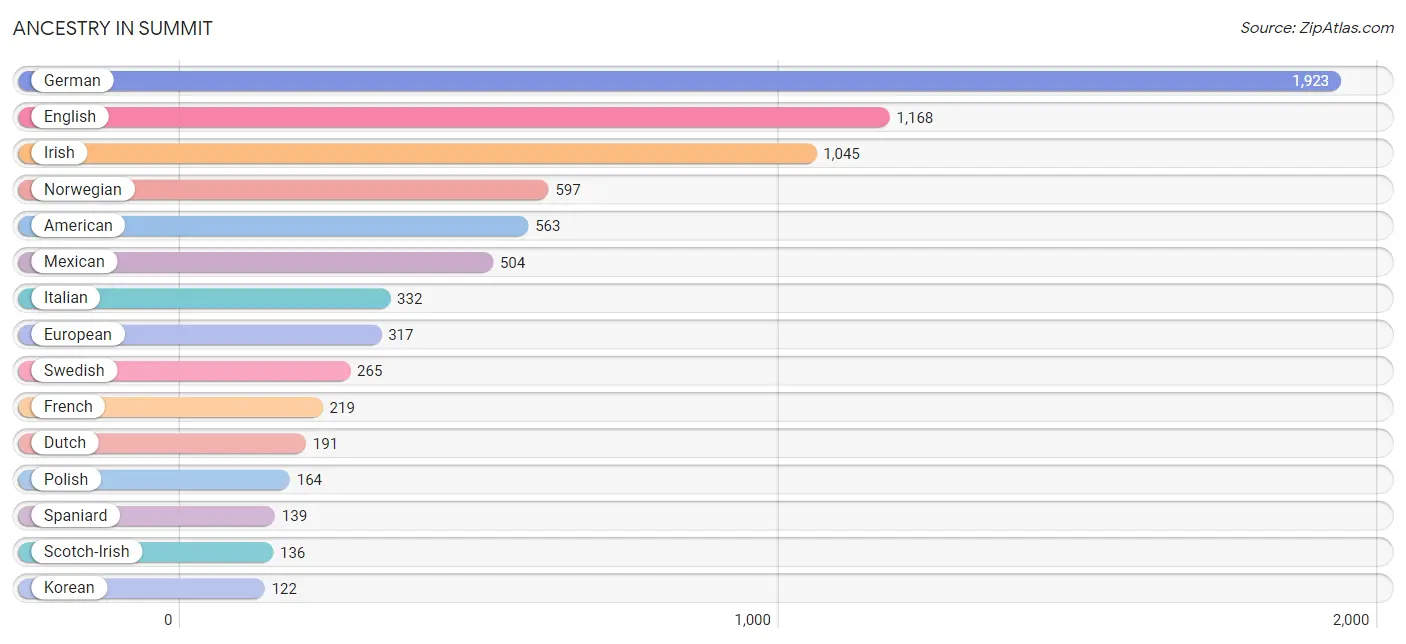
| Ancestry | # Population | % Population |
| African | 1 | 0.0% |
| American | 563 | 6.4% |
| Arab | 19 | 0.2% |
| Austrian | 8 | 0.1% |
| Belgian | 12 | 0.1% |
| Bhutanese | 18 | 0.2% |
| Bolivian | 20 | 0.2% |
| British | 36 | 0.4% |
| Burmese | 49 | 0.6% |
| Canadian | 59 | 0.7% |
| Central American | 82 | 0.9% |
| Cherokee | 16 | 0.2% |
| Cuban | 10 | 0.1% |
| Czech | 28 | 0.3% |
| Czechoslovakian | 30 | 0.3% |
| Danish | 90 | 1.0% |
| Dutch | 191 | 2.2% |
| English | 1,168 | 13.2% |
| Estonian | 7 | 0.1% |
| European | 317 | 3.6% |
| Finnish | 23 | 0.3% |
| French | 219 | 2.5% |
| French Canadian | 82 | 0.9% |
| German | 1,923 | 21.8% |
| Greek | 16 | 0.2% |
| Guamanian / Chamorro | 24 | 0.3% |
| Guatemalan | 67 | 0.8% |
| Indian (Asian) | 55 | 0.6% |
| Irish | 1,045 | 11.8% |
| Italian | 332 | 3.8% |
| Korean | 122 | 1.4% |
| Lebanese | 19 | 0.2% |
| Lithuanian | 16 | 0.2% |
| Mexican | 504 | 5.7% |
| Mexican American Indian | 8 | 0.1% |
| Native Hawaiian | 7 | 0.1% |
| Northern European | 96 | 1.1% |
| Norwegian | 597 | 6.8% |
| Pakistani | 16 | 0.2% |
| Panamanian | 15 | 0.2% |
| Polish | 164 | 1.9% |
| Portuguese | 80 | 0.9% |
| Puerto Rican | 45 | 0.5% |
| Puget Sound Salish | 66 | 0.7% |
| Russian | 109 | 1.2% |
| Scandinavian | 101 | 1.1% |
| Scotch-Irish | 136 | 1.5% |
| Scottish | 74 | 0.8% |
| Sioux | 82 | 0.9% |
| South American | 20 | 0.2% |
| Spaniard | 139 | 1.6% |
| Subsaharan African | 1 | 0.0% |
| Swedish | 265 | 3.0% |
| Swiss | 36 | 0.4% |
| Ukrainian | 18 | 0.2% |
| Welsh | 84 | 0.9% |
| Yaqui | 21 | 0.2% |
| Yugoslavian | 10 | 0.1% | View All 58 Rows |
Immigrants in Summit
The most numerous immigrant groups reported in Summit came from Latin America (270 | 3.1%), Central America (266 | 3.0%), Mexico (223 | 2.5%), Asia (80 | 0.9%), and Europe (75 | 0.9%), together accounting for 10.4% of all Summit residents.
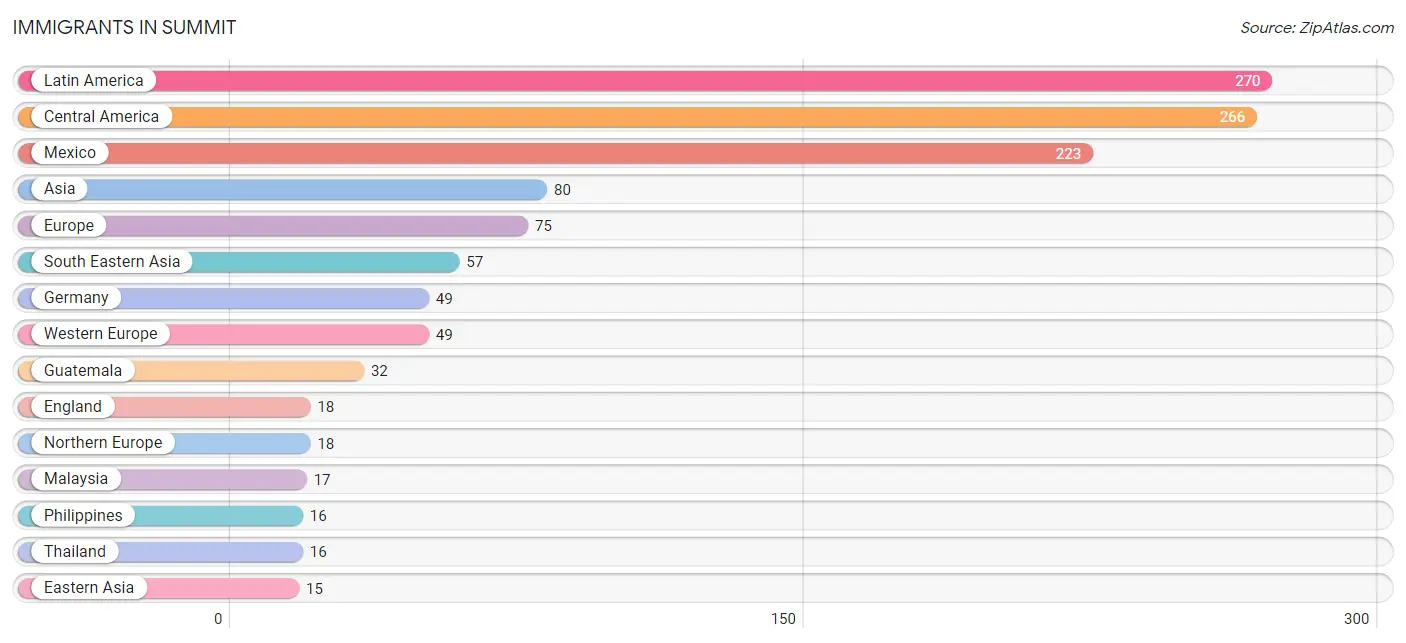
| Immigration Origin | # Population | % Population |
| Asia | 80 | 0.9% |
| Brazil | 4 | 0.1% |
| Central America | 266 | 3.0% |
| Eastern Asia | 15 | 0.2% |
| Eastern Europe | 8 | 0.1% |
| England | 18 | 0.2% |
| Europe | 75 | 0.9% |
| Germany | 49 | 0.6% |
| Guatemala | 32 | 0.4% |
| Korea | 15 | 0.2% |
| Latin America | 270 | 3.1% |
| Malaysia | 17 | 0.2% |
| Mexico | 223 | 2.5% |
| Northern Europe | 18 | 0.2% |
| Panama | 11 | 0.1% |
| Philippines | 16 | 0.2% |
| South America | 4 | 0.1% |
| South Central Asia | 8 | 0.1% |
| South Eastern Asia | 57 | 0.6% |
| Thailand | 16 | 0.2% |
| Ukraine | 8 | 0.1% |
| Vietnam | 8 | 0.1% |
| Western Europe | 49 | 0.6% | View All 23 Rows |
Sex and Age in Summit
Sex and Age in Summit
The most populous age groups in Summit are 15 to 19 Years (476 | 10.7%) for men and 50 to 54 Years (426 | 9.8%) for women.
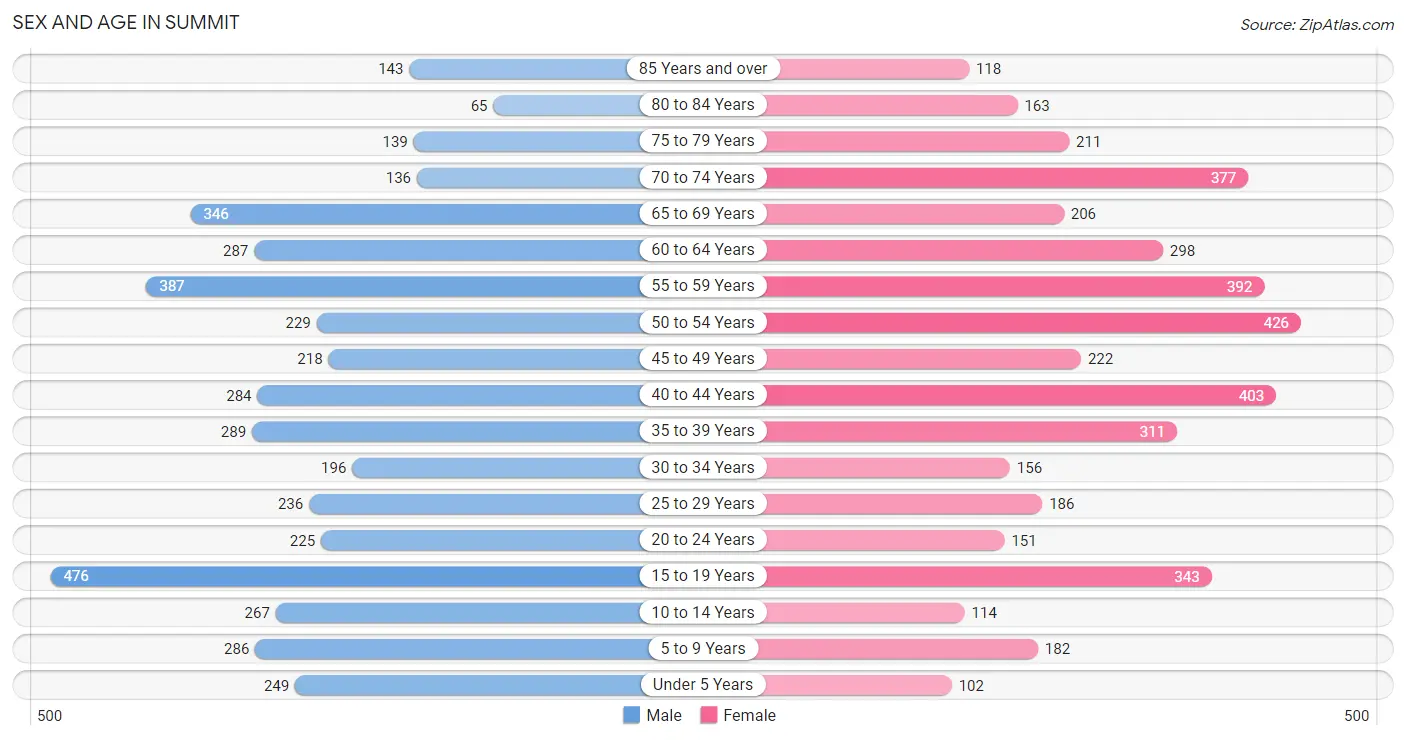
| Age Bracket | Male | Female |
| Under 5 Years | 249 (5.6%) | 102 (2.3%) |
| 5 to 9 Years | 286 (6.4%) | 182 (4.2%) |
| 10 to 14 Years | 267 (6.0%) | 114 (2.6%) |
| 15 to 19 Years | 476 (10.7%) | 343 (7.9%) |
| 20 to 24 Years | 225 (5.1%) | 151 (3.5%) |
| 25 to 29 Years | 236 (5.3%) | 186 (4.3%) |
| 30 to 34 Years | 196 (4.4%) | 156 (3.6%) |
| 35 to 39 Years | 289 (6.5%) | 311 (7.1%) |
| 40 to 44 Years | 284 (6.4%) | 403 (9.2%) |
| 45 to 49 Years | 218 (4.9%) | 222 (5.1%) |
| 50 to 54 Years | 229 (5.1%) | 426 (9.8%) |
| 55 to 59 Years | 387 (8.7%) | 392 (9.0%) |
| 60 to 64 Years | 287 (6.4%) | 298 (6.8%) |
| 65 to 69 Years | 346 (7.8%) | 206 (4.7%) |
| 70 to 74 Years | 136 (3.0%) | 377 (8.6%) |
| 75 to 79 Years | 139 (3.1%) | 211 (4.8%) |
| 80 to 84 Years | 65 (1.5%) | 163 (3.7%) |
| 85 Years and over | 143 (3.2%) | 118 (2.7%) |
| Total | 4,458 (100.0%) | 4,361 (100.0%) |
Families and Households in Summit
Median Family Size in Summit
The median family size in Summit is 3.00 persons per family, with married-couple families (1,877 | 77.8%) accounting for the largest median family size of 3.05 persons per family. On the other hand, single female/mother families (229 | 9.5%) represent the smallest median family size with 2.73 persons per family.
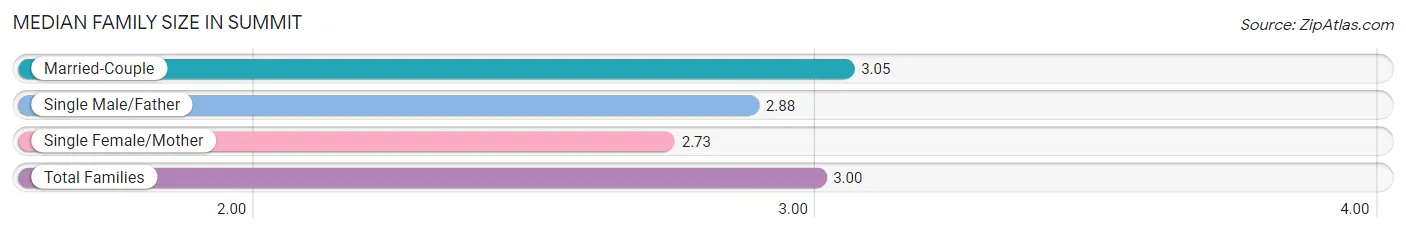
| Family Type | # Families | Family Size |
| Married-Couple | 1,877 (77.8%) | 3.05 |
| Single Male/Father | 305 (12.7%) | 2.88 |
| Single Female/Mother | 229 (9.5%) | 2.73 |
| Total Families | 2,411 (100.0%) | 3.00 |
Median Household Size in Summit
The median household size in Summit is 2.62 persons per household, with single male/father households (305 | 9.1%) accounting for the largest median household size of 3.62 persons per household. non-family households (951 | 28.3%) represent the smallest median household size with 1.36 persons per household.
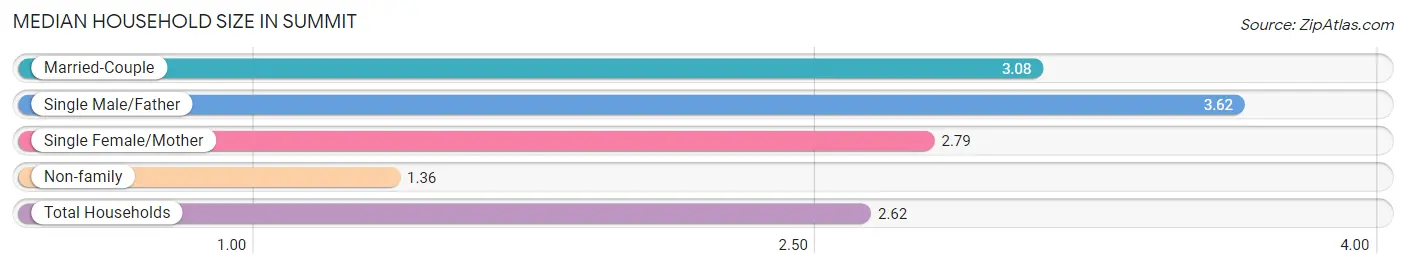
| Household Type | # Households | Household Size |
| Married-Couple | 1,877 (55.8%) | 3.08 |
| Single Male/Father | 305 (9.1%) | 3.62 |
| Single Female/Mother | 229 (6.8%) | 2.79 |
| Non-family | 951 (28.3%) | 1.36 |
| Total Households | 3,362 (100.0%) | 2.62 |
Household Size by Marriage Status in Summit
Out of a total of 3,362 households in Summit, 2,411 (71.7%) are family households, while 951 (28.3%) are nonfamily households. The most numerous type of family households are 2-person households, comprising 1,022, and the most common type of nonfamily households are 1-person households, comprising 687.
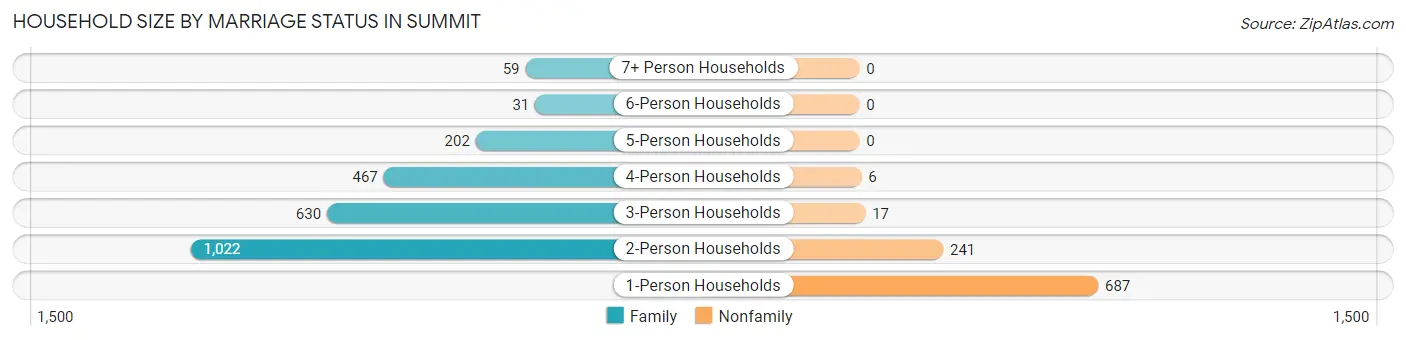
| Household Size | Family Households | Nonfamily Households |
| 1-Person Households | - | 687 (20.4%) |
| 2-Person Households | 1,022 (30.4%) | 241 (7.2%) |
| 3-Person Households | 630 (18.7%) | 17 (0.5%) |
| 4-Person Households | 467 (13.9%) | 6 (0.2%) |
| 5-Person Households | 202 (6.0%) | 0 (0.0%) |
| 6-Person Households | 31 (0.9%) | 0 (0.0%) |
| 7+ Person Households | 59 (1.8%) | 0 (0.0%) |
| Total | 2,411 (71.7%) | 951 (28.3%) |
Female Fertility in Summit
Fertility by Age in Summit
Average fertility rate in Summit is 80.0 births per 1,000 women. Women in the age bracket of 20 to 34 years have the highest fertility rate with 227.0 births per 1,000 women. Women in the age bracket of 20 to 34 years acount for 77.2% of all women with births.
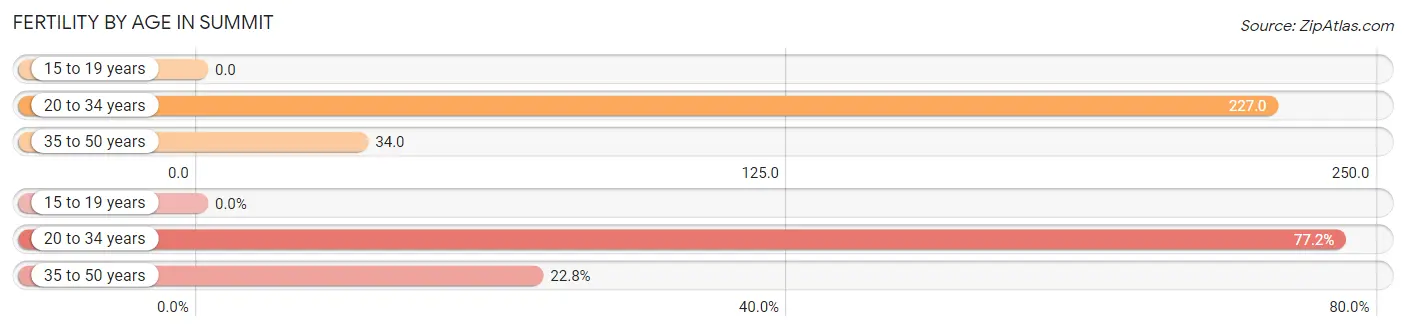
| Age Bracket | Women with Births | Births / 1,000 Women |
| 15 to 19 years | 0 (0.0%) | 0.0 |
| 20 to 34 years | 112 (77.2%) | 227.0 |
| 35 to 50 years | 33 (22.8%) | 34.0 |
| Total | 145 (100.0%) | 80.0 |
Fertility by Age by Marriage Status in Summit
88.3% of women with births (145) in Summit are married. The highest percentage of unmarried women with births falls into 35 to 50 years age bracket with 51.5% of them unmarried at the time of birth, while the lowest percentage of unmarried women with births belong to 20 to 34 years age bracket with 0.0% of them unmarried.
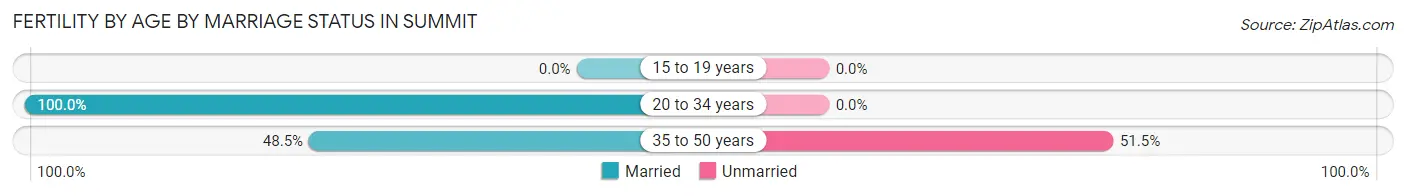
| Age Bracket | Married | Unmarried |
| 15 to 19 years | 0 (0.0%) | 0 (0.0%) |
| 20 to 34 years | 112 (100.0%) | 0 (0.0%) |
| 35 to 50 years | 16 (48.5%) | 17 (51.5%) |
| Total | 128 (88.3%) | 17 (11.7%) |
Fertility by Education in Summit
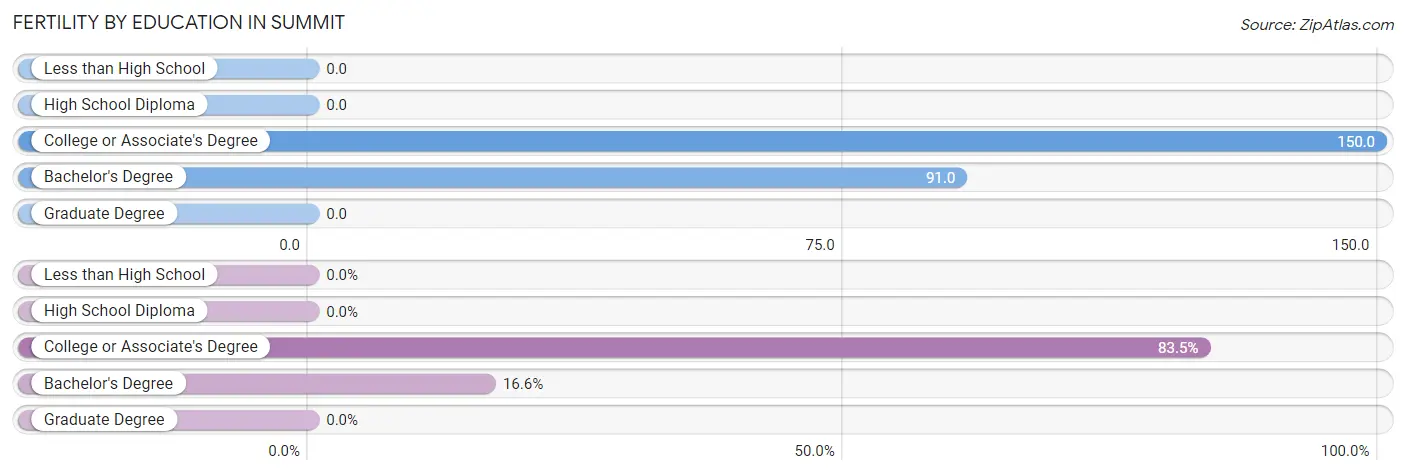
| Educational Attainment | Women with Births | Births / 1,000 Women |
| Less than High School | 0 (0.0%) | 0.0 |
| High School Diploma | 0 (0.0%) | 0.0 |
| College or Associate's Degree | 121 (83.5%) | 150.0 |
| Bachelor's Degree | 24 (16.6%) | 91.0 |
| Graduate Degree | 0 (0.0%) | 0.0 |
| Total | 145 (100.0%) | 80.0 |
Fertility by Education by Marriage Status in Summit
11.7% of women with births in Summit are unmarried. Women with the educational attainment of college or associate's degree are most likely to be married with 100.0% of them married at childbirth, while women with the educational attainment of bachelor's degree are least likely to be married with 70.8% of them unmarried at childbirth.
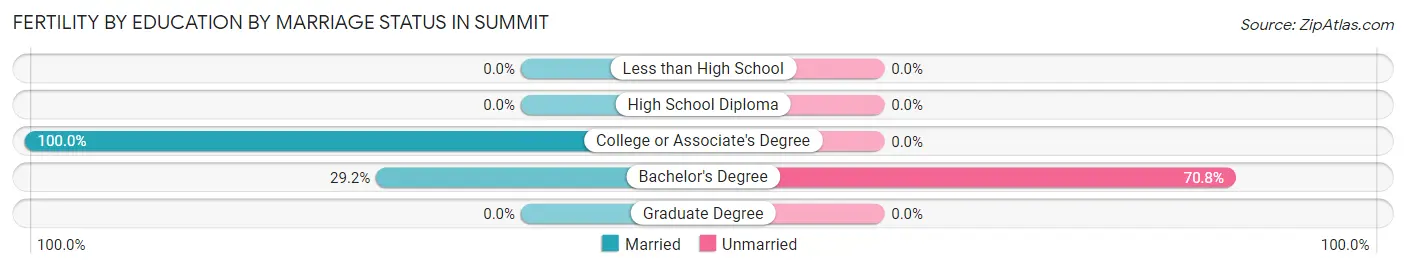
| Educational Attainment | Married | Unmarried |
| Less than High School | 0 (0.0%) | 0 (0.0%) |
| High School Diploma | 0 (0.0%) | 0 (0.0%) |
| College or Associate's Degree | 121 (100.0%) | 0 (0.0%) |
| Bachelor's Degree | 7 (29.2%) | 17 (70.8%) |
| Graduate Degree | 0 (0.0%) | 0 (0.0%) |
| Total | 128 (88.3%) | 17 (11.7%) |
Employment Characteristics in Summit
Employment by Class of Employer in Summit
Among the 4,051 employed individuals in Summit, private company employees (2,578 | 63.6%), local government employees (412 | 10.2%), and not-for-profit organizations (330 | 8.2%) make up the most common classes of employment.
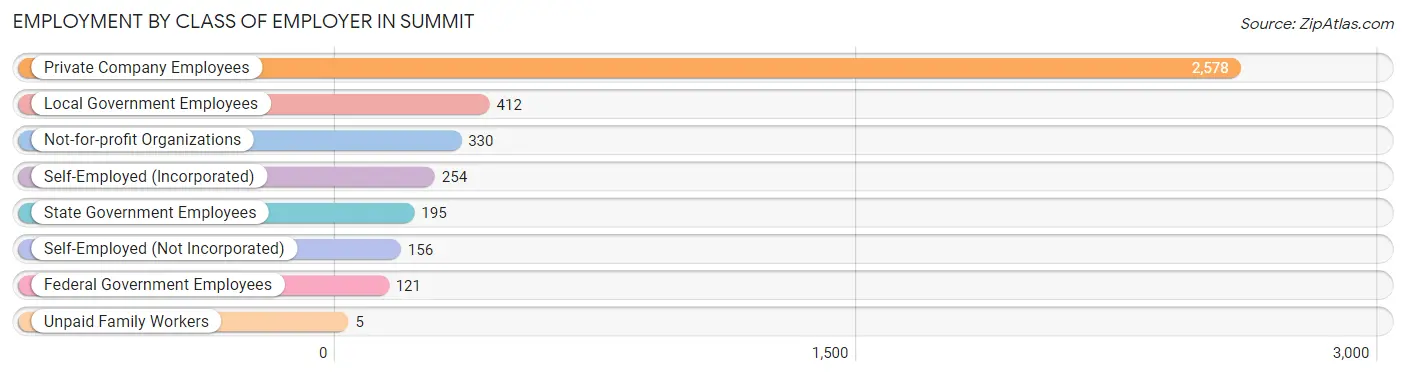
| Employer Class | # Employees | % Employees |
| Private Company Employees | 2,578 | 63.6% |
| Self-Employed (Incorporated) | 254 | 6.3% |
| Self-Employed (Not Incorporated) | 156 | 3.8% |
| Not-for-profit Organizations | 330 | 8.2% |
| Local Government Employees | 412 | 10.2% |
| State Government Employees | 195 | 4.8% |
| Federal Government Employees | 121 | 3.0% |
| Unpaid Family Workers | 5 | 0.1% |
| Total | 4,051 | 100.0% |
Employment Status by Age in Summit
According to the labor force statistics for Summit, out of the total population over 16 years of age (7,470), 60.1% or 4,489 individuals are in the labor force, with 6.6% or 296 of them unemployed. The age group with the highest labor force participation rate is 30 to 34 years, with 92.0% or 324 individuals in the labor force. Within the labor force, the 16 to 19 years age range has the highest percentage of unemployed individuals, with 37.0% or 121 of them being unemployed.
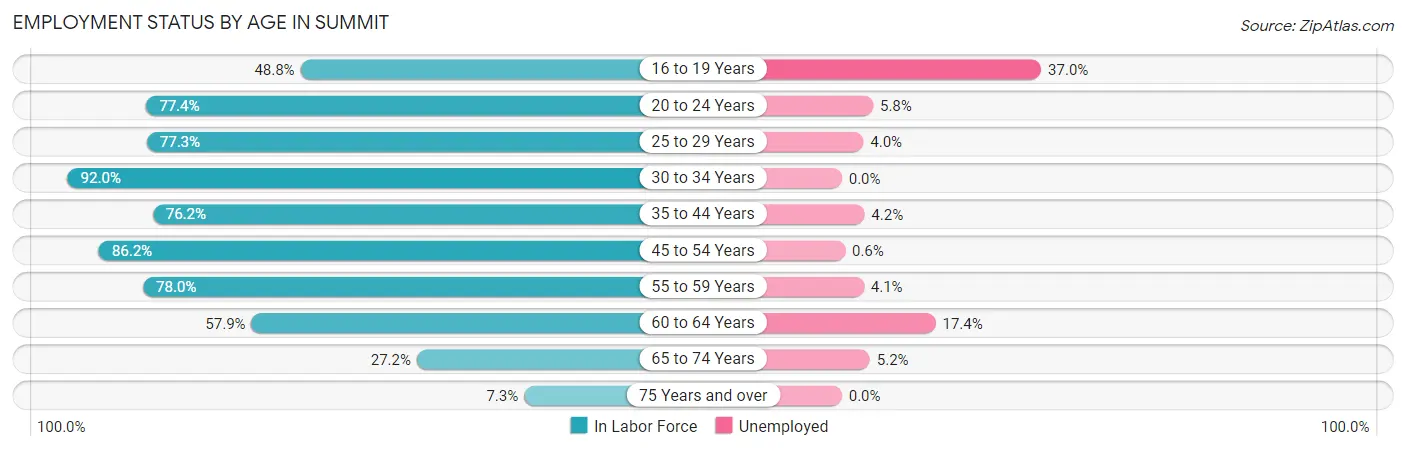
| Age Bracket | In Labor Force | Unemployed |
| 16 to 19 Years | 327 (48.8%) | 121 (37.0%) |
| 20 to 24 Years | 291 (77.4%) | 17 (5.8%) |
| 25 to 29 Years | 326 (77.3%) | 13 (4.0%) |
| 30 to 34 Years | 324 (92.0%) | 0 (0.0%) |
| 35 to 44 Years | 981 (76.2%) | 41 (4.2%) |
| 45 to 54 Years | 944 (86.2%) | 6 (0.6%) |
| 55 to 59 Years | 608 (78.0%) | 25 (4.1%) |
| 60 to 64 Years | 339 (57.9%) | 59 (17.4%) |
| 65 to 74 Years | 290 (27.2%) | 15 (5.2%) |
| 75 Years and over | 61 (7.3%) | 0 (0.0%) |
| Total | 4,489 (60.1%) | 296 (6.6%) |
Employment Status by Educational Attainment in Summit
According to labor force statistics for Summit, 77.9% of individuals (3,521) out of the total population between 25 and 64 years of age (4,520) are in the labor force, with 4.1% or 144 of them being unemployed. The group with the highest labor force participation rate are those with the educational attainment of college / associate degree, with 85.8% or 1,737 individuals in the labor force. Within the labor force, individuals with bachelor's degree or higher education have the highest percentage of unemployment, with 11.9% or 97 of them being unemployed.
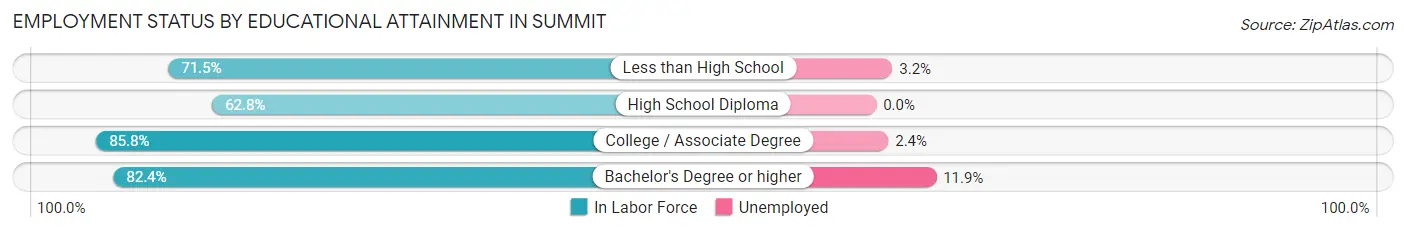
| Educational Attainment | In Labor Force | Unemployed |
| Less than High School | 188 (71.5%) | 8 (3.2%) |
| High School Diploma | 781 (62.8%) | 0 (0.0%) |
| College / Associate Degree | 1,737 (85.8%) | 49 (2.4%) |
| Bachelor's Degree or higher | 815 (82.4%) | 118 (11.9%) |
| Total | 3,521 (77.9%) | 185 (4.1%) |
Employment Occupations by Sex in Summit
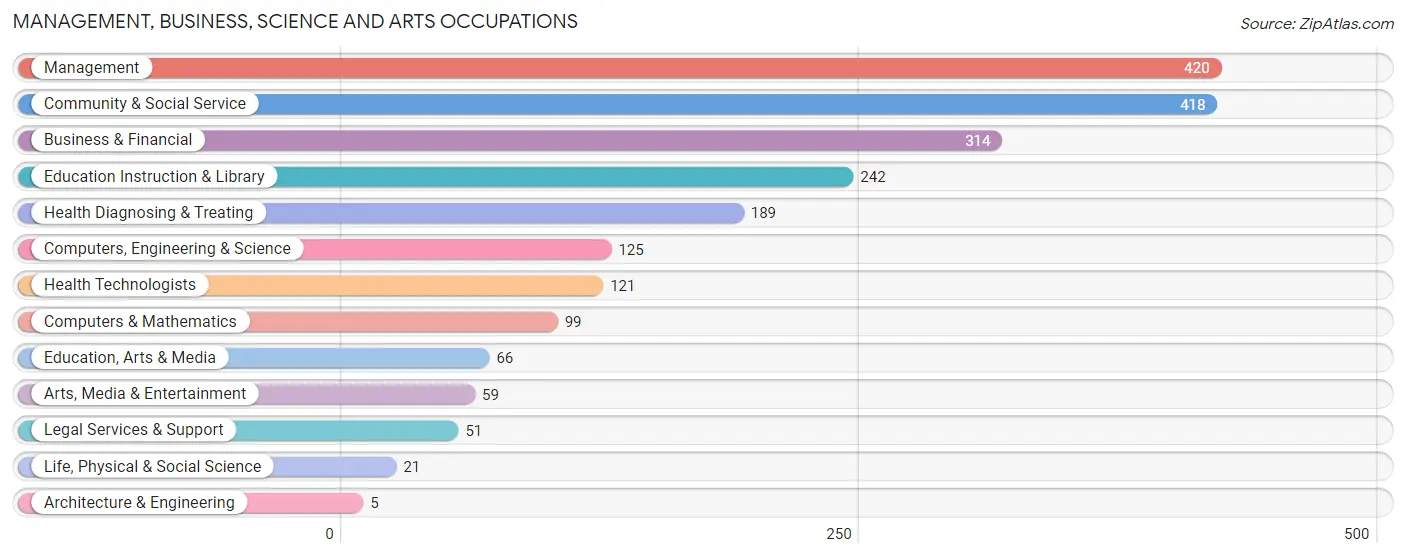
Management, Business, Science and Arts Occupations
The most common Management, Business, Science and Arts occupations in Summit are Management (420 | 10.0%), Community & Social Service (418 | 10.0%), Business & Financial (314 | 7.5%), Education Instruction & Library (242 | 5.8%), and Health Diagnosing & Treating (189 | 4.5%).
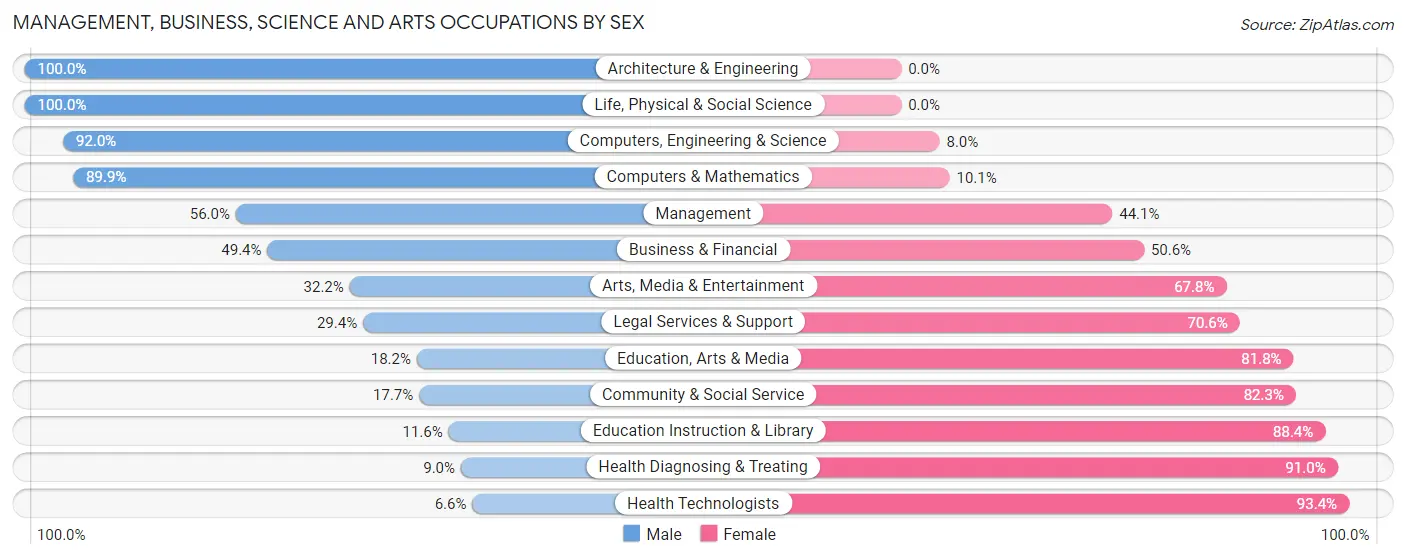
Management, Business, Science and Arts Occupations by Sex
Within the Management, Business, Science and Arts occupations in Summit, the most male-oriented occupations are Architecture & Engineering (100.0%), Life, Physical & Social Science (100.0%), and Computers, Engineering & Science (92.0%), while the most female-oriented occupations are Health Technologists (93.4%), Health Diagnosing & Treating (91.0%), and Education Instruction & Library (88.4%).
| Occupation | Male | Female |
| Management | 235 (55.9%) | 185 (44.1%) |
| Business & Financial | 155 (49.4%) | 159 (50.6%) |
| Computers, Engineering & Science | 115 (92.0%) | 10 (8.0%) |
| Computers & Mathematics | 89 (89.9%) | 10 (10.1%) |
| Architecture & Engineering | 5 (100.0%) | 0 (0.0%) |
| Life, Physical & Social Science | 21 (100.0%) | 0 (0.0%) |
| Community & Social Service | 74 (17.7%) | 344 (82.3%) |
| Education, Arts & Media | 12 (18.2%) | 54 (81.8%) |
| Legal Services & Support | 15 (29.4%) | 36 (70.6%) |
| Education Instruction & Library | 28 (11.6%) | 214 (88.4%) |
| Arts, Media & Entertainment | 19 (32.2%) | 40 (67.8%) |
| Health Diagnosing & Treating | 17 (9.0%) | 172 (91.0%) |
| Health Technologists | 8 (6.6%) | 113 (93.4%) |
| Total (Category) | 596 (40.6%) | 870 (59.4%) |
| Total (Overall) | 2,291 (54.6%) | 1,903 (45.4%) |
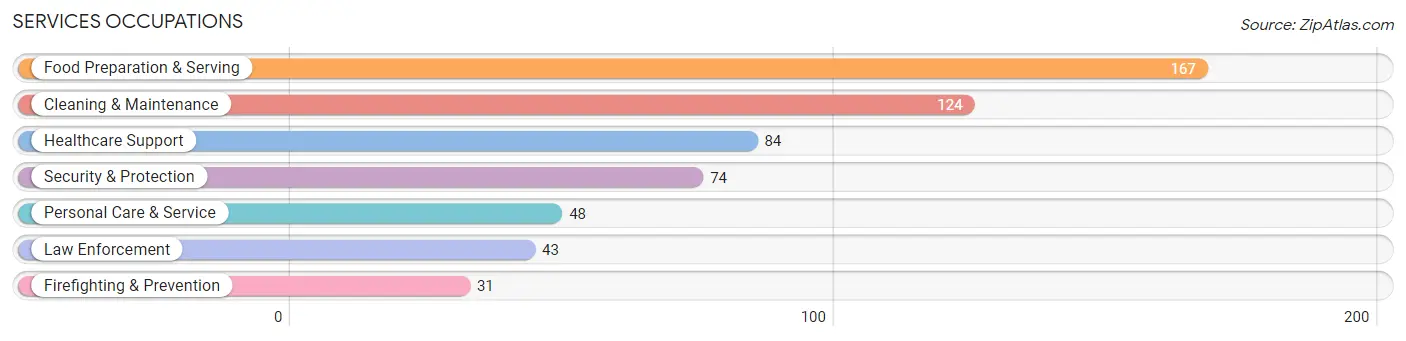
Services Occupations
The most common Services occupations in Summit are Food Preparation & Serving (167 | 4.0%), Cleaning & Maintenance (124 | 3.0%), Healthcare Support (84 | 2.0%), Security & Protection (74 | 1.8%), and Personal Care & Service (48 | 1.1%).
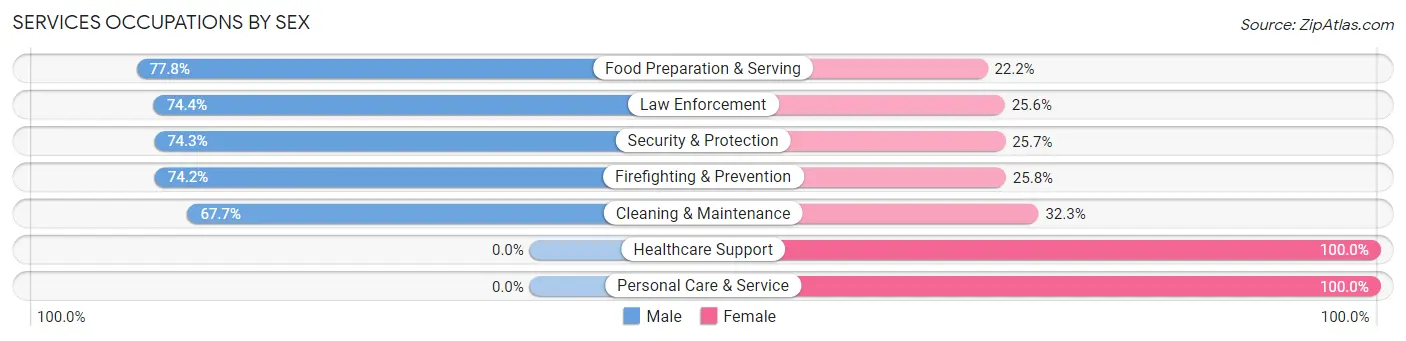
Services Occupations by Sex
Within the Services occupations in Summit, the most male-oriented occupations are Food Preparation & Serving (77.8%), Law Enforcement (74.4%), and Security & Protection (74.3%), while the most female-oriented occupations are Healthcare Support (100.0%), Personal Care & Service (100.0%), and Cleaning & Maintenance (32.3%).
| Occupation | Male | Female |
| Healthcare Support | 0 (0.0%) | 84 (100.0%) |
| Security & Protection | 55 (74.3%) | 19 (25.7%) |
| Firefighting & Prevention | 23 (74.2%) | 8 (25.8%) |
| Law Enforcement | 32 (74.4%) | 11 (25.6%) |
| Food Preparation & Serving | 130 (77.8%) | 37 (22.2%) |
| Cleaning & Maintenance | 84 (67.7%) | 40 (32.3%) |
| Personal Care & Service | 0 (0.0%) | 48 (100.0%) |
| Total (Category) | 269 (54.1%) | 228 (45.9%) |
| Total (Overall) | 2,291 (54.6%) | 1,903 (45.4%) |
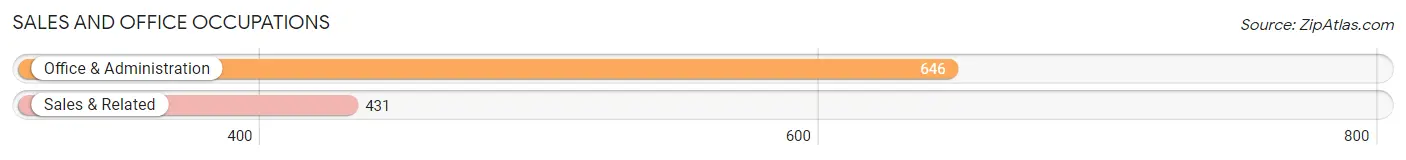
Sales and Office Occupations
The most common Sales and Office occupations in Summit are Office & Administration (646 | 15.4%), and Sales & Related (431 | 10.3%).
Sales and Office Occupations by Sex
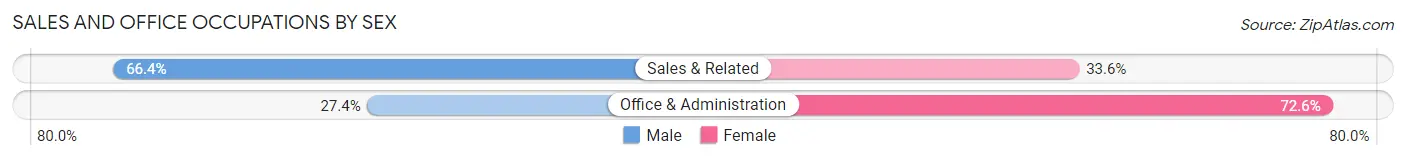
| Occupation | Male | Female |
| Sales & Related | 286 (66.4%) | 145 (33.6%) |
| Office & Administration | 177 (27.4%) | 469 (72.6%) |
| Total (Category) | 463 (43.0%) | 614 (57.0%) |
| Total (Overall) | 2,291 (54.6%) | 1,903 (45.4%) |
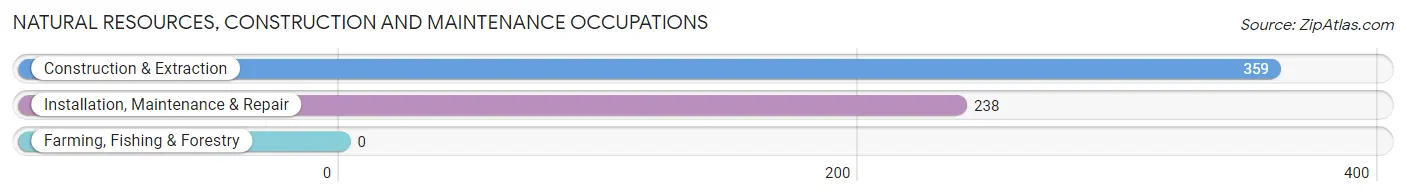
Natural Resources, Construction and Maintenance Occupations
The most common Natural Resources, Construction and Maintenance occupations in Summit are Construction & Extraction (359 | 8.6%), and Installation, Maintenance & Repair (238 | 5.7%).
Natural Resources, Construction and Maintenance Occupations by Sex
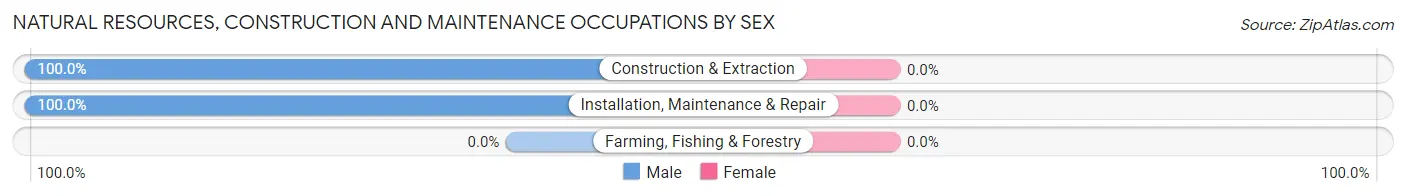
| Occupation | Male | Female |
| Farming, Fishing & Forestry | 0 (0.0%) | 0 (0.0%) |
| Construction & Extraction | 359 (100.0%) | 0 (0.0%) |
| Installation, Maintenance & Repair | 238 (100.0%) | 0 (0.0%) |
| Total (Category) | 597 (100.0%) | 0 (0.0%) |
| Total (Overall) | 2,291 (54.6%) | 1,903 (45.4%) |
Production, Transportation and Moving Occupations
The most common Production, Transportation and Moving occupations in Summit are Transportation (219 | 5.2%), Production (177 | 4.2%), and Material Moving (161 | 3.8%).
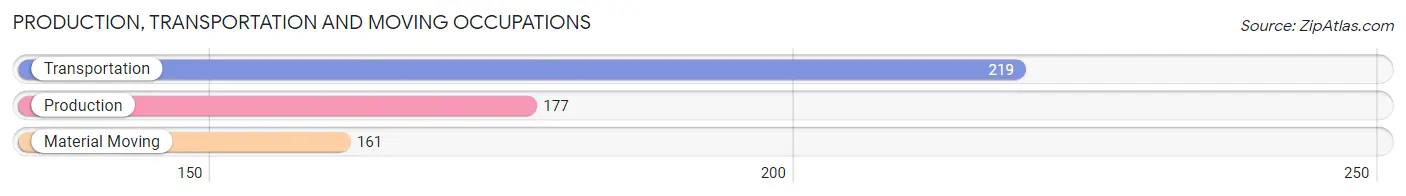
Production, Transportation and Moving Occupations by Sex
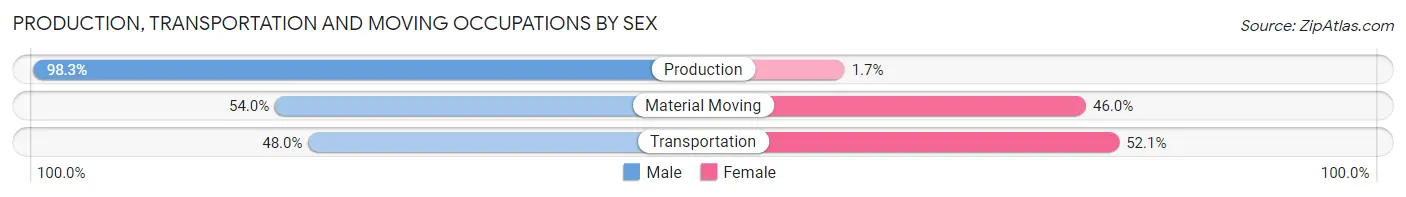
| Occupation | Male | Female |
| Production | 174 (98.3%) | 3 (1.7%) |
| Transportation | 105 (47.9%) | 114 (52.0%) |
| Material Moving | 87 (54.0%) | 74 (46.0%) |
| Total (Category) | 366 (65.7%) | 191 (34.3%) |
| Total (Overall) | 2,291 (54.6%) | 1,903 (45.4%) |
Employment Industries by Sex in Summit
Employment Industries in Summit
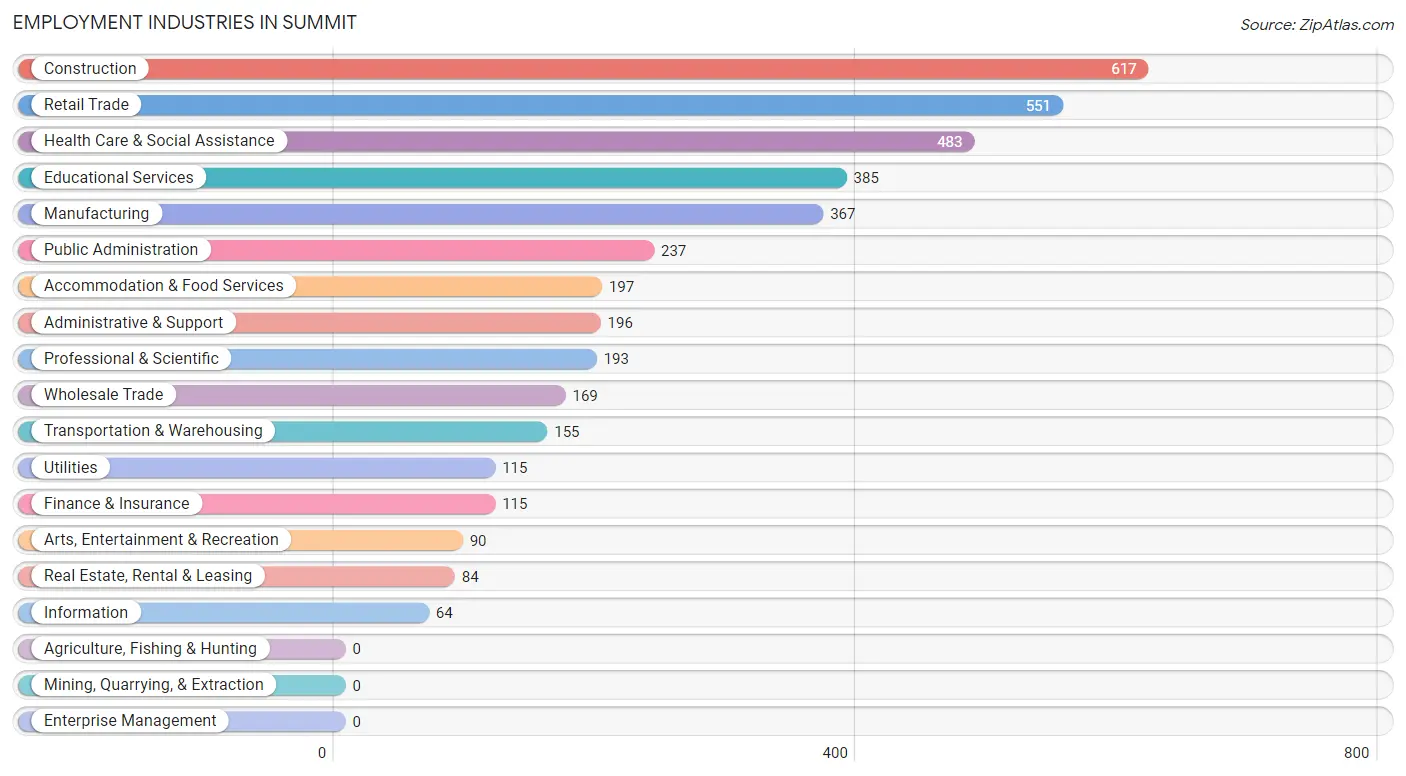
The major employment industries in Summit include Construction (617 | 14.7%), Retail Trade (551 | 13.1%), Health Care & Social Assistance (483 | 11.5%), Educational Services (385 | 9.2%), and Manufacturing (367 | 8.7%).
Employment Industries by Sex in Summit
The Summit industries that see more men than women are Utilities (100.0%), Manufacturing (91.8%), and Information (84.4%), whereas the industries that tend to have a higher number of women are Health Care & Social Assistance (89.4%), Educational Services (87.0%), and Real Estate, Rental & Leasing (69.1%).
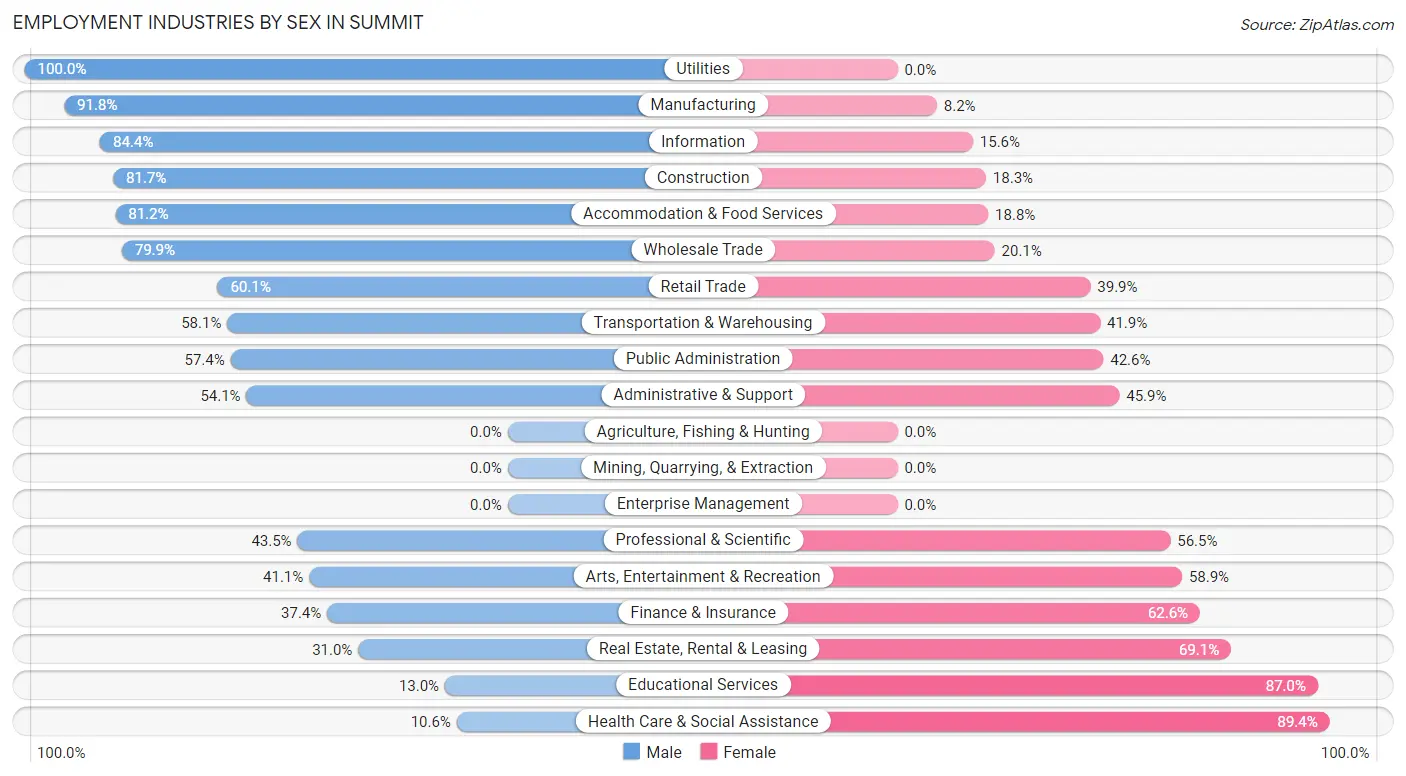
| Industry | Male | Female |
| Agriculture, Fishing & Hunting | 0 (0.0%) | 0 (0.0%) |
| Mining, Quarrying, & Extraction | 0 (0.0%) | 0 (0.0%) |
| Construction | 504 (81.7%) | 113 (18.3%) |
| Manufacturing | 337 (91.8%) | 30 (8.2%) |
| Wholesale Trade | 135 (79.9%) | 34 (20.1%) |
| Retail Trade | 331 (60.1%) | 220 (39.9%) |
| Transportation & Warehousing | 90 (58.1%) | 65 (41.9%) |
| Utilities | 115 (100.0%) | 0 (0.0%) |
| Information | 54 (84.4%) | 10 (15.6%) |
| Finance & Insurance | 43 (37.4%) | 72 (62.6%) |
| Real Estate, Rental & Leasing | 26 (30.9%) | 58 (69.1%) |
| Professional & Scientific | 84 (43.5%) | 109 (56.5%) |
| Enterprise Management | 0 (0.0%) | 0 (0.0%) |
| Administrative & Support | 106 (54.1%) | 90 (45.9%) |
| Educational Services | 50 (13.0%) | 335 (87.0%) |
| Health Care & Social Assistance | 51 (10.6%) | 432 (89.4%) |
| Arts, Entertainment & Recreation | 37 (41.1%) | 53 (58.9%) |
| Accommodation & Food Services | 160 (81.2%) | 37 (18.8%) |
| Public Administration | 136 (57.4%) | 101 (42.6%) |
| Total | 2,291 (54.6%) | 1,903 (45.4%) |
Education in Summit
School Enrollment in Summit
The most common levels of schooling among the 1,980 students in Summit are high school (759 | 38.3%), elementary school (397 | 20.1%), and college / undergraduate (358 | 18.1%).
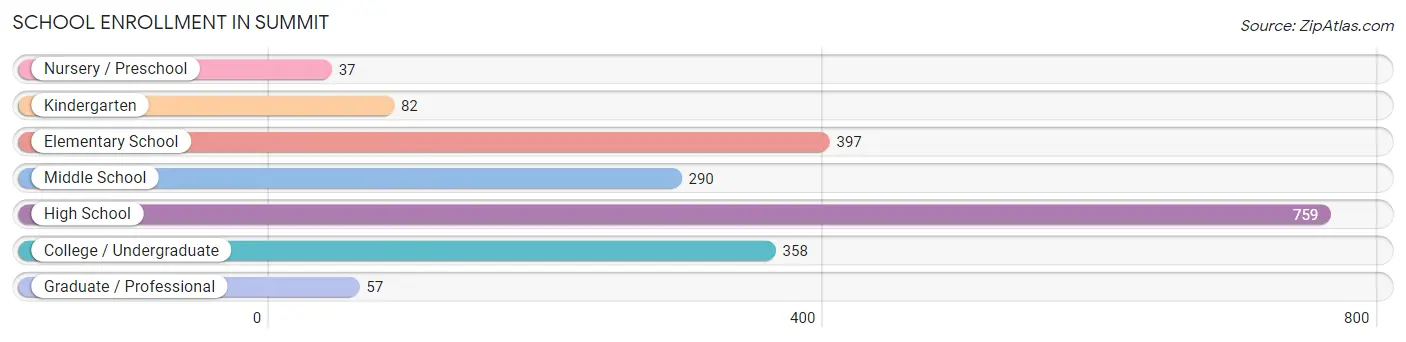
| School Level | # Students | % Students |
| Nursery / Preschool | 37 | 1.9% |
| Kindergarten | 82 | 4.1% |
| Elementary School | 397 | 20.1% |
| Middle School | 290 | 14.6% |
| High School | 759 | 38.3% |
| College / Undergraduate | 358 | 18.1% |
| Graduate / Professional | 57 | 2.9% |
| Total | 1,980 | 100.0% |
School Enrollment by Age by Funding Source in Summit
Out of a total of 1,980 students who are enrolled in schools in Summit, 360 (18.2%) attend a private institution, while the remaining 1,620 (81.8%) are enrolled in public schools. The age group of 18 to 19 year olds has the highest likelihood of being enrolled in private schools, with 48 (41.4% in the age bracket) enrolled. Conversely, the age group of 3 to 4 year olds has the lowest likelihood of being enrolled in a private school, with 29 (100.0% in the age bracket) attending a public institution.
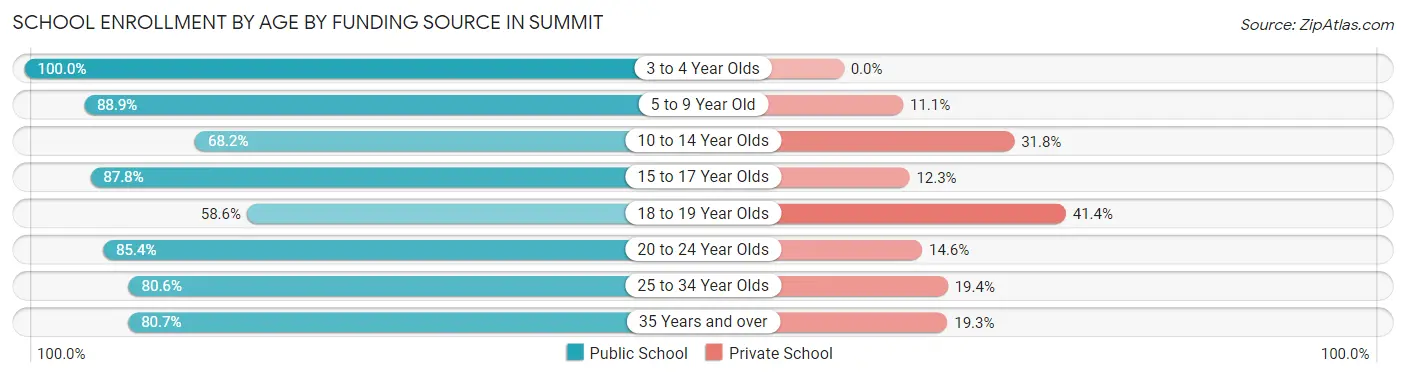
| Age Bracket | Public School | Private School |
| 3 to 4 Year Olds | 29 (100.0%) | 0 (0.0%) |
| 5 to 9 Year Old | 410 (88.9%) | 51 (11.1%) |
| 10 to 14 Year Olds | 260 (68.2%) | 121 (31.8%) |
| 15 to 17 Year Olds | 580 (87.7%) | 81 (12.2%) |
| 18 to 19 Year Olds | 68 (58.6%) | 48 (41.4%) |
| 20 to 24 Year Olds | 76 (85.4%) | 13 (14.6%) |
| 25 to 34 Year Olds | 104 (80.6%) | 25 (19.4%) |
| 35 Years and over | 92 (80.7%) | 22 (19.3%) |
| Total | 1,620 (81.8%) | 360 (18.2%) |
Educational Attainment by Field of Study in Summit
Business (349 | 22.1%), education (256 | 16.2%), science & technology (136 | 8.6%), social sciences (119 | 7.5%), and literature & languages (103 | 6.5%) are the most common fields of study among 1,582 individuals in Summit who have obtained a bachelor's degree or higher.
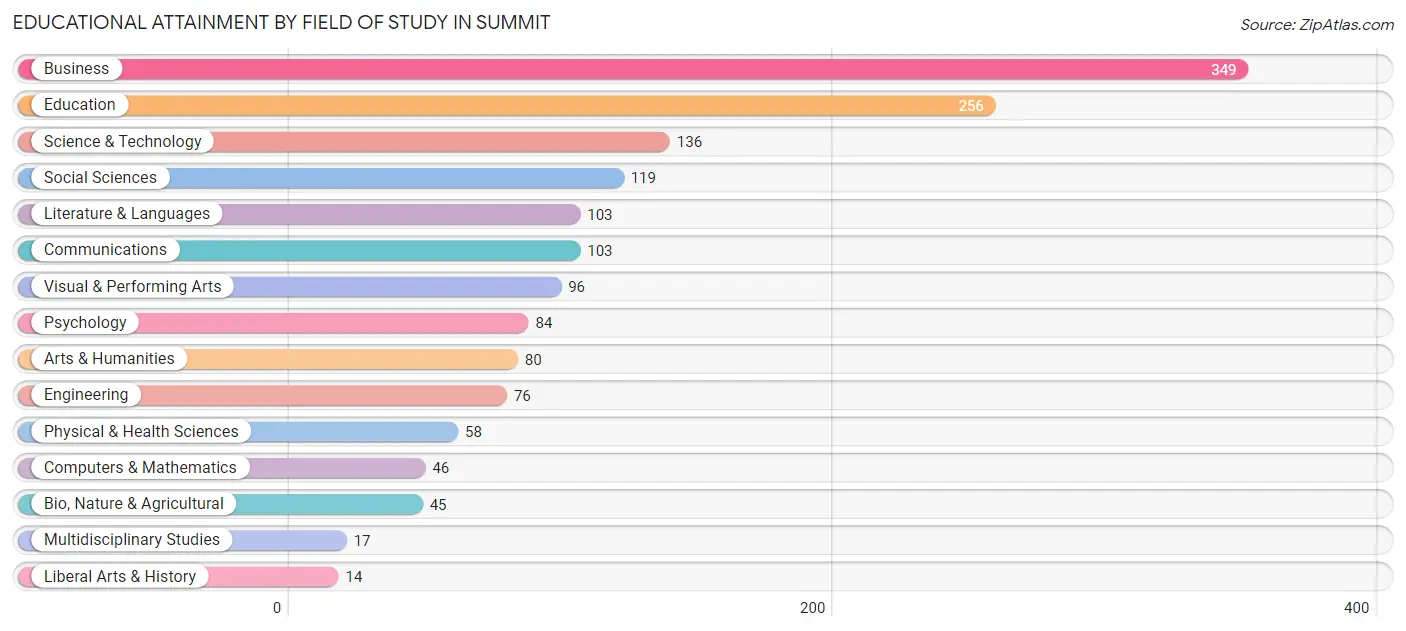
| Field of Study | # Graduates | % Graduates |
| Computers & Mathematics | 46 | 2.9% |
| Bio, Nature & Agricultural | 45 | 2.8% |
| Physical & Health Sciences | 58 | 3.7% |
| Psychology | 84 | 5.3% |
| Social Sciences | 119 | 7.5% |
| Engineering | 76 | 4.8% |
| Multidisciplinary Studies | 17 | 1.1% |
| Science & Technology | 136 | 8.6% |
| Business | 349 | 22.1% |
| Education | 256 | 16.2% |
| Literature & Languages | 103 | 6.5% |
| Liberal Arts & History | 14 | 0.9% |
| Visual & Performing Arts | 96 | 6.1% |
| Communications | 103 | 6.5% |
| Arts & Humanities | 80 | 5.1% |
| Total | 1,582 | 100.0% |
Transportation & Commute in Summit
Vehicle Availability by Sex in Summit
The most prevalent vehicle ownership categories in Summit are males with 2 vehicles (940, accounting for 43.0%) and females with 2 vehicles (463, making up 50.5%).
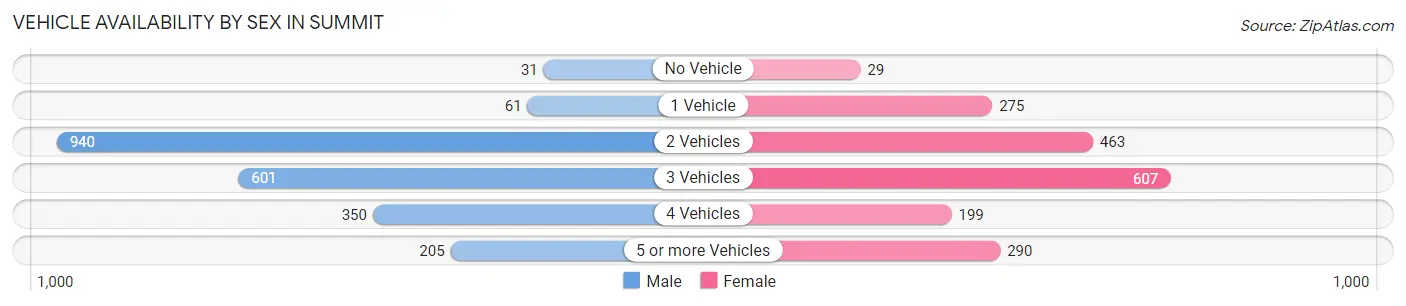
| Vehicles Available | Male | Female |
| No Vehicle | 31 (1.4%) | 29 (1.6%) |
| 1 Vehicle | 61 (2.8%) | 275 (14.8%) |
| 2 Vehicles | 940 (43.0%) | 463 (24.8%) |
| 3 Vehicles | 601 (27.5%) | 607 (32.6%) |
| 4 Vehicles | 350 (16.0%) | 199 (10.7%) |
| 5 or more Vehicles | 205 (9.4%) | 290 (15.6%) |
| Total | 2,188 (100.0%) | 1,863 (100.0%) |
Commute Time in Summit
The most frequently occuring commute durations in Summit are 15 to 19 minutes (847 commuters, 22.4%), 20 to 24 minutes (666 commuters, 17.6%), and 30 to 34 minutes (447 commuters, 11.8%).
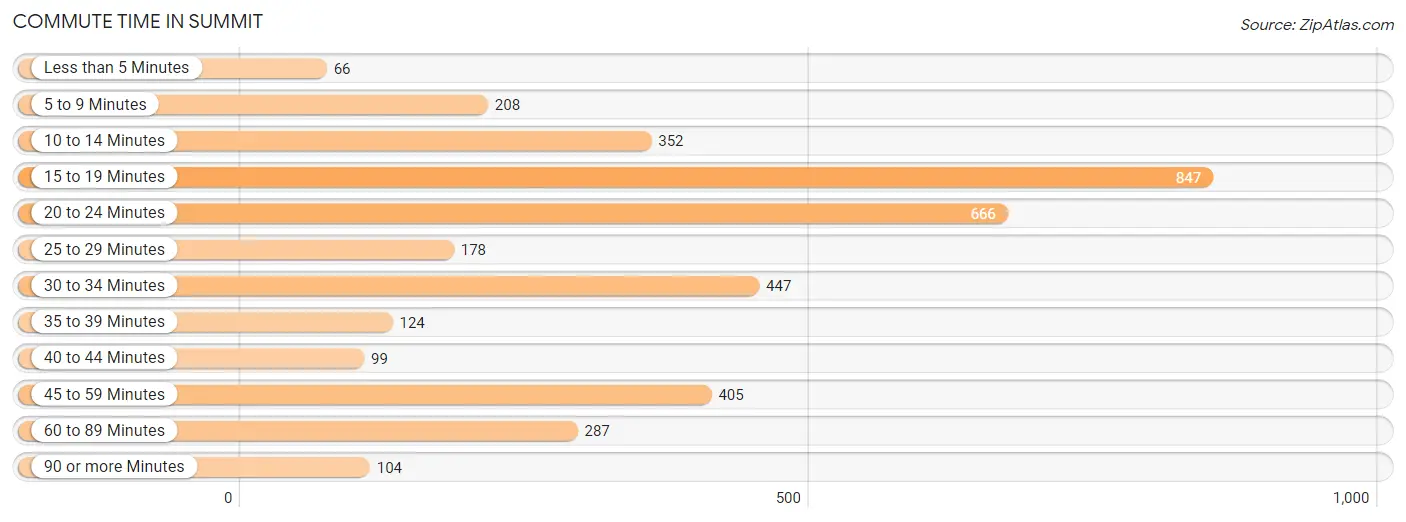
| Commute Time | # Commuters | % Commuters |
| Less than 5 Minutes | 66 | 1.7% |
| 5 to 9 Minutes | 208 | 5.5% |
| 10 to 14 Minutes | 352 | 9.3% |
| 15 to 19 Minutes | 847 | 22.4% |
| 20 to 24 Minutes | 666 | 17.6% |
| 25 to 29 Minutes | 178 | 4.7% |
| 30 to 34 Minutes | 447 | 11.8% |
| 35 to 39 Minutes | 124 | 3.3% |
| 40 to 44 Minutes | 99 | 2.6% |
| 45 to 59 Minutes | 405 | 10.7% |
| 60 to 89 Minutes | 287 | 7.6% |
| 90 or more Minutes | 104 | 2.8% |
Commute Time by Sex in Summit
The most common commute times in Summit are 15 to 19 minutes (425 commuters, 20.5%) for males and 15 to 19 minutes (422 commuters, 24.6%) for females.
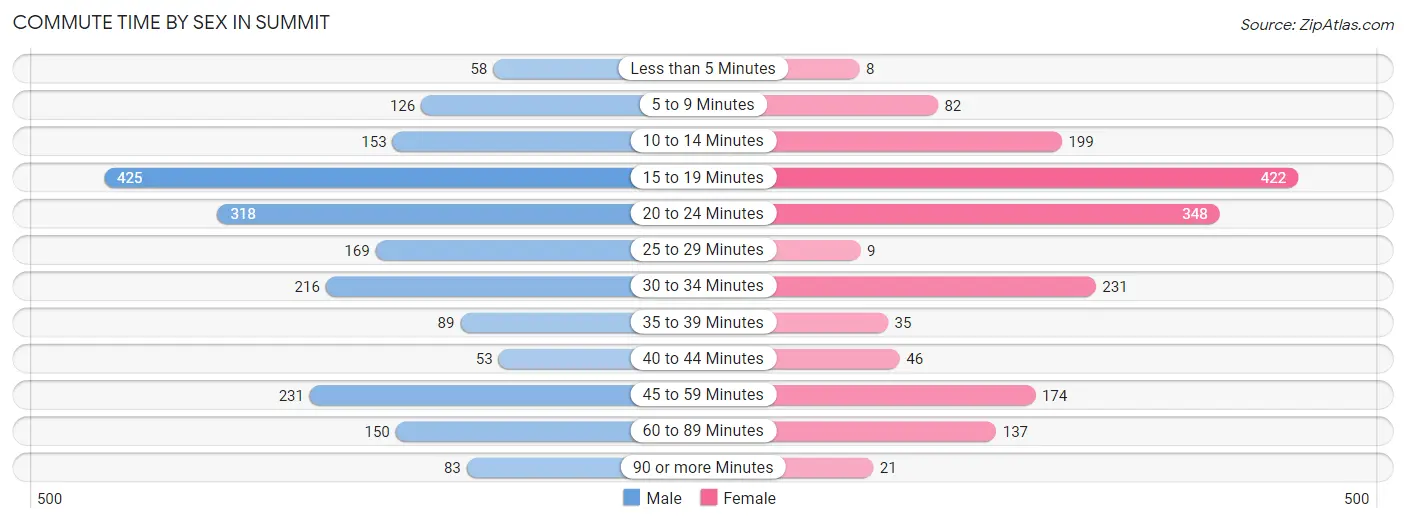
| Commute Time | Male | Female |
| Less than 5 Minutes | 58 (2.8%) | 8 (0.5%) |
| 5 to 9 Minutes | 126 (6.1%) | 82 (4.8%) |
| 10 to 14 Minutes | 153 (7.4%) | 199 (11.6%) |
| 15 to 19 Minutes | 425 (20.5%) | 422 (24.6%) |
| 20 to 24 Minutes | 318 (15.3%) | 348 (20.3%) |
| 25 to 29 Minutes | 169 (8.2%) | 9 (0.5%) |
| 30 to 34 Minutes | 216 (10.4%) | 231 (13.5%) |
| 35 to 39 Minutes | 89 (4.3%) | 35 (2.0%) |
| 40 to 44 Minutes | 53 (2.6%) | 46 (2.7%) |
| 45 to 59 Minutes | 231 (11.2%) | 174 (10.2%) |
| 60 to 89 Minutes | 150 (7.2%) | 137 (8.0%) |
| 90 or more Minutes | 83 (4.0%) | 21 (1.2%) |
Time of Departure to Work by Sex in Summit
The most frequent times of departure to work in Summit are 7:00 AM to 7:29 AM (287, 13.9%) for males and 8:00 AM to 8:29 AM (265, 15.5%) for females.
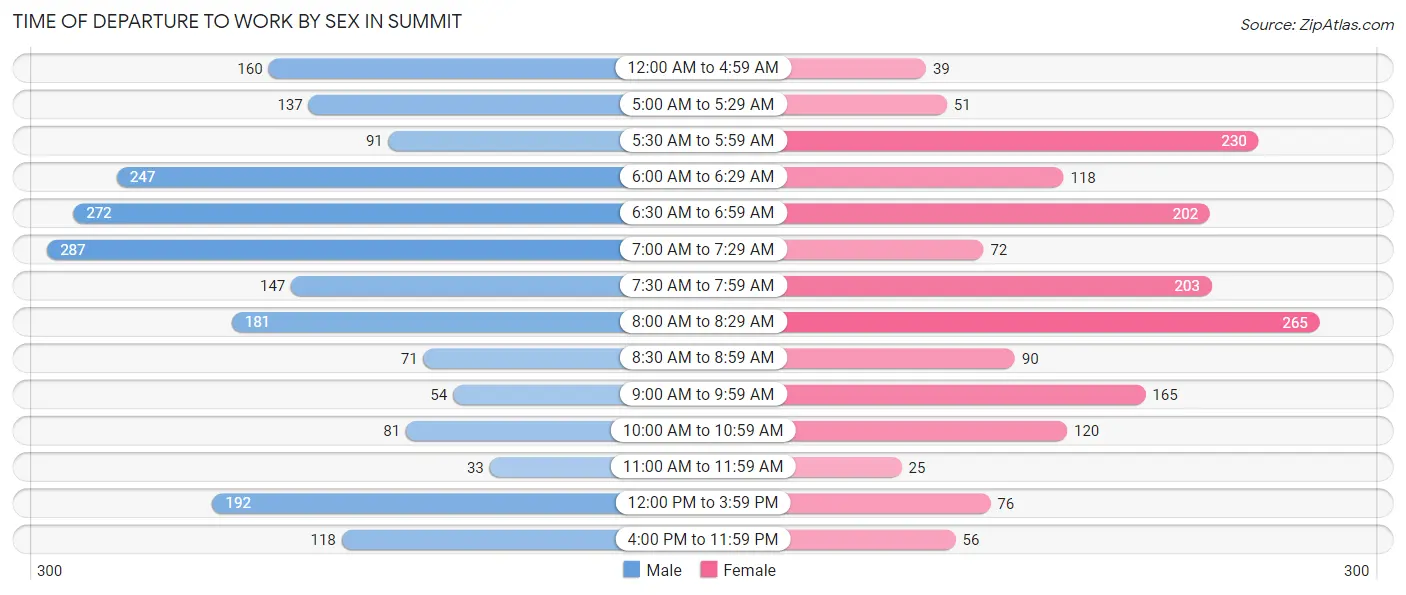
| Time of Departure | Male | Female |
| 12:00 AM to 4:59 AM | 160 (7.7%) | 39 (2.3%) |
| 5:00 AM to 5:29 AM | 137 (6.6%) | 51 (3.0%) |
| 5:30 AM to 5:59 AM | 91 (4.4%) | 230 (13.4%) |
| 6:00 AM to 6:29 AM | 247 (11.9%) | 118 (6.9%) |
| 6:30 AM to 6:59 AM | 272 (13.1%) | 202 (11.8%) |
| 7:00 AM to 7:29 AM | 287 (13.9%) | 72 (4.2%) |
| 7:30 AM to 7:59 AM | 147 (7.1%) | 203 (11.9%) |
| 8:00 AM to 8:29 AM | 181 (8.7%) | 265 (15.5%) |
| 8:30 AM to 8:59 AM | 71 (3.4%) | 90 (5.3%) |
| 9:00 AM to 9:59 AM | 54 (2.6%) | 165 (9.6%) |
| 10:00 AM to 10:59 AM | 81 (3.9%) | 120 (7.0%) |
| 11:00 AM to 11:59 AM | 33 (1.6%) | 25 (1.5%) |
| 12:00 PM to 3:59 PM | 192 (9.3%) | 76 (4.4%) |
| 4:00 PM to 11:59 PM | 118 (5.7%) | 56 (3.3%) |
| Total | 2,071 (100.0%) | 1,712 (100.0%) |
Housing Occupancy in Summit
Occupancy by Ownership in Summit
Of the total 3,362 dwellings in Summit, owner-occupied units account for 2,768 (82.3%), while renter-occupied units make up 594 (17.7%).
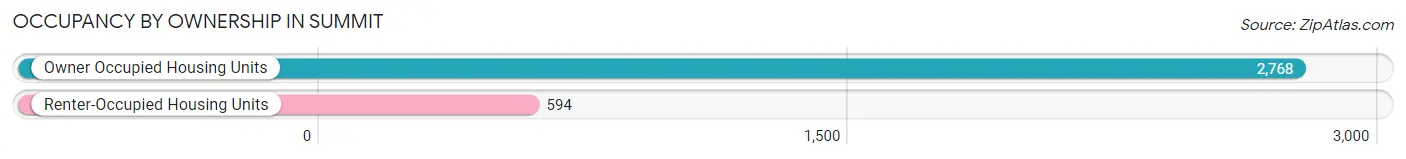
| Occupancy | # Housing Units | % Housing Units |
| Owner Occupied Housing Units | 2,768 | 82.3% |
| Renter-Occupied Housing Units | 594 | 17.7% |
| Total Occupied Housing Units | 3,362 | 100.0% |
Occupancy by Household Size in Summit
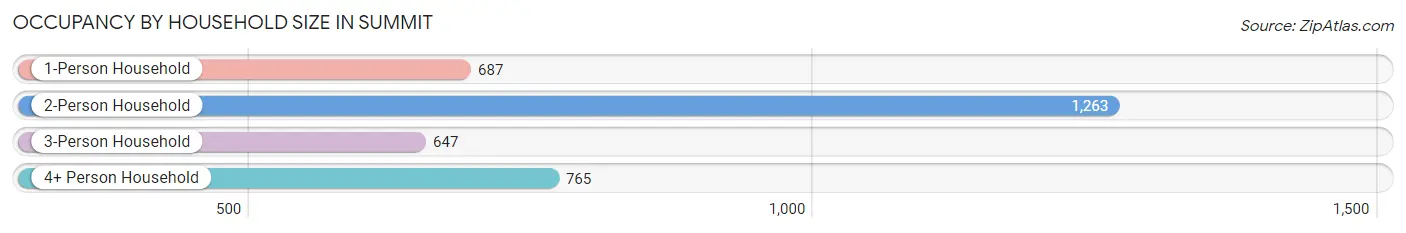
| Household Size | # Housing Units | % Housing Units |
| 1-Person Household | 687 | 20.4% |
| 2-Person Household | 1,263 | 37.6% |
| 3-Person Household | 647 | 19.2% |
| 4+ Person Household | 765 | 22.8% |
| Total Housing Units | 3,362 | 100.0% |
Occupancy by Ownership by Household Size in Summit
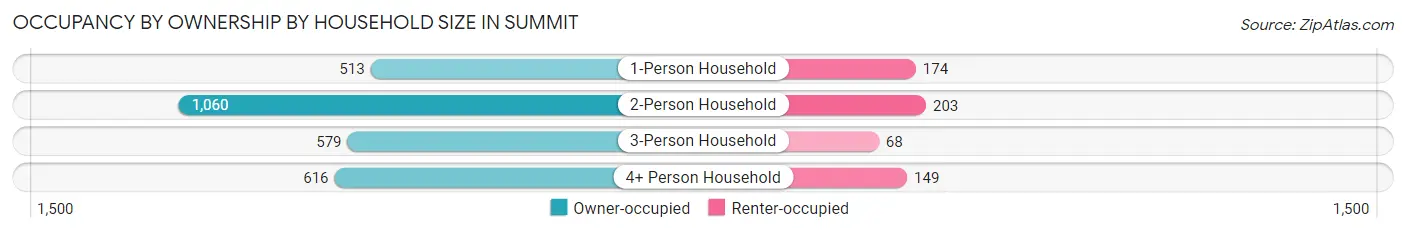
| Household Size | Owner-occupied | Renter-occupied |
| 1-Person Household | 513 (74.7%) | 174 (25.3%) |
| 2-Person Household | 1,060 (83.9%) | 203 (16.1%) |
| 3-Person Household | 579 (89.5%) | 68 (10.5%) |
| 4+ Person Household | 616 (80.5%) | 149 (19.5%) |
| Total Housing Units | 2,768 (82.3%) | 594 (17.7%) |
Occupancy by Educational Attainment in Summit
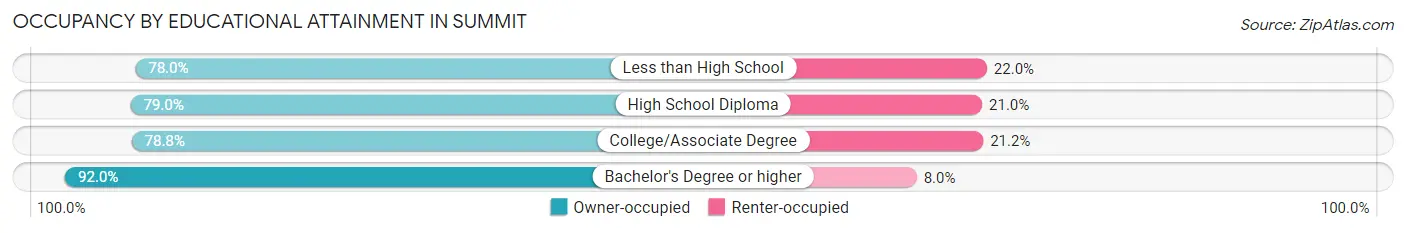
| Household Size | Owner-occupied | Renter-occupied |
| Less than High School | 199 (78.0%) | 56 (22.0%) |
| High School Diploma | 602 (79.0%) | 160 (21.0%) |
| College/Associate Degree | 1,132 (78.8%) | 305 (21.2%) |
| Bachelor's Degree or higher | 835 (92.0%) | 73 (8.0%) |
Occupancy by Age of Householder in Summit
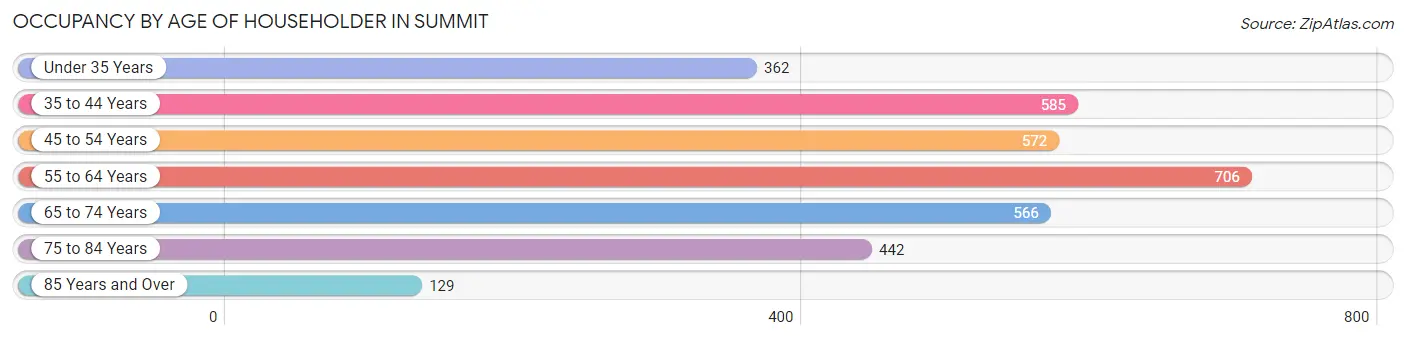
| Age Bracket | # Households | % Households |
| Under 35 Years | 362 | 10.8% |
| 35 to 44 Years | 585 | 17.4% |
| 45 to 54 Years | 572 | 17.0% |
| 55 to 64 Years | 706 | 21.0% |
| 65 to 74 Years | 566 | 16.8% |
| 75 to 84 Years | 442 | 13.2% |
| 85 Years and Over | 129 | 3.8% |
| Total | 3,362 | 100.0% |
Housing Finances in Summit
Median Income by Occupancy in Summit
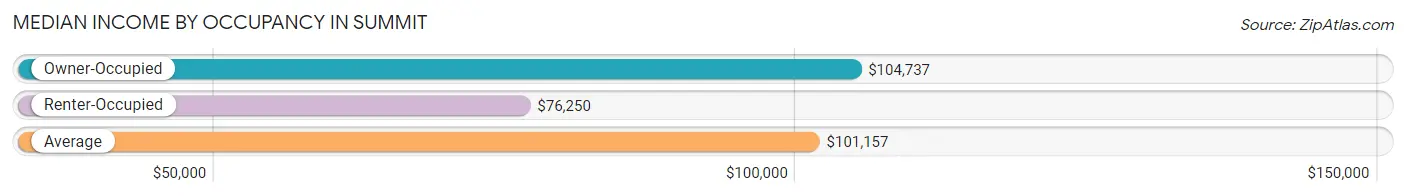
| Occupancy Type | # Households | Median Income |
| Owner-Occupied | 2,768 (82.3%) | $104,737 |
| Renter-Occupied | 594 (17.7%) | $76,250 |
| Average | 3,362 (100.0%) | $101,157 |
Occupancy by Householder Income Bracket in Summit
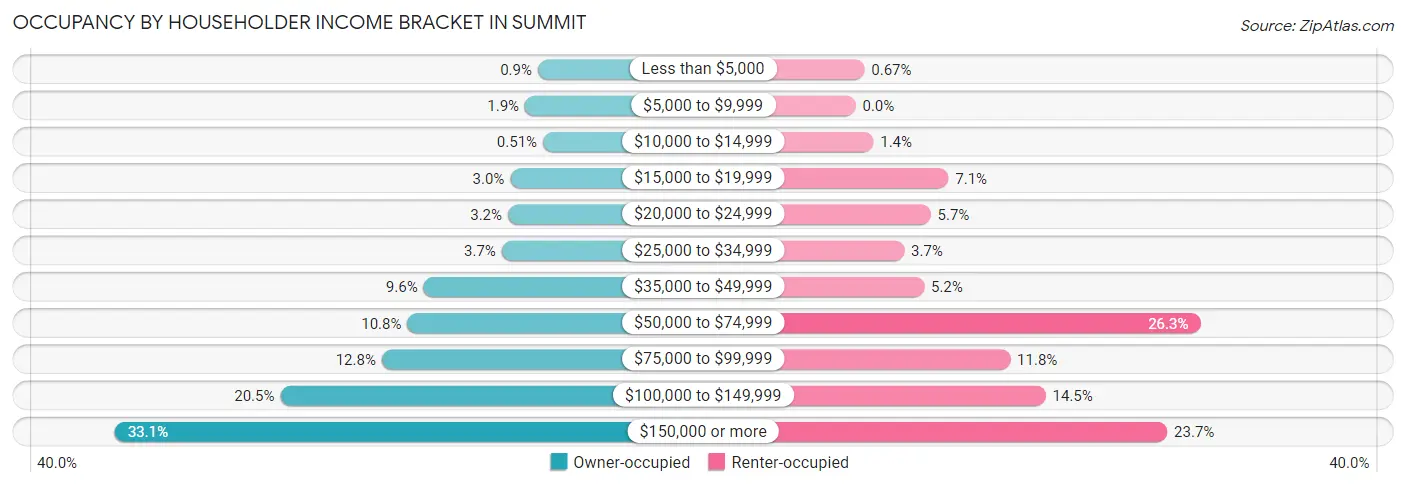
| Income Bracket | Owner-occupied | Renter-occupied |
| Less than $5,000 | 25 (0.9%) | 4 (0.7%) |
| $5,000 to $9,999 | 52 (1.9%) | 0 (0.0%) |
| $10,000 to $14,999 | 14 (0.5%) | 8 (1.3%) |
| $15,000 to $19,999 | 83 (3.0%) | 42 (7.1%) |
| $20,000 to $24,999 | 88 (3.2%) | 34 (5.7%) |
| $25,000 to $34,999 | 101 (3.6%) | 22 (3.7%) |
| $35,000 to $49,999 | 266 (9.6%) | 31 (5.2%) |
| $50,000 to $74,999 | 300 (10.8%) | 156 (26.3%) |
| $75,000 to $99,999 | 354 (12.8%) | 70 (11.8%) |
| $100,000 to $149,999 | 568 (20.5%) | 86 (14.5%) |
| $150,000 or more | 917 (33.1%) | 141 (23.7%) |
| Total | 2,768 (100.0%) | 594 (100.0%) |
Monthly Housing Cost Tiers in Summit
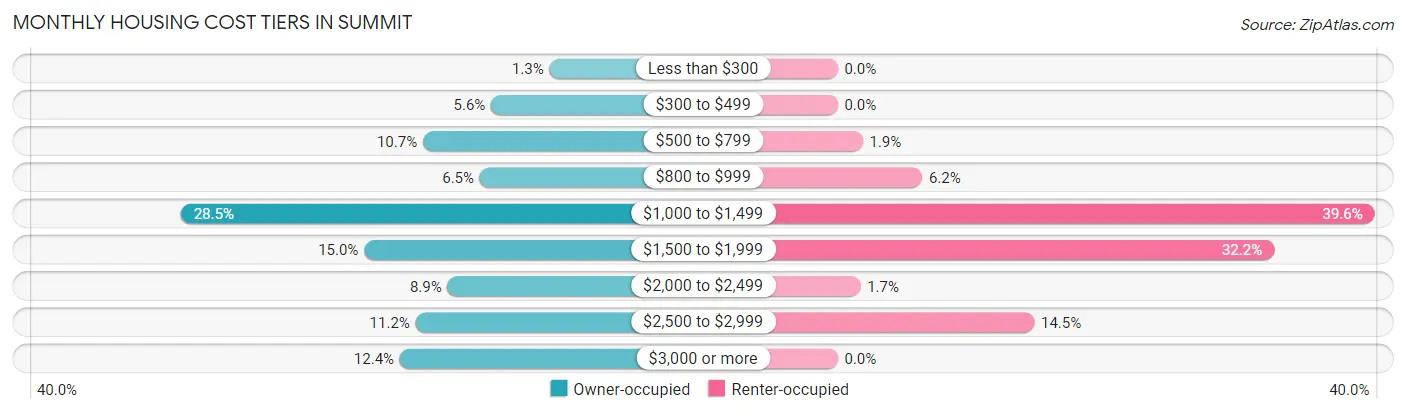
| Monthly Cost | Owner-occupied | Renter-occupied |
| Less than $300 | 37 (1.3%) | 0 (0.0%) |
| $300 to $499 | 156 (5.6%) | 0 (0.0%) |
| $500 to $799 | 295 (10.7%) | 11 (1.8%) |
| $800 to $999 | 179 (6.5%) | 37 (6.2%) |
| $1,000 to $1,499 | 789 (28.5%) | 235 (39.6%) |
| $1,500 to $1,999 | 415 (15.0%) | 191 (32.2%) |
| $2,000 to $2,499 | 245 (8.8%) | 10 (1.7%) |
| $2,500 to $2,999 | 310 (11.2%) | 86 (14.5%) |
| $3,000 or more | 342 (12.4%) | 0 (0.0%) |
| Total | 2,768 (100.0%) | 594 (100.0%) |
Physical Housing Characteristics in Summit
Housing Structures in Summit
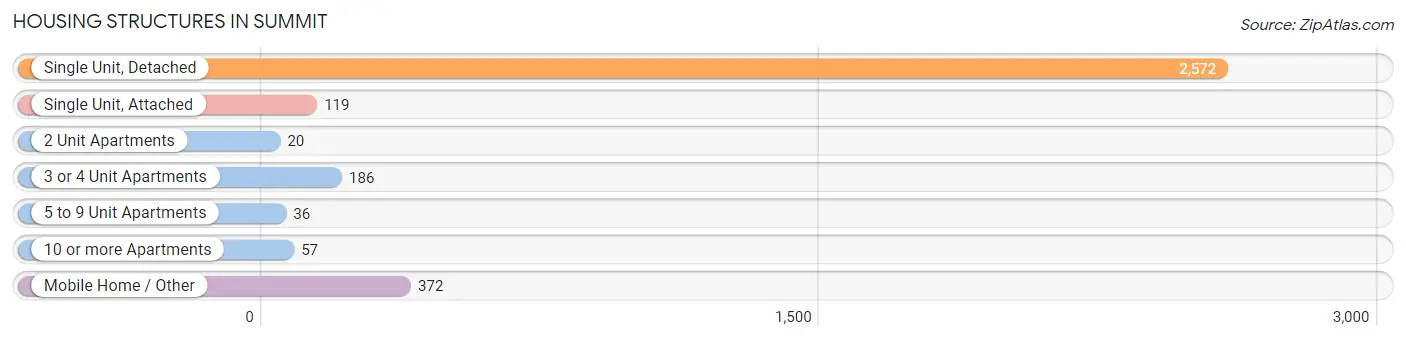
| Structure Type | # Housing Units | % Housing Units |
| Single Unit, Detached | 2,572 | 76.5% |
| Single Unit, Attached | 119 | 3.5% |
| 2 Unit Apartments | 20 | 0.6% |
| 3 or 4 Unit Apartments | 186 | 5.5% |
| 5 to 9 Unit Apartments | 36 | 1.1% |
| 10 or more Apartments | 57 | 1.7% |
| Mobile Home / Other | 372 | 11.1% |
| Total | 3,362 | 100.0% |
Housing Structures by Occupancy in Summit
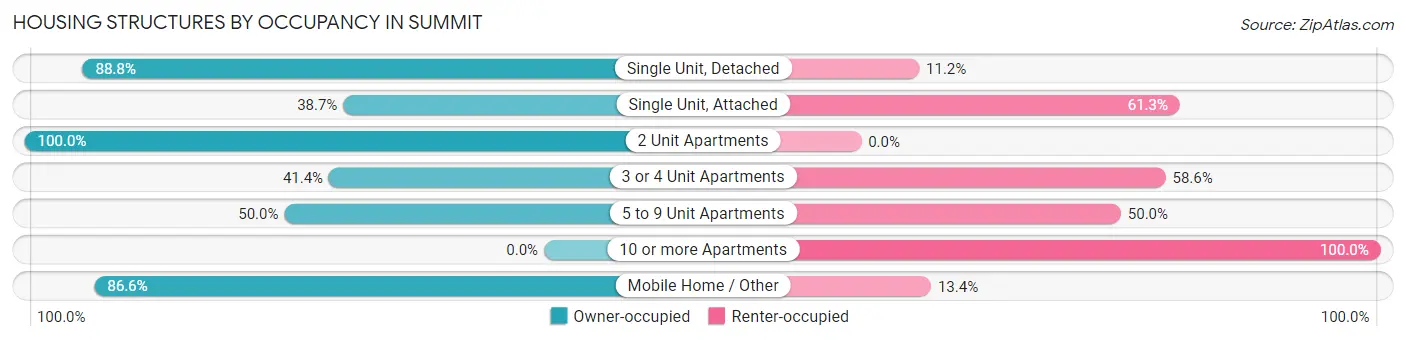
| Structure Type | Owner-occupied | Renter-occupied |
| Single Unit, Detached | 2,285 (88.8%) | 287 (11.2%) |
| Single Unit, Attached | 46 (38.7%) | 73 (61.3%) |
| 2 Unit Apartments | 20 (100.0%) | 0 (0.0%) |
| 3 or 4 Unit Apartments | 77 (41.4%) | 109 (58.6%) |
| 5 to 9 Unit Apartments | 18 (50.0%) | 18 (50.0%) |
| 10 or more Apartments | 0 (0.0%) | 57 (100.0%) |
| Mobile Home / Other | 322 (86.6%) | 50 (13.4%) |
| Total | 2,768 (82.3%) | 594 (17.7%) |
Housing Structures by Number of Rooms in Summit
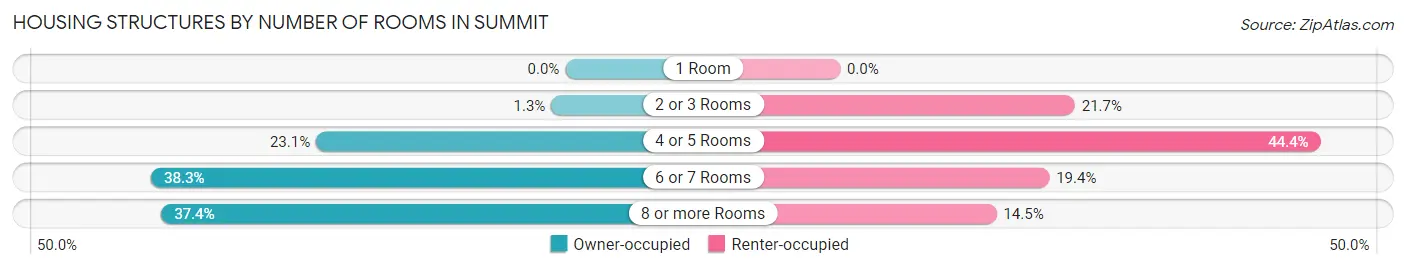
| Number of Rooms | Owner-occupied | Renter-occupied |
| 1 Room | 0 (0.0%) | 0 (0.0%) |
| 2 or 3 Rooms | 36 (1.3%) | 129 (21.7%) |
| 4 or 5 Rooms | 638 (23.1%) | 264 (44.4%) |
| 6 or 7 Rooms | 1,060 (38.3%) | 115 (19.4%) |
| 8 or more Rooms | 1,034 (37.4%) | 86 (14.5%) |
| Total | 2,768 (100.0%) | 594 (100.0%) |
Housing Structure by Heating Type in Summit
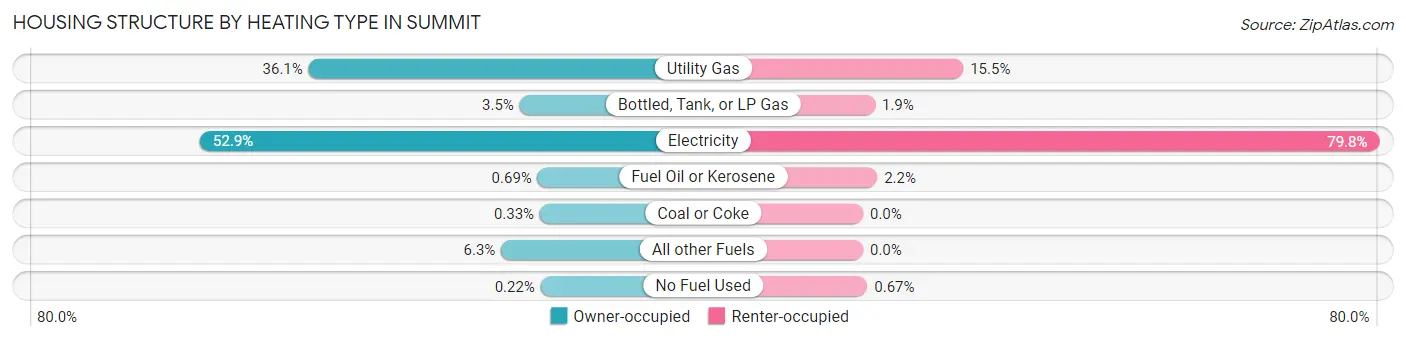
| Heating Type | Owner-occupied | Renter-occupied |
| Utility Gas | 999 (36.1%) | 92 (15.5%) |
| Bottled, Tank, or LP Gas | 96 (3.5%) | 11 (1.8%) |
| Electricity | 1,464 (52.9%) | 474 (79.8%) |
| Fuel Oil or Kerosene | 19 (0.7%) | 13 (2.2%) |
| Coal or Coke | 9 (0.3%) | 0 (0.0%) |
| All other Fuels | 175 (6.3%) | 0 (0.0%) |
| No Fuel Used | 6 (0.2%) | 4 (0.7%) |
| Total | 2,768 (100.0%) | 594 (100.0%) |
Household Vehicle Usage in Summit
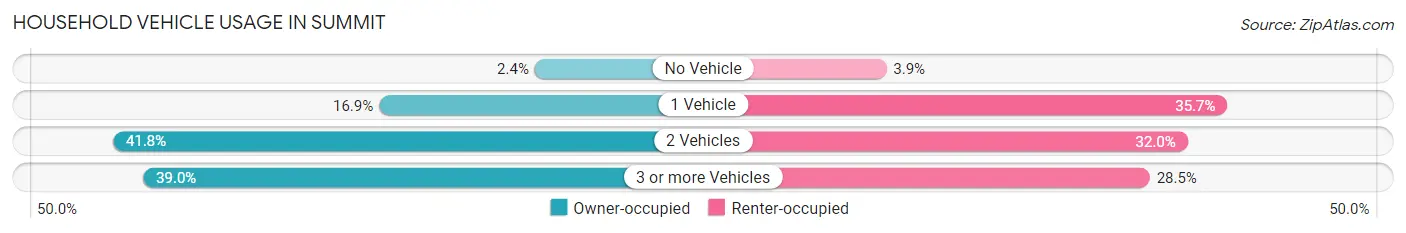
| Vehicles per Household | Owner-occupied | Renter-occupied |
| No Vehicle | 66 (2.4%) | 23 (3.9%) |
| 1 Vehicle | 468 (16.9%) | 212 (35.7%) |
| 2 Vehicles | 1,156 (41.8%) | 190 (32.0%) |
| 3 or more Vehicles | 1,078 (39.0%) | 169 (28.4%) |
| Total | 2,768 (100.0%) | 594 (100.0%) |
Real Estate & Mortgages in Summit
Real Estate and Mortgage Overview in Summit
| Characteristic | Without Mortgage | With Mortgage |
| Housing Units | 1,074 | 1,694 |
| Median Property Value | $400,500 | $473,300 |
| Median Household Income | $77,228 | $728 |
| Monthly Housing Costs | $851 | $335 |
| Real Estate Taxes | $4,316 | $24 |
Property Value by Mortgage Status in Summit
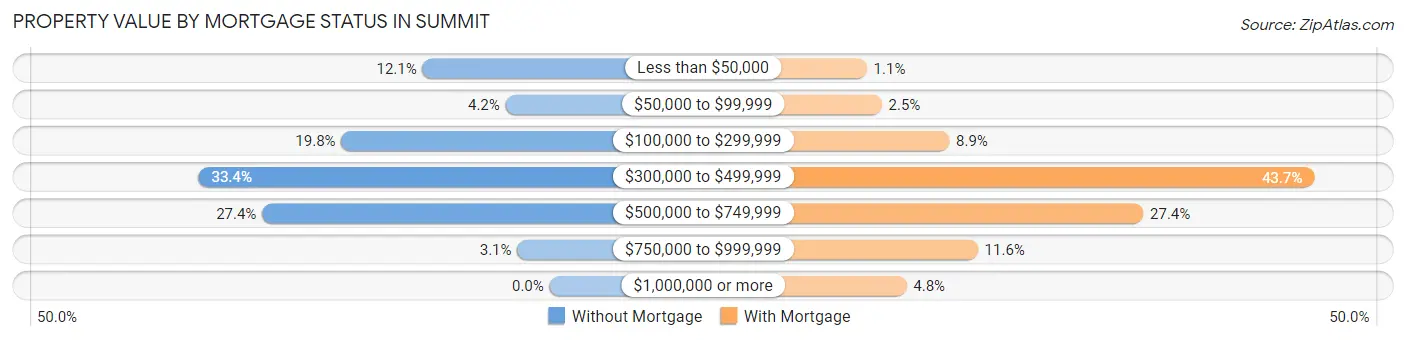
| Property Value | Without Mortgage | With Mortgage |
| Less than $50,000 | 130 (12.1%) | 18 (1.1%) |
| $50,000 to $99,999 | 45 (4.2%) | 42 (2.5%) |
| $100,000 to $299,999 | 213 (19.8%) | 151 (8.9%) |
| $300,000 to $499,999 | 359 (33.4%) | 740 (43.7%) |
| $500,000 to $749,999 | 294 (27.4%) | 464 (27.4%) |
| $750,000 to $999,999 | 33 (3.1%) | 197 (11.6%) |
| $1,000,000 or more | 0 (0.0%) | 82 (4.8%) |
| Total | 1,074 (100.0%) | 1,694 (100.0%) |
Household Income by Mortgage Status in Summit
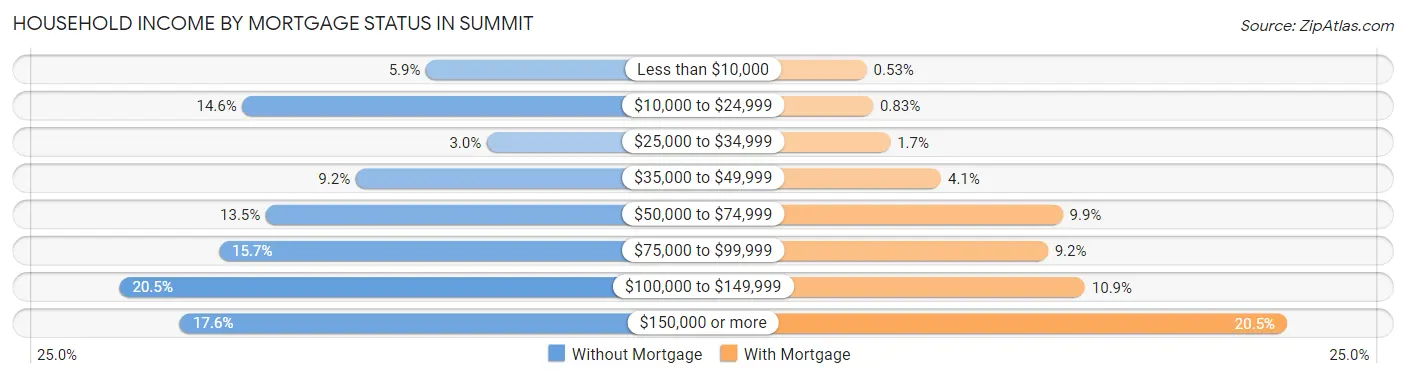
| Household Income | Without Mortgage | With Mortgage |
| Less than $10,000 | 63 (5.9%) | 9 (0.5%) |
| $10,000 to $24,999 | 157 (14.6%) | 14 (0.8%) |
| $25,000 to $34,999 | 32 (3.0%) | 28 (1.7%) |
| $35,000 to $49,999 | 99 (9.2%) | 69 (4.1%) |
| $50,000 to $74,999 | 145 (13.5%) | 167 (9.9%) |
| $75,000 to $99,999 | 169 (15.7%) | 155 (9.1%) |
| $100,000 to $149,999 | 220 (20.5%) | 185 (10.9%) |
| $150,000 or more | 189 (17.6%) | 348 (20.5%) |
| Total | 1,074 (100.0%) | 1,694 (100.0%) |
Property Value to Household Income Ratio in Summit
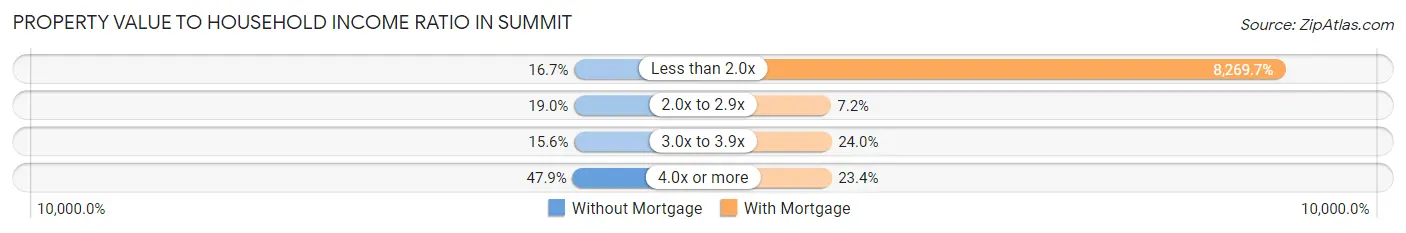
| Value-to-Income Ratio | Without Mortgage | With Mortgage |
| Less than 2.0x | 179 (16.7%) | 140,088 (8,269.7%) |
| 2.0x to 2.9x | 204 (19.0%) | 122 (7.2%) |
| 3.0x to 3.9x | 168 (15.6%) | 406 (24.0%) |
| 4.0x or more | 514 (47.9%) | 397 (23.4%) |
| Total | 1,074 (100.0%) | 1,694 (100.0%) |
Real Estate Taxes by Mortgage Status in Summit
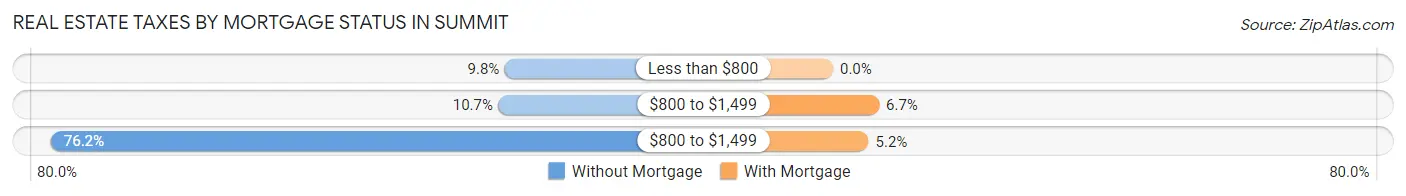
| Property Taxes | Without Mortgage | With Mortgage |
| Less than $800 | 105 (9.8%) | 0 (0.0%) |
| $800 to $1,499 | 115 (10.7%) | 114 (6.7%) |
| $800 to $1,499 | 818 (76.2%) | 88 (5.2%) |
| Total | 1,074 (100.0%) | 1,694 (100.0%) |
Health & Disability in Summit
Health Insurance Coverage by Age in Summit
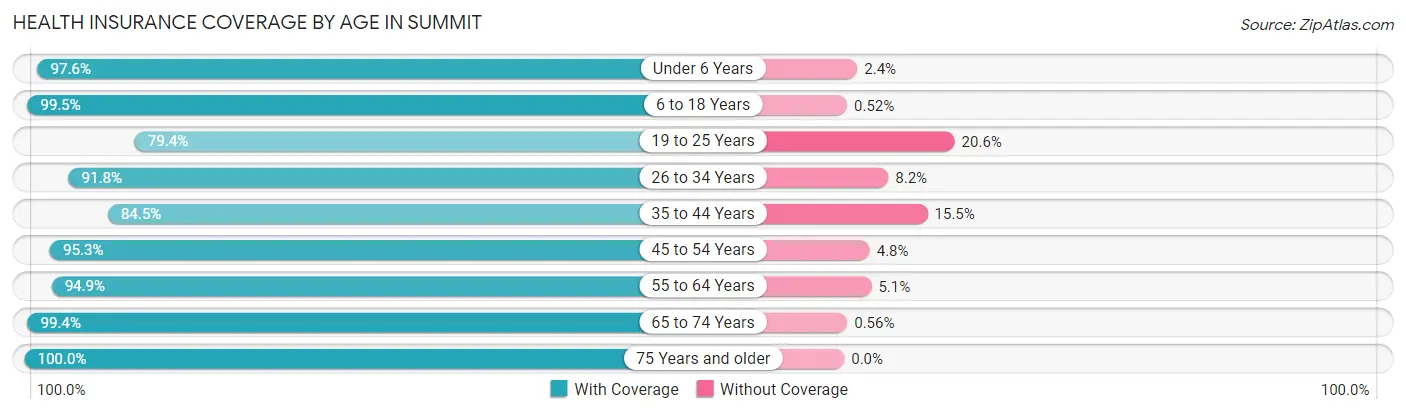
| Age Bracket | With Coverage | Without Coverage |
| Under 6 Years | 402 (97.6%) | 10 (2.4%) |
| 6 to 18 Years | 1,521 (99.5%) | 8 (0.5%) |
| 19 to 25 Years | 386 (79.4%) | 100 (20.6%) |
| 26 to 34 Years | 681 (91.8%) | 61 (8.2%) |
| 35 to 44 Years | 1,087 (84.5%) | 200 (15.5%) |
| 45 to 54 Years | 1,043 (95.3%) | 52 (4.8%) |
| 55 to 64 Years | 1,295 (94.9%) | 69 (5.1%) |
| 65 to 74 Years | 1,059 (99.4%) | 6 (0.6%) |
| 75 Years and older | 839 (100.0%) | 0 (0.0%) |
| Total | 8,313 (94.3%) | 506 (5.7%) |
Health Insurance Coverage by Citizenship Status in Summit
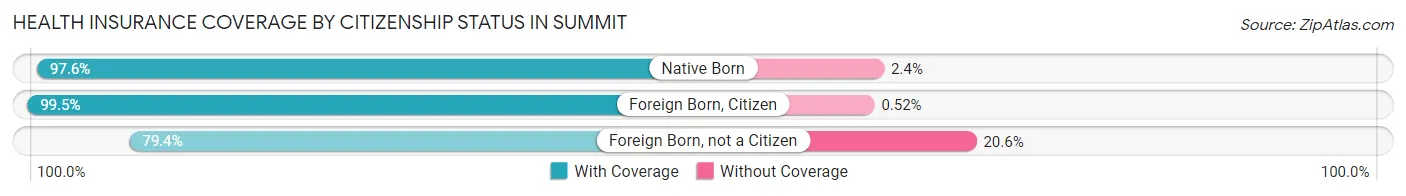
| Citizenship Status | With Coverage | Without Coverage |
| Native Born | 402 (97.6%) | 10 (2.4%) |
| Foreign Born, Citizen | 1,521 (99.5%) | 8 (0.5%) |
| Foreign Born, not a Citizen | 386 (79.4%) | 100 (20.6%) |
Health Insurance Coverage by Household Income in Summit
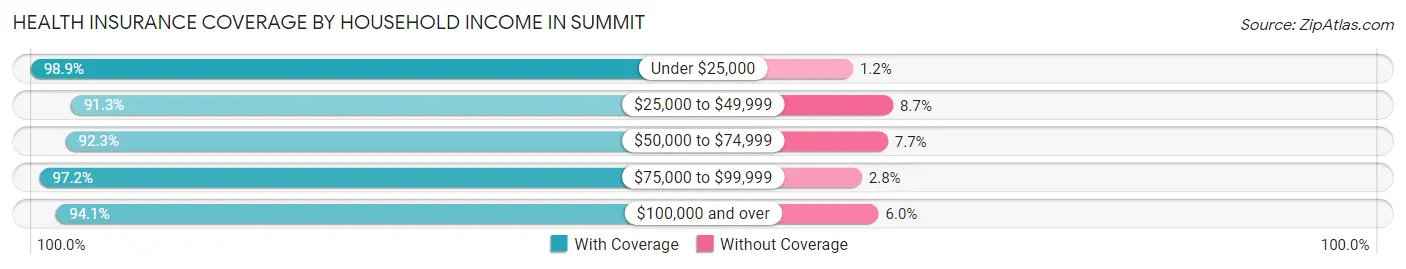
| Household Income | With Coverage | Without Coverage |
| Under $25,000 | 518 (98.9%) | 6 (1.1%) |
| $25,000 to $49,999 | 620 (91.3%) | 59 (8.7%) |
| $50,000 to $74,999 | 972 (92.3%) | 81 (7.7%) |
| $75,000 to $99,999 | 966 (97.2%) | 28 (2.8%) |
| $100,000 and over | 5,235 (94.1%) | 331 (5.9%) |
Public vs Private Health Insurance Coverage by Age in Summit
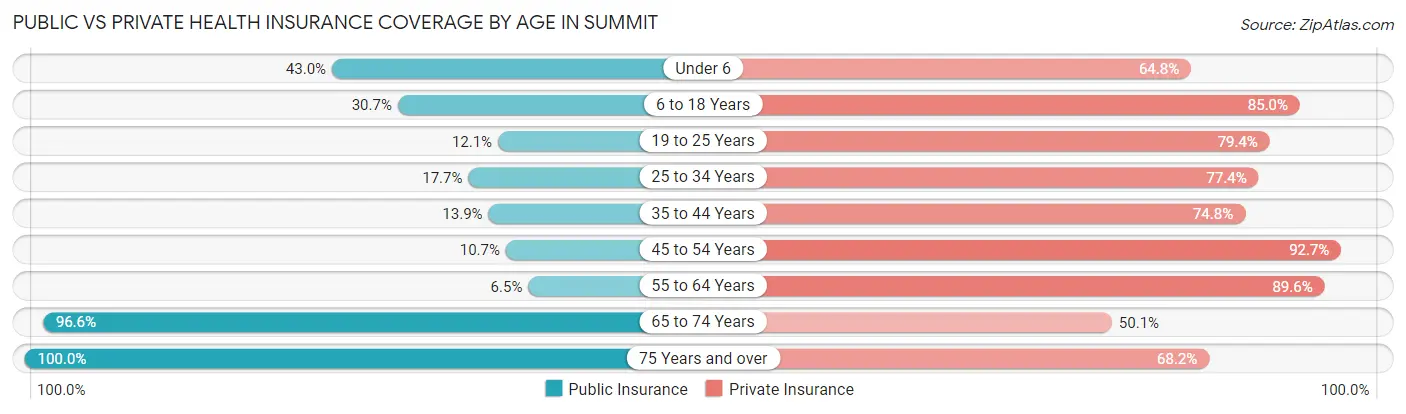
| Age Bracket | Public Insurance | Private Insurance |
| Under 6 | 177 (43.0%) | 267 (64.8%) |
| 6 to 18 Years | 470 (30.7%) | 1,300 (85.0%) |
| 19 to 25 Years | 59 (12.1%) | 386 (79.4%) |
| 25 to 34 Years | 131 (17.6%) | 574 (77.4%) |
| 35 to 44 Years | 179 (13.9%) | 963 (74.8%) |
| 45 to 54 Years | 117 (10.7%) | 1,015 (92.7%) |
| 55 to 64 Years | 89 (6.5%) | 1,222 (89.6%) |
| 65 to 74 Years | 1,029 (96.6%) | 534 (50.1%) |
| 75 Years and over | 839 (100.0%) | 572 (68.2%) |
| Total | 3,090 (35.0%) | 6,833 (77.5%) |
Disability Status by Sex by Age in Summit
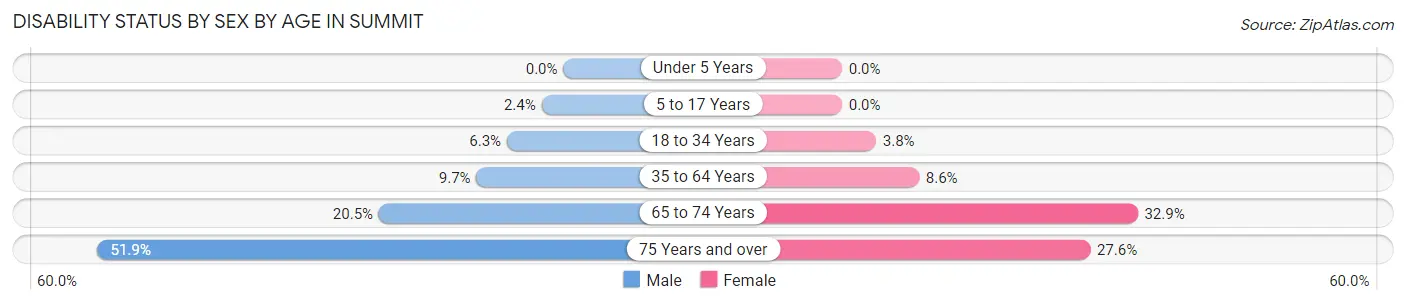
| Age Bracket | Male | Female |
| Under 5 Years | 0 (0.0%) | 0 (0.0%) |
| 5 to 17 Years | 22 (2.4%) | 0 (0.0%) |
| 18 to 34 Years | 49 (6.3%) | 20 (3.8%) |
| 35 to 64 Years | 164 (9.7%) | 176 (8.6%) |
| 65 to 74 Years | 99 (20.5%) | 192 (32.9%) |
| 75 Years and over | 180 (51.9%) | 136 (27.6%) |
Disability Class by Sex by Age in Summit
Disability Class: Hearing Difficulty
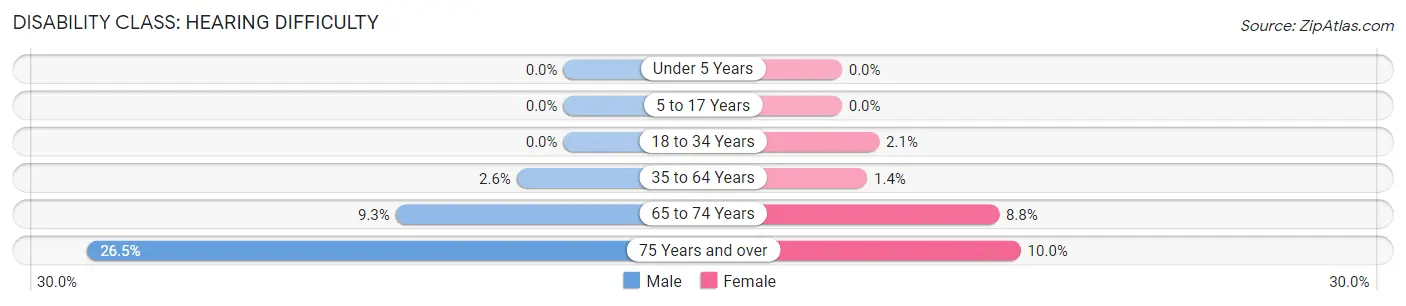
| Age Bracket | Male | Female |
| Under 5 Years | 0 (0.0%) | 0 (0.0%) |
| 5 to 17 Years | 0 (0.0%) | 0 (0.0%) |
| 18 to 34 Years | 0 (0.0%) | 11 (2.1%) |
| 35 to 64 Years | 44 (2.6%) | 29 (1.4%) |
| 65 to 74 Years | 45 (9.3%) | 51 (8.7%) |
| 75 Years and over | 92 (26.5%) | 49 (10.0%) |
Disability Class: Vision Difficulty
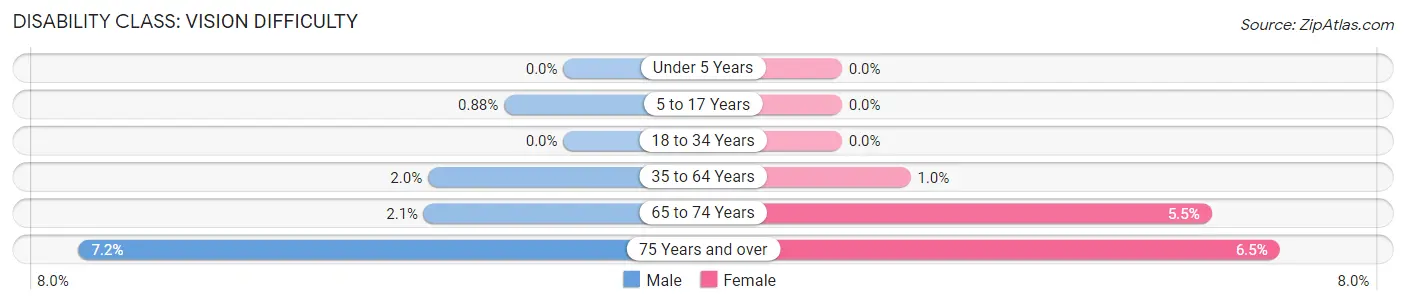
| Age Bracket | Male | Female |
| Under 5 Years | 0 (0.0%) | 0 (0.0%) |
| 5 to 17 Years | 8 (0.9%) | 0 (0.0%) |
| 18 to 34 Years | 0 (0.0%) | 0 (0.0%) |
| 35 to 64 Years | 34 (2.0%) | 21 (1.0%) |
| 65 to 74 Years | 10 (2.1%) | 32 (5.5%) |
| 75 Years and over | 25 (7.2%) | 32 (6.5%) |
Disability Class: Cognitive Difficulty
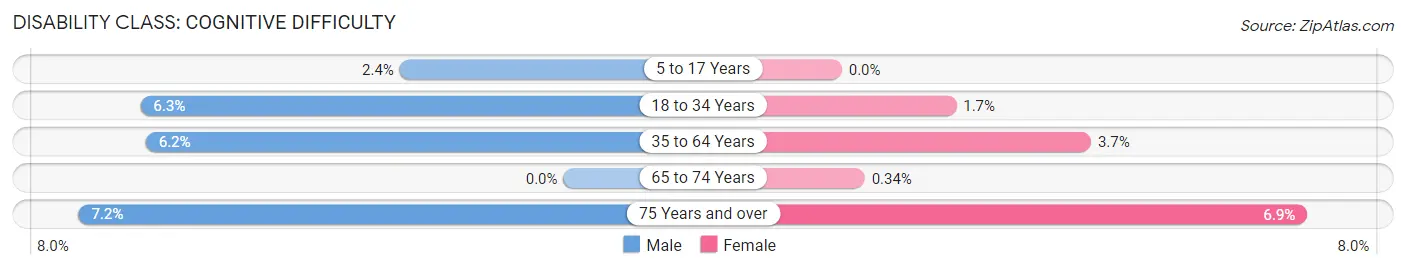
| Age Bracket | Male | Female |
| 5 to 17 Years | 22 (2.4%) | 0 (0.0%) |
| 18 to 34 Years | 49 (6.3%) | 9 (1.7%) |
| 35 to 64 Years | 105 (6.2%) | 76 (3.7%) |
| 65 to 74 Years | 0 (0.0%) | 2 (0.3%) |
| 75 Years and over | 25 (7.2%) | 34 (6.9%) |
Disability Class: Ambulatory Difficulty
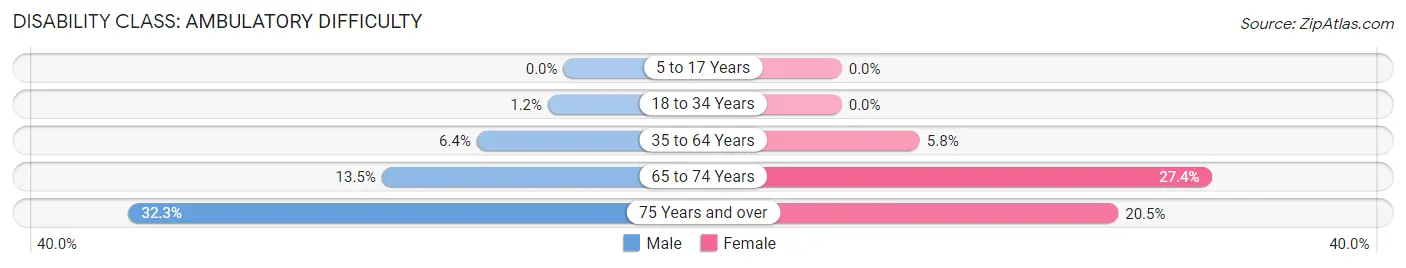
| Age Bracket | Male | Female |
| 5 to 17 Years | 0 (0.0%) | 0 (0.0%) |
| 18 to 34 Years | 9 (1.1%) | 0 (0.0%) |
| 35 to 64 Years | 109 (6.4%) | 119 (5.8%) |
| 65 to 74 Years | 65 (13.5%) | 160 (27.4%) |
| 75 Years and over | 112 (32.3%) | 101 (20.5%) |
Disability Class: Self-Care Difficulty

| Age Bracket | Male | Female |
| 5 to 17 Years | 0 (0.0%) | 0 (0.0%) |
| 18 to 34 Years | 9 (1.1%) | 0 (0.0%) |
| 35 to 64 Years | 18 (1.1%) | 34 (1.7%) |
| 65 to 74 Years | 9 (1.9%) | 0 (0.0%) |
| 75 Years and over | 29 (8.4%) | 79 (16.1%) |
Technology Access in Summit
Computing Device Access in Summit
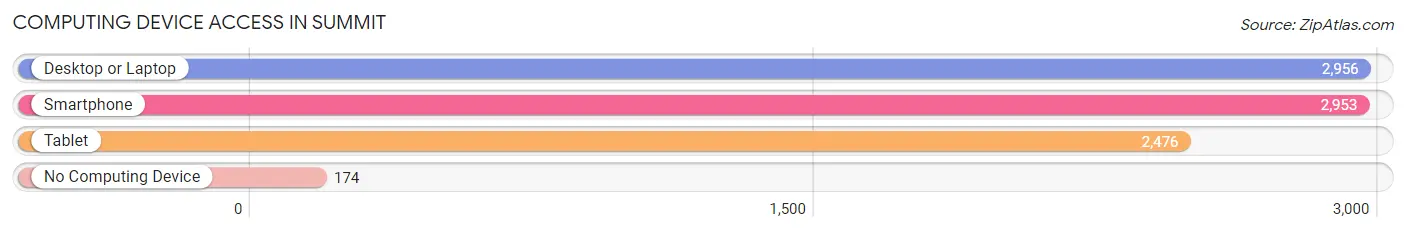
| Device Type | # Households | % Households |
| Desktop or Laptop | 2,956 | 87.9% |
| Smartphone | 2,953 | 87.8% |
| Tablet | 2,476 | 73.7% |
| No Computing Device | 174 | 5.2% |
| Total | 3,362 | 100.0% |
Internet Access in Summit
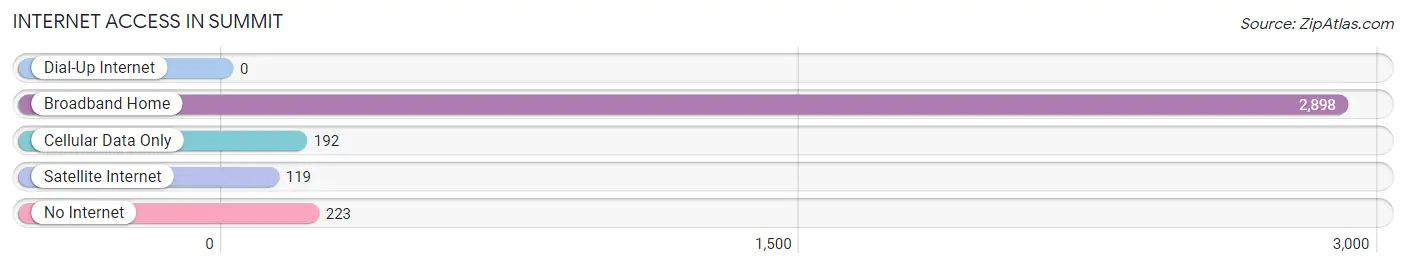
| Internet Type | # Households | % Households |
| Dial-Up Internet | 0 | 0.0% |
| Broadband Home | 2,898 | 86.2% |
| Cellular Data Only | 192 | 5.7% |
| Satellite Internet | 119 | 3.5% |
| No Internet | 223 | 6.6% |
| Total | 3,362 | 100.0% |
Summit Summary
Summit is a small unincorporated community located in King County, Washington, United States. It is situated in the foothills of the Cascade Mountains, approximately 20 miles east of Seattle. The population of Summit was estimated to be 1,845 in 2019.
History
The area now known as Summit was first settled in the late 1800s by homesteaders. The first post office was established in 1891 and the community was named Summit due to its location at the highest point of the road between Seattle and Snoqualmie Pass.
In the early 1900s, the area was primarily used for logging and farming. The logging industry was particularly important to the local economy, and the area was home to several sawmills. In the 1920s, the area began to transition to a more residential community, and the first school was built in 1925.
Geography
Summit is located in the foothills of the Cascade Mountains, approximately 20 miles east of Seattle. The area is characterized by rolling hills and dense forests. The nearby Snoqualmie River is a popular destination for fishing and rafting.
The climate in Summit is mild and temperate, with warm summers and cool winters. The average annual temperature is around 50°F (10°C). The average annual precipitation is around 40 inches (101 cm).
Economy
The economy of Summit is largely based on the service industry. The area is home to several restaurants, retail stores, and other businesses. The nearby Snoqualmie River is a popular destination for fishing and rafting, and the area is also home to several wineries and breweries.
The local government is also a major employer in the area. The city of Snoqualmie is located nearby and provides employment opportunities for many Summit residents.
Demographics
As of 2019, the population of Summit was estimated to be 1,845. The racial makeup of the community is predominantly white (90.2%), followed by Asian (3.2%), Hispanic (2.2%), and African American (1.2%).
The median household income in Summit is $90,845, which is significantly higher than the national average of $61,937. The median age of residents is 44.7 years, which is slightly higher than the national average of 38.7 years.
Conclusion
Summit is a small unincorporated community located in King County, Washington, United States. It is situated in the foothills of the Cascade Mountains, approximately 20 miles east of Seattle. The population of Summit was estimated to be 1,845 in 2019. The economy of Summit is largely based on the service industry, and the local government is also a major employer in the area. The racial makeup of the community is predominantly white, followed by Asian, Hispanic, and African American. The median household income in Summit is significantly higher than the national average.
Common Questions
What is Per Capita Income in Summit?
Per Capita income in Summit is $45,082.
What is the Median Family Income in Summit?
Median Family Income in Summit is $132,750.
What is the Median Household income in Summit?
Median Household Income in Summit is $101,157.
What is Income or Wage Gap in Summit?
Income or Wage Gap in Summit is 33.4%.
Women in Summit earn 66.6 cents for every dollar earned by a man.
What is Inequality or Gini Index in Summit?
Inequality or Gini Index in Summit is 0.38.
What is the Total Population of Summit?
Total Population of Summit is 8,819.
What is the Total Male Population of Summit?
Total Male Population of Summit is 4,458.
What is the Total Female Population of Summit?
Total Female Population of Summit is 4,361.
What is the Ratio of Males per 100 Females in Summit?
There are 102.22 Males per 100 Females in Summit.
What is the Ratio of Females per 100 Males in Summit?
There are 97.82 Females per 100 Males in Summit.
What is the Median Population Age in Summit?
Median Population Age in Summit is 44.5 Years.
What is the Average Family Size in Summit
Average Family Size in Summit is 3.0 People.
What is the Average Household Size in Summit
Average Household Size in Summit is 2.6 People.
How Large is the Labor Force in Summit?
There are 4,489 People in the Labor Forcein in Summit.
What is the Percentage of People in the Labor Force in Summit?
60.1% of People are in the Labor Force in Summit.
What is the Unemployment Rate in Summit?
Unemployment Rate in Summit is 6.6%.