Sudden Valley, WA Map & Demographics
Sudden Valley Map
Sudden Valley Overview
$44,861
PER CAPITA INCOME
$113,302
AVG FAMILY INCOME
$96,102
AVG HOUSEHOLD INCOME
24.9%
WAGE / INCOME GAP [ % ]
75.1¢/ $1
WAGE / INCOME GAP [ $ ]
0.31
INEQUALITY / GINI INDEX
7,103
TOTAL POPULATION
3,401
MALE POPULATION
3,702
FEMALE POPULATION
91.87
MALES / 100 FEMALES
108.85
FEMALES / 100 MALES
44.0
MEDIAN AGE
2.7
AVG FAMILY SIZE
2.4
AVG HOUSEHOLD SIZE
3,381
LABOR FORCE [ PEOPLE ]
58.8%
PERCENT IN LABOR FORCE
3.6%
UNEMPLOYMENT RATE
Income in Sudden Valley
Income Overview in Sudden Valley
Per Capita Income in Sudden Valley is $44,861, while median incomes of families and households are $113,302 and $96,102 respectively.
| Characteristic | Number | Measure |
| Per Capita Income | 7,103 | $44,861 |
| Median Family Income | 2,148 | $113,302 |
| Mean Family Income | 2,148 | $120,411 |
| Median Household Income | 2,914 | $96,102 |
| Mean Household Income | 2,914 | $110,227 |
| Income Deficit | 2,148 | $0 |
| Wage / Income Gap (%) | 7,103 | 24.91% |
| Wage / Income Gap ($) | 7,103 | 75.09¢ per $1 |
| Gini / Inequality Index | 7,103 | 0.31 |
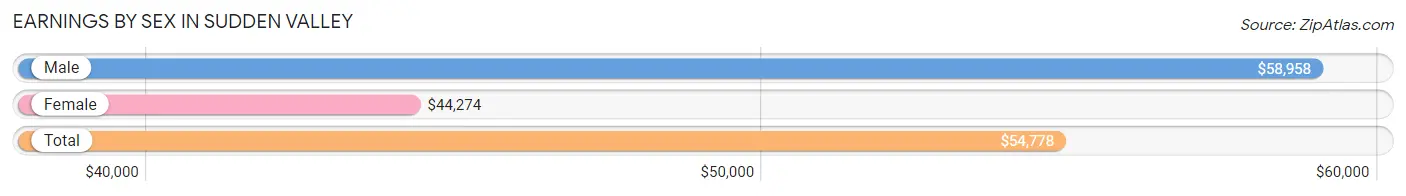
Earnings by Sex in Sudden Valley
Average Earnings in Sudden Valley are $54,778, $58,958 for men and $44,274 for women, a difference of 24.9%.
| Sex | Number | Average Earnings |
| Male | 2,083 (55.0%) | $58,958 |
| Female | 1,701 (45.0%) | $44,274 |
| Total | 3,784 (100.0%) | $54,778 |
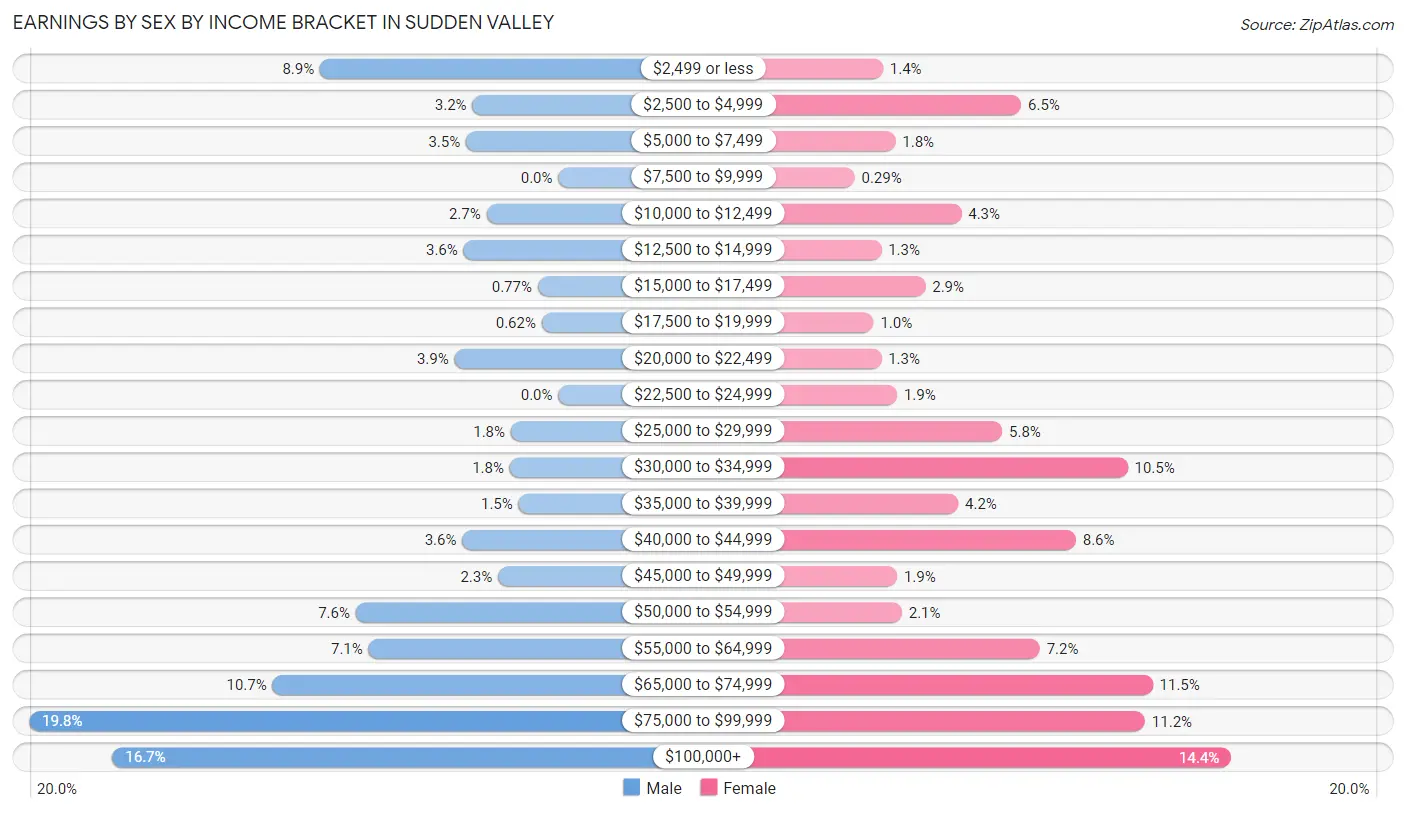
Earnings by Sex by Income Bracket in Sudden Valley
The most common earnings brackets in Sudden Valley are $75,000 to $99,999 for men (413 | 19.8%) and $100,000+ for women (245 | 14.4%).
| Income | Male | Female |
| $2,499 or less | 186 (8.9%) | 23 (1.3%) |
| $2,500 to $4,999 | 67 (3.2%) | 111 (6.5%) |
| $5,000 to $7,499 | 72 (3.5%) | 31 (1.8%) |
| $7,500 to $9,999 | 0 (0.0%) | 5 (0.3%) |
| $10,000 to $12,499 | 56 (2.7%) | 73 (4.3%) |
| $12,500 to $14,999 | 74 (3.5%) | 22 (1.3%) |
| $15,000 to $17,499 | 16 (0.8%) | 50 (2.9%) |
| $17,500 to $19,999 | 13 (0.6%) | 17 (1.0%) |
| $20,000 to $22,499 | 81 (3.9%) | 22 (1.3%) |
| $22,500 to $24,999 | 0 (0.0%) | 32 (1.9%) |
| $25,000 to $29,999 | 37 (1.8%) | 99 (5.8%) |
| $30,000 to $34,999 | 38 (1.8%) | 179 (10.5%) |
| $35,000 to $39,999 | 31 (1.5%) | 71 (4.2%) |
| $40,000 to $44,999 | 75 (3.6%) | 146 (8.6%) |
| $45,000 to $49,999 | 47 (2.3%) | 32 (1.9%) |
| $50,000 to $54,999 | 158 (7.6%) | 35 (2.1%) |
| $55,000 to $64,999 | 148 (7.1%) | 123 (7.2%) |
| $65,000 to $74,999 | 223 (10.7%) | 195 (11.5%) |
| $75,000 to $99,999 | 413 (19.8%) | 190 (11.2%) |
| $100,000+ | 348 (16.7%) | 245 (14.4%) |
| Total | 2,083 (100.0%) | 1,701 (100.0%) |
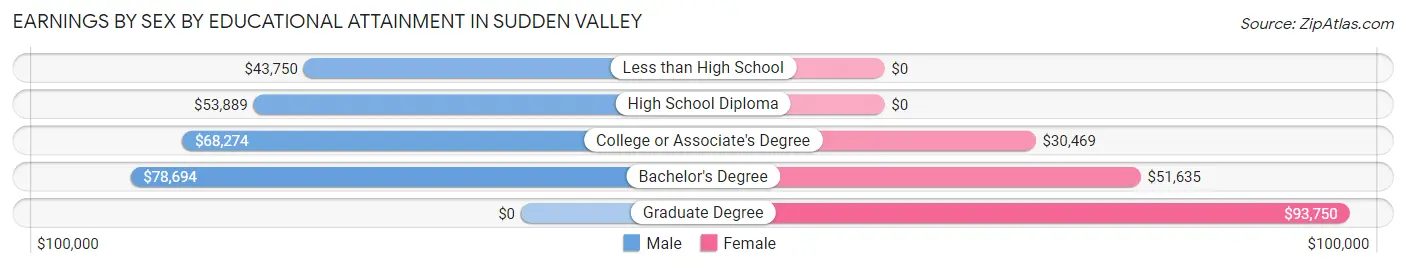
Earnings by Sex by Educational Attainment in Sudden Valley
Average earnings in Sudden Valley are $62,708 for men and $44,881 for women, a difference of 28.4%. Men with an educational attainment of bachelor's degree enjoy the highest average annual earnings of $78,694, while those with less than high school education earn the least with $43,750. Women with an educational attainment of graduate degree earn the most with the average annual earnings of $93,750, while those with college or associate's degree education have the smallest earnings of $30,469.
| Educational Attainment | Male Income | Female Income |
| Less than High School | $43,750 | $0 |
| High School Diploma | $53,889 | $0 |
| College or Associate's Degree | $68,274 | $30,469 |
| Bachelor's Degree | $78,694 | $51,635 |
| Graduate Degree | - | - |
| Total | $62,708 | $44,881 |
Family Income in Sudden Valley
Family Income Brackets in Sudden Valley
According to the Sudden Valley family income data, there are 808 families falling into the $100,000 to $149,999 income range, which is the most common income bracket and makes up 37.6% of all families.
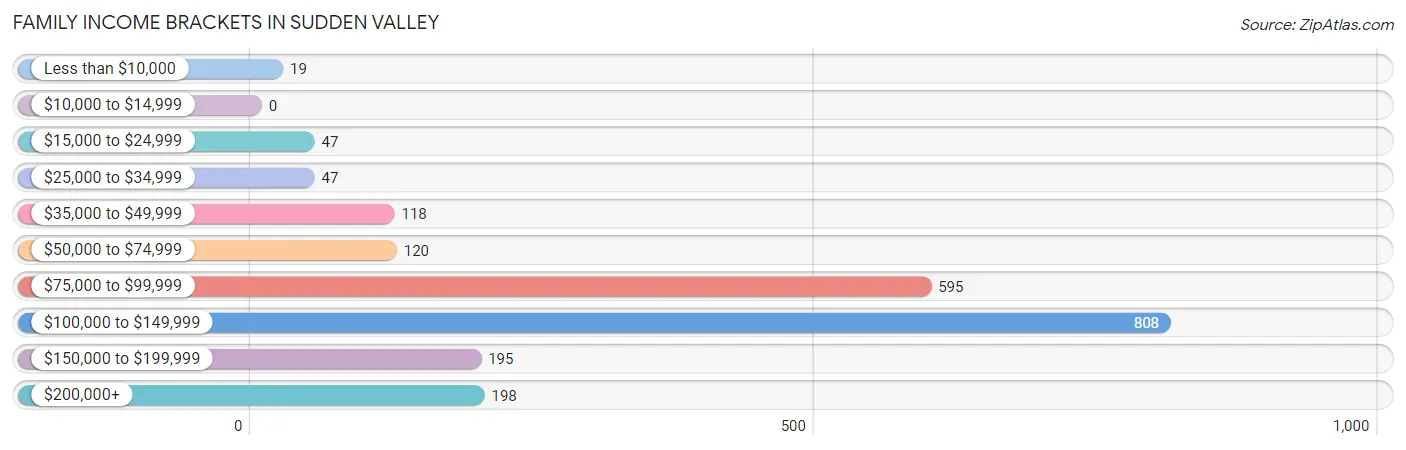
| Income Bracket | # Families | % Families |
| Less than $10,000 | 19 | 0.9% |
| $10,000 to $14,999 | 0 | 0.0% |
| $15,000 to $24,999 | 47 | 2.2% |
| $25,000 to $34,999 | 47 | 2.2% |
| $35,000 to $49,999 | 118 | 5.5% |
| $50,000 to $74,999 | 120 | 5.6% |
| $75,000 to $99,999 | 595 | 27.7% |
| $100,000 to $149,999 | 808 | 37.6% |
| $150,000 to $199,999 | 195 | 9.1% |
| $200,000+ | 198 | 9.2% |
Family Income by Famaliy Size in Sudden Valley
3-person families (553 | 25.7%) account for the highest median family income in Sudden Valley with $117,904 per family, while 2-person families (1,190 | 55.4%) have the highest median income of $52,822 per family member.
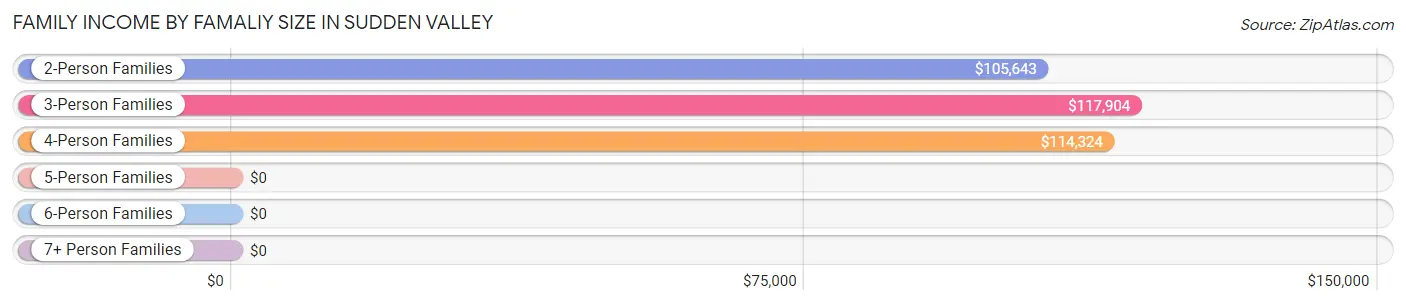
| Income Bracket | # Families | Median Income |
| 2-Person Families | 1,190 (55.4%) | $105,643 |
| 3-Person Families | 553 (25.7%) | $117,904 |
| 4-Person Families | 274 (12.8%) | $114,324 |
| 5-Person Families | 58 (2.7%) | $0 |
| 6-Person Families | 49 (2.3%) | $0 |
| 7+ Person Families | 24 (1.1%) | $0 |
| Total | 2,148 (100.0%) | $113,302 |
Family Income by Number of Earners in Sudden Valley
The median family income in Sudden Valley is $113,302, with families comprising 3+ earners (109) having the highest median family income of $172,852, while families with no earners (375) have the lowest median family income of $80,809, accounting for 5.1% and 17.5% of families, respectively.
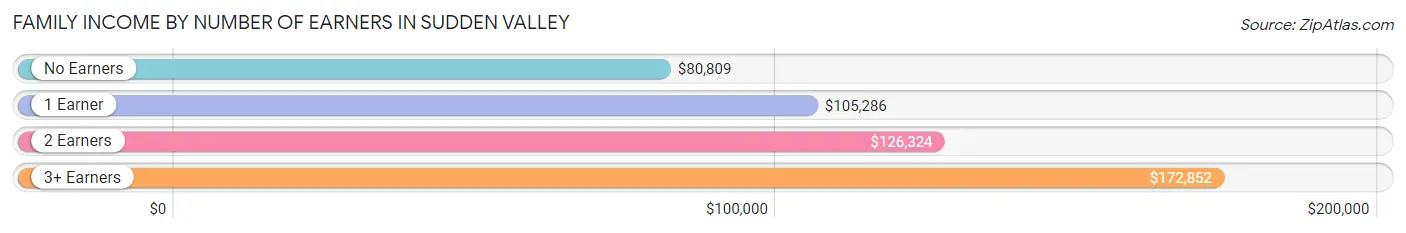
| Number of Earners | # Families | Median Income |
| No Earners | 375 (17.5%) | $80,809 |
| 1 Earner | 678 (31.6%) | $105,286 |
| 2 Earners | 986 (45.9%) | $126,324 |
| 3+ Earners | 109 (5.1%) | $172,852 |
| Total | 2,148 (100.0%) | $113,302 |
Household Income in Sudden Valley
Household Income Brackets in Sudden Valley
With 865 households falling in the category, the $100,000 to $149,999 income range is the most frequent in Sudden Valley, accounting for 29.7% of all households. In contrast, only 20 households (0.7%) fall into the $10,000 to $14,999 income bracket, making it the least populous group.
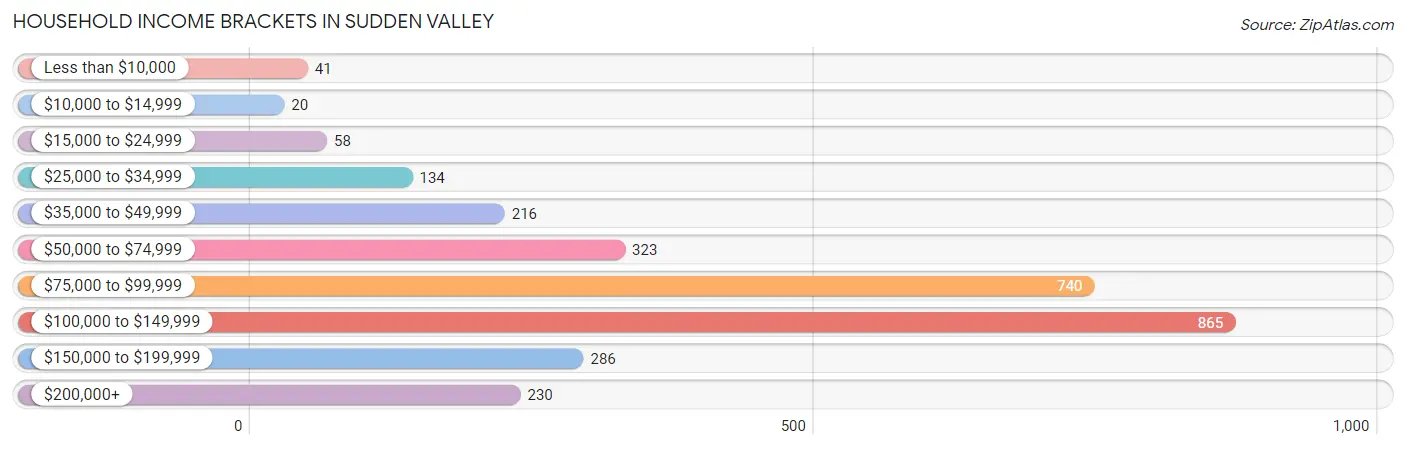
| Income Bracket | # Households | % Households |
| Less than $10,000 | 41 | 1.4% |
| $10,000 to $14,999 | 20 | 0.7% |
| $15,000 to $24,999 | 58 | 2.0% |
| $25,000 to $34,999 | 134 | 4.6% |
| $35,000 to $49,999 | 216 | 7.4% |
| $50,000 to $74,999 | 323 | 11.1% |
| $75,000 to $99,999 | 740 | 25.4% |
| $100,000 to $149,999 | 865 | 29.7% |
| $150,000 to $199,999 | 286 | 9.8% |
| $200,000+ | 230 | 7.9% |
Household Income by Householder Age in Sudden Valley
The median household income in Sudden Valley is $96,102, with the highest median household income of $118,659 found in the 45 to 64 years age bracket for the primary householder. A total of 911 households (31.3%) fall into this category. Meanwhile, the 15 to 24 years age bracket for the primary householder has the lowest median household income of $0, with 5 households (0.2%) in this group.
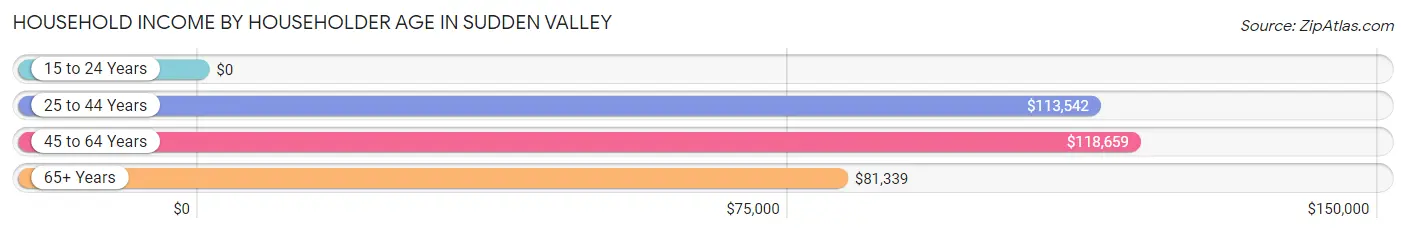
| Income Bracket | # Households | Median Income |
| 15 to 24 Years | 5 (0.2%) | $0 |
| 25 to 44 Years | 977 (33.5%) | $113,542 |
| 45 to 64 Years | 911 (31.3%) | $118,659 |
| 65+ Years | 1,021 (35.0%) | $81,339 |
| Total | 2,914 (100.0%) | $96,102 |
Poverty in Sudden Valley
Income Below Poverty by Sex and Age in Sudden Valley
With 4.7% poverty level for males and 3.7% for females among the residents of Sudden Valley, 12 to 14 year old males and 12 to 14 year old females are the most vulnerable to poverty, with 23 males (16.7%) and 21 females (12.1%) in their respective age groups living below the poverty level.
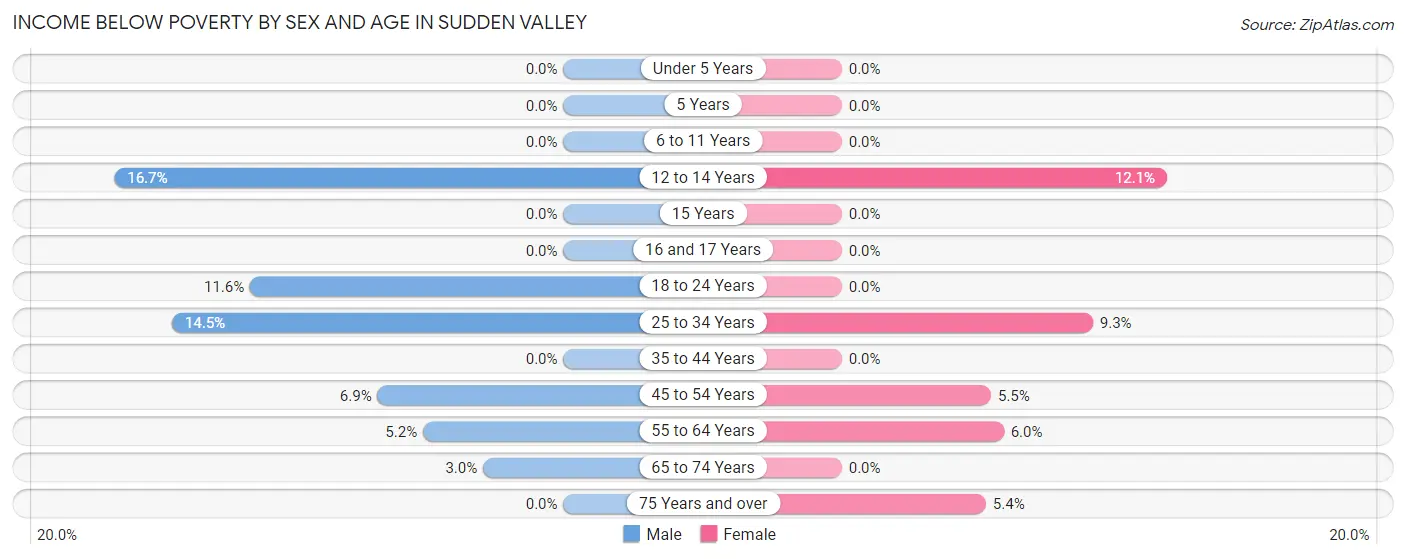
| Age Bracket | Male | Female |
| Under 5 Years | 0 (0.0%) | 0 (0.0%) |
| 5 Years | 0 (0.0%) | 0 (0.0%) |
| 6 to 11 Years | 0 (0.0%) | 0 (0.0%) |
| 12 to 14 Years | 23 (16.7%) | 21 (12.1%) |
| 15 Years | 0 (0.0%) | 0 (0.0%) |
| 16 and 17 Years | 0 (0.0%) | 0 (0.0%) |
| 18 to 24 Years | 5 (11.6%) | 0 (0.0%) |
| 25 to 34 Years | 60 (14.5%) | 45 (9.3%) |
| 35 to 44 Years | 0 (0.0%) | 0 (0.0%) |
| 45 to 54 Years | 34 (6.9%) | 19 (5.5%) |
| 55 to 64 Years | 19 (5.2%) | 33 (6.0%) |
| 65 to 74 Years | 18 (3.0%) | 0 (0.0%) |
| 75 Years and over | 0 (0.0%) | 20 (5.3%) |
| Total | 159 (4.7%) | 138 (3.7%) |
Income Above Poverty by Sex and Age in Sudden Valley
According to the poverty statistics in Sudden Valley, males aged under 5 years and females aged under 5 years are the age groups that are most secure financially, with 100.0% of males and 100.0% of females in these age groups living above the poverty line.
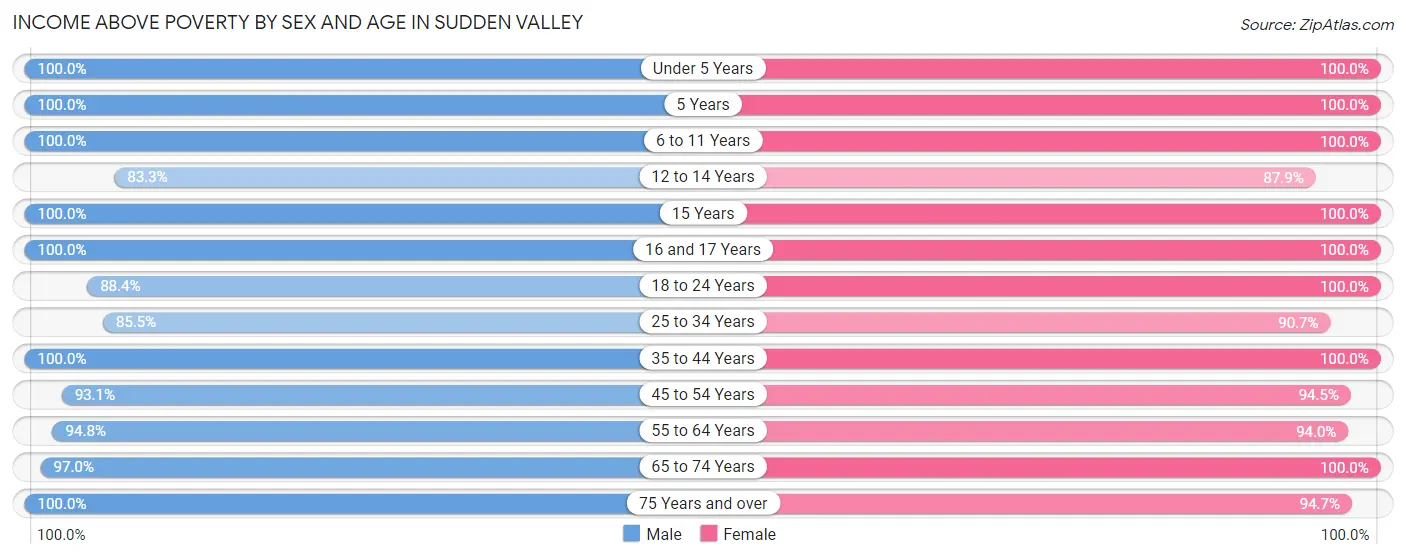
| Age Bracket | Male | Female |
| Under 5 Years | 67 (100.0%) | 155 (100.0%) |
| 5 Years | 22 (100.0%) | 42 (100.0%) |
| 6 to 11 Years | 340 (100.0%) | 286 (100.0%) |
| 12 to 14 Years | 115 (83.3%) | 153 (87.9%) |
| 15 Years | 23 (100.0%) | 82 (100.0%) |
| 16 and 17 Years | 53 (100.0%) | 41 (100.0%) |
| 18 to 24 Years | 38 (88.4%) | 114 (100.0%) |
| 25 to 34 Years | 353 (85.5%) | 438 (90.7%) |
| 35 to 44 Years | 570 (100.0%) | 591 (100.0%) |
| 45 to 54 Years | 459 (93.1%) | 324 (94.5%) |
| 55 to 64 Years | 346 (94.8%) | 516 (94.0%) |
| 65 to 74 Years | 587 (97.0%) | 468 (100.0%) |
| 75 Years and over | 245 (100.0%) | 354 (94.7%) |
| Total | 3,218 (95.3%) | 3,564 (96.3%) |
Income Below Poverty Among Married-Couple Families in Sudden Valley
The poverty statistics for married-couple families in Sudden Valley show that 1.0% or 19 of the total 1,899 families live below the poverty line. Families with no children have the highest poverty rate of 1.5%, comprising of 19 families. On the other hand, families with 1 or 2 children have the lowest poverty rate of 0.0%, which includes 0 families.
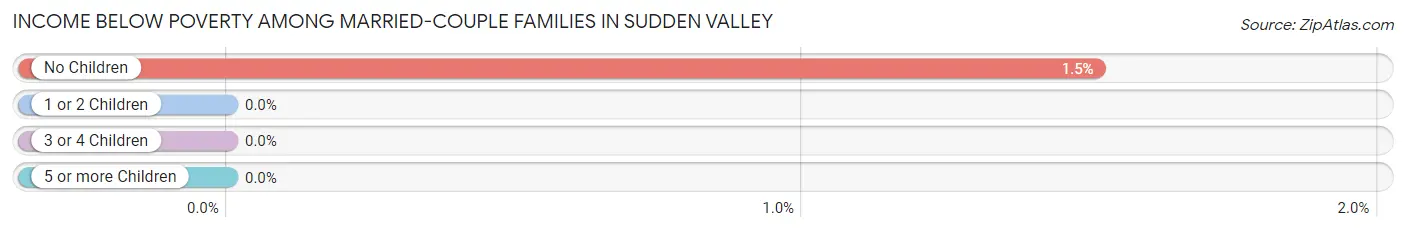
| Children | Above Poverty | Below Poverty |
| No Children | 1,243 (98.5%) | 19 (1.5%) |
| 1 or 2 Children | 530 (100.0%) | 0 (0.0%) |
| 3 or 4 Children | 107 (100.0%) | 0 (0.0%) |
| 5 or more Children | 0 (0.0%) | 0 (0.0%) |
| Total | 1,880 (99.0%) | 19 (1.0%) |
Income Below Poverty Among Single-Parent Households in Sudden Valley
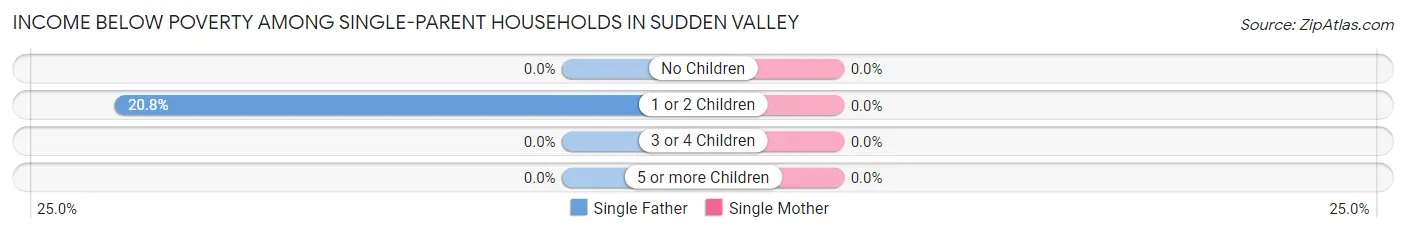
| Children | Single Father | Single Mother |
| No Children | 0 (0.0%) | 0 (0.0%) |
| 1 or 2 Children | 21 (20.8%) | 0 (0.0%) |
| 3 or 4 Children | 0 (0.0%) | 0 (0.0%) |
| 5 or more Children | 0 (0.0%) | 0 (0.0%) |
| Total | 21 (17.2%) | 0 (0.0%) |
Income Below Poverty Among Married-Couple vs Single-Parent Households in Sudden Valley
The poverty data for Sudden Valley shows that 19 of the married-couple family households (1.0%) and 21 of the single-parent households (8.4%) are living below the poverty level. Within the married-couple family households, those with no children have the highest poverty rate, with 19 households (1.5%) falling below the poverty line. Among the single-parent households, those with 1 or 2 children have the highest poverty rate, with 21 household (14.9%) living below poverty.
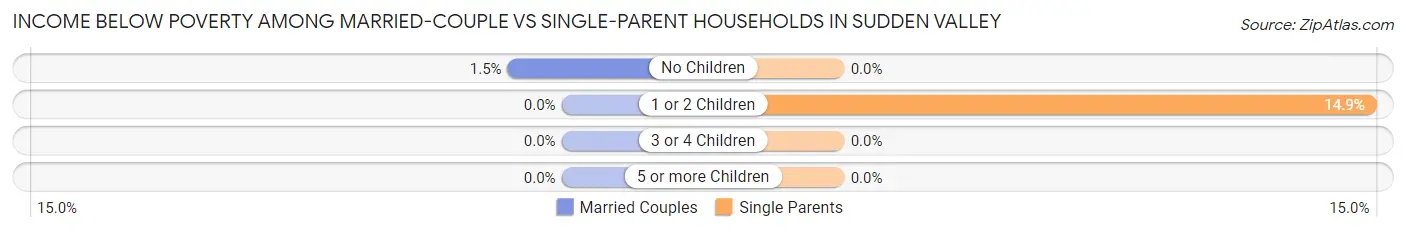
| Children | Married-Couple Families | Single-Parent Households |
| No Children | 19 (1.5%) | 0 (0.0%) |
| 1 or 2 Children | 0 (0.0%) | 21 (14.9%) |
| 3 or 4 Children | 0 (0.0%) | 0 (0.0%) |
| 5 or more Children | 0 (0.0%) | 0 (0.0%) |
| Total | 19 (1.0%) | 21 (8.4%) |
Race in Sudden Valley
The most populous races in Sudden Valley are White / Caucasian (5,929 | 83.5%), Two or more Races (951 | 13.4%), and Hispanic or Latino (572 | 8.1%).
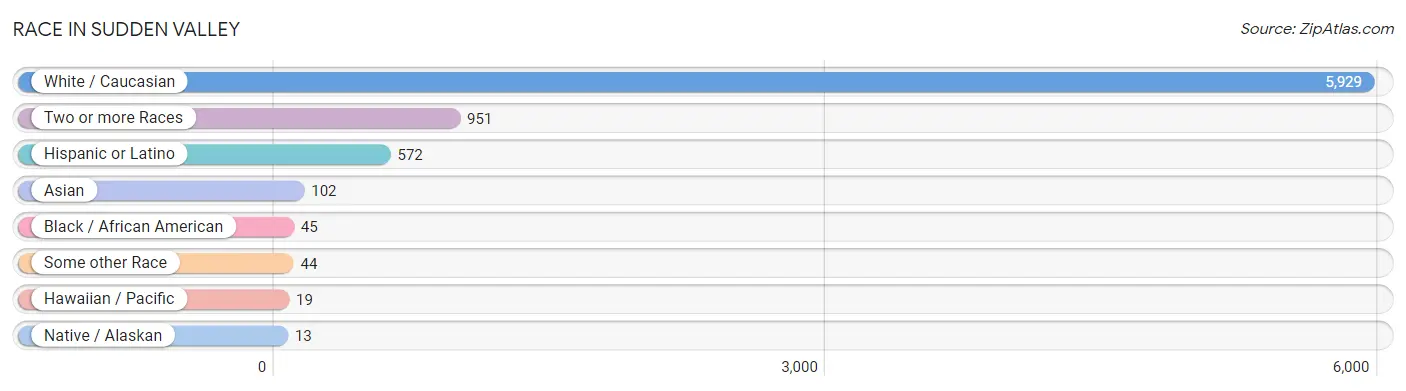
| Race | # Population | % Population |
| Asian | 102 | 1.4% |
| Black / African American | 45 | 0.6% |
| Hawaiian / Pacific | 19 | 0.3% |
| Hispanic or Latino | 572 | 8.1% |
| Native / Alaskan | 13 | 0.2% |
| White / Caucasian | 5,929 | 83.5% |
| Two or more Races | 951 | 13.4% |
| Some other Race | 44 | 0.6% |
| Total | 7,103 | 100.0% |
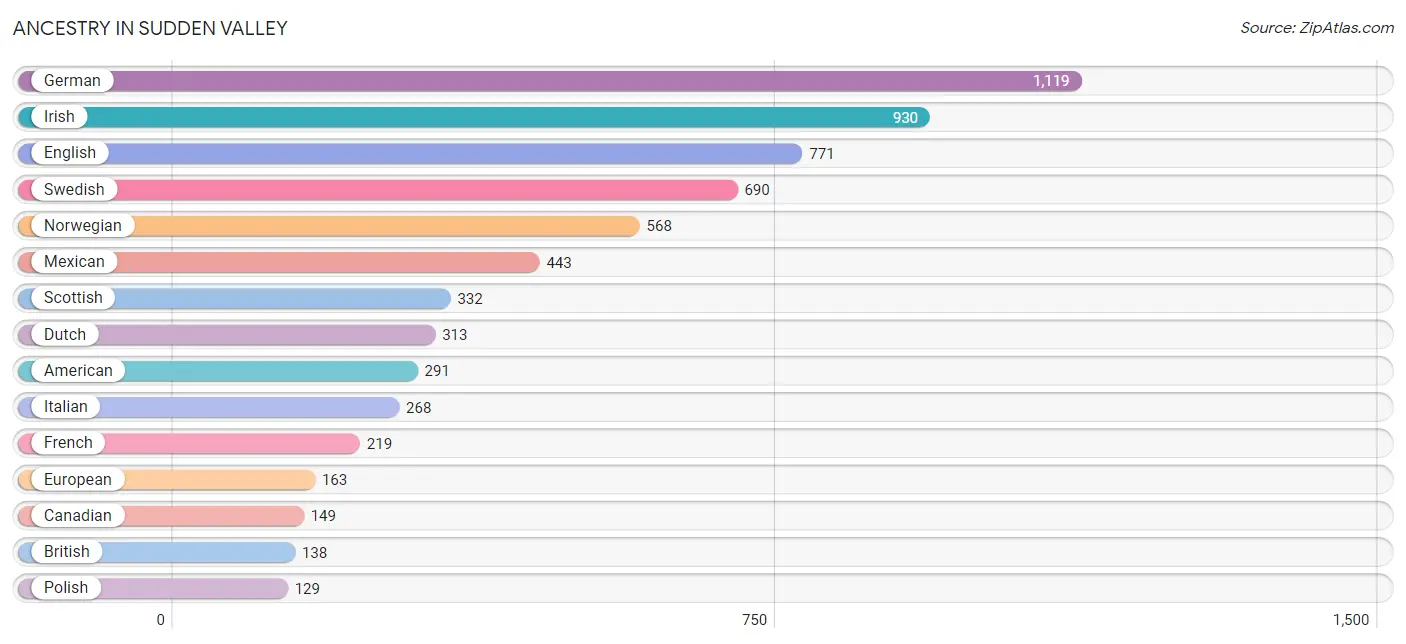
Ancestry in Sudden Valley
The most populous ancestries reported in Sudden Valley are German (1,119 | 15.8%), Irish (930 | 13.1%), English (771 | 10.8%), Swedish (690 | 9.7%), and Norwegian (568 | 8.0%), together accounting for 57.4% of all Sudden Valley residents.
| Ancestry | # Population | % Population |
| African | 9 | 0.1% |
| Albanian | 17 | 0.2% |
| American | 291 | 4.1% |
| Arab | 42 | 0.6% |
| Austrian | 45 | 0.6% |
| Belgian | 11 | 0.2% |
| Bhutanese | 13 | 0.2% |
| British | 138 | 1.9% |
| Burmese | 24 | 0.3% |
| Cambodian | 39 | 0.5% |
| Canadian | 149 | 2.1% |
| Chippewa | 32 | 0.4% |
| Comanche | 45 | 0.6% |
| Cuban | 17 | 0.2% |
| Czech | 21 | 0.3% |
| Danish | 24 | 0.3% |
| Dutch | 313 | 4.4% |
| Eastern European | 8 | 0.1% |
| English | 771 | 10.8% |
| European | 163 | 2.3% |
| Finnish | 29 | 0.4% |
| French | 219 | 3.1% |
| French American Indian | 15 | 0.2% |
| French Canadian | 52 | 0.7% |
| German | 1,119 | 15.8% |
| Greek | 18 | 0.3% |
| Hungarian | 47 | 0.7% |
| Indian (Asian) | 128 | 1.8% |
| Irish | 930 | 13.1% |
| Italian | 268 | 3.8% |
| Korean | 29 | 0.4% |
| Latvian | 31 | 0.4% |
| Lebanese | 28 | 0.4% |
| Lithuanian | 8 | 0.1% |
| Mexican | 443 | 6.2% |
| Native Hawaiian | 85 | 1.2% |
| Northern European | 11 | 0.2% |
| Norwegian | 568 | 8.0% |
| Pennsylvania German | 41 | 0.6% |
| Peruvian | 5 | 0.1% |
| Polish | 129 | 1.8% |
| Portuguese | 57 | 0.8% |
| Puerto Rican | 41 | 0.6% |
| Russian | 54 | 0.8% |
| Scandinavian | 64 | 0.9% |
| Scotch-Irish | 32 | 0.4% |
| Scottish | 332 | 4.7% |
| Serbian | 17 | 0.2% |
| Slavic | 43 | 0.6% |
| Slovak | 31 | 0.4% |
| South American | 5 | 0.1% |
| Spaniard | 14 | 0.2% |
| Spanish | 52 | 0.7% |
| Sri Lankan | 41 | 0.6% |
| Subsaharan African | 9 | 0.1% |
| Swedish | 690 | 9.7% |
| Swiss | 31 | 0.4% |
| Tlingit-Haida | 39 | 0.5% |
| Welsh | 9 | 0.1% |
| West Indian | 8 | 0.1% |
| Yugoslavian | 15 | 0.2% | View All 61 Rows |
Immigrants in Sudden Valley
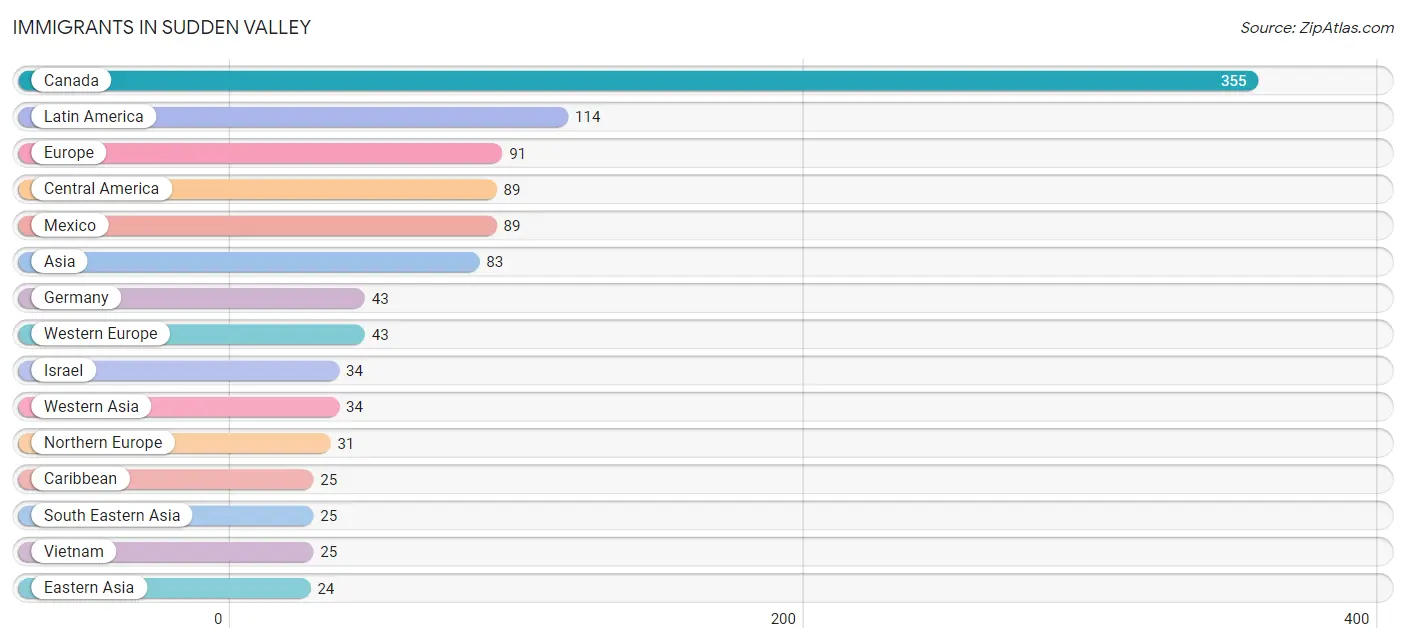
The most numerous immigrant groups reported in Sudden Valley came from Canada (355 | 5.0%), Latin America (114 | 1.6%), Europe (91 | 1.3%), Central America (89 | 1.3%), and Mexico (89 | 1.3%), together accounting for 10.4% of all Sudden Valley residents.
| Immigration Origin | # Population | % Population |
| Asia | 83 | 1.2% |
| Canada | 355 | 5.0% |
| Caribbean | 25 | 0.4% |
| Central America | 89 | 1.3% |
| Cuba | 17 | 0.2% |
| Eastern Asia | 24 | 0.3% |
| Eastern Europe | 17 | 0.2% |
| England | 22 | 0.3% |
| Europe | 91 | 1.3% |
| Germany | 43 | 0.6% |
| Ireland | 9 | 0.1% |
| Israel | 34 | 0.5% |
| Korea | 24 | 0.3% |
| Latin America | 114 | 1.6% |
| Mexico | 89 | 1.3% |
| Northern Europe | 31 | 0.4% |
| South Eastern Asia | 25 | 0.4% |
| Trinidad and Tobago | 8 | 0.1% |
| Vietnam | 25 | 0.4% |
| Western Asia | 34 | 0.5% |
| Western Europe | 43 | 0.6% | View All 21 Rows |
Sex and Age in Sudden Valley
Sex and Age in Sudden Valley
The most populous age groups in Sudden Valley are 45 to 49 Years (353 | 10.4%) for men and 60 to 64 Years (342 | 9.2%) for women.
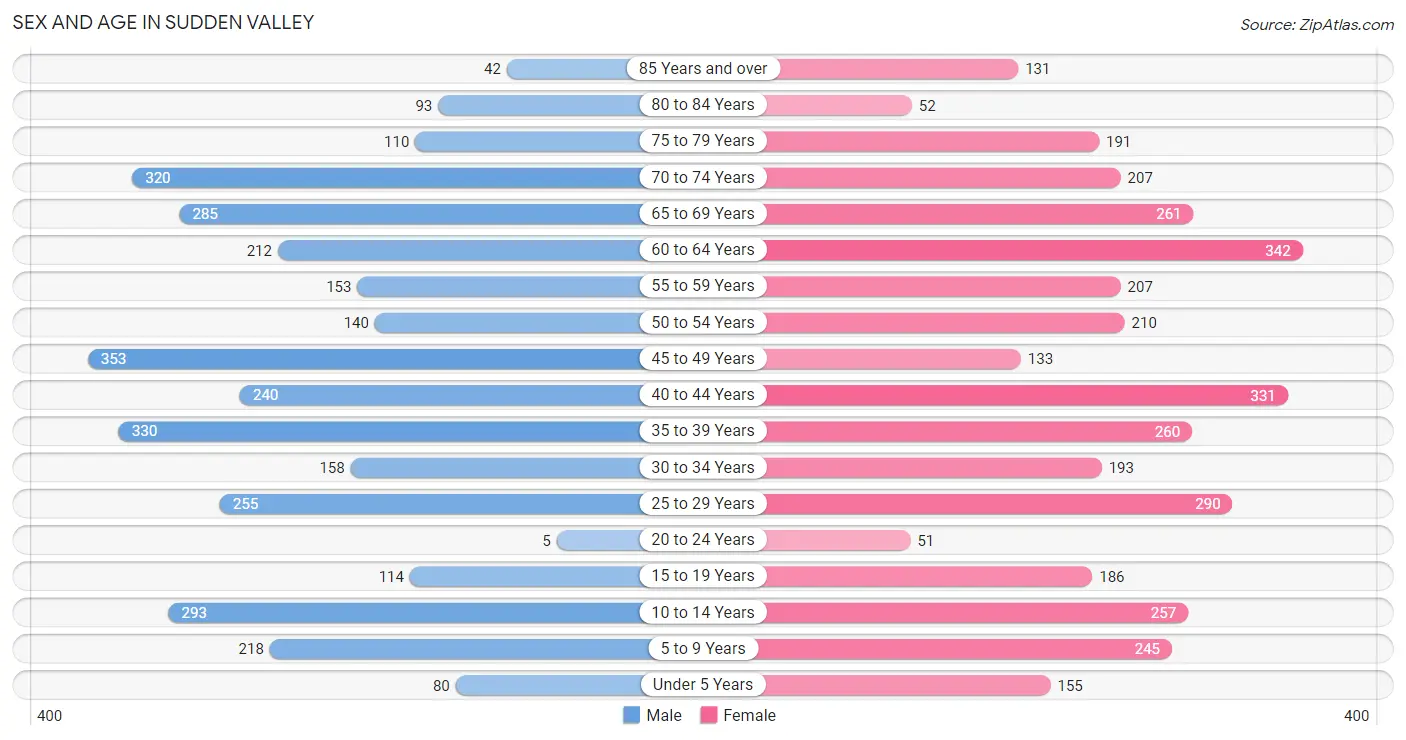
| Age Bracket | Male | Female |
| Under 5 Years | 80 (2.4%) | 155 (4.2%) |
| 5 to 9 Years | 218 (6.4%) | 245 (6.6%) |
| 10 to 14 Years | 293 (8.6%) | 257 (6.9%) |
| 15 to 19 Years | 114 (3.4%) | 186 (5.0%) |
| 20 to 24 Years | 5 (0.2%) | 51 (1.4%) |
| 25 to 29 Years | 255 (7.5%) | 290 (7.8%) |
| 30 to 34 Years | 158 (4.6%) | 193 (5.2%) |
| 35 to 39 Years | 330 (9.7%) | 260 (7.0%) |
| 40 to 44 Years | 240 (7.1%) | 331 (8.9%) |
| 45 to 49 Years | 353 (10.4%) | 133 (3.6%) |
| 50 to 54 Years | 140 (4.1%) | 210 (5.7%) |
| 55 to 59 Years | 153 (4.5%) | 207 (5.6%) |
| 60 to 64 Years | 212 (6.2%) | 342 (9.2%) |
| 65 to 69 Years | 285 (8.4%) | 261 (7.0%) |
| 70 to 74 Years | 320 (9.4%) | 207 (5.6%) |
| 75 to 79 Years | 110 (3.2%) | 191 (5.2%) |
| 80 to 84 Years | 93 (2.7%) | 52 (1.4%) |
| 85 Years and over | 42 (1.2%) | 131 (3.5%) |
| Total | 3,401 (100.0%) | 3,702 (100.0%) |
Families and Households in Sudden Valley
Median Family Size in Sudden Valley
The median family size in Sudden Valley is 2.71 persons per family, with single female/mother families (127 | 5.9%) accounting for the largest median family size of 3.93 persons per family. On the other hand, single male/father families (122 | 5.7%) represent the smallest median family size with 2.37 persons per family.
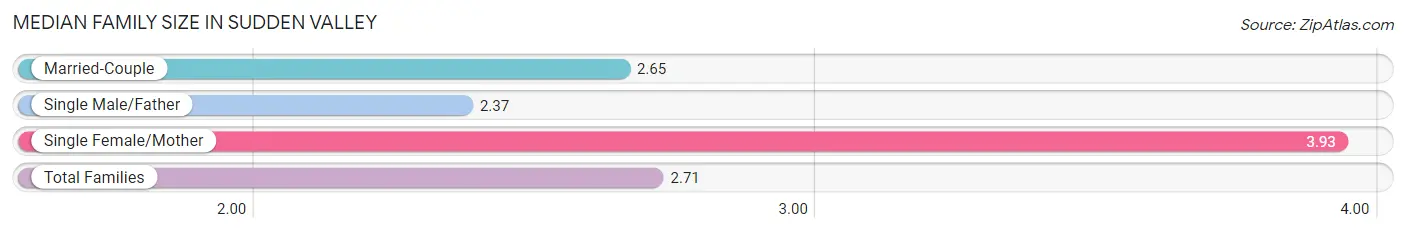
| Family Type | # Families | Family Size |
| Married-Couple | 1,899 (88.4%) | 2.65 |
| Single Male/Father | 122 (5.7%) | 2.37 |
| Single Female/Mother | 127 (5.9%) | 3.93 |
| Total Families | 2,148 (100.0%) | 2.71 |
Median Household Size in Sudden Valley
The median household size in Sudden Valley is 2.44 persons per household, with single female/mother households (127 | 4.4%) accounting for the largest median household size of 4.13 persons per household. non-family households (766 | 26.3%) represent the smallest median household size with 1.53 persons per household.
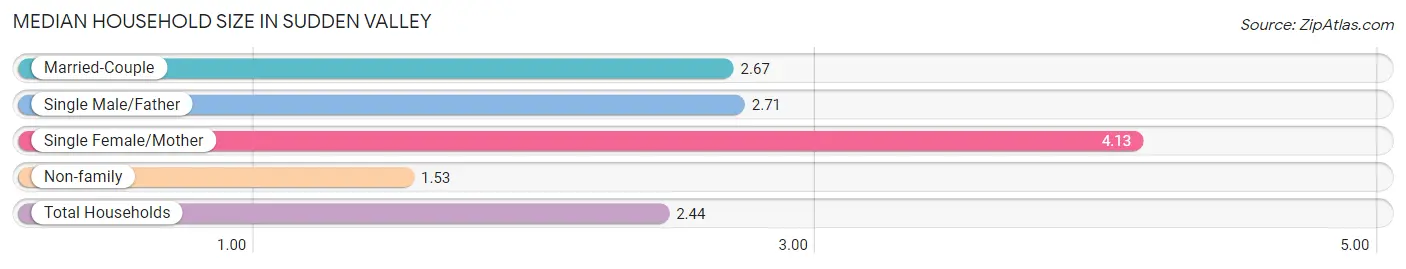
| Household Type | # Households | Household Size |
| Married-Couple | 1,899 (65.2%) | 2.67 |
| Single Male/Father | 122 (4.2%) | 2.71 |
| Single Female/Mother | 127 (4.4%) | 4.13 |
| Non-family | 766 (26.3%) | 1.53 |
| Total Households | 2,914 (100.0%) | 2.44 |
Household Size by Marriage Status in Sudden Valley
Out of a total of 2,914 households in Sudden Valley, 2,148 (73.7%) are family households, while 766 (26.3%) are nonfamily households. The most numerous type of family households are 2-person households, comprising 1,149, and the most common type of nonfamily households are 1-person households, comprising 556.
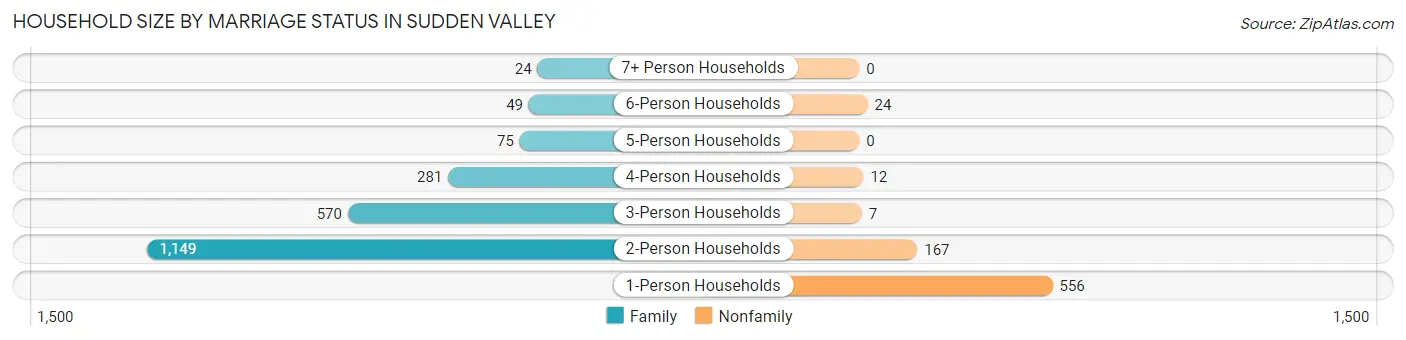
| Household Size | Family Households | Nonfamily Households |
| 1-Person Households | - | 556 (19.1%) |
| 2-Person Households | 1,149 (39.4%) | 167 (5.7%) |
| 3-Person Households | 570 (19.6%) | 7 (0.2%) |
| 4-Person Households | 281 (9.6%) | 12 (0.4%) |
| 5-Person Households | 75 (2.6%) | 0 (0.0%) |
| 6-Person Households | 49 (1.7%) | 24 (0.8%) |
| 7+ Person Households | 24 (0.8%) | 0 (0.0%) |
| Total | 2,148 (73.7%) | 766 (26.3%) |
Female Fertility in Sudden Valley
Fertility by Age in Sudden Valley
Average fertility rate in Sudden Valley is 50.0 births per 1,000 women. Women in the age bracket of 20 to 34 years have the highest fertility rate with 58.0 births per 1,000 women. Women in the age bracket of 35 to 50 years acount for 57.5% of all women with births.
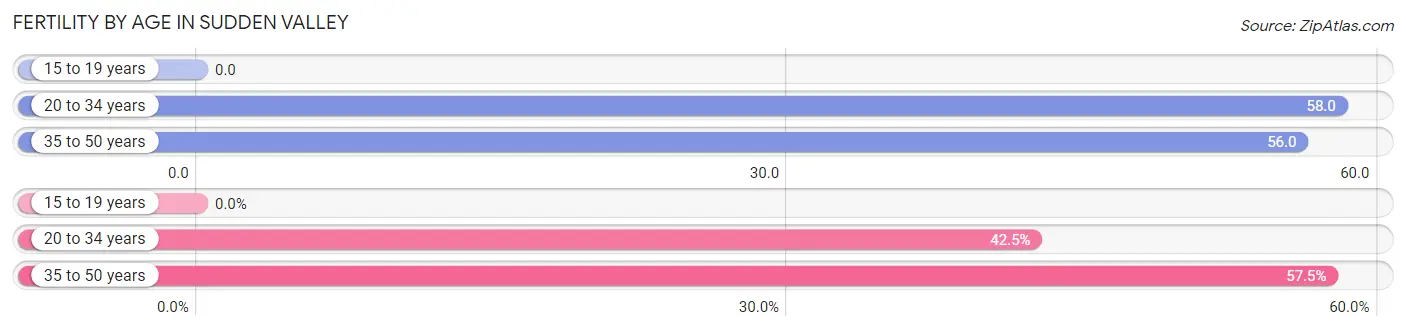
| Age Bracket | Women with Births | Births / 1,000 Women |
| 15 to 19 years | 0 (0.0%) | 0.0 |
| 20 to 34 years | 31 (42.5%) | 58.0 |
| 35 to 50 years | 42 (57.5%) | 56.0 |
| Total | 73 (100.0%) | 50.0 |
Fertility by Age by Marriage Status in Sudden Valley
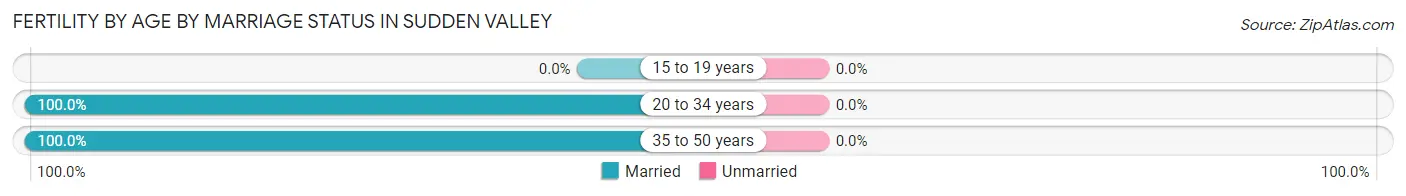
| Age Bracket | Married | Unmarried |
| 15 to 19 years | 0 (0.0%) | 0 (0.0%) |
| 20 to 34 years | 31 (100.0%) | 0 (0.0%) |
| 35 to 50 years | 42 (100.0%) | 0 (0.0%) |
| Total | 73 (100.0%) | 0 (0.0%) |
Fertility by Education in Sudden Valley
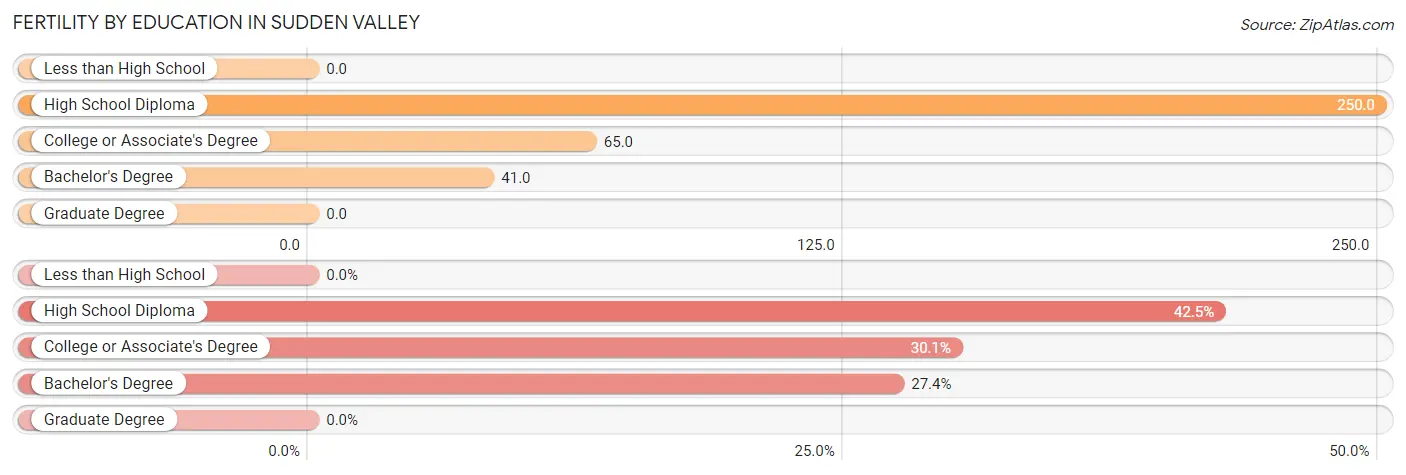
| Educational Attainment | Women with Births | Births / 1,000 Women |
| Less than High School | 0 (0.0%) | 0.0 |
| High School Diploma | 31 (42.5%) | 250.0 |
| College or Associate's Degree | 22 (30.1%) | 65.0 |
| Bachelor's Degree | 20 (27.4%) | 41.0 |
| Graduate Degree | 0 (0.0%) | 0.0 |
| Total | 73 (100.0%) | 50.0 |
Fertility by Education by Marriage Status in Sudden Valley
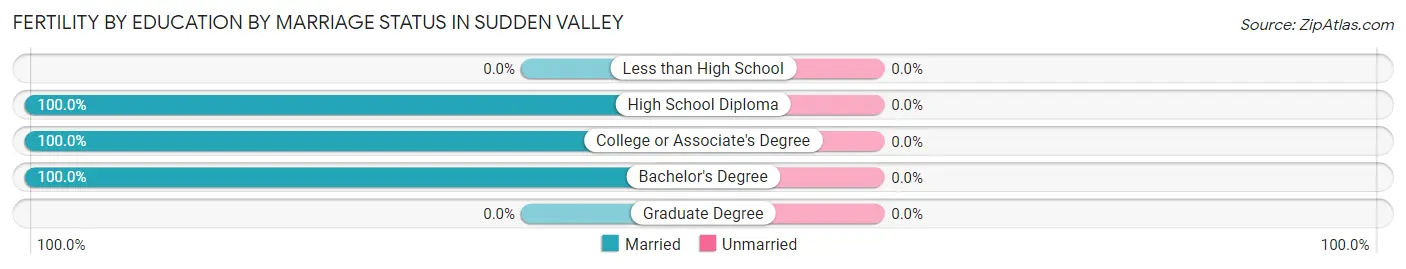
| Educational Attainment | Married | Unmarried |
| Less than High School | 0 (0.0%) | 0 (0.0%) |
| High School Diploma | 31 (100.0%) | 0 (0.0%) |
| College or Associate's Degree | 22 (100.0%) | 0 (0.0%) |
| Bachelor's Degree | 20 (100.0%) | 0 (0.0%) |
| Graduate Degree | 0 (0.0%) | 0 (0.0%) |
| Total | 73 (100.0%) | 0 (0.0%) |
Employment Characteristics in Sudden Valley
Employment by Class of Employer in Sudden Valley
Among the 3,219 employed individuals in Sudden Valley, private company employees (1,730 | 53.7%), not-for-profit organizations (388 | 12.0%), and local government employees (306 | 9.5%) make up the most common classes of employment.
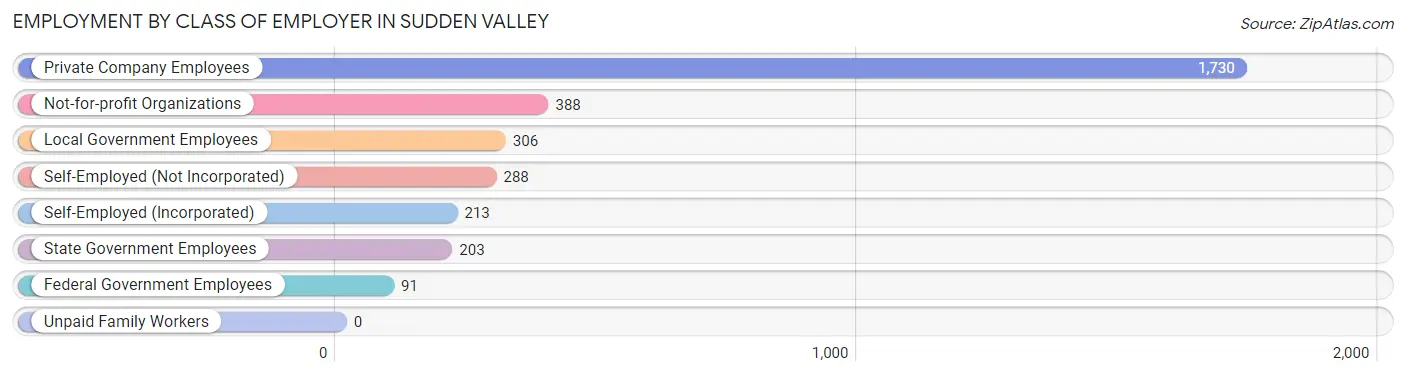
| Employer Class | # Employees | % Employees |
| Private Company Employees | 1,730 | 53.7% |
| Self-Employed (Incorporated) | 213 | 6.6% |
| Self-Employed (Not Incorporated) | 288 | 8.9% |
| Not-for-profit Organizations | 388 | 12.0% |
| Local Government Employees | 306 | 9.5% |
| State Government Employees | 203 | 6.3% |
| Federal Government Employees | 91 | 2.8% |
| Unpaid Family Workers | 0 | 0.0% |
| Total | 3,219 | 100.0% |
Employment Status by Age in Sudden Valley
According to the labor force statistics for Sudden Valley, out of the total population over 16 years of age (5,750), 58.8% or 3,381 individuals are in the labor force, with 3.6% or 122 of them unemployed. The age group with the highest labor force participation rate is 30 to 34 years, with 92.0% or 323 individuals in the labor force. Within the labor force, the 16 to 19 years age range has the highest percentage of unemployed individuals, with 52.5% or 42 of them being unemployed.
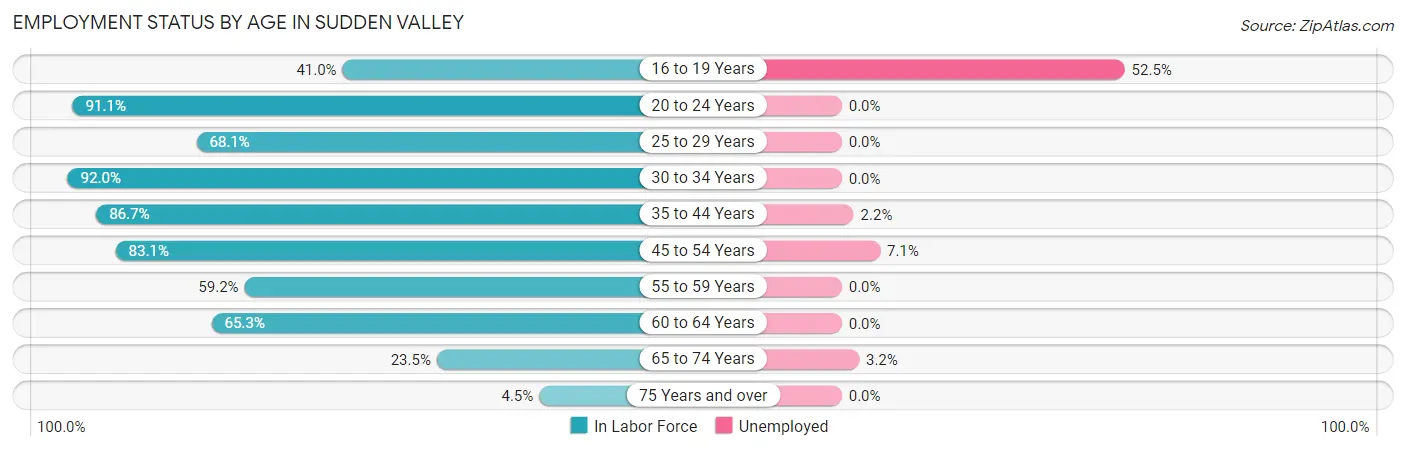
| Age Bracket | In Labor Force | Unemployed |
| 16 to 19 Years | 80 (41.0%) | 42 (52.5%) |
| 20 to 24 Years | 51 (91.1%) | 0 (0.0%) |
| 25 to 29 Years | 371 (68.1%) | 0 (0.0%) |
| 30 to 34 Years | 323 (92.0%) | 0 (0.0%) |
| 35 to 44 Years | 1,007 (86.7%) | 22 (2.2%) |
| 45 to 54 Years | 695 (83.1%) | 49 (7.1%) |
| 55 to 59 Years | 213 (59.2%) | 0 (0.0%) |
| 60 to 64 Years | 362 (65.3%) | 0 (0.0%) |
| 65 to 74 Years | 252 (23.5%) | 8 (3.2%) |
| 75 Years and over | 28 (4.5%) | 0 (0.0%) |
| Total | 3,381 (58.8%) | 122 (3.6%) |
Employment Status by Educational Attainment in Sudden Valley
According to labor force statistics for Sudden Valley, 78.0% of individuals (2,969) out of the total population between 25 and 64 years of age (3,807) are in the labor force, with 2.4% or 71 of them being unemployed. The group with the highest labor force participation rate are those with the educational attainment of high school diploma, with 84.2% or 474 individuals in the labor force. Within the labor force, individuals with college / associate degree education have the highest percentage of unemployment, with 4.5% or 43 of them being unemployed.
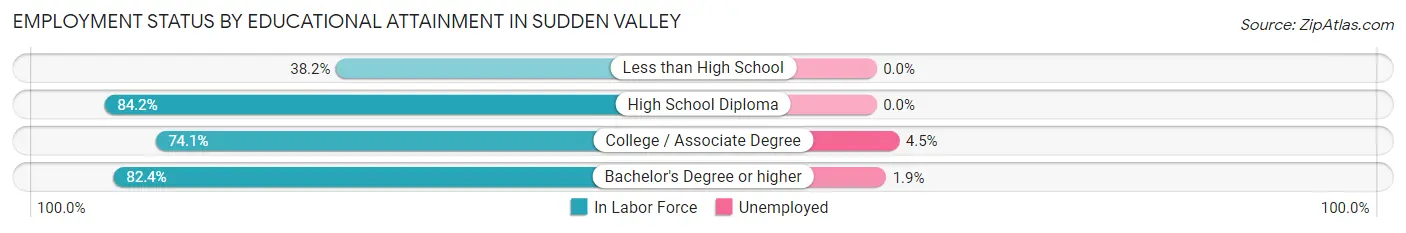
| Educational Attainment | In Labor Force | Unemployed |
| Less than High School | 60 (38.2%) | 0 (0.0%) |
| High School Diploma | 474 (84.2%) | 0 (0.0%) |
| College / Associate Degree | 948 (74.1%) | 58 (4.5%) |
| Bachelor's Degree or higher | 1,489 (82.4%) | 34 (1.9%) |
| Total | 2,969 (78.0%) | 91 (2.4%) |
Employment Occupations by Sex in Sudden Valley
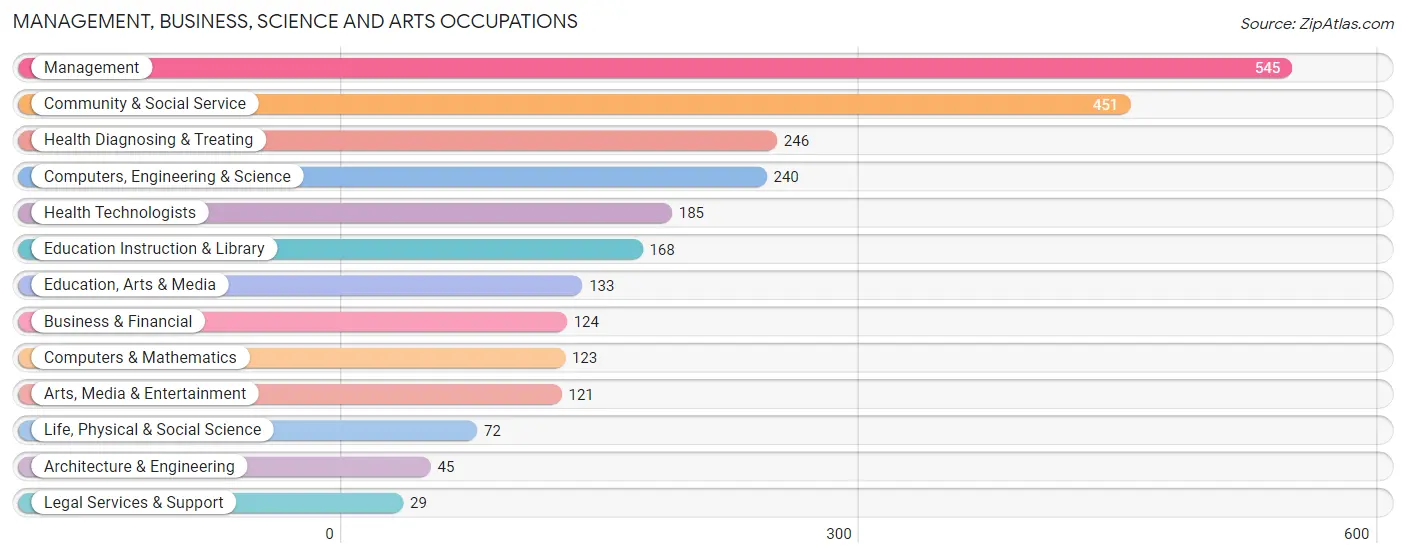
Management, Business, Science and Arts Occupations
The most common Management, Business, Science and Arts occupations in Sudden Valley are Management (545 | 16.8%), Community & Social Service (451 | 13.9%), Health Diagnosing & Treating (246 | 7.6%), Computers, Engineering & Science (240 | 7.4%), and Health Technologists (185 | 5.7%).
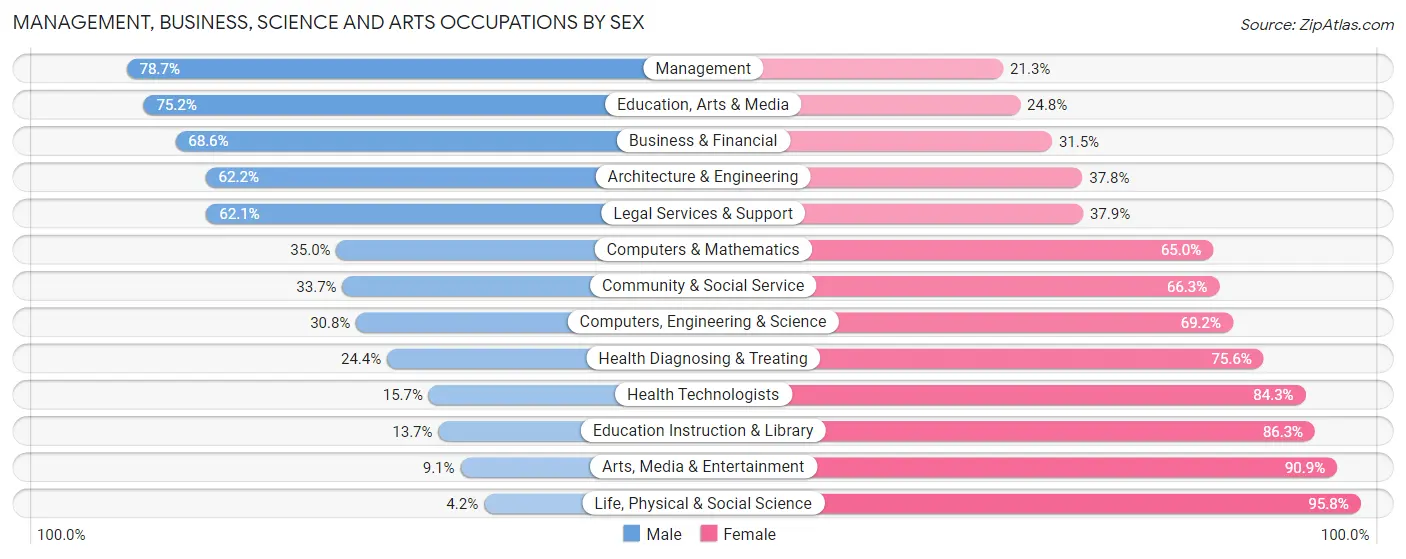
Management, Business, Science and Arts Occupations by Sex
Within the Management, Business, Science and Arts occupations in Sudden Valley, the most male-oriented occupations are Management (78.7%), Education, Arts & Media (75.2%), and Business & Financial (68.5%), while the most female-oriented occupations are Life, Physical & Social Science (95.8%), Arts, Media & Entertainment (90.9%), and Education Instruction & Library (86.3%).
| Occupation | Male | Female |
| Management | 429 (78.7%) | 116 (21.3%) |
| Business & Financial | 85 (68.5%) | 39 (31.5%) |
| Computers, Engineering & Science | 74 (30.8%) | 166 (69.2%) |
| Computers & Mathematics | 43 (35.0%) | 80 (65.0%) |
| Architecture & Engineering | 28 (62.2%) | 17 (37.8%) |
| Life, Physical & Social Science | 3 (4.2%) | 69 (95.8%) |
| Community & Social Service | 152 (33.7%) | 299 (66.3%) |
| Education, Arts & Media | 100 (75.2%) | 33 (24.8%) |
| Legal Services & Support | 18 (62.1%) | 11 (37.9%) |
| Education Instruction & Library | 23 (13.7%) | 145 (86.3%) |
| Arts, Media & Entertainment | 11 (9.1%) | 110 (90.9%) |
| Health Diagnosing & Treating | 60 (24.4%) | 186 (75.6%) |
| Health Technologists | 29 (15.7%) | 156 (84.3%) |
| Total (Category) | 800 (49.8%) | 806 (50.2%) |
| Total (Overall) | 1,685 (52.0%) | 1,554 (48.0%) |
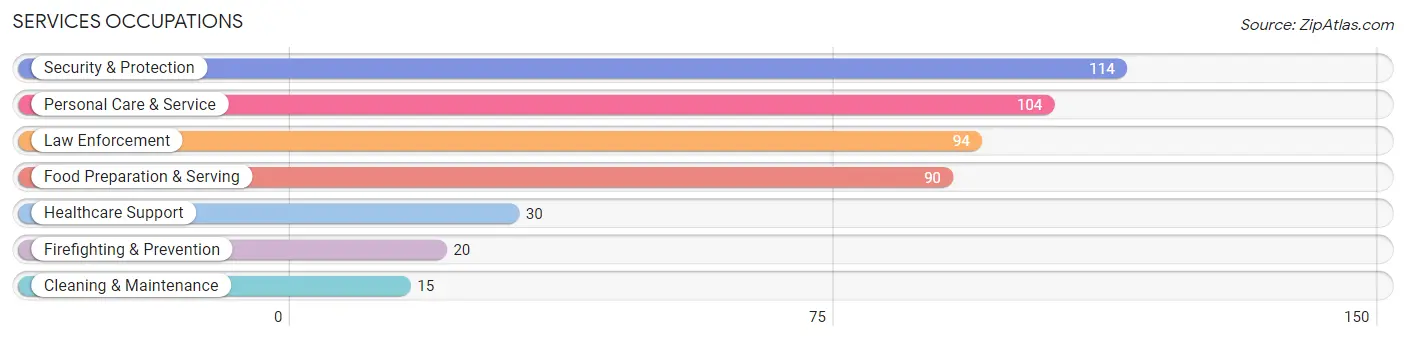
Services Occupations
The most common Services occupations in Sudden Valley are Security & Protection (114 | 3.5%), Personal Care & Service (104 | 3.2%), Law Enforcement (94 | 2.9%), Food Preparation & Serving (90 | 2.8%), and Healthcare Support (30 | 0.9%).
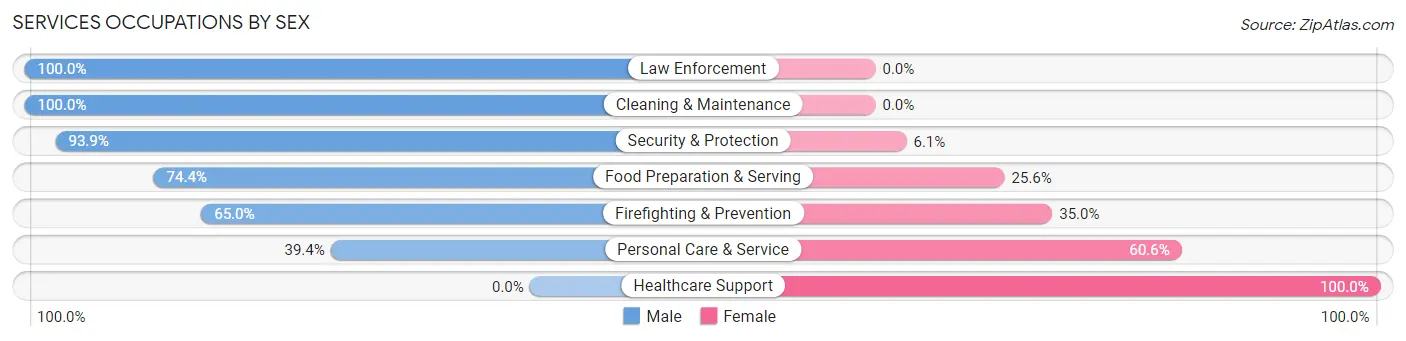
Services Occupations by Sex
Within the Services occupations in Sudden Valley, the most male-oriented occupations are Law Enforcement (100.0%), Cleaning & Maintenance (100.0%), and Security & Protection (93.9%), while the most female-oriented occupations are Healthcare Support (100.0%), Personal Care & Service (60.6%), and Firefighting & Prevention (35.0%).
| Occupation | Male | Female |
| Healthcare Support | 0 (0.0%) | 30 (100.0%) |
| Security & Protection | 107 (93.9%) | 7 (6.1%) |
| Firefighting & Prevention | 13 (65.0%) | 7 (35.0%) |
| Law Enforcement | 94 (100.0%) | 0 (0.0%) |
| Food Preparation & Serving | 67 (74.4%) | 23 (25.6%) |
| Cleaning & Maintenance | 15 (100.0%) | 0 (0.0%) |
| Personal Care & Service | 41 (39.4%) | 63 (60.6%) |
| Total (Category) | 230 (65.2%) | 123 (34.8%) |
| Total (Overall) | 1,685 (52.0%) | 1,554 (48.0%) |
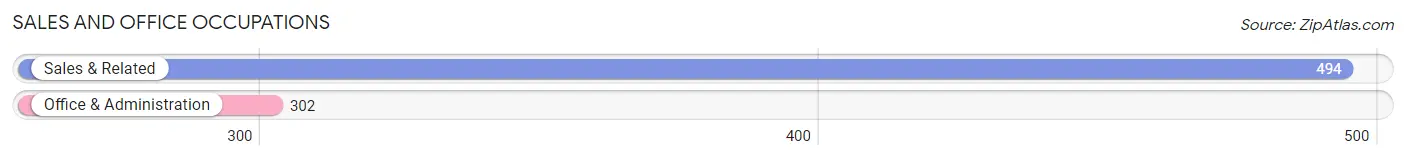
Sales and Office Occupations
The most common Sales and Office occupations in Sudden Valley are Sales & Related (494 | 15.2%), and Office & Administration (302 | 9.3%).
Sales and Office Occupations by Sex
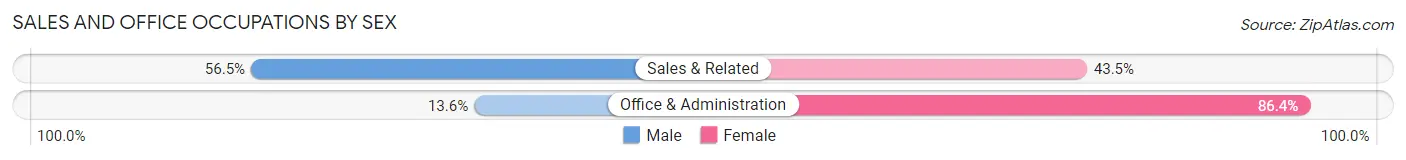
| Occupation | Male | Female |
| Sales & Related | 279 (56.5%) | 215 (43.5%) |
| Office & Administration | 41 (13.6%) | 261 (86.4%) |
| Total (Category) | 320 (40.2%) | 476 (59.8%) |
| Total (Overall) | 1,685 (52.0%) | 1,554 (48.0%) |
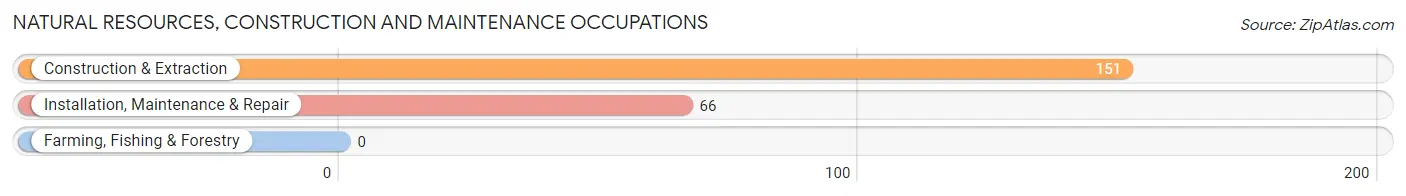
Natural Resources, Construction and Maintenance Occupations
The most common Natural Resources, Construction and Maintenance occupations in Sudden Valley are Construction & Extraction (151 | 4.7%), and Installation, Maintenance & Repair (66 | 2.0%).
Natural Resources, Construction and Maintenance Occupations by Sex
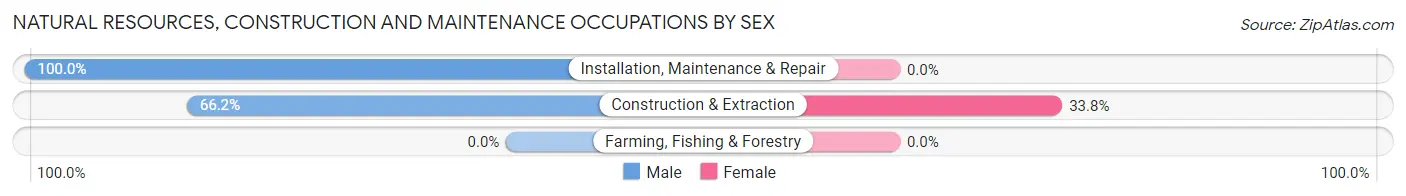
| Occupation | Male | Female |
| Farming, Fishing & Forestry | 0 (0.0%) | 0 (0.0%) |
| Construction & Extraction | 100 (66.2%) | 51 (33.8%) |
| Installation, Maintenance & Repair | 66 (100.0%) | 0 (0.0%) |
| Total (Category) | 166 (76.5%) | 51 (23.5%) |
| Total (Overall) | 1,685 (52.0%) | 1,554 (48.0%) |
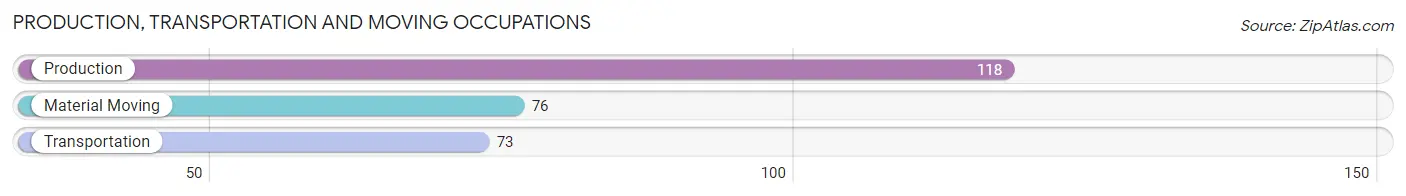
Production, Transportation and Moving Occupations
The most common Production, Transportation and Moving occupations in Sudden Valley are Production (118 | 3.6%), Material Moving (76 | 2.4%), and Transportation (73 | 2.2%).
Production, Transportation and Moving Occupations by Sex

| Occupation | Male | Female |
| Production | 55 (46.6%) | 63 (53.4%) |
| Transportation | 58 (79.4%) | 15 (20.5%) |
| Material Moving | 56 (73.7%) | 20 (26.3%) |
| Total (Category) | 169 (63.3%) | 98 (36.7%) |
| Total (Overall) | 1,685 (52.0%) | 1,554 (48.0%) |
Employment Industries by Sex in Sudden Valley
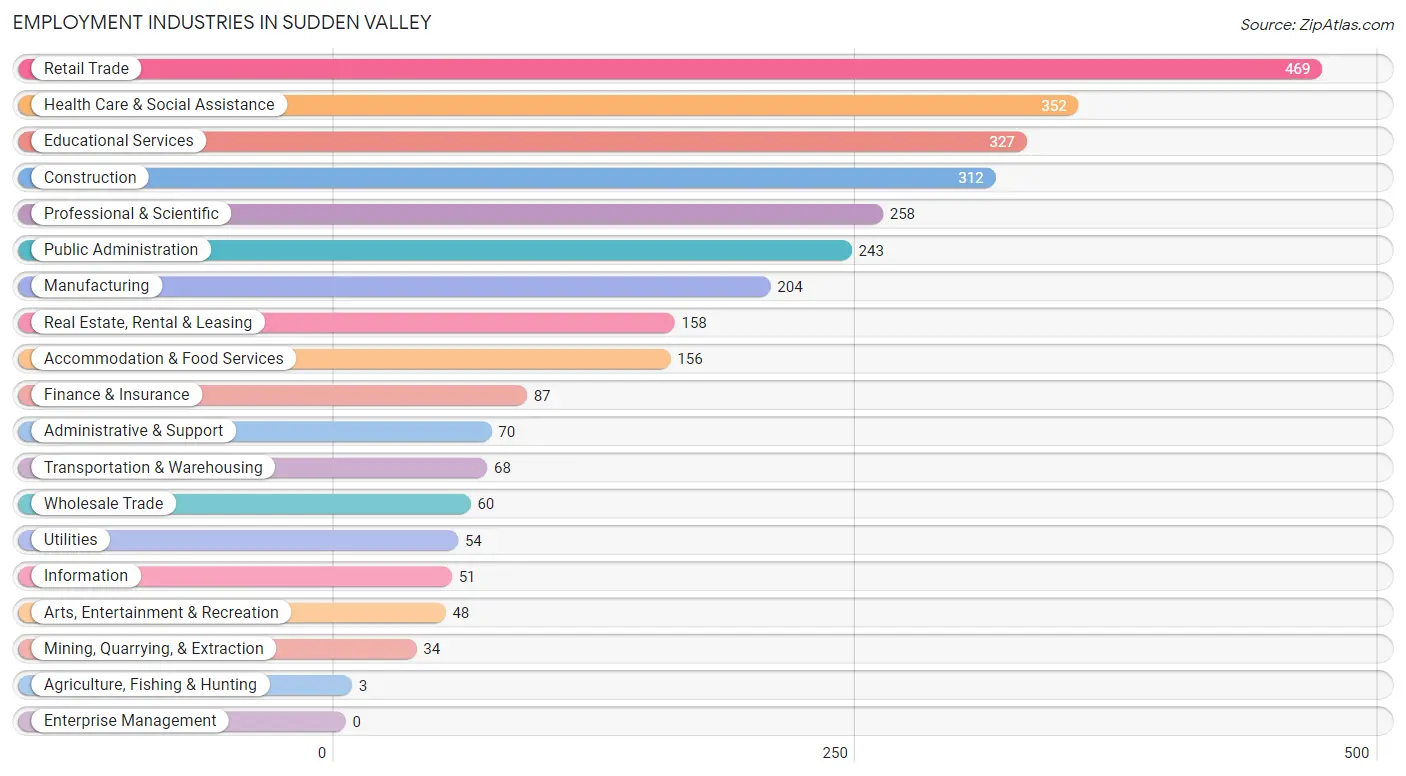
Employment Industries in Sudden Valley
The major employment industries in Sudden Valley include Retail Trade (469 | 14.5%), Health Care & Social Assistance (352 | 10.9%), Educational Services (327 | 10.1%), Construction (312 | 9.6%), and Professional & Scientific (258 | 8.0%).
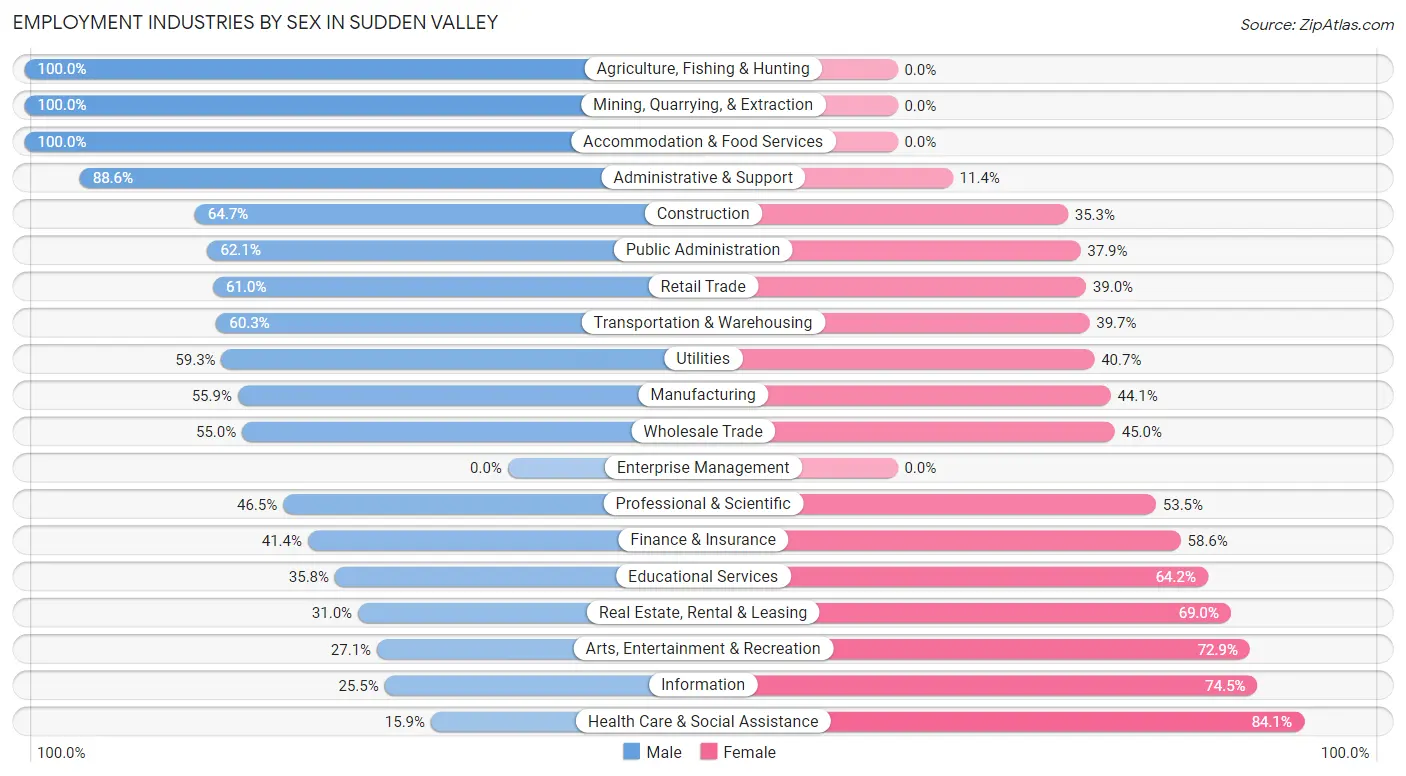
Employment Industries by Sex in Sudden Valley
The Sudden Valley industries that see more men than women are Agriculture, Fishing & Hunting (100.0%), Mining, Quarrying, & Extraction (100.0%), and Accommodation & Food Services (100.0%), whereas the industries that tend to have a higher number of women are Health Care & Social Assistance (84.1%), Information (74.5%), and Arts, Entertainment & Recreation (72.9%).
| Industry | Male | Female |
| Agriculture, Fishing & Hunting | 3 (100.0%) | 0 (0.0%) |
| Mining, Quarrying, & Extraction | 34 (100.0%) | 0 (0.0%) |
| Construction | 202 (64.7%) | 110 (35.3%) |
| Manufacturing | 114 (55.9%) | 90 (44.1%) |
| Wholesale Trade | 33 (55.0%) | 27 (45.0%) |
| Retail Trade | 286 (61.0%) | 183 (39.0%) |
| Transportation & Warehousing | 41 (60.3%) | 27 (39.7%) |
| Utilities | 32 (59.3%) | 22 (40.7%) |
| Information | 13 (25.5%) | 38 (74.5%) |
| Finance & Insurance | 36 (41.4%) | 51 (58.6%) |
| Real Estate, Rental & Leasing | 49 (31.0%) | 109 (69.0%) |
| Professional & Scientific | 120 (46.5%) | 138 (53.5%) |
| Enterprise Management | 0 (0.0%) | 0 (0.0%) |
| Administrative & Support | 62 (88.6%) | 8 (11.4%) |
| Educational Services | 117 (35.8%) | 210 (64.2%) |
| Health Care & Social Assistance | 56 (15.9%) | 296 (84.1%) |
| Arts, Entertainment & Recreation | 13 (27.1%) | 35 (72.9%) |
| Accommodation & Food Services | 156 (100.0%) | 0 (0.0%) |
| Public Administration | 151 (62.1%) | 92 (37.9%) |
| Total | 1,685 (52.0%) | 1,554 (48.0%) |
Education in Sudden Valley
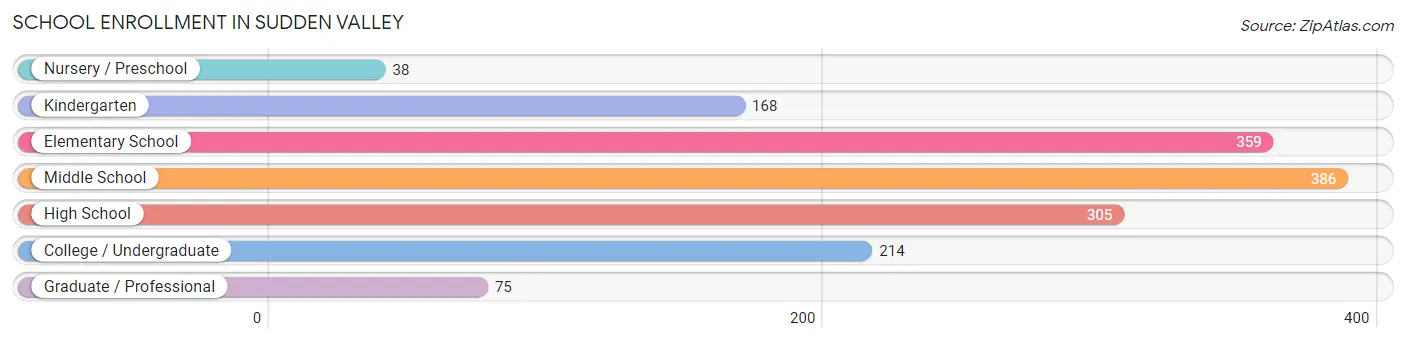
School Enrollment in Sudden Valley
The most common levels of schooling among the 1,545 students in Sudden Valley are middle school (386 | 25.0%), elementary school (359 | 23.2%), and high school (305 | 19.7%).
| School Level | # Students | % Students |
| Nursery / Preschool | 38 | 2.5% |
| Kindergarten | 168 | 10.9% |
| Elementary School | 359 | 23.2% |
| Middle School | 386 | 25.0% |
| High School | 305 | 19.7% |
| College / Undergraduate | 214 | 13.9% |
| Graduate / Professional | 75 | 4.9% |
| Total | 1,545 | 100.0% |
School Enrollment by Age by Funding Source in Sudden Valley
Out of a total of 1,545 students who are enrolled in schools in Sudden Valley, 139 (9.0%) attend a private institution, while the remaining 1,406 (91.0%) are enrolled in public schools. The age group of 3 to 4 year olds has the highest likelihood of being enrolled in private schools, with 13 (100.0% in the age bracket) enrolled. Conversely, the age group of 15 to 17 year olds has the lowest likelihood of being enrolled in a private school, with 199 (100.0% in the age bracket) attending a public institution.
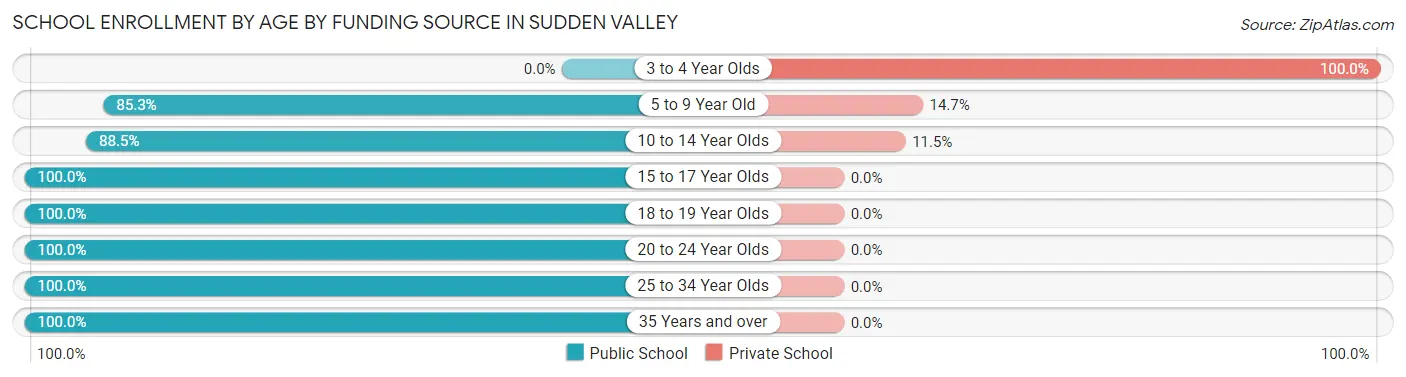
| Age Bracket | Public School | Private School |
| 3 to 4 Year Olds | 0 (0.0%) | 13 (100.0%) |
| 5 to 9 Year Old | 395 (85.3%) | 68 (14.7%) |
| 10 to 14 Year Olds | 448 (88.5%) | 58 (11.5%) |
| 15 to 17 Year Olds | 199 (100.0%) | 0 (0.0%) |
| 18 to 19 Year Olds | 75 (100.0%) | 0 (0.0%) |
| 20 to 24 Year Olds | 14 (100.0%) | 0 (0.0%) |
| 25 to 34 Year Olds | 225 (100.0%) | 0 (0.0%) |
| 35 Years and over | 50 (100.0%) | 0 (0.0%) |
| Total | 1,406 (91.0%) | 139 (9.0%) |
Educational Attainment by Field of Study in Sudden Valley
Arts & humanities (409 | 13.5%), literature & languages (347 | 11.4%), business (344 | 11.3%), bio, nature & agricultural (294 | 9.7%), and education (232 | 7.6%) are the most common fields of study among 3,033 individuals in Sudden Valley who have obtained a bachelor's degree or higher.
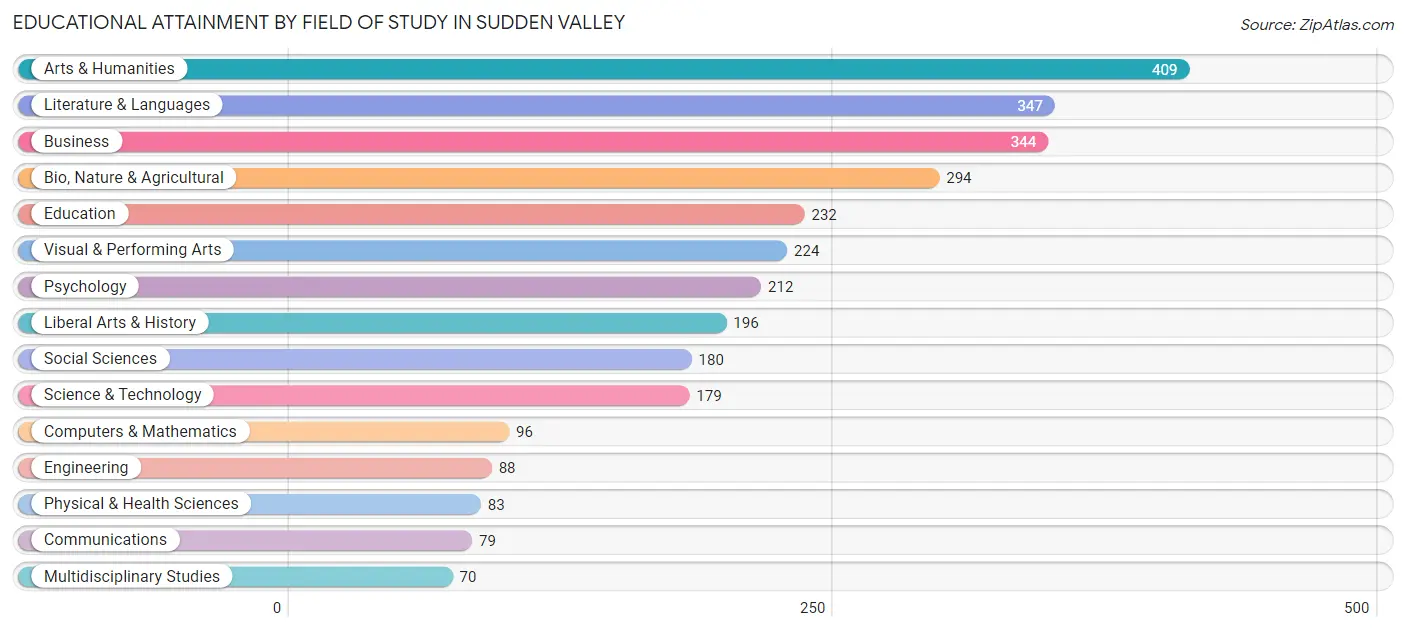
| Field of Study | # Graduates | % Graduates |
| Computers & Mathematics | 96 | 3.2% |
| Bio, Nature & Agricultural | 294 | 9.7% |
| Physical & Health Sciences | 83 | 2.7% |
| Psychology | 212 | 7.0% |
| Social Sciences | 180 | 5.9% |
| Engineering | 88 | 2.9% |
| Multidisciplinary Studies | 70 | 2.3% |
| Science & Technology | 179 | 5.9% |
| Business | 344 | 11.3% |
| Education | 232 | 7.6% |
| Literature & Languages | 347 | 11.4% |
| Liberal Arts & History | 196 | 6.5% |
| Visual & Performing Arts | 224 | 7.4% |
| Communications | 79 | 2.6% |
| Arts & Humanities | 409 | 13.5% |
| Total | 3,033 | 100.0% |
Transportation & Commute in Sudden Valley
Vehicle Availability by Sex in Sudden Valley
The most prevalent vehicle ownership categories in Sudden Valley are males with 2 vehicles (995, accounting for 58.3%) and females with 2 vehicles (850, making up 65.8%).
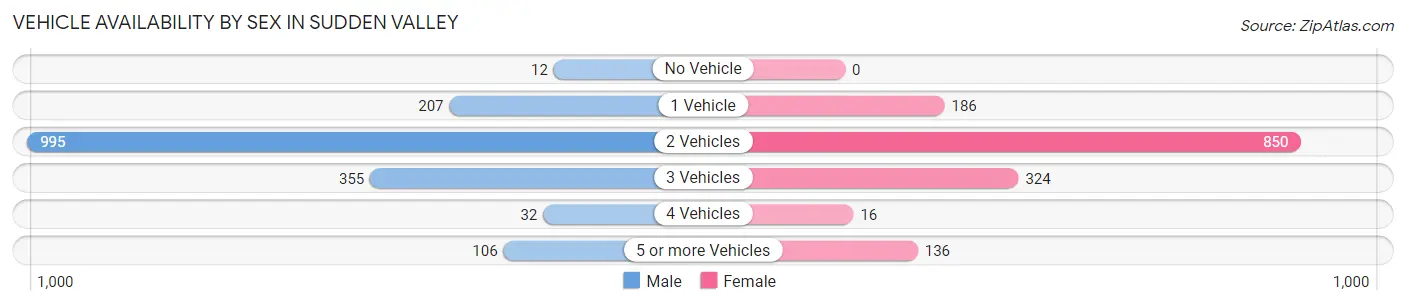
| Vehicles Available | Male | Female |
| No Vehicle | 12 (0.7%) | 0 (0.0%) |
| 1 Vehicle | 207 (12.1%) | 186 (12.3%) |
| 2 Vehicles | 995 (58.3%) | 850 (56.2%) |
| 3 Vehicles | 355 (20.8%) | 324 (21.4%) |
| 4 Vehicles | 32 (1.9%) | 16 (1.1%) |
| 5 or more Vehicles | 106 (6.2%) | 136 (9.0%) |
| Total | 1,707 (100.0%) | 1,512 (100.0%) |
Commute Time in Sudden Valley
The most frequently occuring commute durations in Sudden Valley are 30 to 34 minutes (551 commuters, 20.0%), 20 to 24 minutes (544 commuters, 19.7%), and 25 to 29 minutes (352 commuters, 12.7%).
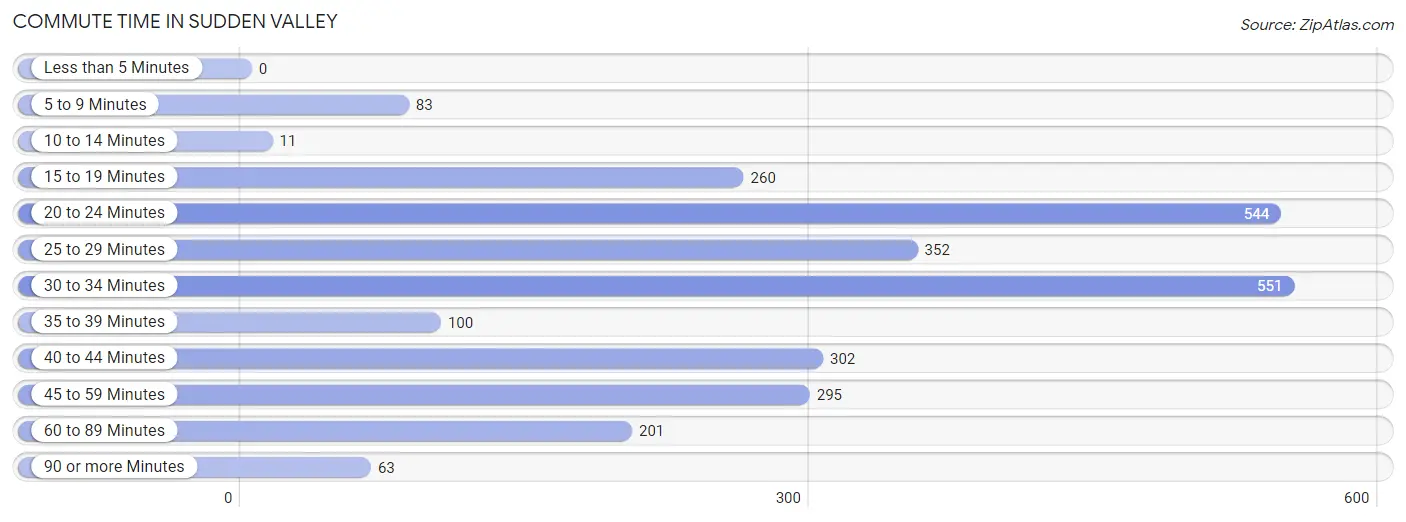
| Commute Time | # Commuters | % Commuters |
| Less than 5 Minutes | 0 | 0.0% |
| 5 to 9 Minutes | 83 | 3.0% |
| 10 to 14 Minutes | 11 | 0.4% |
| 15 to 19 Minutes | 260 | 9.4% |
| 20 to 24 Minutes | 544 | 19.7% |
| 25 to 29 Minutes | 352 | 12.7% |
| 30 to 34 Minutes | 551 | 20.0% |
| 35 to 39 Minutes | 100 | 3.6% |
| 40 to 44 Minutes | 302 | 10.9% |
| 45 to 59 Minutes | 295 | 10.7% |
| 60 to 89 Minutes | 201 | 7.3% |
| 90 or more Minutes | 63 | 2.3% |
Commute Time by Sex in Sudden Valley
The most common commute times in Sudden Valley are 30 to 34 minutes (328 commuters, 21.5%) for males and 20 to 24 minutes (353 commuters, 28.6%) for females.
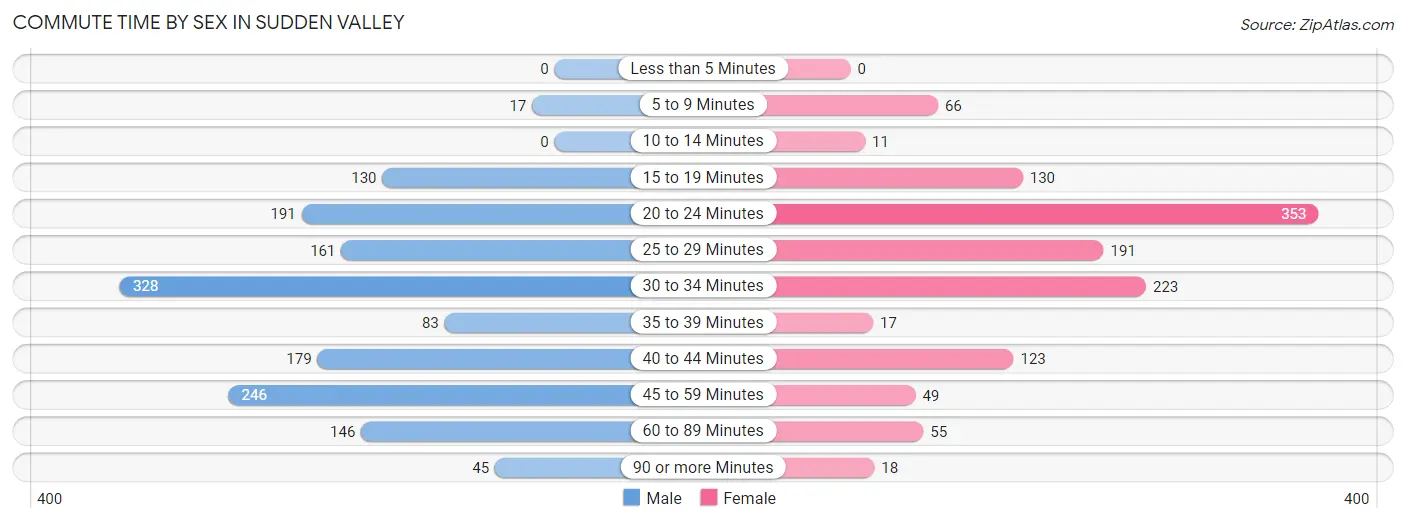
| Commute Time | Male | Female |
| Less than 5 Minutes | 0 (0.0%) | 0 (0.0%) |
| 5 to 9 Minutes | 17 (1.1%) | 66 (5.3%) |
| 10 to 14 Minutes | 0 (0.0%) | 11 (0.9%) |
| 15 to 19 Minutes | 130 (8.5%) | 130 (10.5%) |
| 20 to 24 Minutes | 191 (12.5%) | 353 (28.6%) |
| 25 to 29 Minutes | 161 (10.5%) | 191 (15.4%) |
| 30 to 34 Minutes | 328 (21.5%) | 223 (18.0%) |
| 35 to 39 Minutes | 83 (5.4%) | 17 (1.4%) |
| 40 to 44 Minutes | 179 (11.7%) | 123 (10.0%) |
| 45 to 59 Minutes | 246 (16.1%) | 49 (4.0%) |
| 60 to 89 Minutes | 146 (9.6%) | 55 (4.4%) |
| 90 or more Minutes | 45 (2.9%) | 18 (1.5%) |
Time of Departure to Work by Sex in Sudden Valley
The most frequent times of departure to work in Sudden Valley are 7:30 AM to 7:59 AM (322, 21.1%) for males and 7:30 AM to 7:59 AM (225, 18.2%) for females.
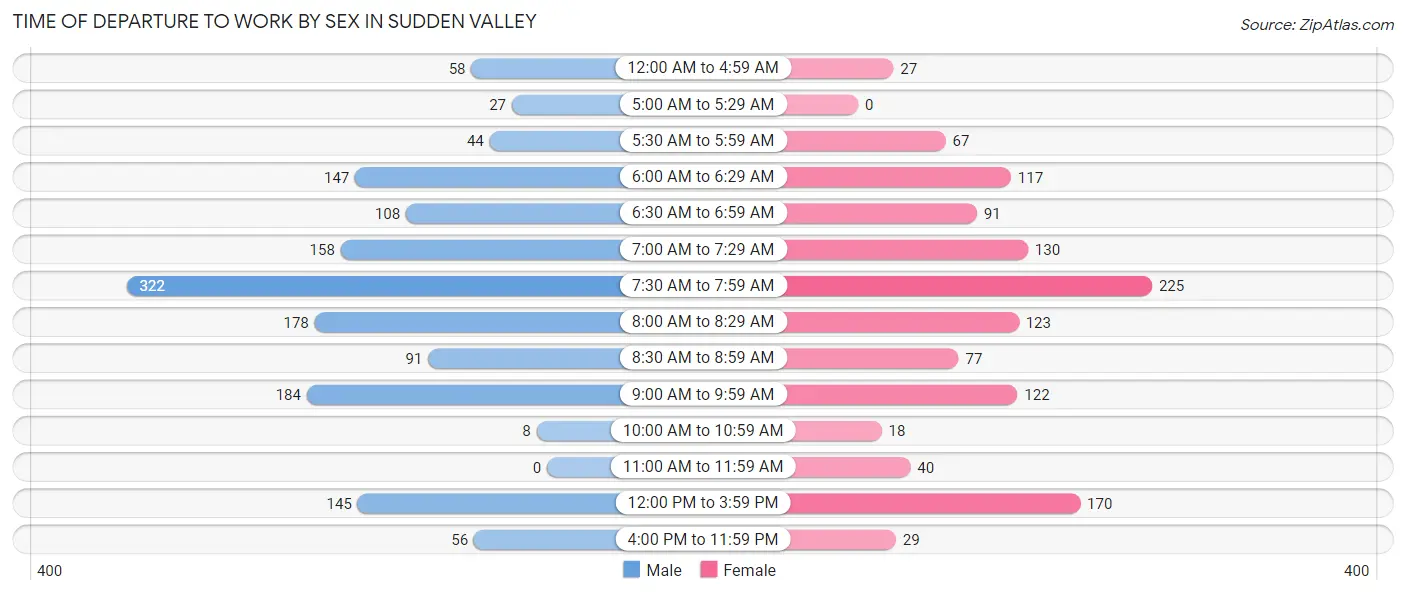
| Time of Departure | Male | Female |
| 12:00 AM to 4:59 AM | 58 (3.8%) | 27 (2.2%) |
| 5:00 AM to 5:29 AM | 27 (1.8%) | 0 (0.0%) |
| 5:30 AM to 5:59 AM | 44 (2.9%) | 67 (5.4%) |
| 6:00 AM to 6:29 AM | 147 (9.6%) | 117 (9.5%) |
| 6:30 AM to 6:59 AM | 108 (7.1%) | 91 (7.4%) |
| 7:00 AM to 7:29 AM | 158 (10.3%) | 130 (10.5%) |
| 7:30 AM to 7:59 AM | 322 (21.1%) | 225 (18.2%) |
| 8:00 AM to 8:29 AM | 178 (11.7%) | 123 (10.0%) |
| 8:30 AM to 8:59 AM | 91 (6.0%) | 77 (6.2%) |
| 9:00 AM to 9:59 AM | 184 (12.1%) | 122 (9.9%) |
| 10:00 AM to 10:59 AM | 8 (0.5%) | 18 (1.5%) |
| 11:00 AM to 11:59 AM | 0 (0.0%) | 40 (3.2%) |
| 12:00 PM to 3:59 PM | 145 (9.5%) | 170 (13.8%) |
| 4:00 PM to 11:59 PM | 56 (3.7%) | 29 (2.4%) |
| Total | 1,526 (100.0%) | 1,236 (100.0%) |
Housing Occupancy in Sudden Valley
Occupancy by Ownership in Sudden Valley
Of the total 2,914 dwellings in Sudden Valley, owner-occupied units account for 2,715 (93.2%), while renter-occupied units make up 199 (6.8%).
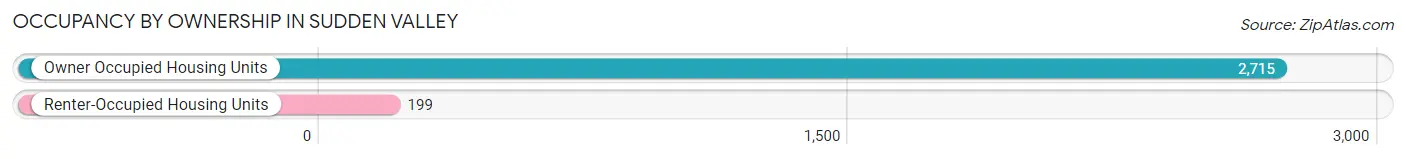
| Occupancy | # Housing Units | % Housing Units |
| Owner Occupied Housing Units | 2,715 | 93.2% |
| Renter-Occupied Housing Units | 199 | 6.8% |
| Total Occupied Housing Units | 2,914 | 100.0% |
Occupancy by Household Size in Sudden Valley
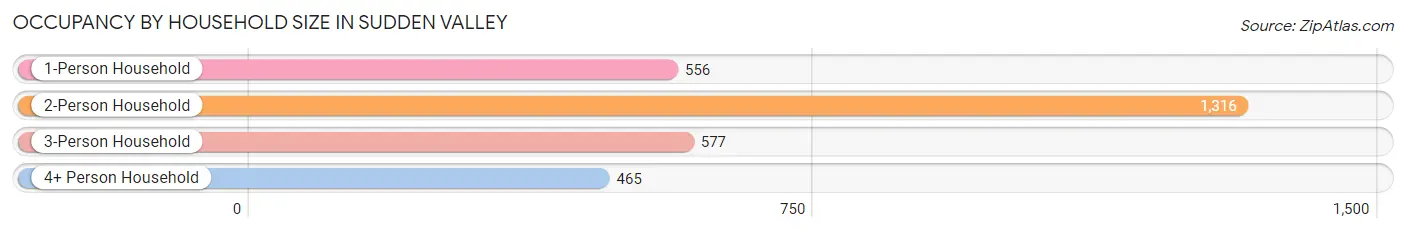
| Household Size | # Housing Units | % Housing Units |
| 1-Person Household | 556 | 19.1% |
| 2-Person Household | 1,316 | 45.2% |
| 3-Person Household | 577 | 19.8% |
| 4+ Person Household | 465 | 16.0% |
| Total Housing Units | 2,914 | 100.0% |
Occupancy by Ownership by Household Size in Sudden Valley
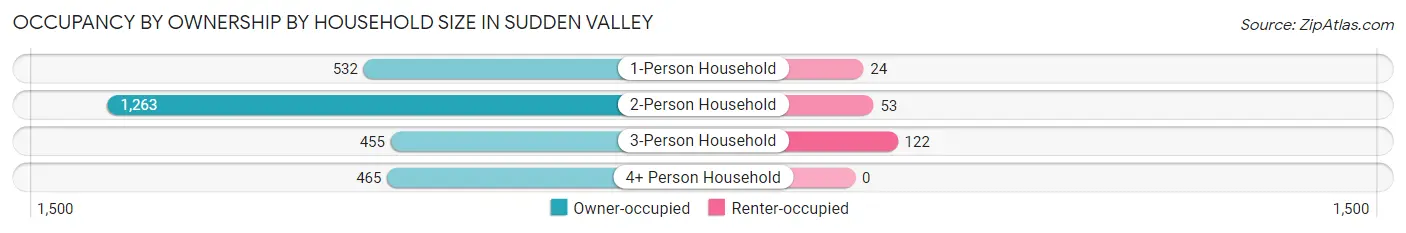
| Household Size | Owner-occupied | Renter-occupied |
| 1-Person Household | 532 (95.7%) | 24 (4.3%) |
| 2-Person Household | 1,263 (96.0%) | 53 (4.0%) |
| 3-Person Household | 455 (78.9%) | 122 (21.1%) |
| 4+ Person Household | 465 (100.0%) | 0 (0.0%) |
| Total Housing Units | 2,715 (93.2%) | 199 (6.8%) |
Occupancy by Educational Attainment in Sudden Valley
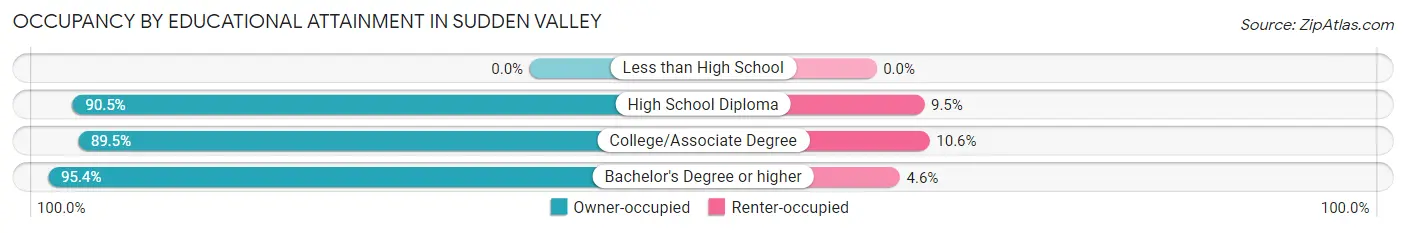
| Household Size | Owner-occupied | Renter-occupied |
| Less than High School | 0 (0.0%) | 0 (0.0%) |
| High School Diploma | 229 (90.5%) | 24 (9.5%) |
| College/Associate Degree | 780 (89.4%) | 92 (10.5%) |
| Bachelor's Degree or higher | 1,706 (95.4%) | 83 (4.6%) |
Occupancy by Age of Householder in Sudden Valley
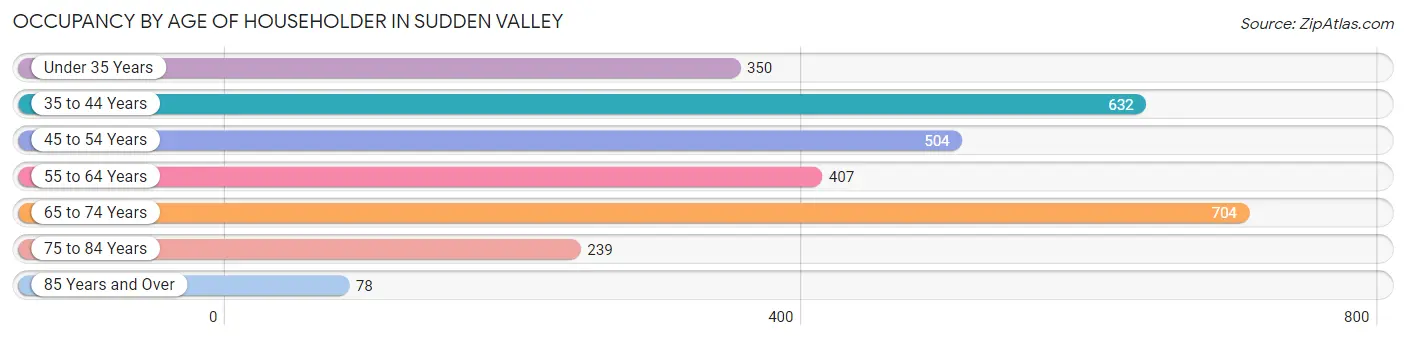
| Age Bracket | # Households | % Households |
| Under 35 Years | 350 | 12.0% |
| 35 to 44 Years | 632 | 21.7% |
| 45 to 54 Years | 504 | 17.3% |
| 55 to 64 Years | 407 | 14.0% |
| 65 to 74 Years | 704 | 24.2% |
| 75 to 84 Years | 239 | 8.2% |
| 85 Years and Over | 78 | 2.7% |
| Total | 2,914 | 100.0% |
Housing Finances in Sudden Valley
Median Income by Occupancy in Sudden Valley
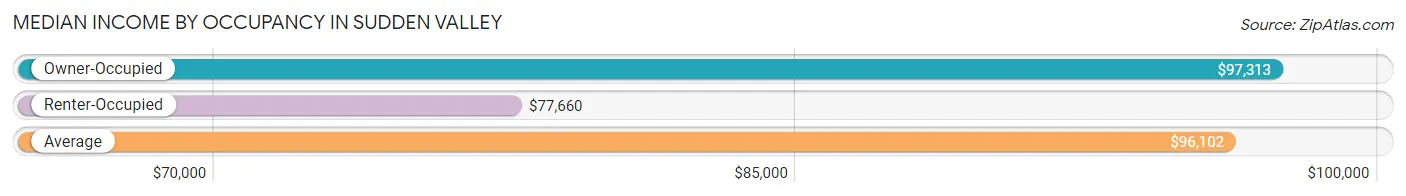
| Occupancy Type | # Households | Median Income |
| Owner-Occupied | 2,715 (93.2%) | $97,313 |
| Renter-Occupied | 199 (6.8%) | $77,660 |
| Average | 2,914 (100.0%) | $96,102 |
Occupancy by Householder Income Bracket in Sudden Valley
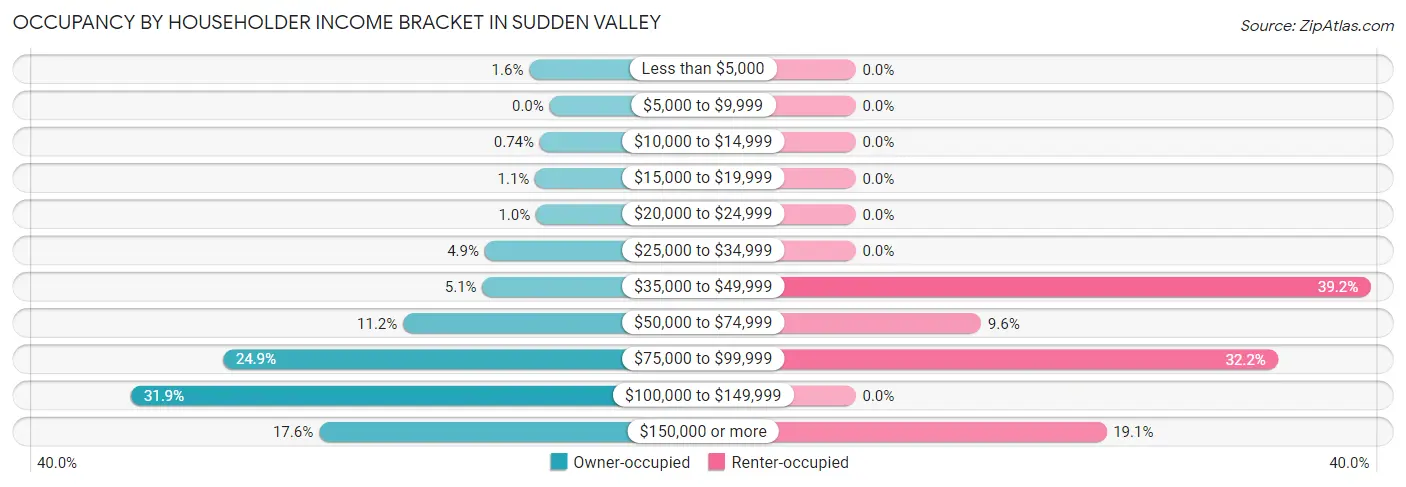
| Income Bracket | Owner-occupied | Renter-occupied |
| Less than $5,000 | 42 (1.5%) | 0 (0.0%) |
| $5,000 to $9,999 | 0 (0.0%) | 0 (0.0%) |
| $10,000 to $14,999 | 20 (0.7%) | 0 (0.0%) |
| $15,000 to $19,999 | 30 (1.1%) | 0 (0.0%) |
| $20,000 to $24,999 | 28 (1.0%) | 0 (0.0%) |
| $25,000 to $34,999 | 134 (4.9%) | 0 (0.0%) |
| $35,000 to $49,999 | 139 (5.1%) | 78 (39.2%) |
| $50,000 to $74,999 | 303 (11.2%) | 19 (9.6%) |
| $75,000 to $99,999 | 676 (24.9%) | 64 (32.2%) |
| $100,000 to $149,999 | 866 (31.9%) | 0 (0.0%) |
| $150,000 or more | 477 (17.6%) | 38 (19.1%) |
| Total | 2,715 (100.0%) | 199 (100.0%) |
Monthly Housing Cost Tiers in Sudden Valley
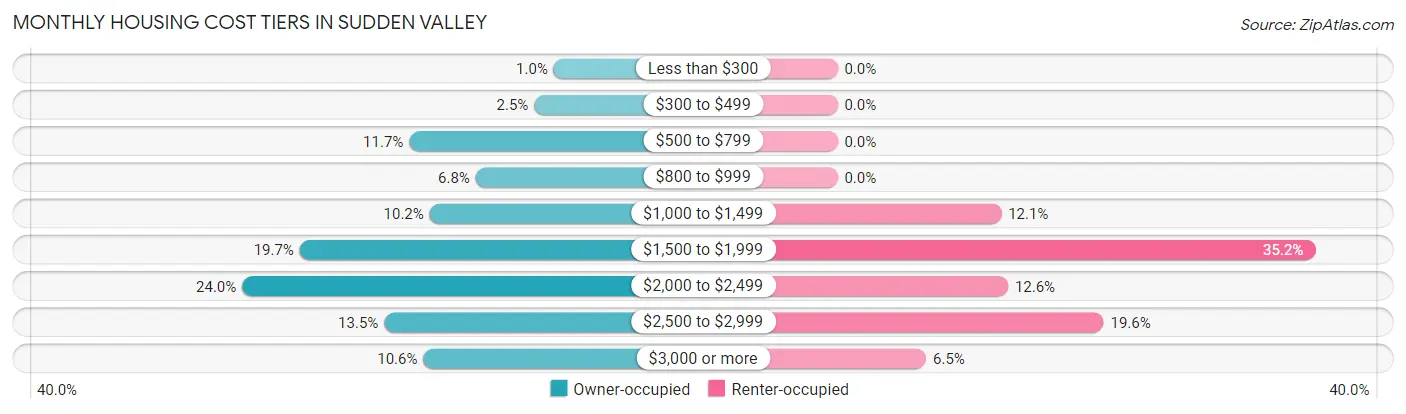
| Monthly Cost | Owner-occupied | Renter-occupied |
| Less than $300 | 28 (1.0%) | 0 (0.0%) |
| $300 to $499 | 67 (2.5%) | 0 (0.0%) |
| $500 to $799 | 317 (11.7%) | 0 (0.0%) |
| $800 to $999 | 184 (6.8%) | 0 (0.0%) |
| $1,000 to $1,499 | 276 (10.2%) | 24 (12.1%) |
| $1,500 to $1,999 | 536 (19.7%) | 70 (35.2%) |
| $2,000 to $2,499 | 651 (24.0%) | 25 (12.6%) |
| $2,500 to $2,999 | 367 (13.5%) | 39 (19.6%) |
| $3,000 or more | 289 (10.6%) | 13 (6.5%) |
| Total | 2,715 (100.0%) | 199 (100.0%) |
Physical Housing Characteristics in Sudden Valley
Housing Structures in Sudden Valley
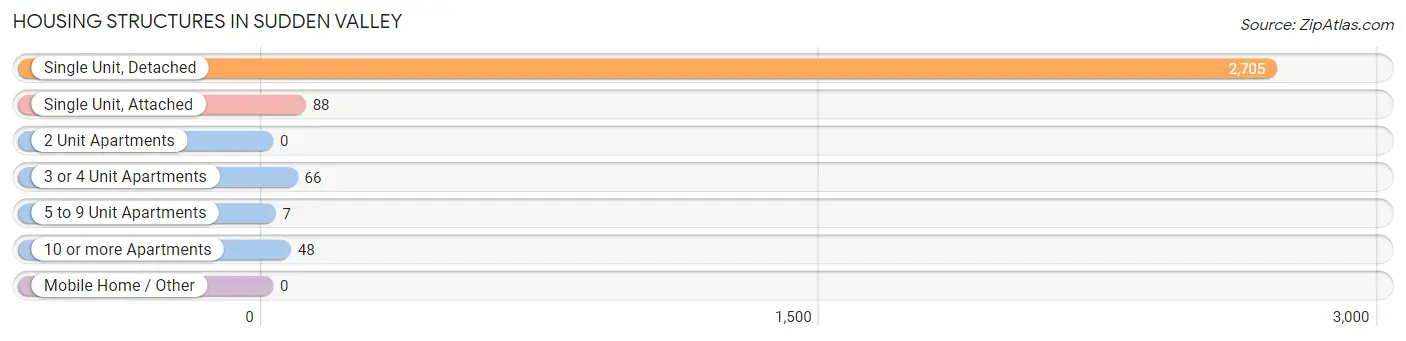
| Structure Type | # Housing Units | % Housing Units |
| Single Unit, Detached | 2,705 | 92.8% |
| Single Unit, Attached | 88 | 3.0% |
| 2 Unit Apartments | 0 | 0.0% |
| 3 or 4 Unit Apartments | 66 | 2.3% |
| 5 to 9 Unit Apartments | 7 | 0.2% |
| 10 or more Apartments | 48 | 1.7% |
| Mobile Home / Other | 0 | 0.0% |
| Total | 2,914 | 100.0% |
Housing Structures by Occupancy in Sudden Valley
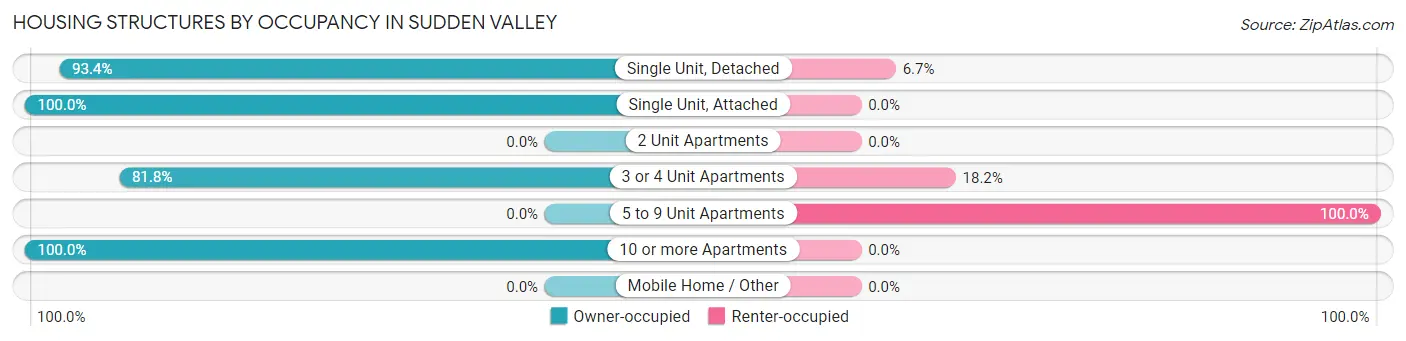
| Structure Type | Owner-occupied | Renter-occupied |
| Single Unit, Detached | 2,525 (93.3%) | 180 (6.7%) |
| Single Unit, Attached | 88 (100.0%) | 0 (0.0%) |
| 2 Unit Apartments | 0 (0.0%) | 0 (0.0%) |
| 3 or 4 Unit Apartments | 54 (81.8%) | 12 (18.2%) |
| 5 to 9 Unit Apartments | 0 (0.0%) | 7 (100.0%) |
| 10 or more Apartments | 48 (100.0%) | 0 (0.0%) |
| Mobile Home / Other | 0 (0.0%) | 0 (0.0%) |
| Total | 2,715 (93.2%) | 199 (6.8%) |
Housing Structures by Number of Rooms in Sudden Valley
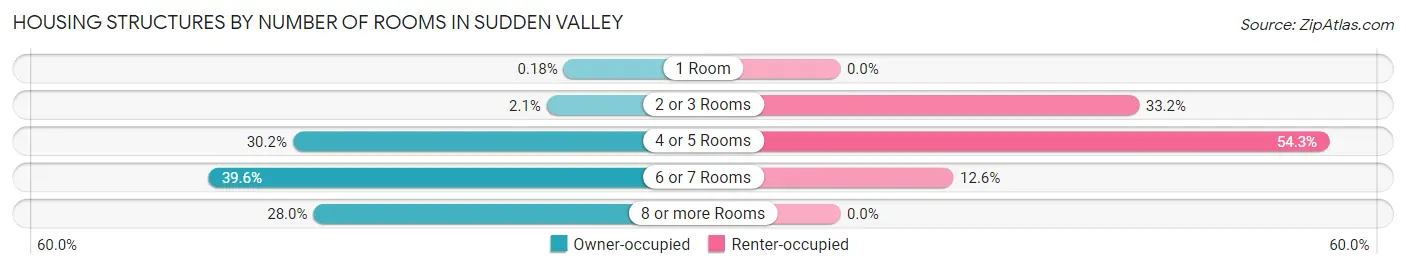
| Number of Rooms | Owner-occupied | Renter-occupied |
| 1 Room | 5 (0.2%) | 0 (0.0%) |
| 2 or 3 Rooms | 56 (2.1%) | 66 (33.2%) |
| 4 or 5 Rooms | 821 (30.2%) | 108 (54.3%) |
| 6 or 7 Rooms | 1,074 (39.6%) | 25 (12.6%) |
| 8 or more Rooms | 759 (28.0%) | 0 (0.0%) |
| Total | 2,715 (100.0%) | 199 (100.0%) |
Housing Structure by Heating Type in Sudden Valley
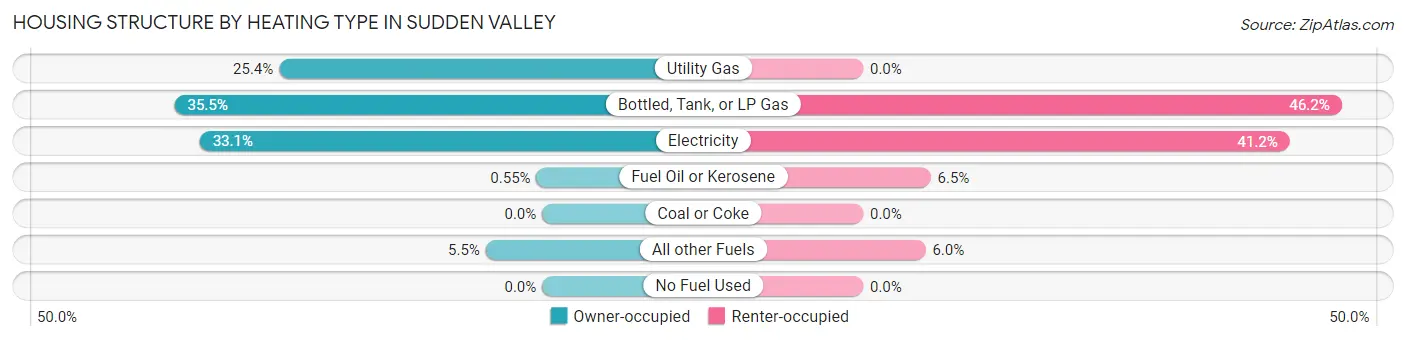
| Heating Type | Owner-occupied | Renter-occupied |
| Utility Gas | 690 (25.4%) | 0 (0.0%) |
| Bottled, Tank, or LP Gas | 964 (35.5%) | 92 (46.2%) |
| Electricity | 898 (33.1%) | 82 (41.2%) |
| Fuel Oil or Kerosene | 15 (0.5%) | 13 (6.5%) |
| Coal or Coke | 0 (0.0%) | 0 (0.0%) |
| All other Fuels | 148 (5.4%) | 12 (6.0%) |
| No Fuel Used | 0 (0.0%) | 0 (0.0%) |
| Total | 2,715 (100.0%) | 199 (100.0%) |
Household Vehicle Usage in Sudden Valley
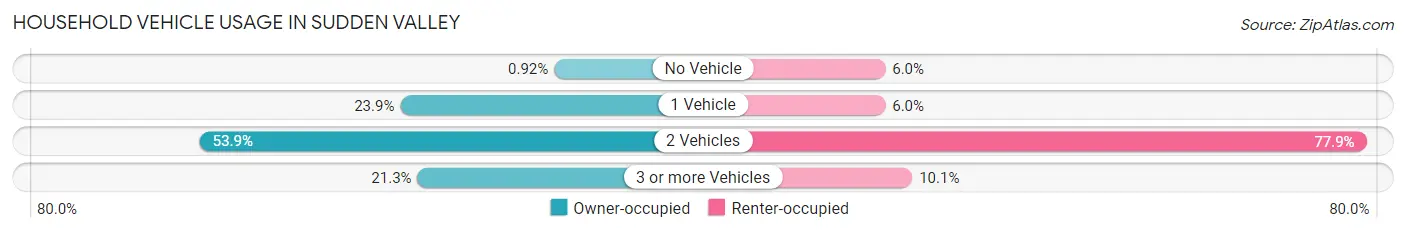
| Vehicles per Household | Owner-occupied | Renter-occupied |
| No Vehicle | 25 (0.9%) | 12 (6.0%) |
| 1 Vehicle | 649 (23.9%) | 12 (6.0%) |
| 2 Vehicles | 1,462 (53.8%) | 155 (77.9%) |
| 3 or more Vehicles | 579 (21.3%) | 20 (10.1%) |
| Total | 2,715 (100.0%) | 199 (100.0%) |
Real Estate & Mortgages in Sudden Valley
Real Estate and Mortgage Overview in Sudden Valley
| Characteristic | Without Mortgage | With Mortgage |
| Housing Units | 662 | 2,053 |
| Median Property Value | $477,300 | $403,600 |
| Median Household Income | $84,167 | $356 |
| Monthly Housing Costs | $696 | $289 |
| Real Estate Taxes | $3,629 | $0 |
Property Value by Mortgage Status in Sudden Valley
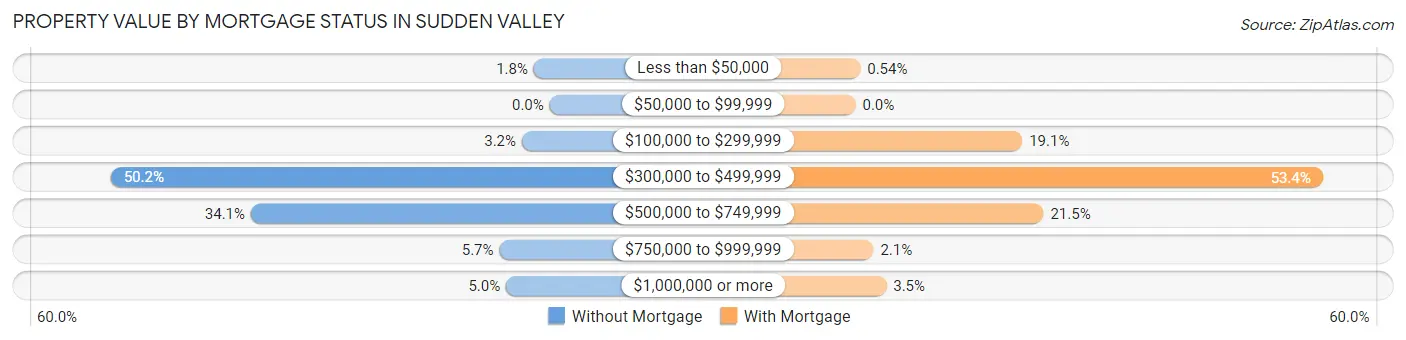
| Property Value | Without Mortgage | With Mortgage |
| Less than $50,000 | 12 (1.8%) | 11 (0.5%) |
| $50,000 to $99,999 | 0 (0.0%) | 0 (0.0%) |
| $100,000 to $299,999 | 21 (3.2%) | 391 (19.1%) |
| $300,000 to $499,999 | 332 (50.1%) | 1,096 (53.4%) |
| $500,000 to $749,999 | 226 (34.1%) | 441 (21.5%) |
| $750,000 to $999,999 | 38 (5.7%) | 42 (2.1%) |
| $1,000,000 or more | 33 (5.0%) | 72 (3.5%) |
| Total | 662 (100.0%) | 2,053 (100.0%) |
Household Income by Mortgage Status in Sudden Valley
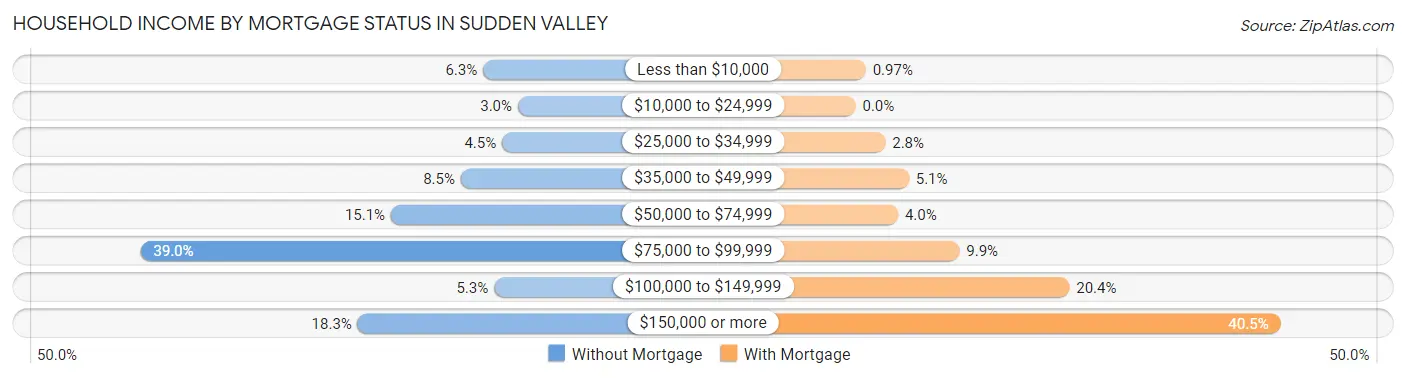
| Household Income | Without Mortgage | With Mortgage |
| Less than $10,000 | 42 (6.3%) | 20 (1.0%) |
| $10,000 to $24,999 | 20 (3.0%) | 0 (0.0%) |
| $25,000 to $34,999 | 30 (4.5%) | 58 (2.8%) |
| $35,000 to $49,999 | 56 (8.5%) | 104 (5.1%) |
| $50,000 to $74,999 | 100 (15.1%) | 83 (4.0%) |
| $75,000 to $99,999 | 258 (39.0%) | 203 (9.9%) |
| $100,000 to $149,999 | 35 (5.3%) | 418 (20.4%) |
| $150,000 or more | 121 (18.3%) | 831 (40.5%) |
| Total | 662 (100.0%) | 2,053 (100.0%) |
Property Value to Household Income Ratio in Sudden Valley
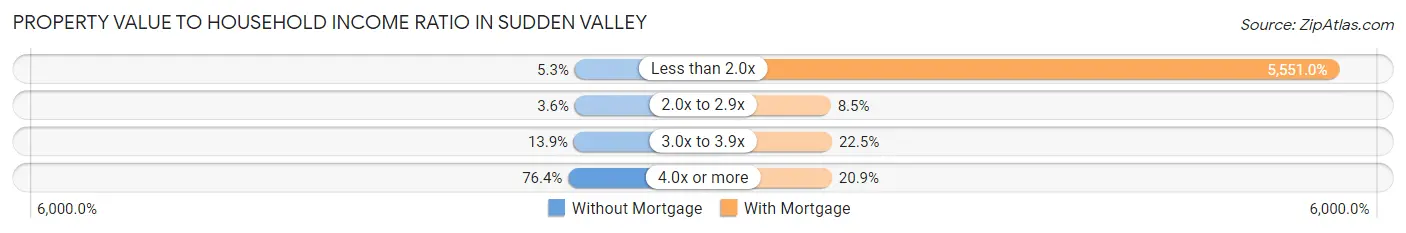
| Value-to-Income Ratio | Without Mortgage | With Mortgage |
| Less than 2.0x | 35 (5.3%) | 113,961 (5,551.0%) |
| 2.0x to 2.9x | 24 (3.6%) | 174 (8.5%) |
| 3.0x to 3.9x | 92 (13.9%) | 461 (22.5%) |
| 4.0x or more | 506 (76.4%) | 429 (20.9%) |
| Total | 662 (100.0%) | 2,053 (100.0%) |
Real Estate Taxes by Mortgage Status in Sudden Valley
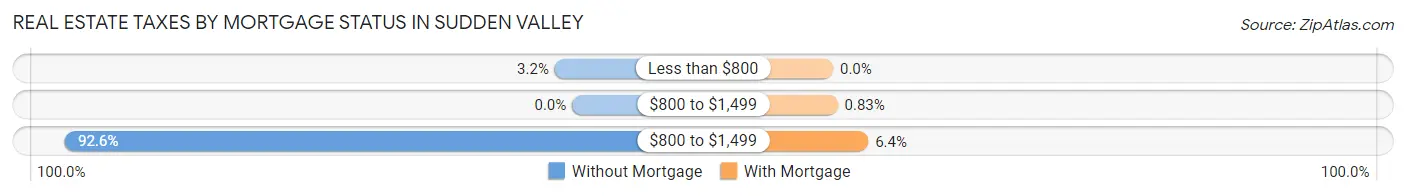
| Property Taxes | Without Mortgage | With Mortgage |
| Less than $800 | 21 (3.2%) | 0 (0.0%) |
| $800 to $1,499 | 0 (0.0%) | 17 (0.8%) |
| $800 to $1,499 | 613 (92.6%) | 132 (6.4%) |
| Total | 662 (100.0%) | 2,053 (100.0%) |
Health & Disability in Sudden Valley
Health Insurance Coverage by Age in Sudden Valley
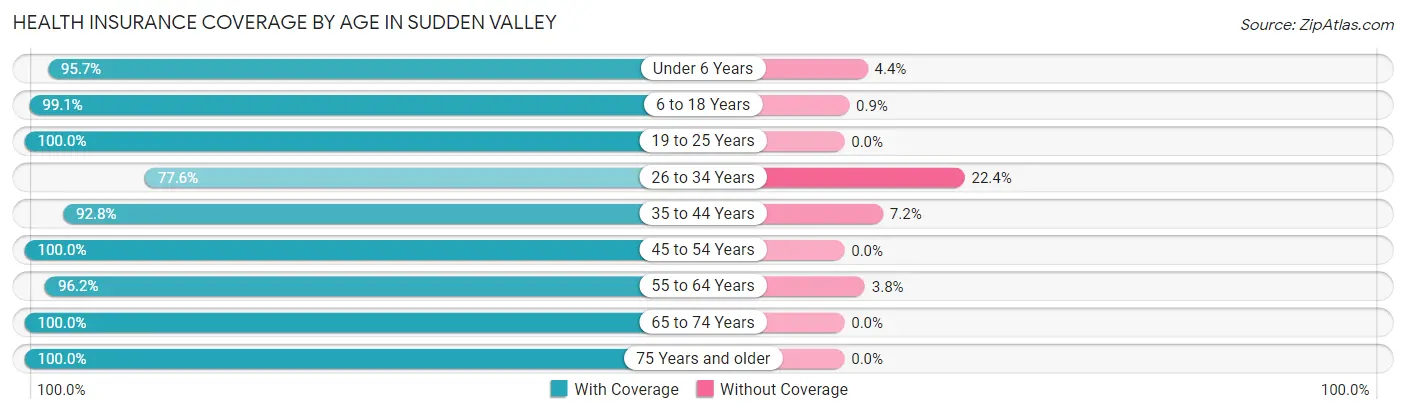
| Age Bracket | With Coverage | Without Coverage |
| Under 6 Years | 286 (95.7%) | 13 (4.3%) |
| 6 to 18 Years | 1,212 (99.1%) | 11 (0.9%) |
| 19 to 25 Years | 113 (100.0%) | 0 (0.0%) |
| 26 to 34 Years | 671 (77.6%) | 194 (22.4%) |
| 35 to 44 Years | 1,057 (92.8%) | 82 (7.2%) |
| 45 to 54 Years | 836 (100.0%) | 0 (0.0%) |
| 55 to 64 Years | 879 (96.2%) | 35 (3.8%) |
| 65 to 74 Years | 1,073 (100.0%) | 0 (0.0%) |
| 75 Years and older | 619 (100.0%) | 0 (0.0%) |
| Total | 6,746 (95.3%) | 335 (4.7%) |
Health Insurance Coverage by Citizenship Status in Sudden Valley
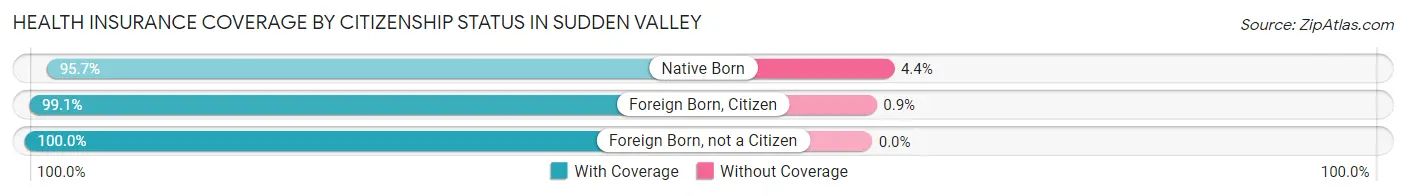
| Citizenship Status | With Coverage | Without Coverage |
| Native Born | 286 (95.7%) | 13 (4.3%) |
| Foreign Born, Citizen | 1,212 (99.1%) | 11 (0.9%) |
| Foreign Born, not a Citizen | 113 (100.0%) | 0 (0.0%) |
Health Insurance Coverage by Household Income in Sudden Valley
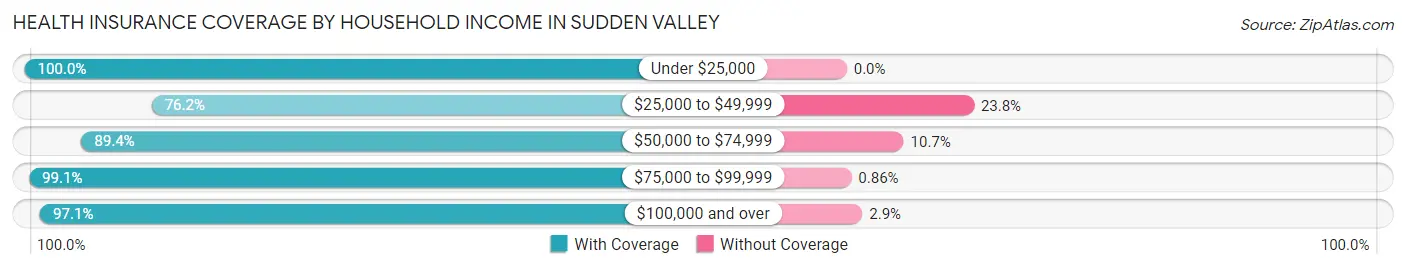
| Household Income | With Coverage | Without Coverage |
| Under $25,000 | 206 (100.0%) | 0 (0.0%) |
| $25,000 to $49,999 | 486 (76.2%) | 152 (23.8%) |
| $50,000 to $74,999 | 453 (89.3%) | 54 (10.6%) |
| $75,000 to $99,999 | 1,839 (99.1%) | 16 (0.9%) |
| $100,000 and over | 3,762 (97.1%) | 113 (2.9%) |
Public vs Private Health Insurance Coverage by Age in Sudden Valley
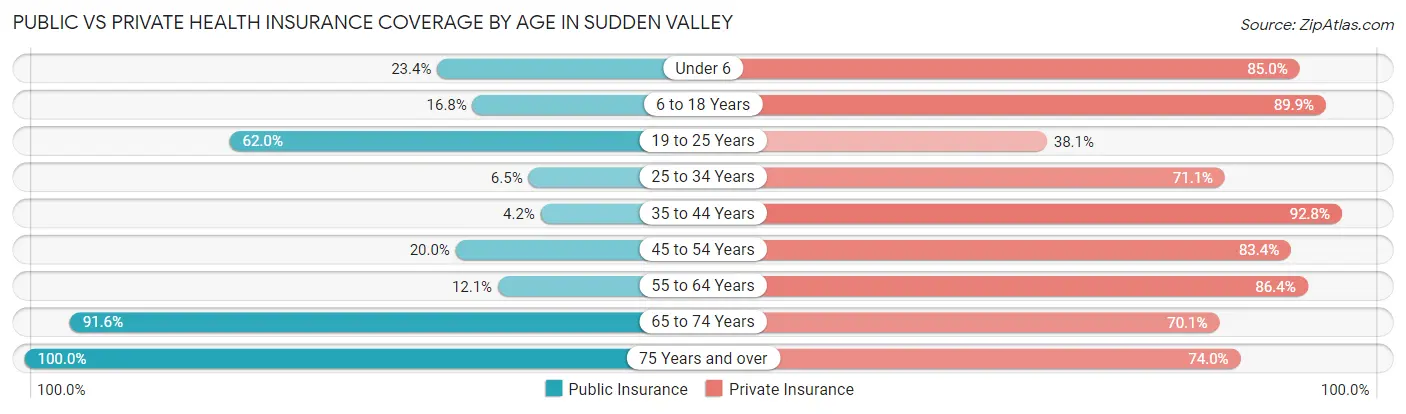
| Age Bracket | Public Insurance | Private Insurance |
| Under 6 | 70 (23.4%) | 254 (85.0%) |
| 6 to 18 Years | 206 (16.8%) | 1,099 (89.9%) |
| 19 to 25 Years | 70 (62.0%) | 43 (38.1%) |
| 25 to 34 Years | 56 (6.5%) | 615 (71.1%) |
| 35 to 44 Years | 48 (4.2%) | 1,057 (92.8%) |
| 45 to 54 Years | 167 (20.0%) | 697 (83.4%) |
| 55 to 64 Years | 111 (12.1%) | 790 (86.4%) |
| 65 to 74 Years | 983 (91.6%) | 752 (70.1%) |
| 75 Years and over | 619 (100.0%) | 458 (74.0%) |
| Total | 2,330 (32.9%) | 5,765 (81.4%) |
Disability Status by Sex by Age in Sudden Valley
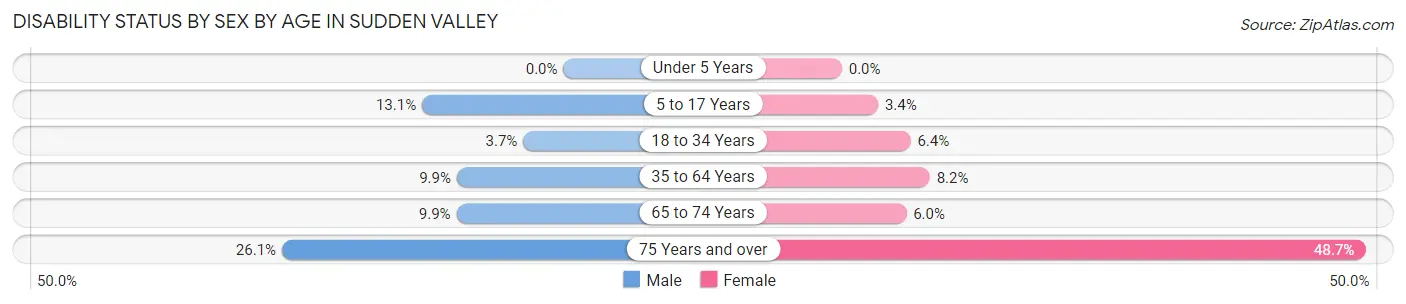
| Age Bracket | Male | Female |
| Under 5 Years | 0 (0.0%) | 0 (0.0%) |
| 5 to 17 Years | 77 (13.1%) | 21 (3.4%) |
| 18 to 34 Years | 17 (3.7%) | 38 (6.4%) |
| 35 to 64 Years | 139 (9.9%) | 121 (8.2%) |
| 65 to 74 Years | 60 (9.9%) | 28 (6.0%) |
| 75 Years and over | 64 (26.1%) | 182 (48.7%) |
Disability Class by Sex by Age in Sudden Valley
Disability Class: Hearing Difficulty
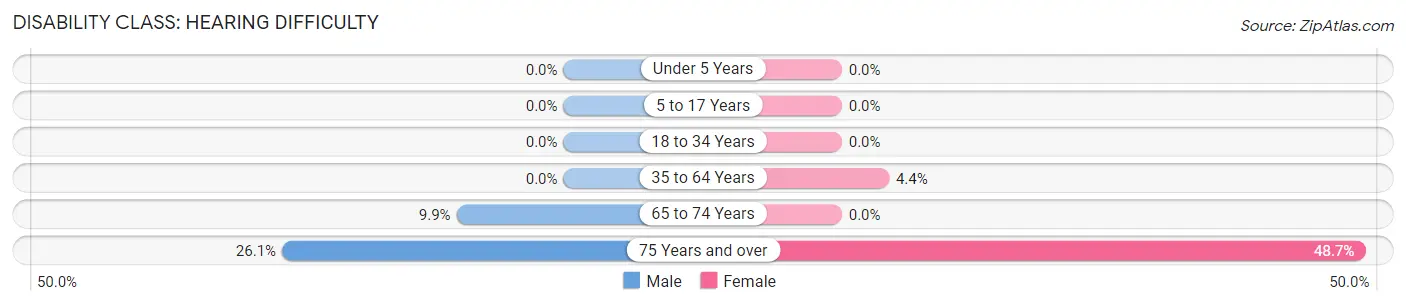
| Age Bracket | Male | Female |
| Under 5 Years | 0 (0.0%) | 0 (0.0%) |
| 5 to 17 Years | 0 (0.0%) | 0 (0.0%) |
| 18 to 34 Years | 0 (0.0%) | 0 (0.0%) |
| 35 to 64 Years | 0 (0.0%) | 65 (4.4%) |
| 65 to 74 Years | 60 (9.9%) | 0 (0.0%) |
| 75 Years and over | 64 (26.1%) | 182 (48.7%) |
Disability Class: Vision Difficulty
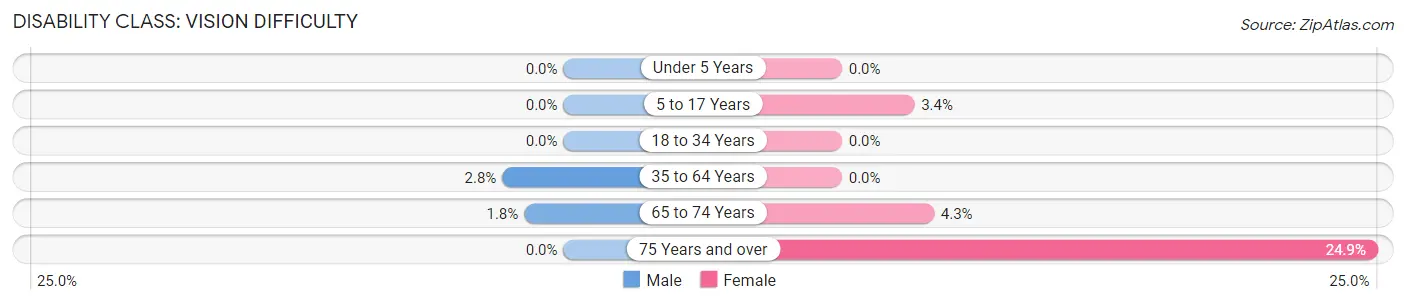
| Age Bracket | Male | Female |
| Under 5 Years | 0 (0.0%) | 0 (0.0%) |
| 5 to 17 Years | 0 (0.0%) | 21 (3.4%) |
| 18 to 34 Years | 0 (0.0%) | 0 (0.0%) |
| 35 to 64 Years | 40 (2.8%) | 0 (0.0%) |
| 65 to 74 Years | 11 (1.8%) | 20 (4.3%) |
| 75 Years and over | 0 (0.0%) | 93 (24.9%) |
Disability Class: Cognitive Difficulty
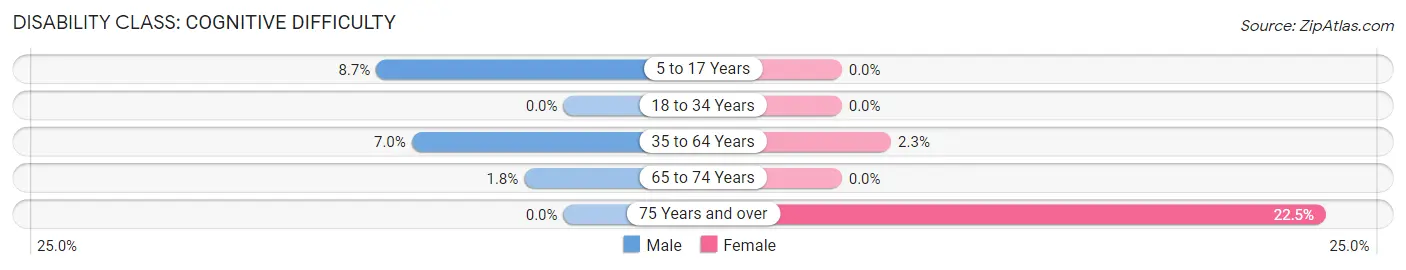
| Age Bracket | Male | Female |
| 5 to 17 Years | 51 (8.7%) | 0 (0.0%) |
| 18 to 34 Years | 0 (0.0%) | 0 (0.0%) |
| 35 to 64 Years | 99 (7.0%) | 34 (2.3%) |
| 65 to 74 Years | 11 (1.8%) | 0 (0.0%) |
| 75 Years and over | 0 (0.0%) | 84 (22.5%) |
Disability Class: Ambulatory Difficulty
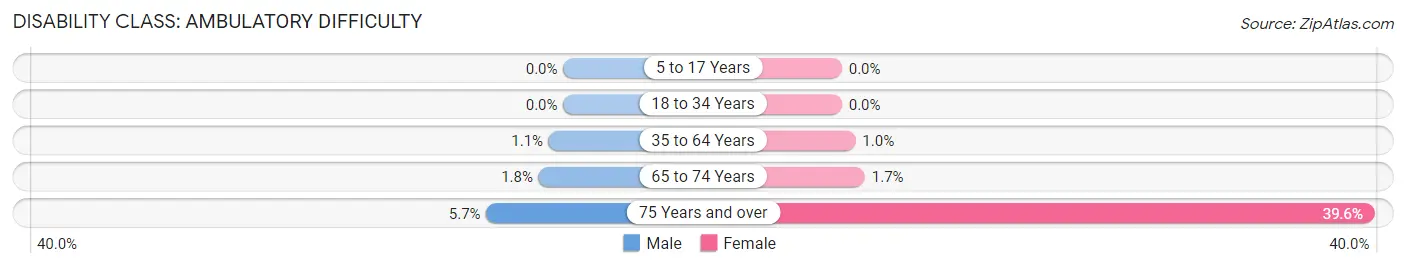
| Age Bracket | Male | Female |
| 5 to 17 Years | 0 (0.0%) | 0 (0.0%) |
| 18 to 34 Years | 0 (0.0%) | 0 (0.0%) |
| 35 to 64 Years | 15 (1.1%) | 15 (1.0%) |
| 65 to 74 Years | 11 (1.8%) | 8 (1.7%) |
| 75 Years and over | 14 (5.7%) | 148 (39.6%) |
Disability Class: Self-Care Difficulty
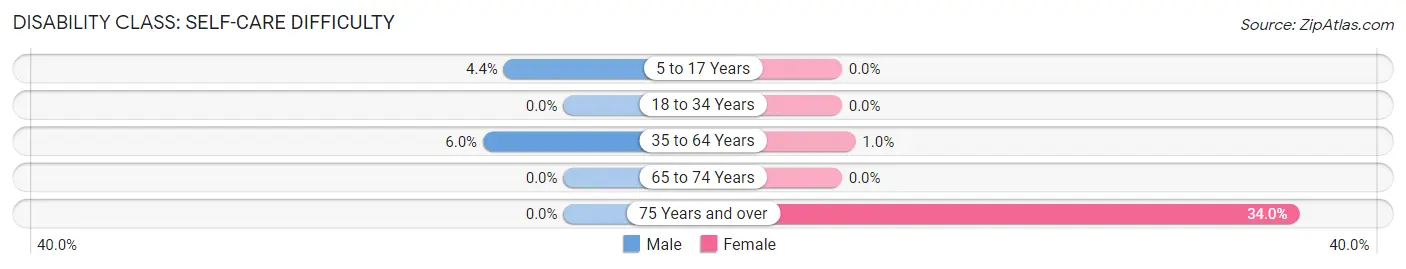
| Age Bracket | Male | Female |
| 5 to 17 Years | 26 (4.4%) | 0 (0.0%) |
| 18 to 34 Years | 0 (0.0%) | 0 (0.0%) |
| 35 to 64 Years | 84 (6.0%) | 15 (1.0%) |
| 65 to 74 Years | 0 (0.0%) | 0 (0.0%) |
| 75 Years and over | 0 (0.0%) | 127 (34.0%) |
Technology Access in Sudden Valley
Computing Device Access in Sudden Valley
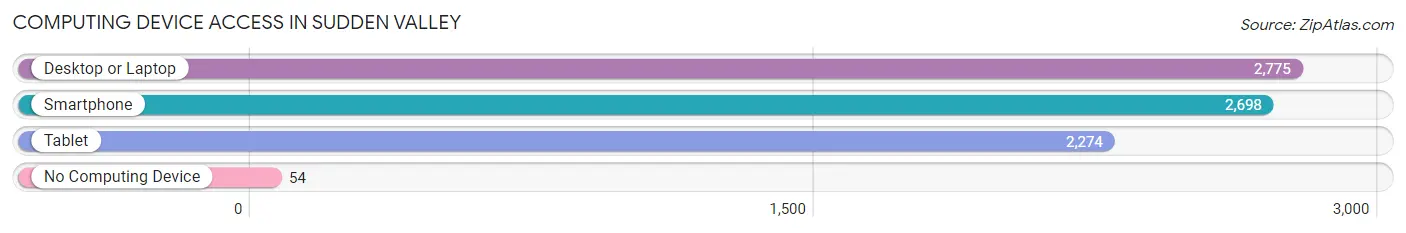
| Device Type | # Households | % Households |
| Desktop or Laptop | 2,775 | 95.2% |
| Smartphone | 2,698 | 92.6% |
| Tablet | 2,274 | 78.0% |
| No Computing Device | 54 | 1.8% |
| Total | 2,914 | 100.0% |
Internet Access in Sudden Valley
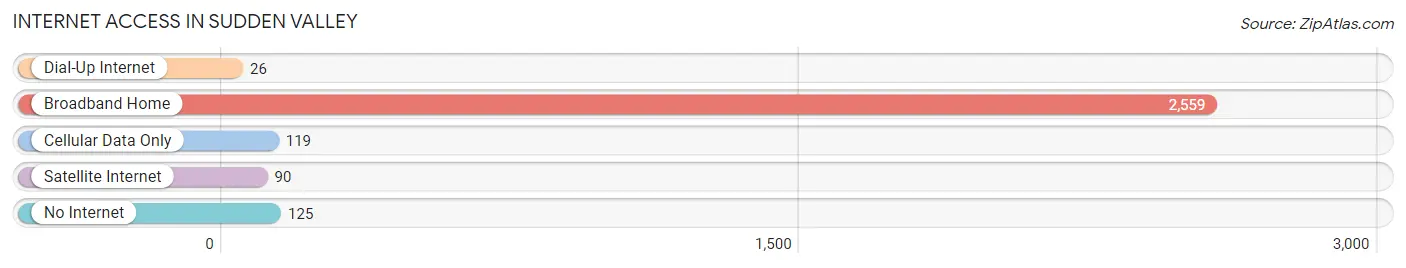
| Internet Type | # Households | % Households |
| Dial-Up Internet | 26 | 0.9% |
| Broadband Home | 2,559 | 87.8% |
| Cellular Data Only | 119 | 4.1% |
| Satellite Internet | 90 | 3.1% |
| No Internet | 125 | 4.3% |
| Total | 2,914 | 100.0% |
Sudden Valley Summary
Sudden Valley is a census-designated place (CDP) located in Whatcom County, Washington, United States. It is situated in the foothills of the Cascade Mountains, approximately 10 miles east of Bellingham. The population was 8,845 at the 2010 census.
History
Sudden Valley was originally developed in the late 1960s as a planned community. The development was the brainchild of local real estate developer, Robert E. Lee, who envisioned a self-contained community with its own amenities and services. The development was named after the nearby Sudden Valley Creek.
The first phase of the development was completed in 1969 and included the construction of a golf course, marina, and a shopping center. The development was designed to be a self-contained community with its own schools, parks, and recreational facilities.
In the early 1970s, the development was expanded to include additional housing, a community center, and a swimming pool. The development was also connected to the nearby city of Bellingham by a bridge over Lake Whatcom.
Geography
Sudden Valley is located in the foothills of the Cascade Mountains, approximately 10 miles east of Bellingham. The CDP has a total area of 4.3 square miles, all of which is land.
The terrain of Sudden Valley is mostly hilly, with elevations ranging from sea level to 1,000 feet. The area is heavily forested, with Douglas fir, western hemlock, and western red cedar being the dominant tree species.
Economy
The economy of Sudden Valley is largely based on tourism and recreation. The area is home to a number of recreational facilities, including a golf course, marina, and a shopping center. The area also has a number of restaurants and bars.
The area is also home to a number of small businesses, including a grocery store, hardware store, and a gas station. The area also has a number of professional services, such as doctors, lawyers, and accountants.
Demographics
As of the 2010 census, there were 8,845 people, 3,717 households, and 2,541 families residing in the CDP. The population density was 2,053.3 people per square mile. The racial makeup of the CDP was 91.2% White, 1.2% African American, 0.7% Native American, 2.2% Asian, 0.2% Pacific Islander, 1.7% from other races, and 3.0% from two or more races. Hispanic or Latino of any race were 5.2% of the population.
The median income for a household in the CDP was $50,902, and the median income for a family was $60,902. Males had a median income of $45,902 versus $31,902 for females. The per capita income for the CDP was $25,902. About 4.2% of families and 6.2% of the population were below the poverty line, including 8.2% of those under age 18 and 4.2% of those age 65 or over.
Common Questions
What is Per Capita Income in Sudden Valley?
Per Capita income in Sudden Valley is $44,861.
What is the Median Family Income in Sudden Valley?
Median Family Income in Sudden Valley is $113,302.
What is the Median Household income in Sudden Valley?
Median Household Income in Sudden Valley is $96,102.
What is Income or Wage Gap in Sudden Valley?
Income or Wage Gap in Sudden Valley is 24.9%.
Women in Sudden Valley earn 75.1 cents for every dollar earned by a man.
What is Inequality or Gini Index in Sudden Valley?
Inequality or Gini Index in Sudden Valley is 0.31.
What is the Total Population of Sudden Valley?
Total Population of Sudden Valley is 7,103.
What is the Total Male Population of Sudden Valley?
Total Male Population of Sudden Valley is 3,401.
What is the Total Female Population of Sudden Valley?
Total Female Population of Sudden Valley is 3,702.
What is the Ratio of Males per 100 Females in Sudden Valley?
There are 91.87 Males per 100 Females in Sudden Valley.
What is the Ratio of Females per 100 Males in Sudden Valley?
There are 108.85 Females per 100 Males in Sudden Valley.
What is the Median Population Age in Sudden Valley?
Median Population Age in Sudden Valley is 44.0 Years.
What is the Average Family Size in Sudden Valley
Average Family Size in Sudden Valley is 2.7 People.
What is the Average Household Size in Sudden Valley
Average Household Size in Sudden Valley is 2.4 People.
How Large is the Labor Force in Sudden Valley?
There are 3,381 People in the Labor Forcein in Sudden Valley.
What is the Percentage of People in the Labor Force in Sudden Valley?
58.8% of People are in the Labor Force in Sudden Valley.
What is the Unemployment Rate in Sudden Valley?
Unemployment Rate in Sudden Valley is 3.6%.