Union Gap, WA Map & Demographics
Union Gap Map
Union Gap Overview
$21,667
PER CAPITA INCOME
$58,681
AVG FAMILY INCOME
$55,667
AVG HOUSEHOLD INCOME
19.4%
WAGE / INCOME GAP [ % ]
80.6¢/ $1
WAGE / INCOME GAP [ $ ]
0.42
INEQUALITY / GINI INDEX
6,512
TOTAL POPULATION
3,254
MALE POPULATION
3,258
FEMALE POPULATION
99.88
MALES / 100 FEMALES
100.12
FEMALES / 100 MALES
31.4
MEDIAN AGE
3.6
AVG FAMILY SIZE
3.1
AVG HOUSEHOLD SIZE
3,039
LABOR FORCE [ PEOPLE ]
61.6%
PERCENT IN LABOR FORCE
11.3%
UNEMPLOYMENT RATE
Union Gap Area Codes
Income in Union Gap
Income Overview in Union Gap
Per Capita Income in Union Gap is $21,667, while median incomes of families and households are $58,681 and $55,667 respectively.
| Characteristic | Number | Measure |
| Per Capita Income | 6,512 | $21,667 |
| Median Family Income | 1,522 | $58,681 |
| Mean Family Income | 1,522 | $63,959 |
| Median Household Income | 2,058 | $55,667 |
| Mean Household Income | 2,058 | $66,425 |
| Income Deficit | 1,522 | $0 |
| Wage / Income Gap (%) | 6,512 | 19.40% |
| Wage / Income Gap ($) | 6,512 | 80.60¢ per $1 |
| Gini / Inequality Index | 6,512 | 0.42 |
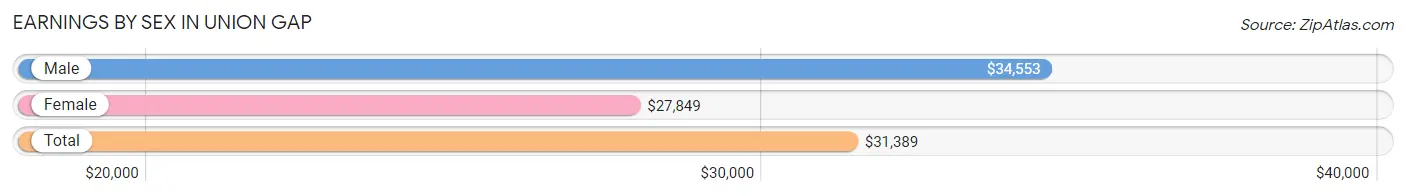
Earnings by Sex in Union Gap
Average Earnings in Union Gap are $31,389, $34,553 for men and $27,849 for women, a difference of 19.4%.
| Sex | Number | Average Earnings |
| Male | 1,678 (53.6%) | $34,553 |
| Female | 1,455 (46.4%) | $27,849 |
| Total | 3,133 (100.0%) | $31,389 |
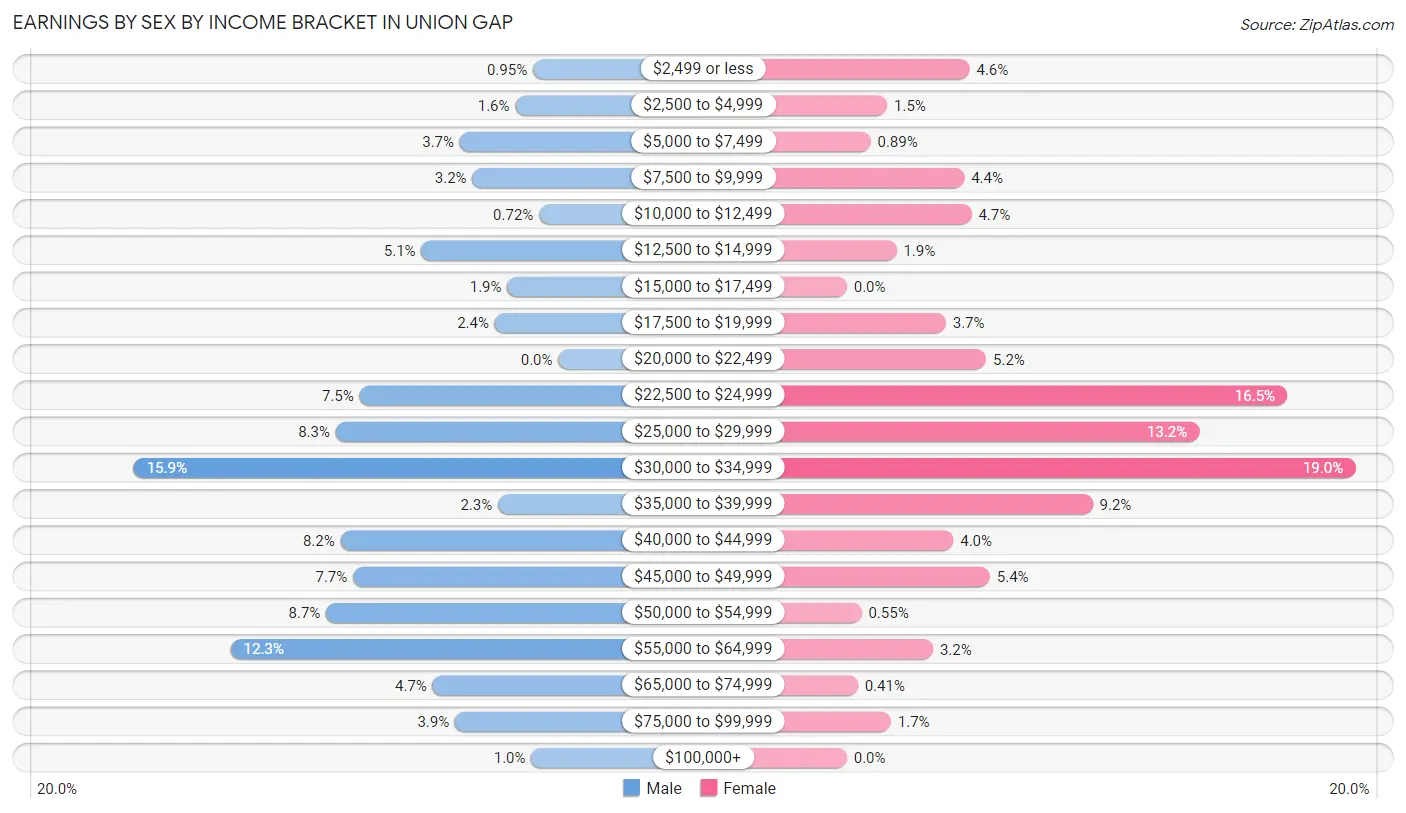
Earnings by Sex by Income Bracket in Union Gap
The most common earnings brackets in Union Gap are $30,000 to $34,999 for men (267 | 15.9%) and $30,000 to $34,999 for women (277 | 19.0%).
| Income | Male | Female |
| $2,499 or less | 16 (0.9%) | 67 (4.6%) |
| $2,500 to $4,999 | 27 (1.6%) | 22 (1.5%) |
| $5,000 to $7,499 | 62 (3.7%) | 13 (0.9%) |
| $7,500 to $9,999 | 54 (3.2%) | 64 (4.4%) |
| $10,000 to $12,499 | 12 (0.7%) | 68 (4.7%) |
| $12,500 to $14,999 | 86 (5.1%) | 27 (1.9%) |
| $15,000 to $17,499 | 32 (1.9%) | 0 (0.0%) |
| $17,500 to $19,999 | 40 (2.4%) | 54 (3.7%) |
| $20,000 to $22,499 | 0 (0.0%) | 76 (5.2%) |
| $22,500 to $24,999 | 125 (7.4%) | 240 (16.5%) |
| $25,000 to $29,999 | 140 (8.3%) | 192 (13.2%) |
| $30,000 to $34,999 | 267 (15.9%) | 277 (19.0%) |
| $35,000 to $39,999 | 38 (2.3%) | 134 (9.2%) |
| $40,000 to $44,999 | 137 (8.2%) | 58 (4.0%) |
| $45,000 to $49,999 | 129 (7.7%) | 78 (5.4%) |
| $50,000 to $54,999 | 146 (8.7%) | 8 (0.5%) |
| $55,000 to $64,999 | 206 (12.3%) | 47 (3.2%) |
| $65,000 to $74,999 | 79 (4.7%) | 6 (0.4%) |
| $75,000 to $99,999 | 65 (3.9%) | 24 (1.7%) |
| $100,000+ | 17 (1.0%) | 0 (0.0%) |
| Total | 1,678 (100.0%) | 1,455 (100.0%) |
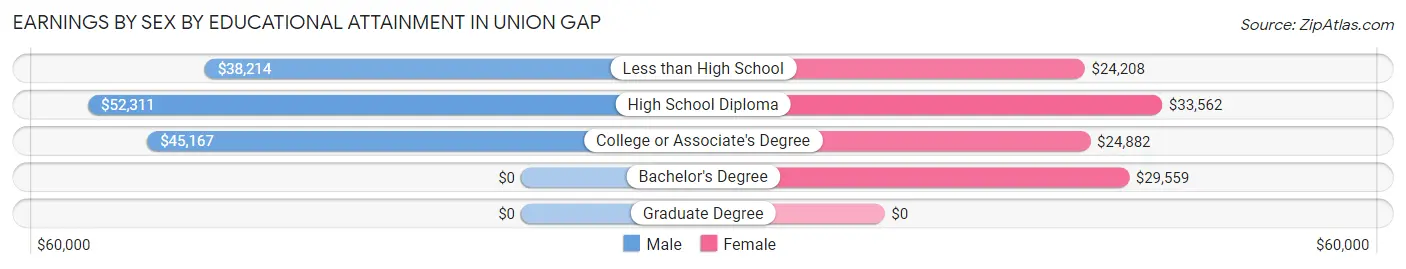
Earnings by Sex by Educational Attainment in Union Gap
Average earnings in Union Gap are $44,225 for men and $28,851 for women, a difference of 34.8%. Men with an educational attainment of high school diploma enjoy the highest average annual earnings of $52,311, while those with less than high school education earn the least with $38,214. Women with an educational attainment of high school diploma earn the most with the average annual earnings of $33,562, while those with less than high school education have the smallest earnings of $24,208.
| Educational Attainment | Male Income | Female Income |
| Less than High School | $38,214 | $24,208 |
| High School Diploma | $52,311 | $33,562 |
| College or Associate's Degree | $45,167 | $24,882 |
| Bachelor's Degree | - | - |
| Graduate Degree | - | - |
| Total | $44,225 | $28,851 |
Family Income in Union Gap
Family Income Brackets in Union Gap
According to the Union Gap family income data, there are 327 families falling into the $50,000 to $74,999 income range, which is the most common income bracket and makes up 21.5% of all families. Conversely, the $200,000+ income bracket is the least frequent group with only 6 families (0.4%) belonging to this category.
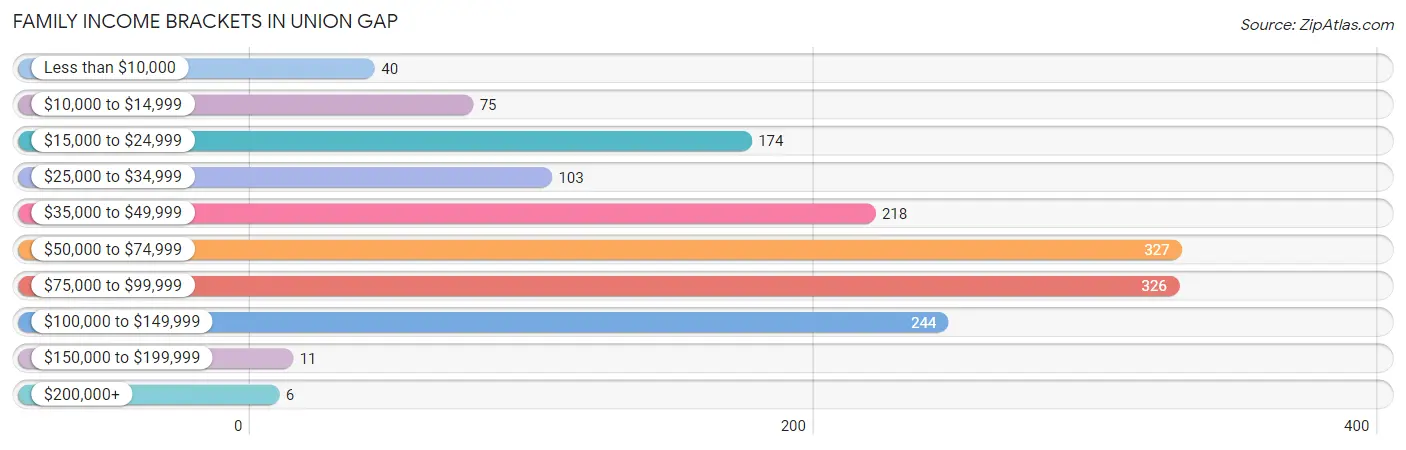
| Income Bracket | # Families | % Families |
| Less than $10,000 | 40 | 2.6% |
| $10,000 to $14,999 | 75 | 4.9% |
| $15,000 to $24,999 | 174 | 11.4% |
| $25,000 to $34,999 | 103 | 6.8% |
| $35,000 to $49,999 | 218 | 14.3% |
| $50,000 to $74,999 | 327 | 21.5% |
| $75,000 to $99,999 | 326 | 21.4% |
| $100,000 to $149,999 | 244 | 16.0% |
| $150,000 to $199,999 | 11 | 0.7% |
| $200,000+ | 6 | 0.4% |
Family Income by Famaliy Size in Union Gap
6-person families (71 | 4.7%) account for the highest median family income in Union Gap with $85,651 per family, while 3-person families (342 | 22.5%) have the highest median income of $24,375 per family member.
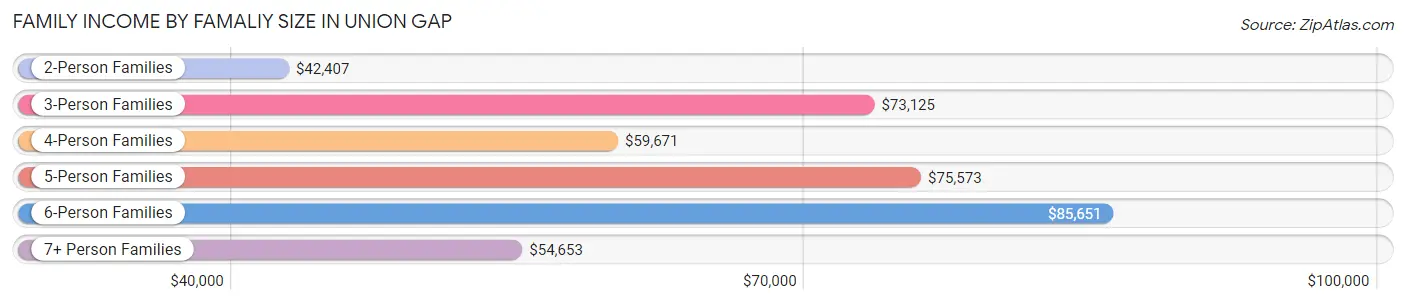
| Income Bracket | # Families | Median Income |
| 2-Person Families | 534 (35.1%) | $42,407 |
| 3-Person Families | 342 (22.5%) | $73,125 |
| 4-Person Families | 319 (21.0%) | $59,671 |
| 5-Person Families | 185 (12.2%) | $75,573 |
| 6-Person Families | 71 (4.7%) | $85,651 |
| 7+ Person Families | 71 (4.7%) | $54,653 |
| Total | 1,522 (100.0%) | $58,681 |
Family Income by Number of Earners in Union Gap
The median family income in Union Gap is $58,681, with families comprising 3+ earners (398) having the highest median family income of $93,992, while families with no earners (175) have the lowest median family income of $22,048, accounting for 26.2% and 11.5% of families, respectively.
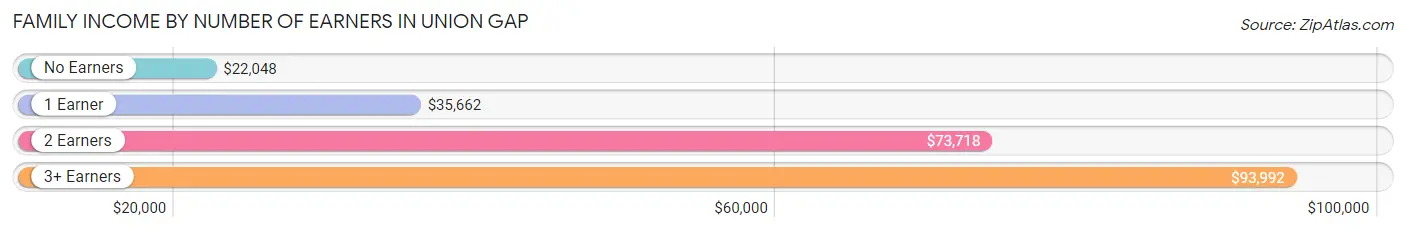
| Number of Earners | # Families | Median Income |
| No Earners | 175 (11.5%) | $22,048 |
| 1 Earner | 549 (36.1%) | $35,662 |
| 2 Earners | 400 (26.3%) | $73,718 |
| 3+ Earners | 398 (26.2%) | $93,992 |
| Total | 1,522 (100.0%) | $58,681 |
Household Income in Union Gap
Household Income Brackets in Union Gap
With 424 households falling in the category, the $50,000 to $74,999 income range is the most frequent in Union Gap, accounting for 20.6% of all households. In contrast, only 19 households (0.9%) fall into the $200,000+ income bracket, making it the least populous group.
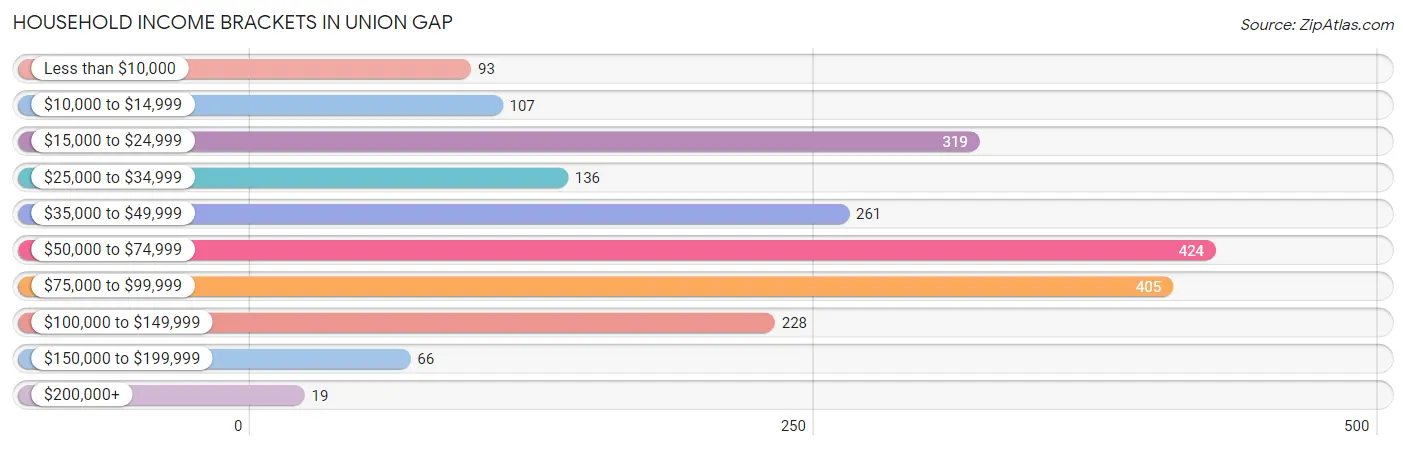
| Income Bracket | # Households | % Households |
| Less than $10,000 | 93 | 4.5% |
| $10,000 to $14,999 | 107 | 5.2% |
| $15,000 to $24,999 | 319 | 15.5% |
| $25,000 to $34,999 | 136 | 6.6% |
| $35,000 to $49,999 | 261 | 12.7% |
| $50,000 to $74,999 | 424 | 20.6% |
| $75,000 to $99,999 | 405 | 19.7% |
| $100,000 to $149,999 | 228 | 11.1% |
| $150,000 to $199,999 | 66 | 3.2% |
| $200,000+ | 19 | 0.9% |
Household Income by Householder Age in Union Gap
The median household income in Union Gap is $55,667, with the highest median household income of $74,387 found in the 45 to 64 years age bracket for the primary householder. A total of 817 households (39.7%) fall into this category. Meanwhile, the 15 to 24 years age bracket for the primary householder has the lowest median household income of $28,625, with 167 households (8.1%) in this group.
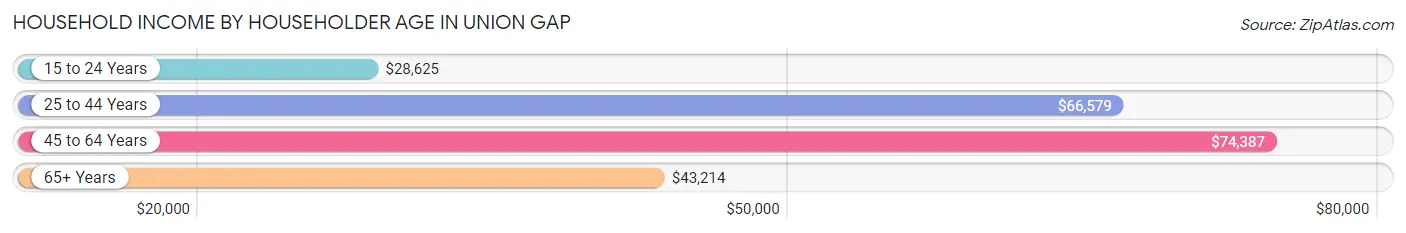
| Income Bracket | # Households | Median Income |
| 15 to 24 Years | 167 (8.1%) | $28,625 |
| 25 to 44 Years | 606 (29.4%) | $66,579 |
| 45 to 64 Years | 817 (39.7%) | $74,387 |
| 65+ Years | 468 (22.7%) | $43,214 |
| Total | 2,058 (100.0%) | $55,667 |
Poverty in Union Gap
Income Below Poverty by Sex and Age in Union Gap
With 18.0% poverty level for males and 19.2% for females among the residents of Union Gap, under 5 year old males and 5 year old females are the most vulnerable to poverty, with 118 males (36.0%) and 54 females (62.1%) in their respective age groups living below the poverty level.
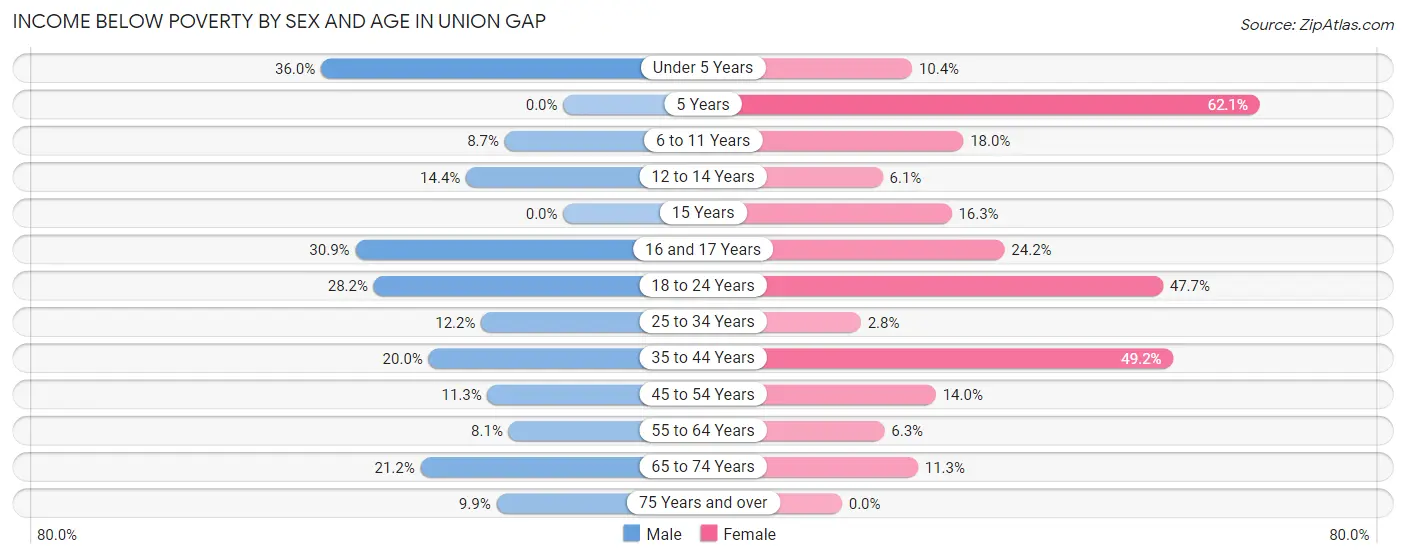
| Age Bracket | Male | Female |
| Under 5 Years | 118 (36.0%) | 25 (10.4%) |
| 5 Years | 0 (0.0%) | 54 (62.1%) |
| 6 to 11 Years | 24 (8.7%) | 55 (18.0%) |
| 12 to 14 Years | 14 (14.4%) | 4 (6.1%) |
| 15 Years | 0 (0.0%) | 14 (16.3%) |
| 16 and 17 Years | 21 (30.9%) | 50 (24.1%) |
| 18 to 24 Years | 152 (28.1%) | 133 (47.7%) |
| 25 to 34 Years | 43 (12.2%) | 15 (2.8%) |
| 35 to 44 Years | 100 (20.0%) | 161 (49.2%) |
| 45 to 54 Years | 25 (11.3%) | 60 (14.0%) |
| 55 to 64 Years | 39 (8.1%) | 17 (6.3%) |
| 65 to 74 Years | 28 (21.2%) | 29 (11.3%) |
| 75 Years and over | 14 (9.9%) | 0 (0.0%) |
| Total | 578 (18.0%) | 617 (19.2%) |
Income Above Poverty by Sex and Age in Union Gap
According to the poverty statistics in Union Gap, males aged 5 years and females aged 75 years and over are the age groups that are most secure financially, with 100.0% of males and 100.0% of females in these age groups living above the poverty line.
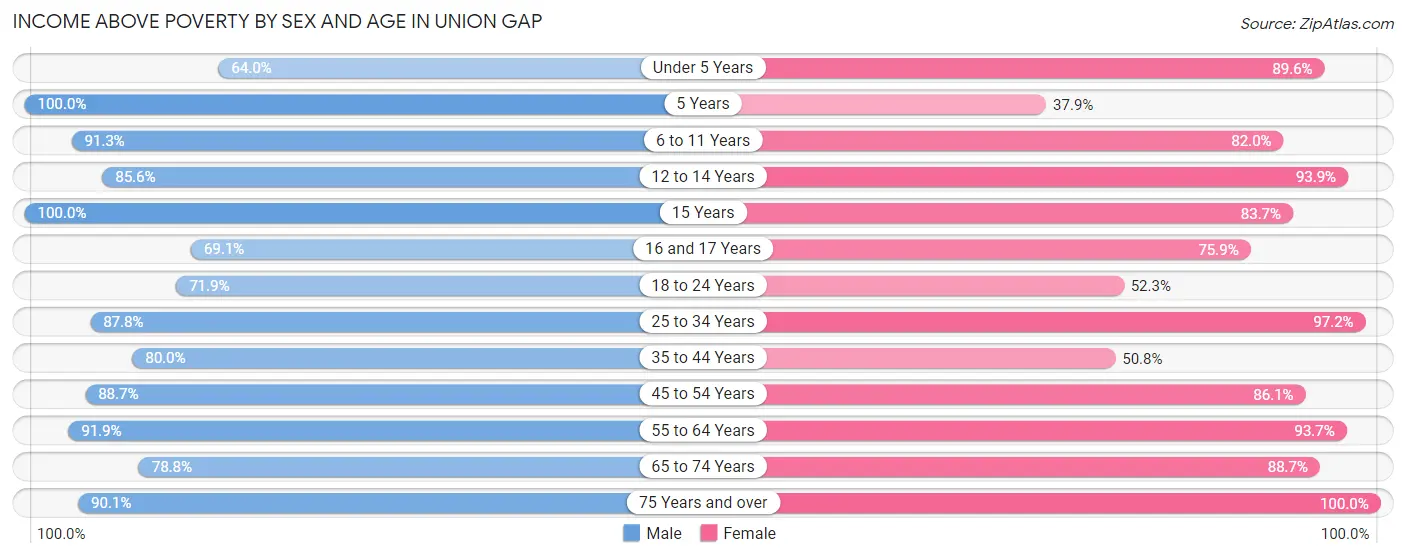
| Age Bracket | Male | Female |
| Under 5 Years | 210 (64.0%) | 215 (89.6%) |
| 5 Years | 24 (100.0%) | 33 (37.9%) |
| 6 to 11 Years | 252 (91.3%) | 250 (82.0%) |
| 12 to 14 Years | 83 (85.6%) | 62 (93.9%) |
| 15 Years | 41 (100.0%) | 72 (83.7%) |
| 16 and 17 Years | 47 (69.1%) | 157 (75.8%) |
| 18 to 24 Years | 388 (71.9%) | 146 (52.3%) |
| 25 to 34 Years | 310 (87.8%) | 519 (97.2%) |
| 35 to 44 Years | 400 (80.0%) | 166 (50.8%) |
| 45 to 54 Years | 197 (88.7%) | 370 (86.1%) |
| 55 to 64 Years | 442 (91.9%) | 252 (93.7%) |
| 65 to 74 Years | 104 (78.8%) | 228 (88.7%) |
| 75 Years and over | 127 (90.1%) | 122 (100.0%) |
| Total | 2,625 (82.0%) | 2,592 (80.8%) |
Income Below Poverty Among Married-Couple Families in Union Gap
The poverty statistics for married-couple families in Union Gap show that 9.0% or 88 of the total 975 families live below the poverty line. Families with 1 or 2 children have the highest poverty rate of 10.6%, comprising of 42 families. On the other hand, families with 3 or 4 children have the lowest poverty rate of 0.0%, which includes 0 families.
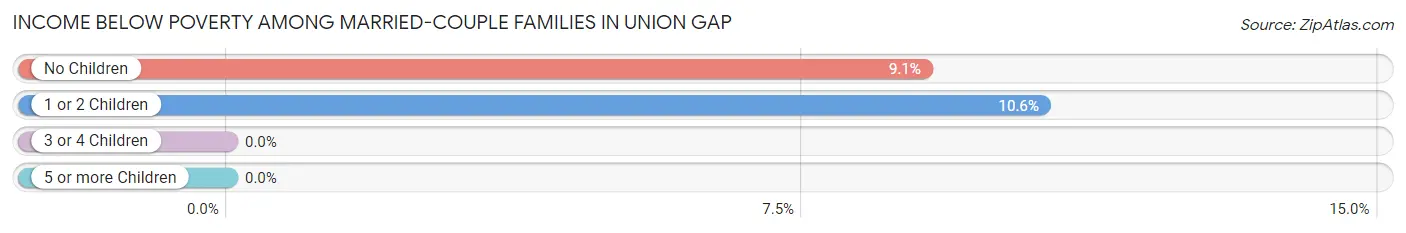
| Children | Above Poverty | Below Poverty |
| No Children | 461 (90.9%) | 46 (9.1%) |
| 1 or 2 Children | 354 (89.4%) | 42 (10.6%) |
| 3 or 4 Children | 44 (100.0%) | 0 (0.0%) |
| 5 or more Children | 28 (100.0%) | 0 (0.0%) |
| Total | 887 (91.0%) | 88 (9.0%) |
Income Below Poverty Among Single-Parent Households in Union Gap
According to the poverty data in Union Gap, 21.6% or 69 single-father households and 24.2% or 55 single-mother households are living below the poverty line. Among single-father households, those with 3 or 4 children have the highest poverty rate, with 52 households (59.8%) experiencing poverty. Likewise, among single-mother households, those with 3 or 4 children have the highest poverty rate, with 32 households (57.1%) falling below the poverty line.
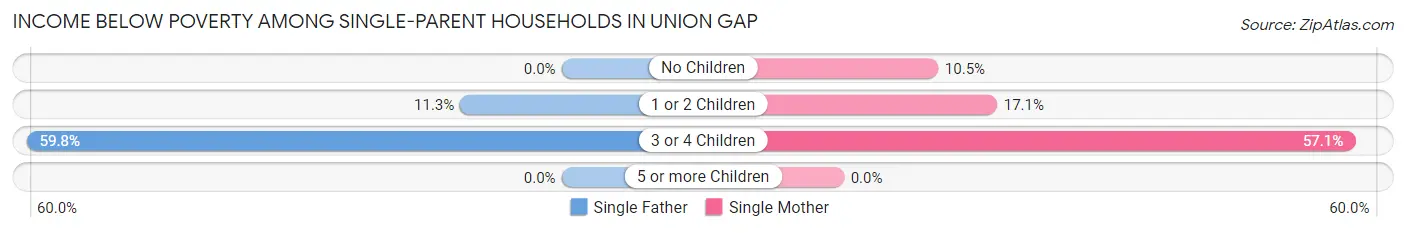
| Children | Single Father | Single Mother |
| No Children | 0 (0.0%) | 10 (10.5%) |
| 1 or 2 Children | 17 (11.3%) | 13 (17.1%) |
| 3 or 4 Children | 52 (59.8%) | 32 (57.1%) |
| 5 or more Children | 0 (0.0%) | 0 (0.0%) |
| Total | 69 (21.6%) | 55 (24.2%) |
Income Below Poverty Among Married-Couple vs Single-Parent Households in Union Gap
The poverty data for Union Gap shows that 88 of the married-couple family households (9.0%) and 124 of the single-parent households (22.7%) are living below the poverty level. Within the married-couple family households, those with 1 or 2 children have the highest poverty rate, with 42 households (10.6%) falling below the poverty line. Among the single-parent households, those with 3 or 4 children have the highest poverty rate, with 84 household (58.7%) living below poverty.

| Children | Married-Couple Families | Single-Parent Households |
| No Children | 46 (9.1%) | 10 (5.6%) |
| 1 or 2 Children | 42 (10.6%) | 30 (13.3%) |
| 3 or 4 Children | 0 (0.0%) | 84 (58.7%) |
| 5 or more Children | 0 (0.0%) | 0 (0.0%) |
| Total | 88 (9.0%) | 124 (22.7%) |
Race in Union Gap
The most populous races in Union Gap are White / Caucasian (3,642 | 55.9%), Hispanic or Latino (3,291 | 50.5%), and Some other Race (1,366 | 21.0%).
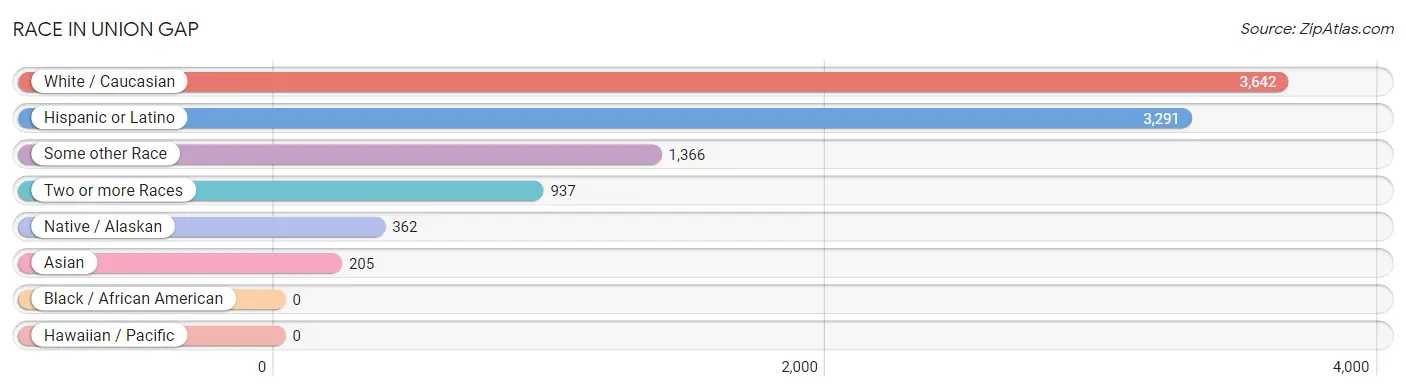
| Race | # Population | % Population |
| Asian | 205 | 3.2% |
| Black / African American | 0 | 0.0% |
| Hawaiian / Pacific | 0 | 0.0% |
| Hispanic or Latino | 3,291 | 50.5% |
| Native / Alaskan | 362 | 5.6% |
| White / Caucasian | 3,642 | 55.9% |
| Two or more Races | 937 | 14.4% |
| Some other Race | 1,366 | 21.0% |
| Total | 6,512 | 100.0% |
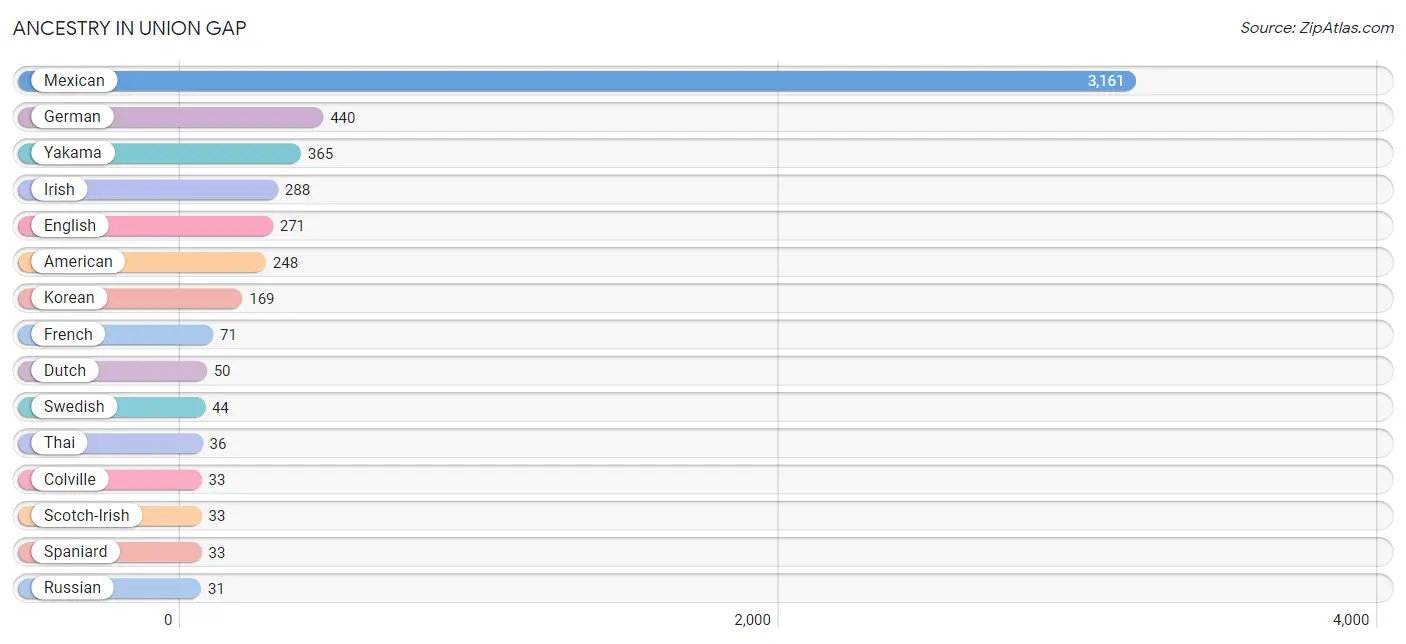
Ancestry in Union Gap
The most populous ancestries reported in Union Gap are Mexican (3,161 | 48.5%), German (440 | 6.8%), Yakama (365 | 5.6%), Irish (288 | 4.4%), and English (271 | 4.2%), together accounting for 69.5% of all Union Gap residents.
| Ancestry | # Population | % Population |
| American | 248 | 3.8% |
| Blackfeet | 2 | 0.0% |
| British | 6 | 0.1% |
| Canadian | 12 | 0.2% |
| Cherokee | 17 | 0.3% |
| Colville | 33 | 0.5% |
| Danish | 18 | 0.3% |
| Dutch | 50 | 0.8% |
| English | 271 | 4.2% |
| European | 26 | 0.4% |
| Finnish | 26 | 0.4% |
| French | 71 | 1.1% |
| German | 440 | 6.8% |
| Greek | 2 | 0.0% |
| Irish | 288 | 4.4% |
| Italian | 19 | 0.3% |
| Japanese | 10 | 0.2% |
| Korean | 169 | 2.6% |
| Mexican | 3,161 | 48.5% |
| Navajo | 2 | 0.0% |
| Northern European | 6 | 0.1% |
| Norwegian | 9 | 0.1% |
| Russian | 31 | 0.5% |
| Scandinavian | 20 | 0.3% |
| Scotch-Irish | 33 | 0.5% |
| Scottish | 26 | 0.4% |
| Spaniard | 33 | 0.5% |
| Swedish | 44 | 0.7% |
| Thai | 36 | 0.5% |
| Welsh | 7 | 0.1% |
| Yakama | 365 | 5.6% | View All 31 Rows |
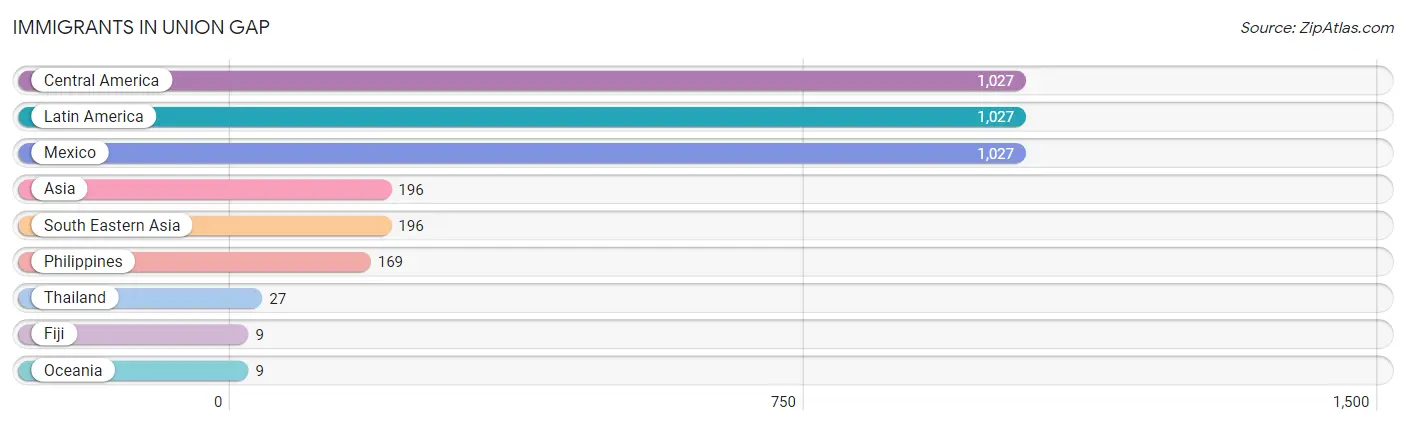
Immigrants in Union Gap
The most numerous immigrant groups reported in Union Gap came from Central America (1,027 | 15.8%), Latin America (1,027 | 15.8%), Mexico (1,027 | 15.8%), Asia (196 | 3.0%), and South Eastern Asia (196 | 3.0%), together accounting for 53.3% of all Union Gap residents.
| Immigration Origin | # Population | % Population |
| Asia | 196 | 3.0% |
| Central America | 1,027 | 15.8% |
| Fiji | 9 | 0.1% |
| Latin America | 1,027 | 15.8% |
| Mexico | 1,027 | 15.8% |
| Oceania | 9 | 0.1% |
| Philippines | 169 | 2.6% |
| South Eastern Asia | 196 | 3.0% |
| Thailand | 27 | 0.4% | View All 9 Rows |
Sex and Age in Union Gap
Sex and Age in Union Gap
The most populous age groups in Union Gap are 20 to 24 Years (348 | 10.7%) for men and 15 to 19 Years (461 | 14.1%) for women.
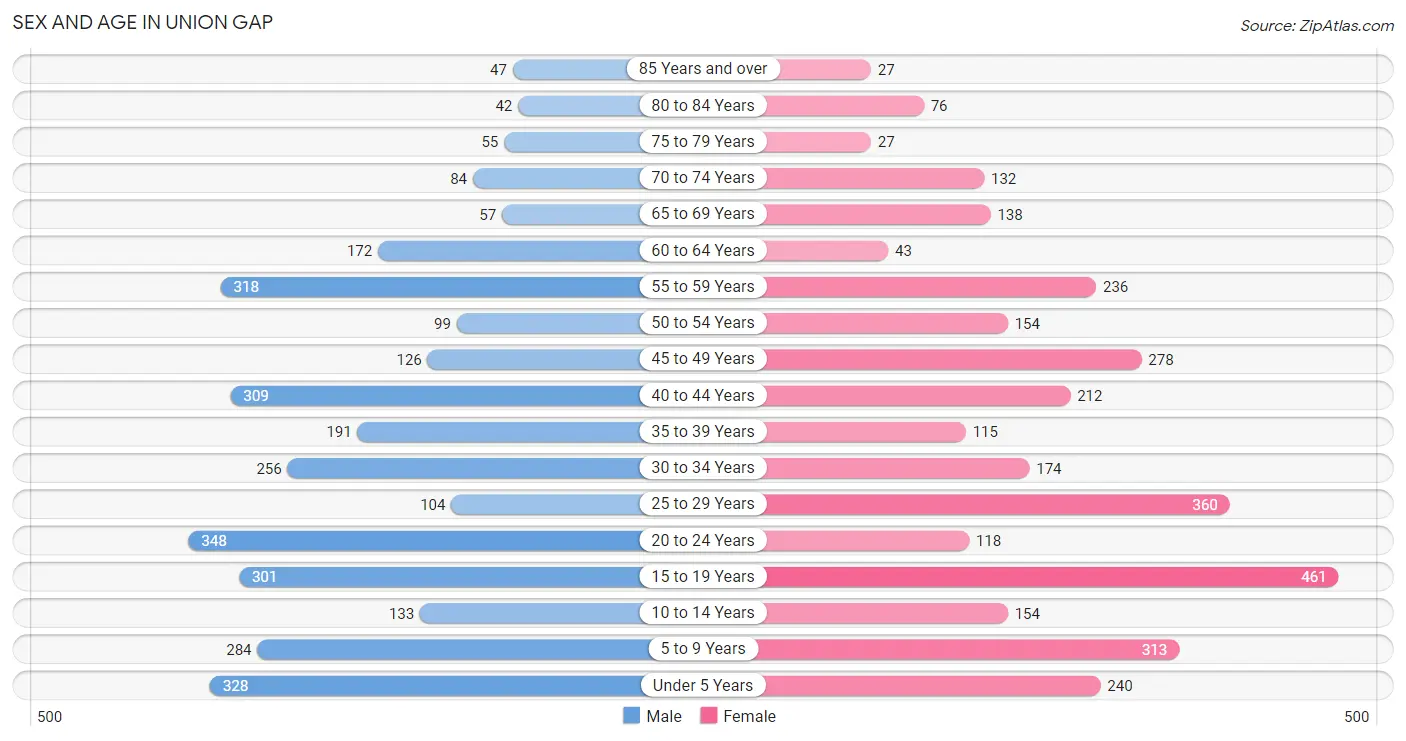
| Age Bracket | Male | Female |
| Under 5 Years | 328 (10.1%) | 240 (7.4%) |
| 5 to 9 Years | 284 (8.7%) | 313 (9.6%) |
| 10 to 14 Years | 133 (4.1%) | 154 (4.7%) |
| 15 to 19 Years | 301 (9.2%) | 461 (14.1%) |
| 20 to 24 Years | 348 (10.7%) | 118 (3.6%) |
| 25 to 29 Years | 104 (3.2%) | 360 (11.1%) |
| 30 to 34 Years | 256 (7.9%) | 174 (5.3%) |
| 35 to 39 Years | 191 (5.9%) | 115 (3.5%) |
| 40 to 44 Years | 309 (9.5%) | 212 (6.5%) |
| 45 to 49 Years | 126 (3.9%) | 278 (8.5%) |
| 50 to 54 Years | 99 (3.0%) | 154 (4.7%) |
| 55 to 59 Years | 318 (9.8%) | 236 (7.2%) |
| 60 to 64 Years | 172 (5.3%) | 43 (1.3%) |
| 65 to 69 Years | 57 (1.8%) | 138 (4.2%) |
| 70 to 74 Years | 84 (2.6%) | 132 (4.1%) |
| 75 to 79 Years | 55 (1.7%) | 27 (0.8%) |
| 80 to 84 Years | 42 (1.3%) | 76 (2.3%) |
| 85 Years and over | 47 (1.4%) | 27 (0.8%) |
| Total | 3,254 (100.0%) | 3,258 (100.0%) |
Families and Households in Union Gap
Median Family Size in Union Gap
The median family size in Union Gap is 3.59 persons per family, with married-couple families (975 | 64.1%) accounting for the largest median family size of 3.69 persons per family. On the other hand, single male/father families (320 | 21.0%) represent the smallest median family size with 3.25 persons per family.
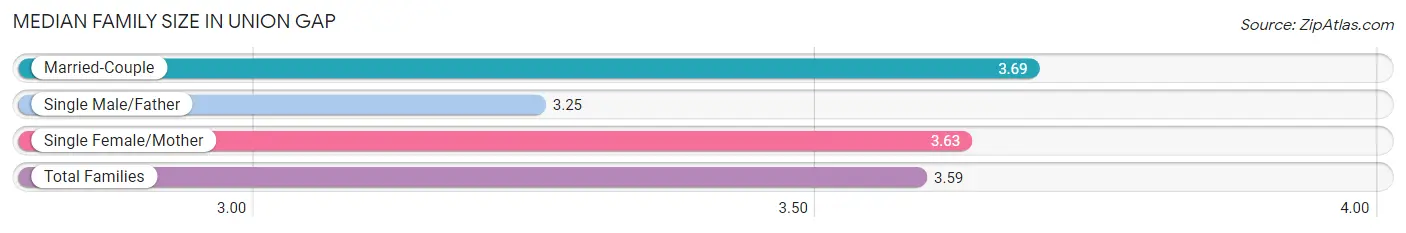
| Family Type | # Families | Family Size |
| Married-Couple | 975 (64.1%) | 3.69 |
| Single Male/Father | 320 (21.0%) | 3.25 |
| Single Female/Mother | 227 (14.9%) | 3.63 |
| Total Families | 1,522 (100.0%) | 3.59 |
Median Household Size in Union Gap
The median household size in Union Gap is 3.13 persons per household, with single female/mother households (227 | 11.0%) accounting for the largest median household size of 4.11 persons per household. non-family households (536 | 26.0%) represent the smallest median household size with 1.20 persons per household.
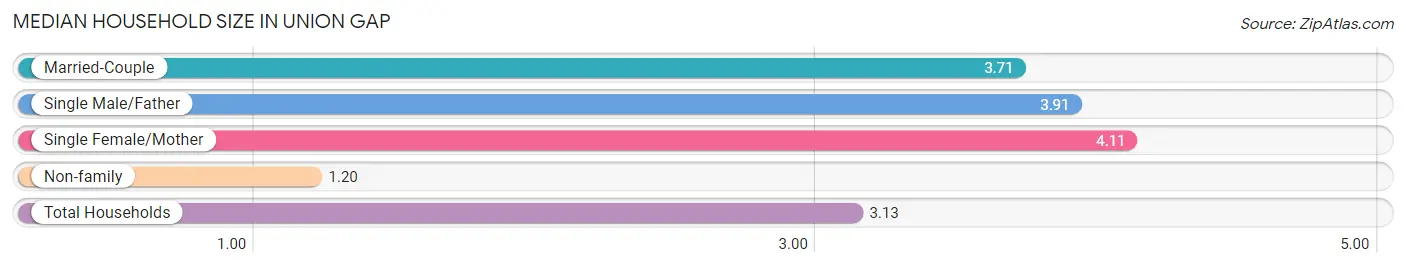
| Household Type | # Households | Household Size |
| Married-Couple | 975 (47.4%) | 3.71 |
| Single Male/Father | 320 (15.5%) | 3.91 |
| Single Female/Mother | 227 (11.0%) | 4.11 |
| Non-family | 536 (26.0%) | 1.20 |
| Total Households | 2,058 (100.0%) | 3.13 |
Household Size by Marriage Status in Union Gap
Out of a total of 2,058 households in Union Gap, 1,522 (74.0%) are family households, while 536 (26.0%) are nonfamily households. The most numerous type of family households are 2-person households, comprising 439, and the most common type of nonfamily households are 1-person households, comprising 466.
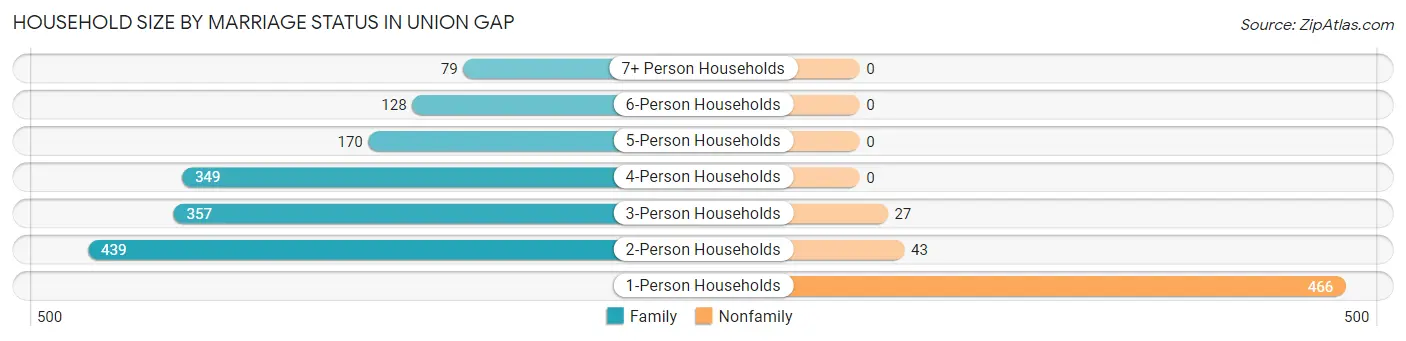
| Household Size | Family Households | Nonfamily Households |
| 1-Person Households | - | 466 (22.6%) |
| 2-Person Households | 439 (21.3%) | 43 (2.1%) |
| 3-Person Households | 357 (17.3%) | 27 (1.3%) |
| 4-Person Households | 349 (17.0%) | 0 (0.0%) |
| 5-Person Households | 170 (8.3%) | 0 (0.0%) |
| 6-Person Households | 128 (6.2%) | 0 (0.0%) |
| 7+ Person Households | 79 (3.8%) | 0 (0.0%) |
| Total | 1,522 (74.0%) | 536 (26.0%) |
Female Fertility in Union Gap
Fertility by Age in Union Gap
Average fertility rate in Union Gap is 107.0 births per 1,000 women. Women in the age bracket of 20 to 34 years have the highest fertility rate with 135.0 births per 1,000 women. Women in the age bracket of 20 to 34 years acount for 47.1% of all women with births.
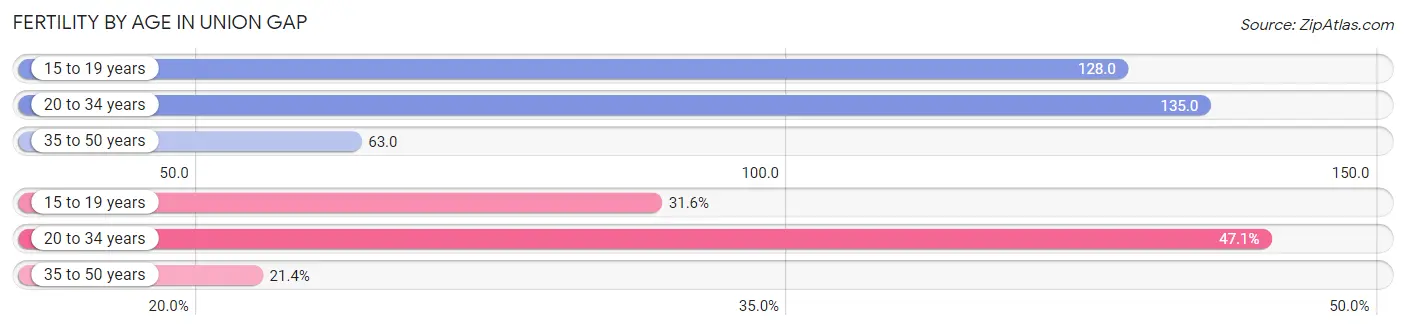
| Age Bracket | Women with Births | Births / 1,000 Women |
| 15 to 19 years | 59 (31.6%) | 128.0 |
| 20 to 34 years | 88 (47.1%) | 135.0 |
| 35 to 50 years | 40 (21.4%) | 63.0 |
| Total | 187 (100.0%) | 107.0 |
Fertility by Age by Marriage Status in Union Gap
13.9% of women with births (187) in Union Gap are married. The highest percentage of unmarried women with births falls into 15 to 19 years age bracket with 100.0% of them unmarried at the time of birth, while the lowest percentage of unmarried women with births belong to 35 to 50 years age bracket with 50.0% of them unmarried.
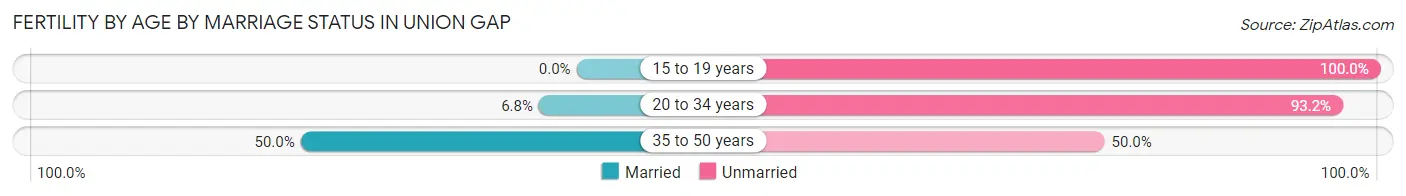
| Age Bracket | Married | Unmarried |
| 15 to 19 years | 0 (0.0%) | 59 (100.0%) |
| 20 to 34 years | 6 (6.8%) | 82 (93.2%) |
| 35 to 50 years | 20 (50.0%) | 20 (50.0%) |
| Total | 26 (13.9%) | 161 (86.1%) |
Fertility by Education in Union Gap
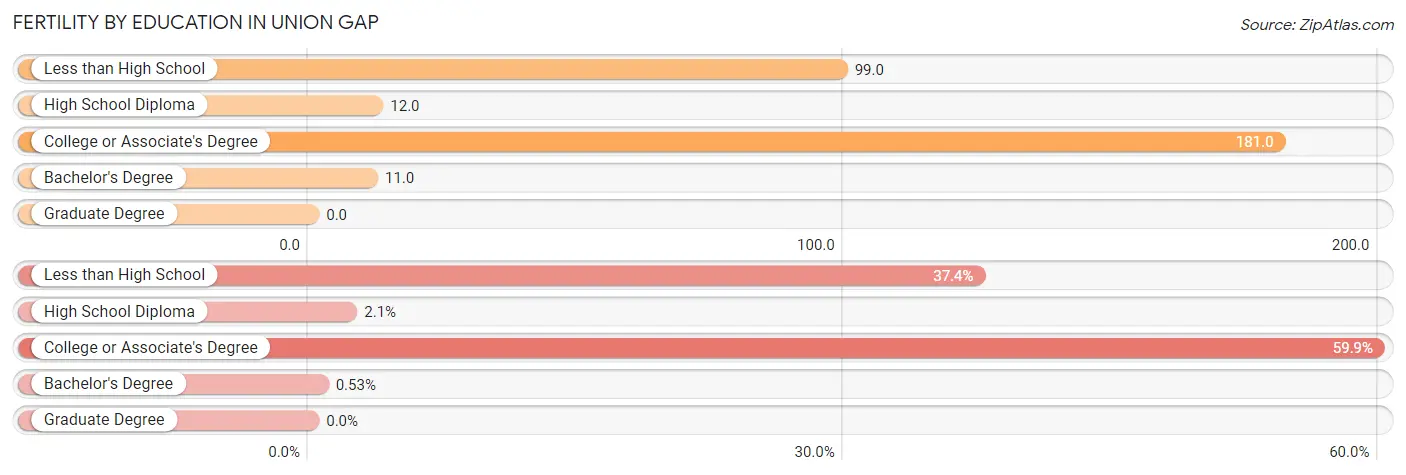
| Educational Attainment | Women with Births | Births / 1,000 Women |
| Less than High School | 70 (37.4%) | 99.0 |
| High School Diploma | 4 (2.1%) | 12.0 |
| College or Associate's Degree | 112 (59.9%) | 181.0 |
| Bachelor's Degree | 1 (0.5%) | 11.0 |
| Graduate Degree | 0 (0.0%) | 0.0 |
| Total | 187 (100.0%) | 107.0 |
Fertility by Education by Marriage Status in Union Gap
86.1% of women with births in Union Gap are unmarried. Women with the educational attainment of high school diploma are most likely to be married with 100.0% of them married at childbirth, while women with the educational attainment of bachelor's degree are least likely to be married with 100.0% of them unmarried at childbirth.
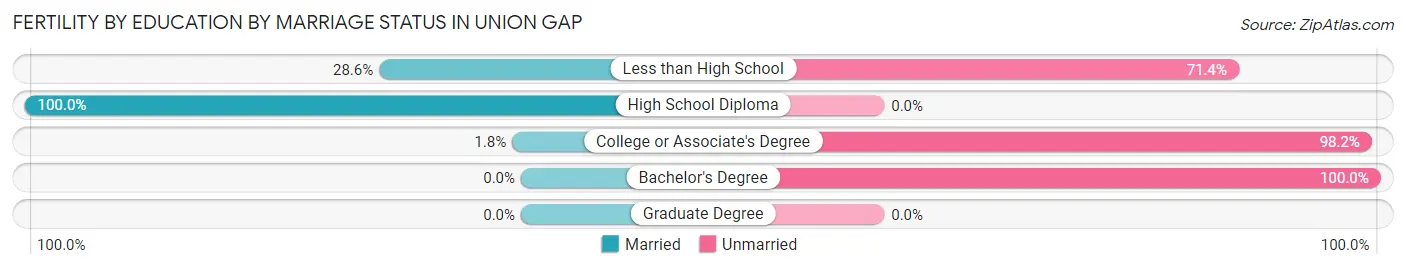
| Educational Attainment | Married | Unmarried |
| Less than High School | 20 (28.6%) | 50 (71.4%) |
| High School Diploma | 4 (100.0%) | 0 (0.0%) |
| College or Associate's Degree | 2 (1.8%) | 110 (98.2%) |
| Bachelor's Degree | 0 (0.0%) | 1 (100.0%) |
| Graduate Degree | 0 (0.0%) | 0 (0.0%) |
| Total | 26 (13.9%) | 161 (86.1%) |
Employment Characteristics in Union Gap
Employment by Class of Employer in Union Gap
Among the 2,682 employed individuals in Union Gap, private company employees (1,991 | 74.2%), local government employees (261 | 9.7%), and self-employed (not incorporated) (249 | 9.3%) make up the most common classes of employment.
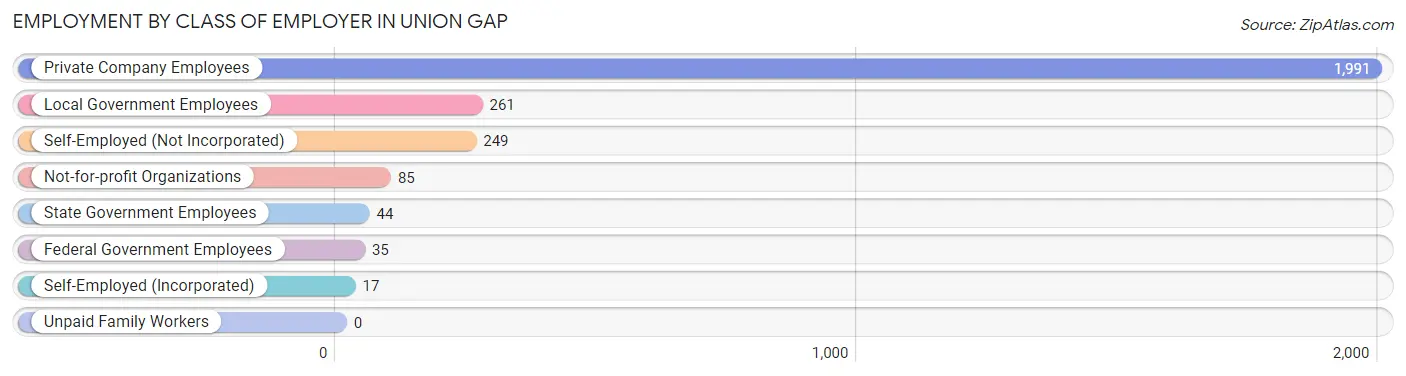
| Employer Class | # Employees | % Employees |
| Private Company Employees | 1,991 | 74.2% |
| Self-Employed (Incorporated) | 17 | 0.6% |
| Self-Employed (Not Incorporated) | 249 | 9.3% |
| Not-for-profit Organizations | 85 | 3.2% |
| Local Government Employees | 261 | 9.7% |
| State Government Employees | 44 | 1.6% |
| Federal Government Employees | 35 | 1.3% |
| Unpaid Family Workers | 0 | 0.0% |
| Total | 2,682 | 100.0% |
Employment Status by Age in Union Gap
According to the labor force statistics for Union Gap, out of the total population over 16 years of age (4,933), 61.6% or 3,039 individuals are in the labor force, with 11.3% or 343 of them unemployed. The age group with the highest labor force participation rate is 25 to 29 years, with 89.7% or 416 individuals in the labor force. Within the labor force, the 16 to 19 years age range has the highest percentage of unemployed individuals, with 44.7% or 114 of them being unemployed.
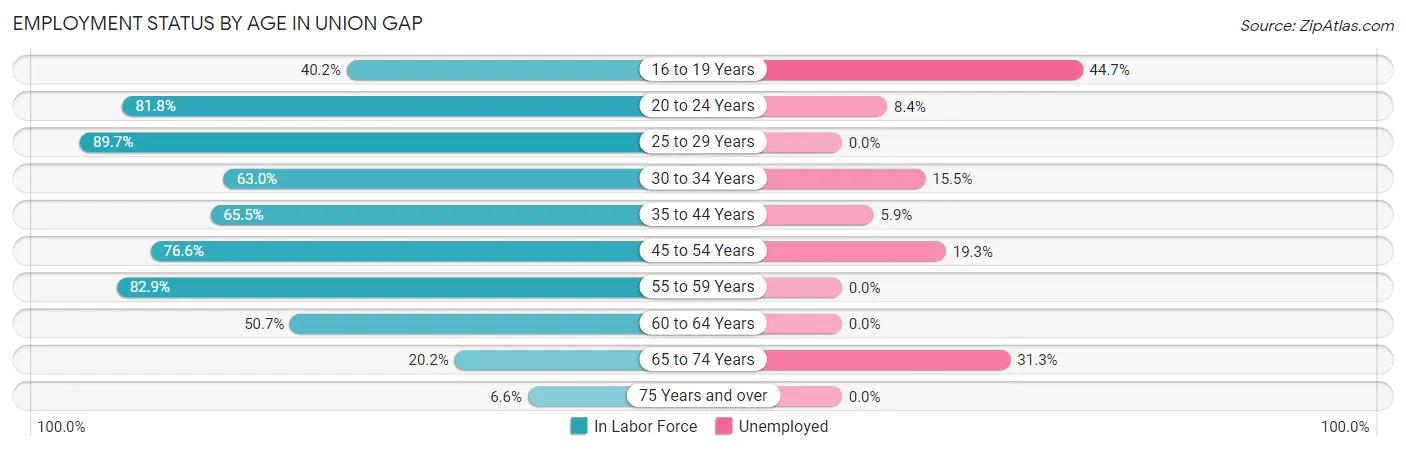
| Age Bracket | In Labor Force | Unemployed |
| 16 to 19 Years | 255 (40.2%) | 114 (44.7%) |
| 20 to 24 Years | 381 (81.8%) | 32 (8.4%) |
| 25 to 29 Years | 416 (89.7%) | 0 (0.0%) |
| 30 to 34 Years | 271 (63.0%) | 42 (15.5%) |
| 35 to 44 Years | 542 (65.5%) | 32 (5.9%) |
| 45 to 54 Years | 503 (76.6%) | 97 (19.3%) |
| 55 to 59 Years | 459 (82.9%) | 0 (0.0%) |
| 60 to 64 Years | 109 (50.7%) | 0 (0.0%) |
| 65 to 74 Years | 83 (20.2%) | 26 (31.3%) |
| 75 Years and over | 18 (6.6%) | 0 (0.0%) |
| Total | 3,039 (61.6%) | 343 (11.3%) |
Employment Status by Educational Attainment in Union Gap
According to labor force statistics for Union Gap, 73.1% of individuals (2,300) out of the total population between 25 and 64 years of age (3,147) are in the labor force, with 7.4% or 170 of them being unemployed. The group with the highest labor force participation rate are those with the educational attainment of college / associate degree, with 76.3% or 673 individuals in the labor force. Within the labor force, individuals with less than high school education have the highest percentage of unemployment, with 12.3% or 97 of them being unemployed.
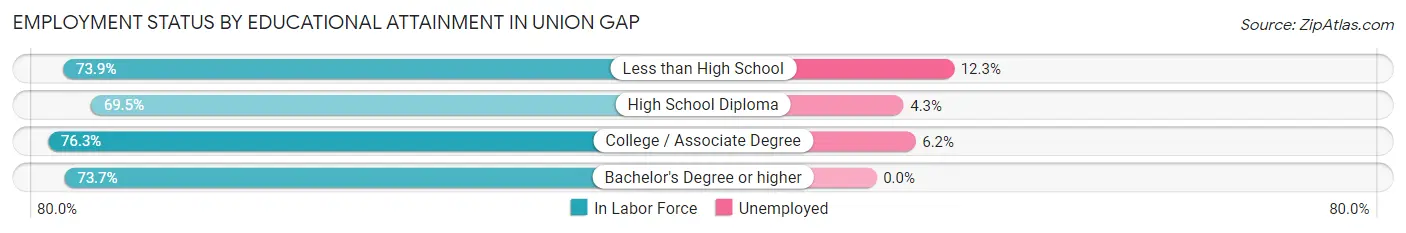
| Educational Attainment | In Labor Force | Unemployed |
| Less than High School | 789 (73.9%) | 131 (12.3%) |
| High School Diploma | 739 (69.5%) | 46 (4.3%) |
| College / Associate Degree | 673 (76.3%) | 55 (6.2%) |
| Bachelor's Degree or higher | 98 (73.7%) | 0 (0.0%) |
| Total | 2,300 (73.1%) | 233 (7.4%) |
Employment Occupations by Sex in Union Gap
Management, Business, Science and Arts Occupations
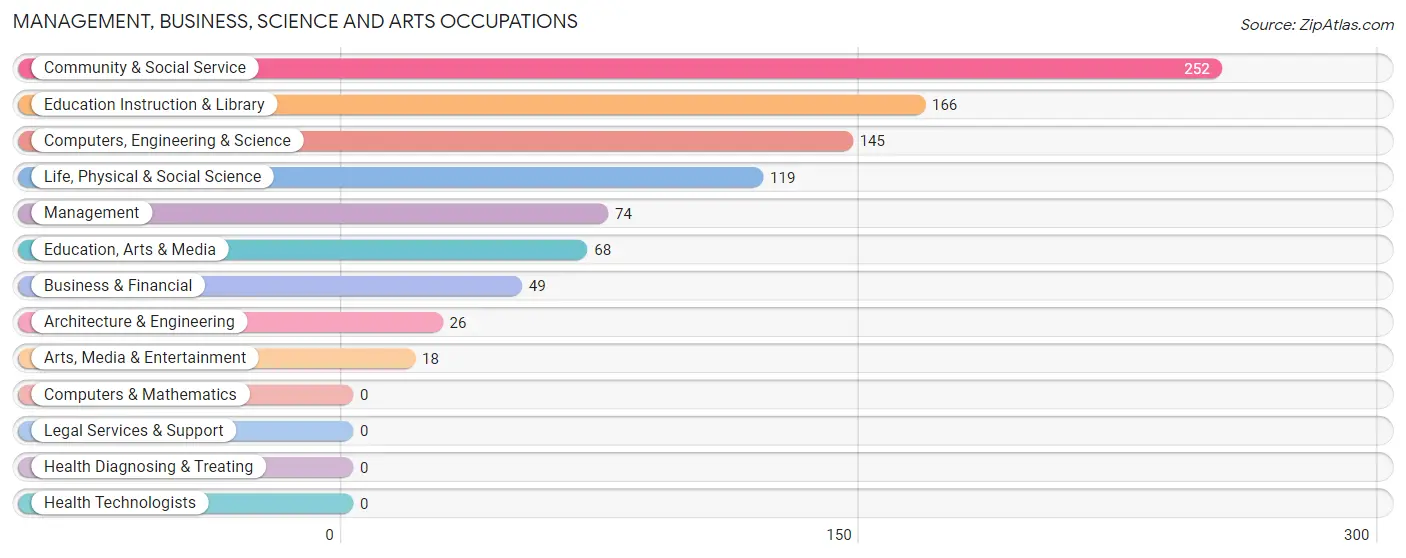
The most common Management, Business, Science and Arts occupations in Union Gap are Community & Social Service (252 | 9.3%), Education Instruction & Library (166 | 6.2%), Computers, Engineering & Science (145 | 5.4%), Life, Physical & Social Science (119 | 4.4%), and Management (74 | 2.8%).
Management, Business, Science and Arts Occupations by Sex
Within the Management, Business, Science and Arts occupations in Union Gap, the most male-oriented occupations are Life, Physical & Social Science (100.0%), Arts, Media & Entertainment (100.0%), and Computers, Engineering & Science (82.1%), while the most female-oriented occupations are Business & Financial (100.0%), Architecture & Engineering (100.0%), and Education, Arts & Media (100.0%).
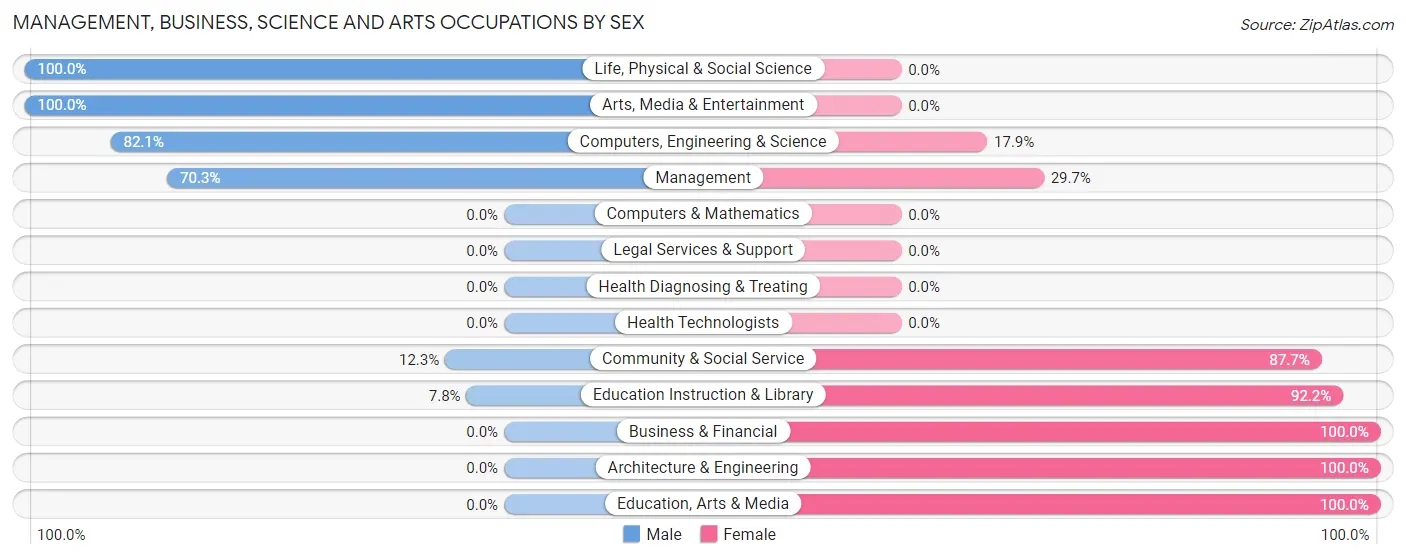
| Occupation | Male | Female |
| Management | 52 (70.3%) | 22 (29.7%) |
| Business & Financial | 0 (0.0%) | 49 (100.0%) |
| Computers, Engineering & Science | 119 (82.1%) | 26 (17.9%) |
| Computers & Mathematics | 0 (0.0%) | 0 (0.0%) |
| Architecture & Engineering | 0 (0.0%) | 26 (100.0%) |
| Life, Physical & Social Science | 119 (100.0%) | 0 (0.0%) |
| Community & Social Service | 31 (12.3%) | 221 (87.7%) |
| Education, Arts & Media | 0 (0.0%) | 68 (100.0%) |
| Legal Services & Support | 0 (0.0%) | 0 (0.0%) |
| Education Instruction & Library | 13 (7.8%) | 153 (92.2%) |
| Arts, Media & Entertainment | 18 (100.0%) | 0 (0.0%) |
| Health Diagnosing & Treating | 0 (0.0%) | 0 (0.0%) |
| Health Technologists | 0 (0.0%) | 0 (0.0%) |
| Total (Category) | 202 (38.9%) | 318 (61.2%) |
| Total (Overall) | 1,480 (54.9%) | 1,214 (45.1%) |
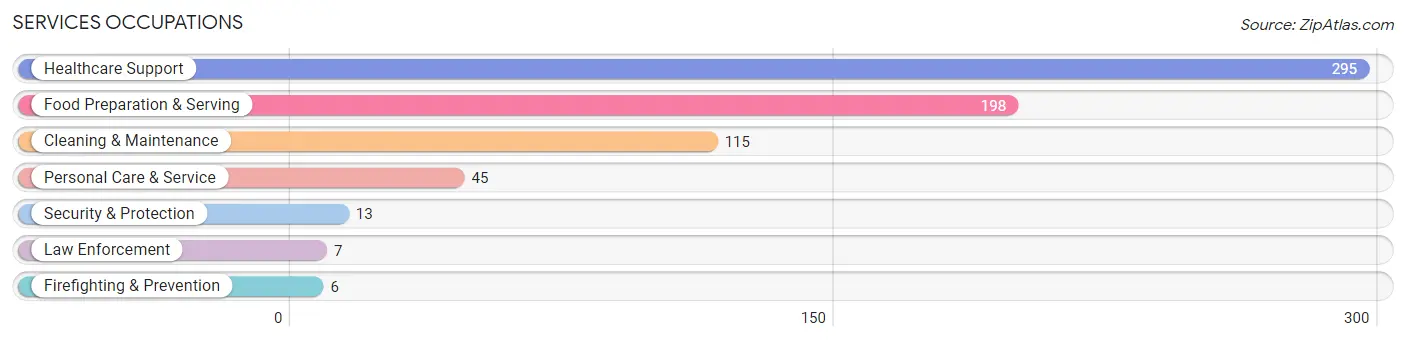
Services Occupations
The most common Services occupations in Union Gap are Healthcare Support (295 | 11.0%), Food Preparation & Serving (198 | 7.3%), Cleaning & Maintenance (115 | 4.3%), Personal Care & Service (45 | 1.7%), and Security & Protection (13 | 0.5%).
Services Occupations by Sex
Within the Services occupations in Union Gap, the most male-oriented occupations are Cleaning & Maintenance (76.5%), Personal Care & Service (33.3%), and Food Preparation & Serving (30.3%), while the most female-oriented occupations are Security & Protection (100.0%), Firefighting & Prevention (100.0%), and Law Enforcement (100.0%).
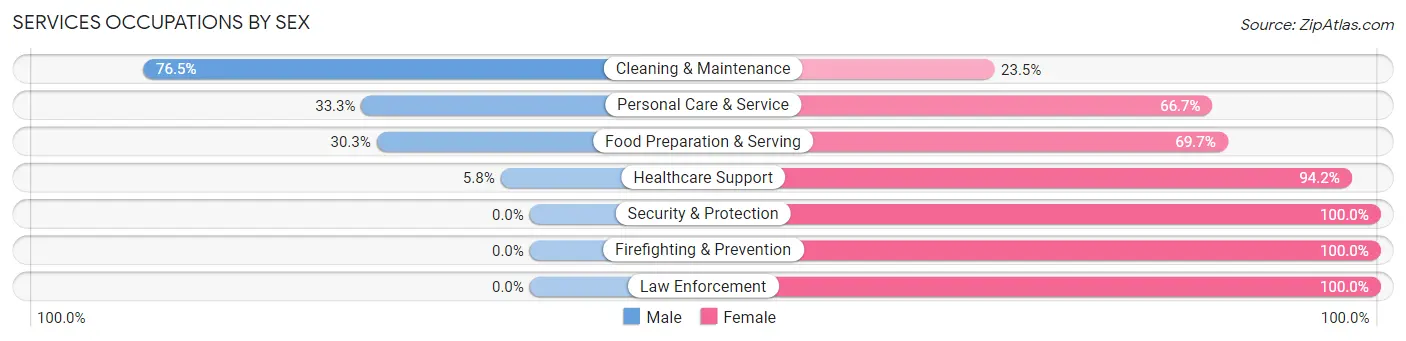
| Occupation | Male | Female |
| Healthcare Support | 17 (5.8%) | 278 (94.2%) |
| Security & Protection | 0 (0.0%) | 13 (100.0%) |
| Firefighting & Prevention | 0 (0.0%) | 6 (100.0%) |
| Law Enforcement | 0 (0.0%) | 7 (100.0%) |
| Food Preparation & Serving | 60 (30.3%) | 138 (69.7%) |
| Cleaning & Maintenance | 88 (76.5%) | 27 (23.5%) |
| Personal Care & Service | 15 (33.3%) | 30 (66.7%) |
| Total (Category) | 180 (27.0%) | 486 (73.0%) |
| Total (Overall) | 1,480 (54.9%) | 1,214 (45.1%) |
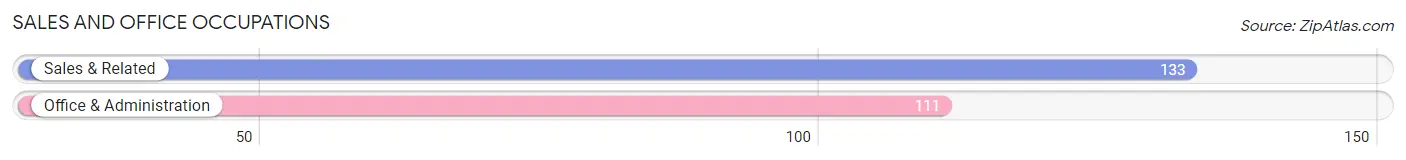
Sales and Office Occupations
The most common Sales and Office occupations in Union Gap are Sales & Related (133 | 4.9%), and Office & Administration (111 | 4.1%).
Sales and Office Occupations by Sex
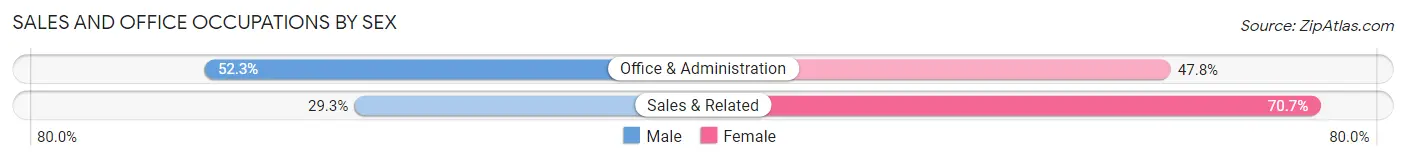
| Occupation | Male | Female |
| Sales & Related | 39 (29.3%) | 94 (70.7%) |
| Office & Administration | 58 (52.2%) | 53 (47.7%) |
| Total (Category) | 97 (39.8%) | 147 (60.3%) |
| Total (Overall) | 1,480 (54.9%) | 1,214 (45.1%) |
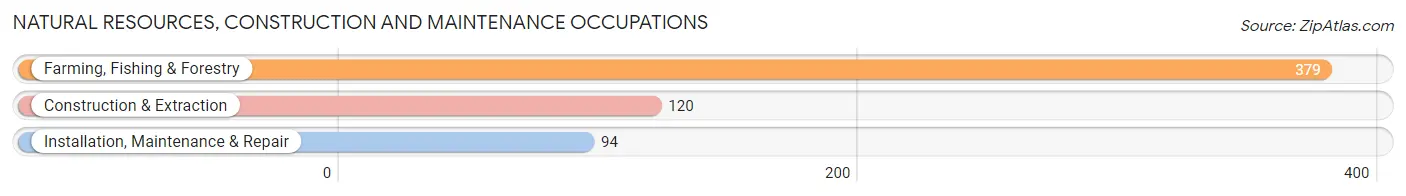
Natural Resources, Construction and Maintenance Occupations
The most common Natural Resources, Construction and Maintenance occupations in Union Gap are Farming, Fishing & Forestry (379 | 14.1%), Construction & Extraction (120 | 4.4%), and Installation, Maintenance & Repair (94 | 3.5%).
Natural Resources, Construction and Maintenance Occupations by Sex
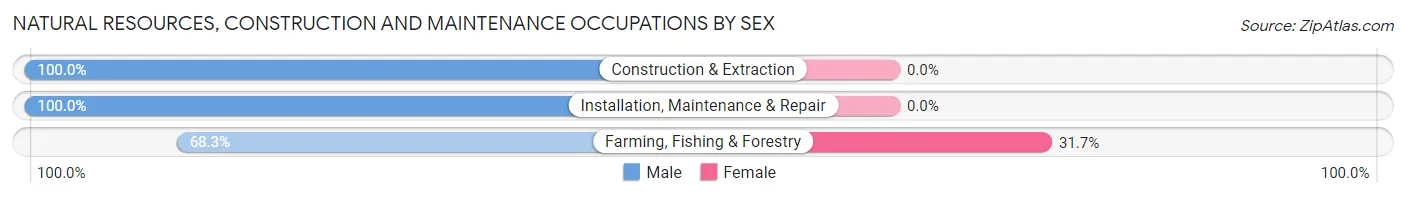
| Occupation | Male | Female |
| Farming, Fishing & Forestry | 259 (68.3%) | 120 (31.7%) |
| Construction & Extraction | 120 (100.0%) | 0 (0.0%) |
| Installation, Maintenance & Repair | 94 (100.0%) | 0 (0.0%) |
| Total (Category) | 473 (79.8%) | 120 (20.2%) |
| Total (Overall) | 1,480 (54.9%) | 1,214 (45.1%) |
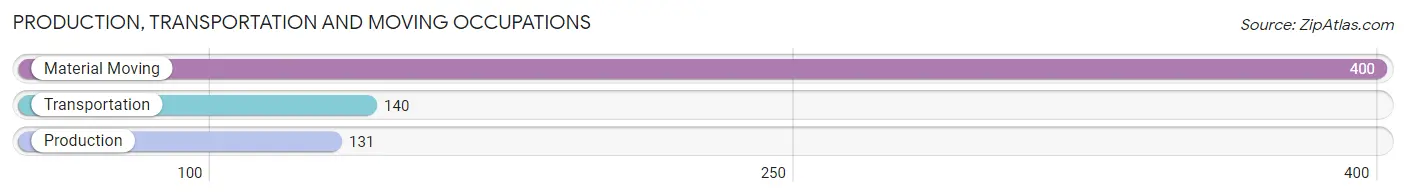
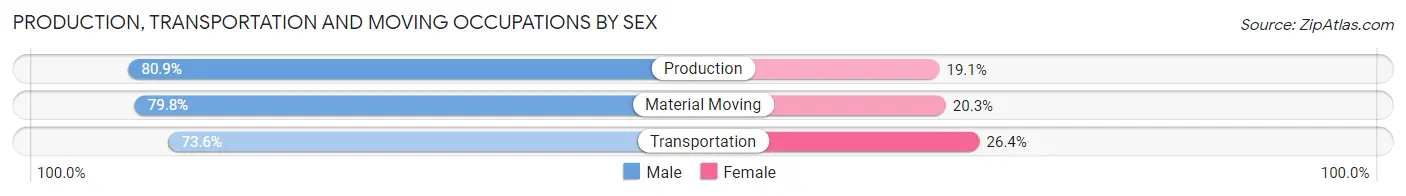
Production, Transportation and Moving Occupations
The most common Production, Transportation and Moving occupations in Union Gap are Material Moving (400 | 14.8%), Transportation (140 | 5.2%), and Production (131 | 4.9%).
Production, Transportation and Moving Occupations by Sex
| Occupation | Male | Female |
| Production | 106 (80.9%) | 25 (19.1%) |
| Transportation | 103 (73.6%) | 37 (26.4%) |
| Material Moving | 319 (79.7%) | 81 (20.3%) |
| Total (Category) | 528 (78.7%) | 143 (21.3%) |
| Total (Overall) | 1,480 (54.9%) | 1,214 (45.1%) |
Employment Industries by Sex in Union Gap
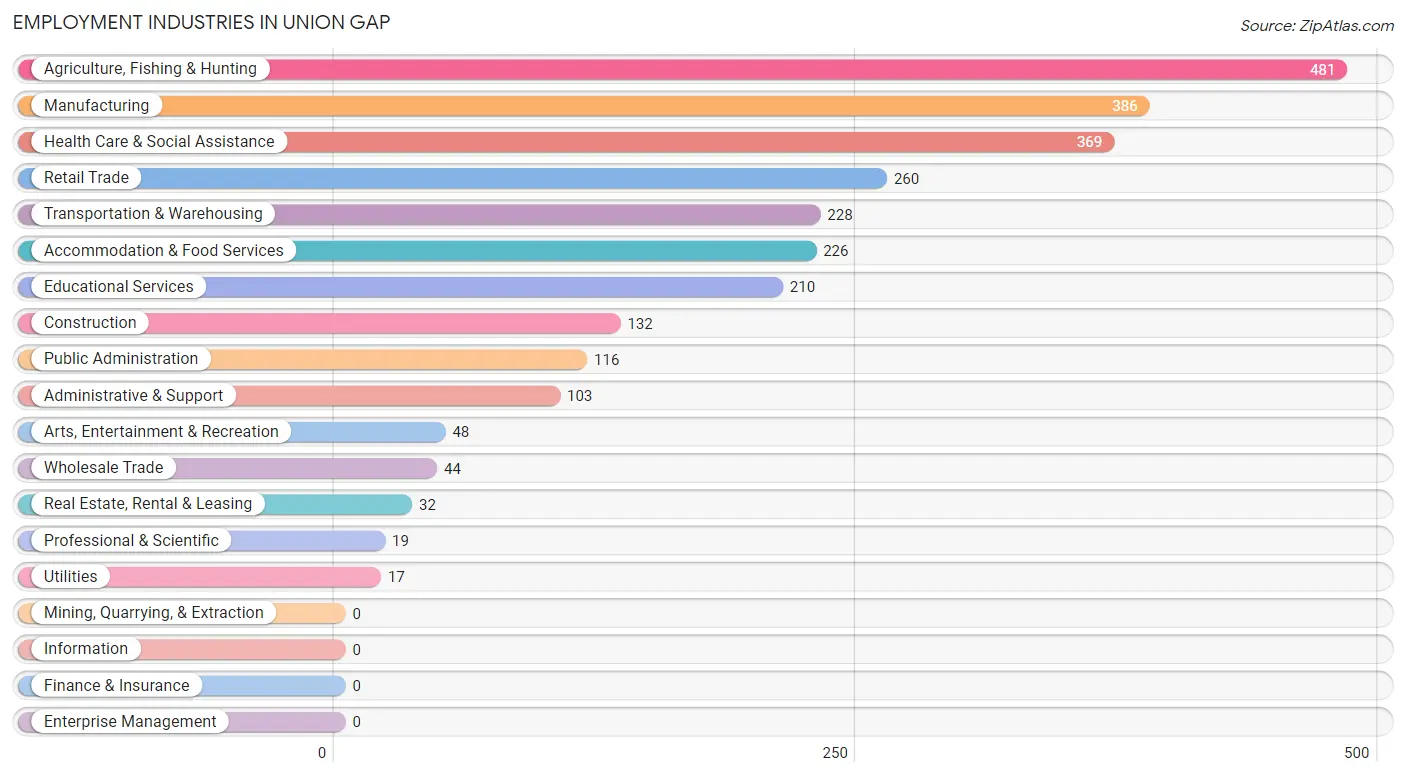
Employment Industries in Union Gap
The major employment industries in Union Gap include Agriculture, Fishing & Hunting (481 | 17.8%), Manufacturing (386 | 14.3%), Health Care & Social Assistance (369 | 13.7%), Retail Trade (260 | 9.7%), and Transportation & Warehousing (228 | 8.5%).
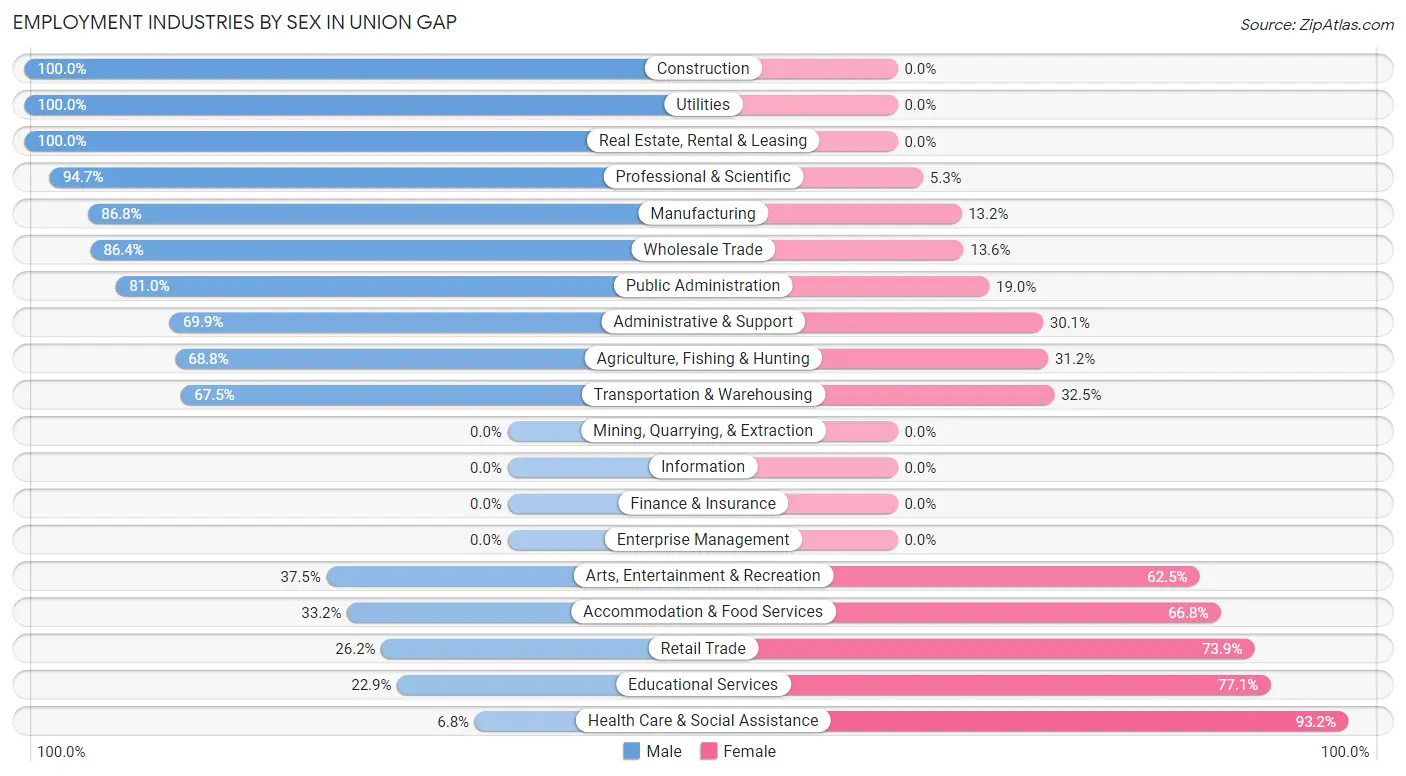
Employment Industries by Sex in Union Gap
The Union Gap industries that see more men than women are Construction (100.0%), Utilities (100.0%), and Real Estate, Rental & Leasing (100.0%), whereas the industries that tend to have a higher number of women are Health Care & Social Assistance (93.2%), Educational Services (77.1%), and Retail Trade (73.9%).
| Industry | Male | Female |
| Agriculture, Fishing & Hunting | 331 (68.8%) | 150 (31.2%) |
| Mining, Quarrying, & Extraction | 0 (0.0%) | 0 (0.0%) |
| Construction | 132 (100.0%) | 0 (0.0%) |
| Manufacturing | 335 (86.8%) | 51 (13.2%) |
| Wholesale Trade | 38 (86.4%) | 6 (13.6%) |
| Retail Trade | 68 (26.2%) | 192 (73.9%) |
| Transportation & Warehousing | 154 (67.5%) | 74 (32.5%) |
| Utilities | 17 (100.0%) | 0 (0.0%) |
| Information | 0 (0.0%) | 0 (0.0%) |
| Finance & Insurance | 0 (0.0%) | 0 (0.0%) |
| Real Estate, Rental & Leasing | 32 (100.0%) | 0 (0.0%) |
| Professional & Scientific | 18 (94.7%) | 1 (5.3%) |
| Enterprise Management | 0 (0.0%) | 0 (0.0%) |
| Administrative & Support | 72 (69.9%) | 31 (30.1%) |
| Educational Services | 48 (22.9%) | 162 (77.1%) |
| Health Care & Social Assistance | 25 (6.8%) | 344 (93.2%) |
| Arts, Entertainment & Recreation | 18 (37.5%) | 30 (62.5%) |
| Accommodation & Food Services | 75 (33.2%) | 151 (66.8%) |
| Public Administration | 94 (81.0%) | 22 (19.0%) |
| Total | 1,480 (54.9%) | 1,214 (45.1%) |
Education in Union Gap
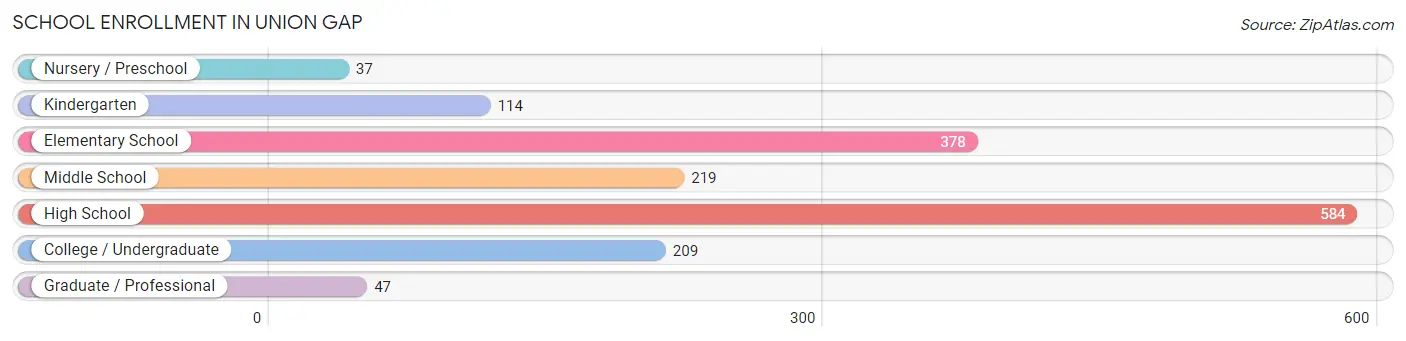
School Enrollment in Union Gap
The most common levels of schooling among the 1,588 students in Union Gap are high school (584 | 36.8%), elementary school (378 | 23.8%), and middle school (219 | 13.8%).
| School Level | # Students | % Students |
| Nursery / Preschool | 37 | 2.3% |
| Kindergarten | 114 | 7.2% |
| Elementary School | 378 | 23.8% |
| Middle School | 219 | 13.8% |
| High School | 584 | 36.8% |
| College / Undergraduate | 209 | 13.2% |
| Graduate / Professional | 47 | 3.0% |
| Total | 1,588 | 100.0% |
School Enrollment by Age by Funding Source in Union Gap
Out of a total of 1,588 students who are enrolled in schools in Union Gap, 124 (7.8%) attend a private institution, while the remaining 1,464 (92.2%) are enrolled in public schools. The age group of 3 to 4 year olds has the highest likelihood of being enrolled in private schools, with 20 (54.0% in the age bracket) enrolled. Conversely, the age group of 5 to 9 year old has the lowest likelihood of being enrolled in a private school, with 473 (100.0% in the age bracket) attending a public institution.
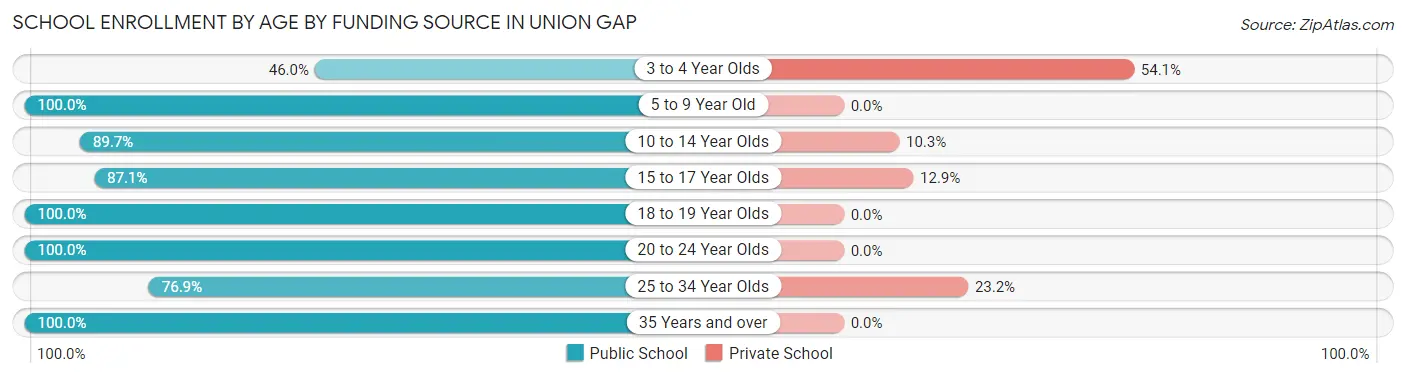
| Age Bracket | Public School | Private School |
| 3 to 4 Year Olds | 17 (46.0%) | 20 (54.0%) |
| 5 to 9 Year Old | 473 (100.0%) | 0 (0.0%) |
| 10 to 14 Year Olds | 235 (89.7%) | 27 (10.3%) |
| 15 to 17 Year Olds | 350 (87.1%) | 52 (12.9%) |
| 18 to 19 Year Olds | 219 (100.0%) | 0 (0.0%) |
| 20 to 24 Year Olds | 77 (100.0%) | 0 (0.0%) |
| 25 to 34 Year Olds | 83 (76.8%) | 25 (23.2%) |
| 35 Years and over | 10 (100.0%) | 0 (0.0%) |
| Total | 1,464 (92.2%) | 124 (7.8%) |
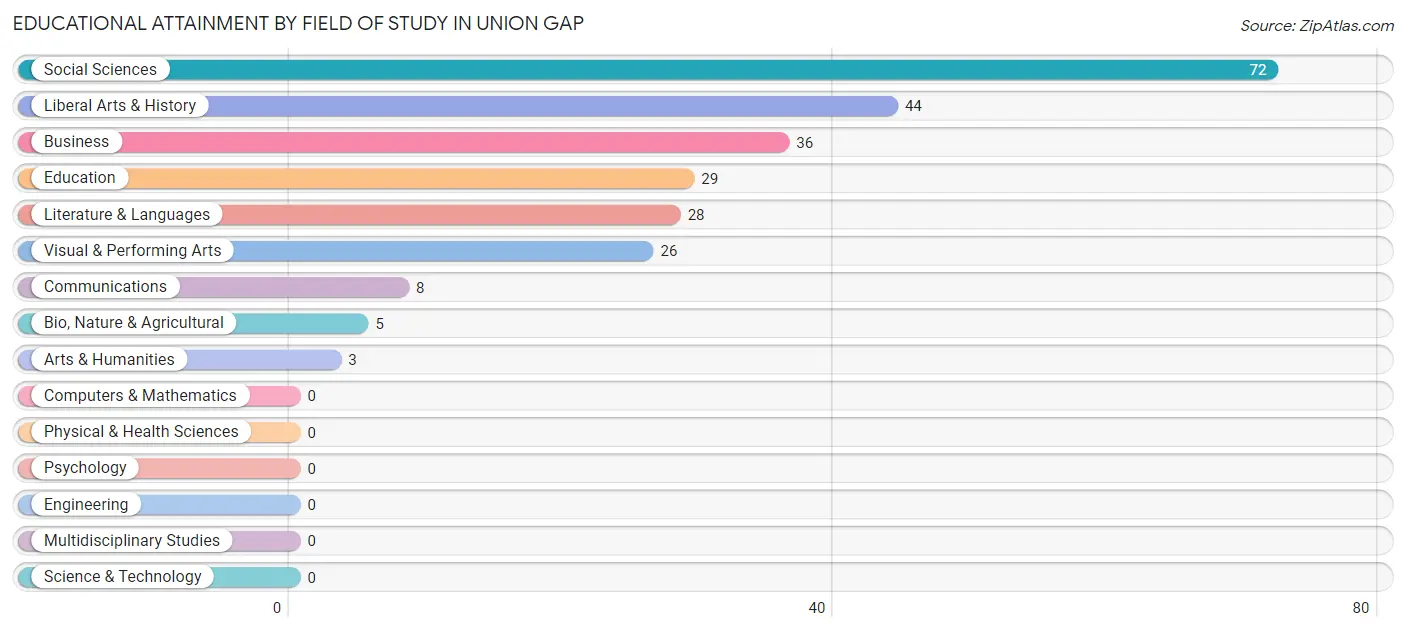
Educational Attainment by Field of Study in Union Gap
Social sciences (72 | 28.7%), liberal arts & history (44 | 17.5%), business (36 | 14.3%), education (29 | 11.6%), and literature & languages (28 | 11.2%) are the most common fields of study among 251 individuals in Union Gap who have obtained a bachelor's degree or higher.
| Field of Study | # Graduates | % Graduates |
| Computers & Mathematics | 0 | 0.0% |
| Bio, Nature & Agricultural | 5 | 2.0% |
| Physical & Health Sciences | 0 | 0.0% |
| Psychology | 0 | 0.0% |
| Social Sciences | 72 | 28.7% |
| Engineering | 0 | 0.0% |
| Multidisciplinary Studies | 0 | 0.0% |
| Science & Technology | 0 | 0.0% |
| Business | 36 | 14.3% |
| Education | 29 | 11.6% |
| Literature & Languages | 28 | 11.2% |
| Liberal Arts & History | 44 | 17.5% |
| Visual & Performing Arts | 26 | 10.4% |
| Communications | 8 | 3.2% |
| Arts & Humanities | 3 | 1.2% |
| Total | 251 | 100.0% |
Transportation & Commute in Union Gap
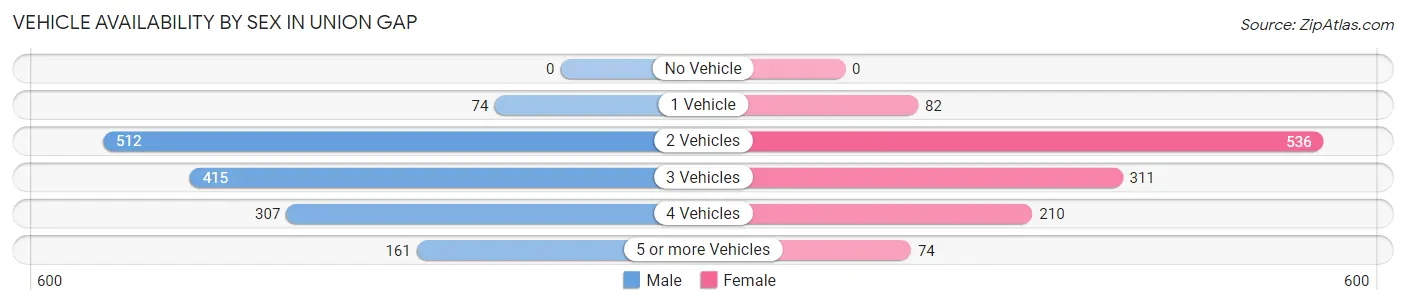
Vehicle Availability by Sex in Union Gap
The most prevalent vehicle ownership categories in Union Gap are males with 2 vehicles (512, accounting for 34.8%) and females with 2 vehicles (536, making up 42.2%).
| Vehicles Available | Male | Female |
| No Vehicle | 0 (0.0%) | 0 (0.0%) |
| 1 Vehicle | 74 (5.0%) | 82 (6.8%) |
| 2 Vehicles | 512 (34.8%) | 536 (44.2%) |
| 3 Vehicles | 415 (28.2%) | 311 (25.6%) |
| 4 Vehicles | 307 (20.9%) | 210 (17.3%) |
| 5 or more Vehicles | 161 (11.0%) | 74 (6.1%) |
| Total | 1,469 (100.0%) | 1,213 (100.0%) |
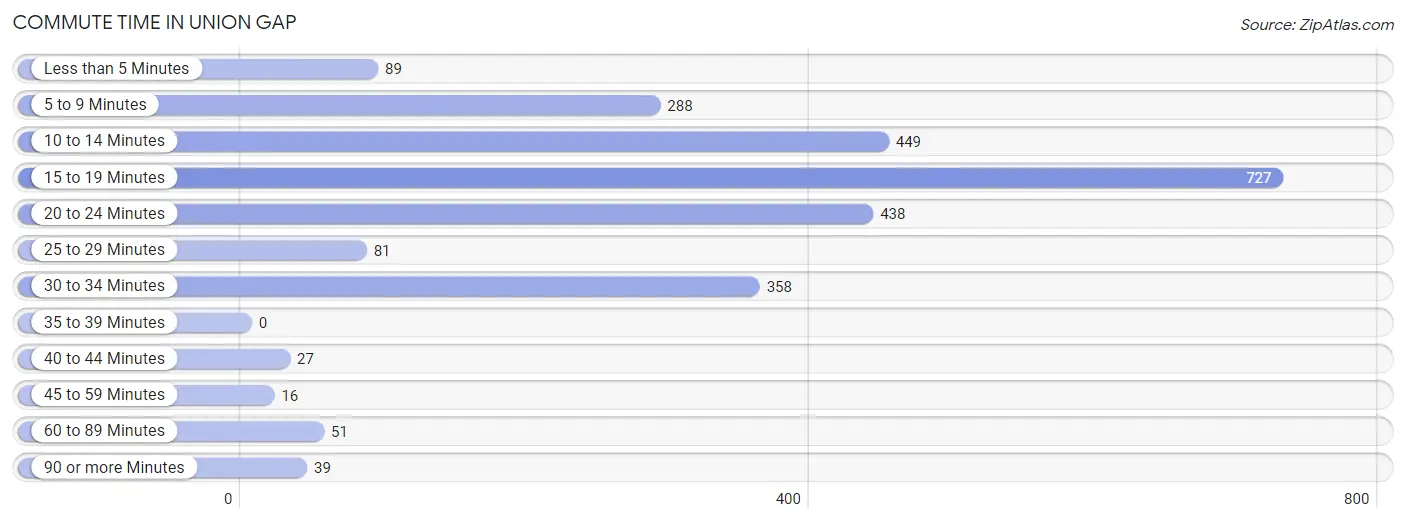
Commute Time in Union Gap
The most frequently occuring commute durations in Union Gap are 15 to 19 minutes (727 commuters, 28.4%), 10 to 14 minutes (449 commuters, 17.5%), and 20 to 24 minutes (438 commuters, 17.1%).
| Commute Time | # Commuters | % Commuters |
| Less than 5 Minutes | 89 | 3.5% |
| 5 to 9 Minutes | 288 | 11.2% |
| 10 to 14 Minutes | 449 | 17.5% |
| 15 to 19 Minutes | 727 | 28.4% |
| 20 to 24 Minutes | 438 | 17.1% |
| 25 to 29 Minutes | 81 | 3.2% |
| 30 to 34 Minutes | 358 | 14.0% |
| 35 to 39 Minutes | 0 | 0.0% |
| 40 to 44 Minutes | 27 | 1.1% |
| 45 to 59 Minutes | 16 | 0.6% |
| 60 to 89 Minutes | 51 | 2.0% |
| 90 or more Minutes | 39 | 1.5% |
Commute Time by Sex in Union Gap
The most common commute times in Union Gap are 20 to 24 minutes (330 commuters, 24.4%) for males and 15 to 19 minutes (490 commuters, 40.4%) for females.
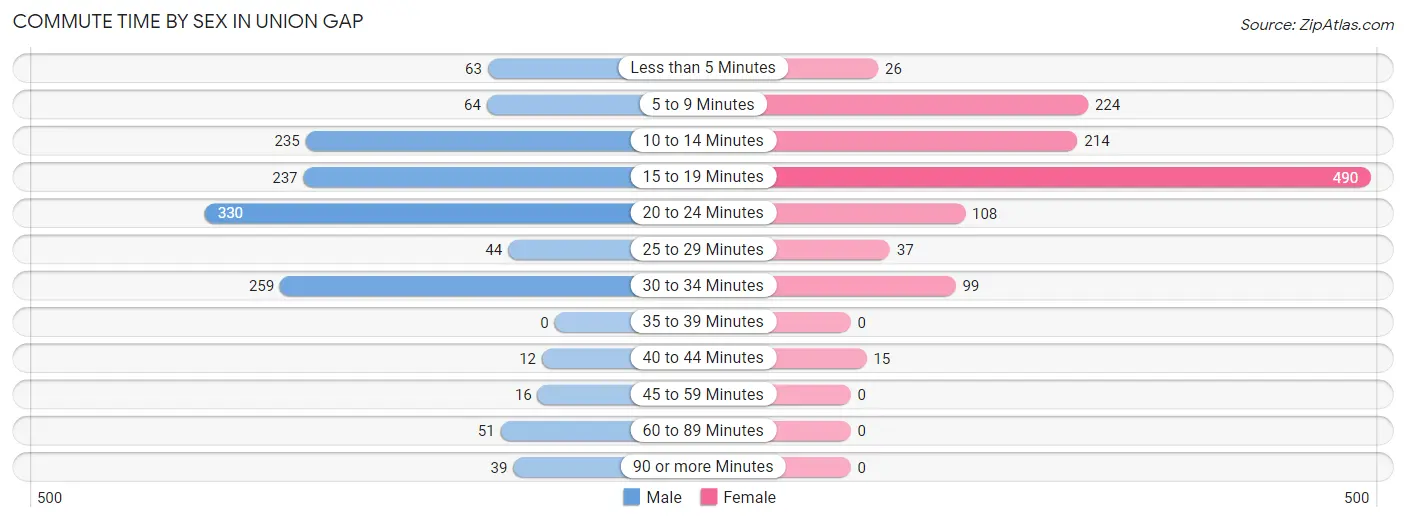
| Commute Time | Male | Female |
| Less than 5 Minutes | 63 (4.7%) | 26 (2.1%) |
| 5 to 9 Minutes | 64 (4.7%) | 224 (18.5%) |
| 10 to 14 Minutes | 235 (17.4%) | 214 (17.6%) |
| 15 to 19 Minutes | 237 (17.6%) | 490 (40.4%) |
| 20 to 24 Minutes | 330 (24.4%) | 108 (8.9%) |
| 25 to 29 Minutes | 44 (3.3%) | 37 (3.0%) |
| 30 to 34 Minutes | 259 (19.2%) | 99 (8.2%) |
| 35 to 39 Minutes | 0 (0.0%) | 0 (0.0%) |
| 40 to 44 Minutes | 12 (0.9%) | 15 (1.2%) |
| 45 to 59 Minutes | 16 (1.2%) | 0 (0.0%) |
| 60 to 89 Minutes | 51 (3.8%) | 0 (0.0%) |
| 90 or more Minutes | 39 (2.9%) | 0 (0.0%) |
Time of Departure to Work by Sex in Union Gap
The most frequent times of departure to work in Union Gap are 6:00 AM to 6:29 AM (237, 17.6%) for males and 4:00 PM to 11:59 PM (276, 22.8%) for females.
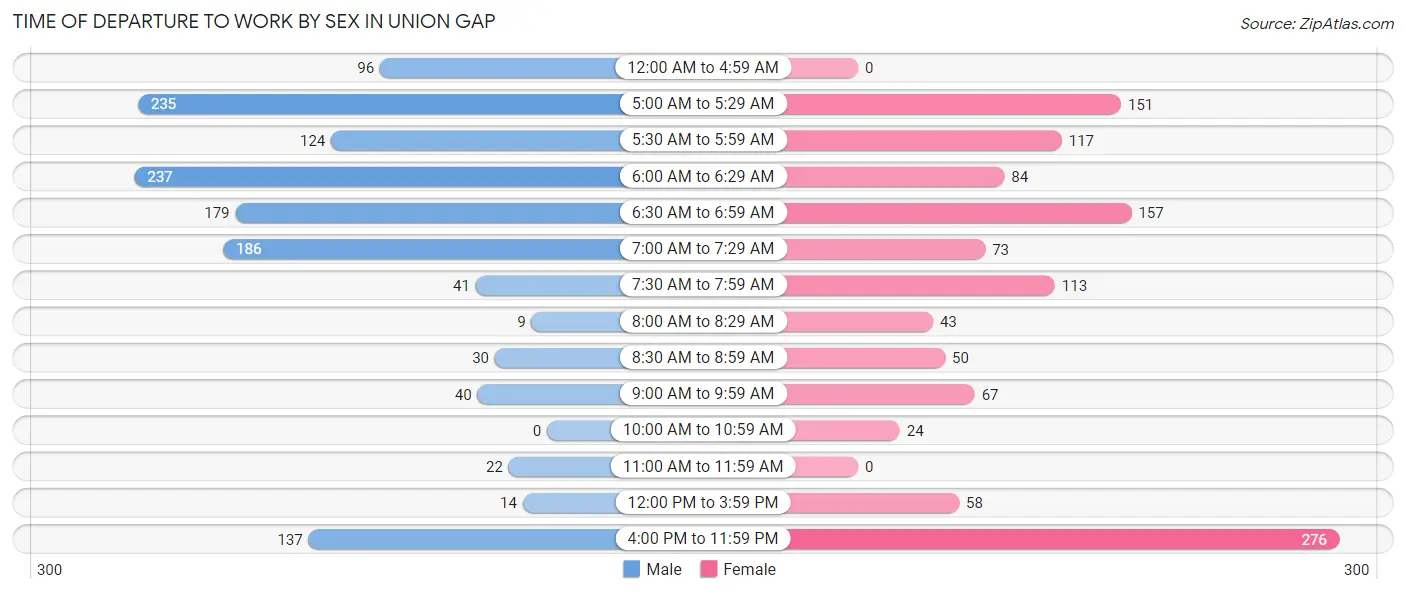
| Time of Departure | Male | Female |
| 12:00 AM to 4:59 AM | 96 (7.1%) | 0 (0.0%) |
| 5:00 AM to 5:29 AM | 235 (17.4%) | 151 (12.4%) |
| 5:30 AM to 5:59 AM | 124 (9.2%) | 117 (9.7%) |
| 6:00 AM to 6:29 AM | 237 (17.6%) | 84 (6.9%) |
| 6:30 AM to 6:59 AM | 179 (13.3%) | 157 (12.9%) |
| 7:00 AM to 7:29 AM | 186 (13.8%) | 73 (6.0%) |
| 7:30 AM to 7:59 AM | 41 (3.0%) | 113 (9.3%) |
| 8:00 AM to 8:29 AM | 9 (0.7%) | 43 (3.5%) |
| 8:30 AM to 8:59 AM | 30 (2.2%) | 50 (4.1%) |
| 9:00 AM to 9:59 AM | 40 (3.0%) | 67 (5.5%) |
| 10:00 AM to 10:59 AM | 0 (0.0%) | 24 (2.0%) |
| 11:00 AM to 11:59 AM | 22 (1.6%) | 0 (0.0%) |
| 12:00 PM to 3:59 PM | 14 (1.0%) | 58 (4.8%) |
| 4:00 PM to 11:59 PM | 137 (10.2%) | 276 (22.8%) |
| Total | 1,350 (100.0%) | 1,213 (100.0%) |
Housing Occupancy in Union Gap
Occupancy by Ownership in Union Gap
Of the total 2,058 dwellings in Union Gap, owner-occupied units account for 1,393 (67.7%), while renter-occupied units make up 665 (32.3%).
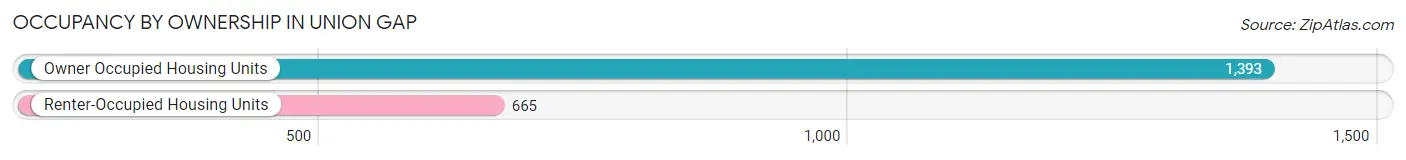
| Occupancy | # Housing Units | % Housing Units |
| Owner Occupied Housing Units | 1,393 | 67.7% |
| Renter-Occupied Housing Units | 665 | 32.3% |
| Total Occupied Housing Units | 2,058 | 100.0% |
Occupancy by Household Size in Union Gap
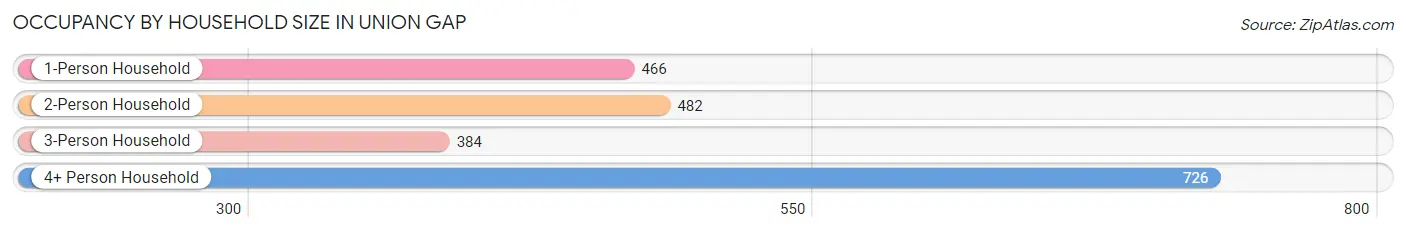
| Household Size | # Housing Units | % Housing Units |
| 1-Person Household | 466 | 22.6% |
| 2-Person Household | 482 | 23.4% |
| 3-Person Household | 384 | 18.7% |
| 4+ Person Household | 726 | 35.3% |
| Total Housing Units | 2,058 | 100.0% |
Occupancy by Ownership by Household Size in Union Gap
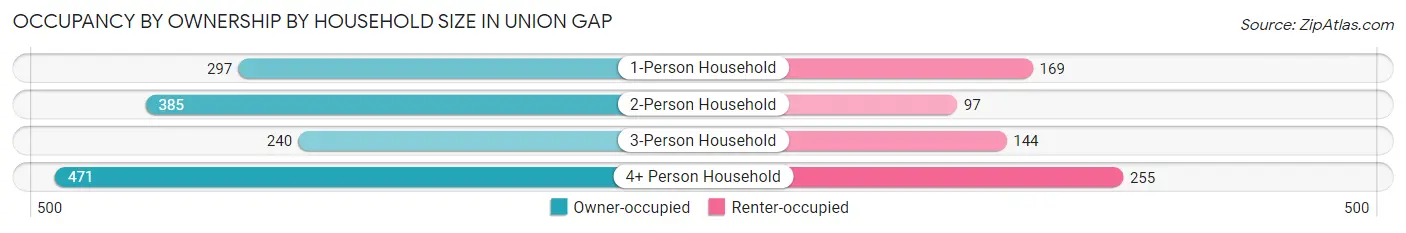
| Household Size | Owner-occupied | Renter-occupied |
| 1-Person Household | 297 (63.7%) | 169 (36.3%) |
| 2-Person Household | 385 (79.9%) | 97 (20.1%) |
| 3-Person Household | 240 (62.5%) | 144 (37.5%) |
| 4+ Person Household | 471 (64.9%) | 255 (35.1%) |
| Total Housing Units | 1,393 (67.7%) | 665 (32.3%) |
Occupancy by Educational Attainment in Union Gap
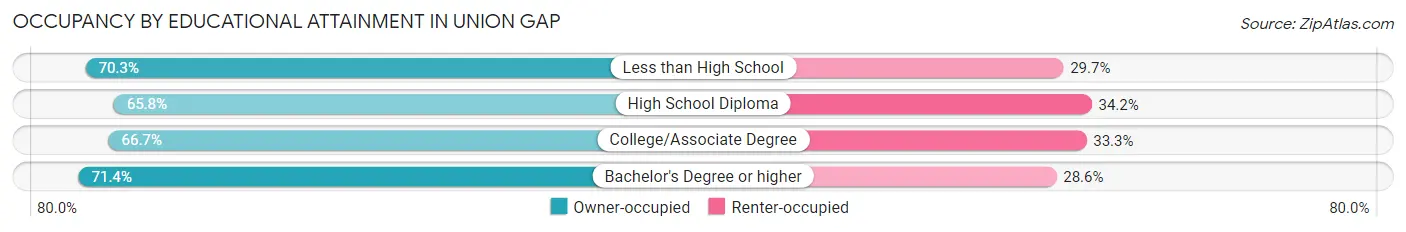
| Household Size | Owner-occupied | Renter-occupied |
| Less than High School | 410 (70.3%) | 173 (29.7%) |
| High School Diploma | 478 (65.8%) | 248 (34.2%) |
| College/Associate Degree | 420 (66.7%) | 210 (33.3%) |
| Bachelor's Degree or higher | 85 (71.4%) | 34 (28.6%) |
Occupancy by Age of Householder in Union Gap
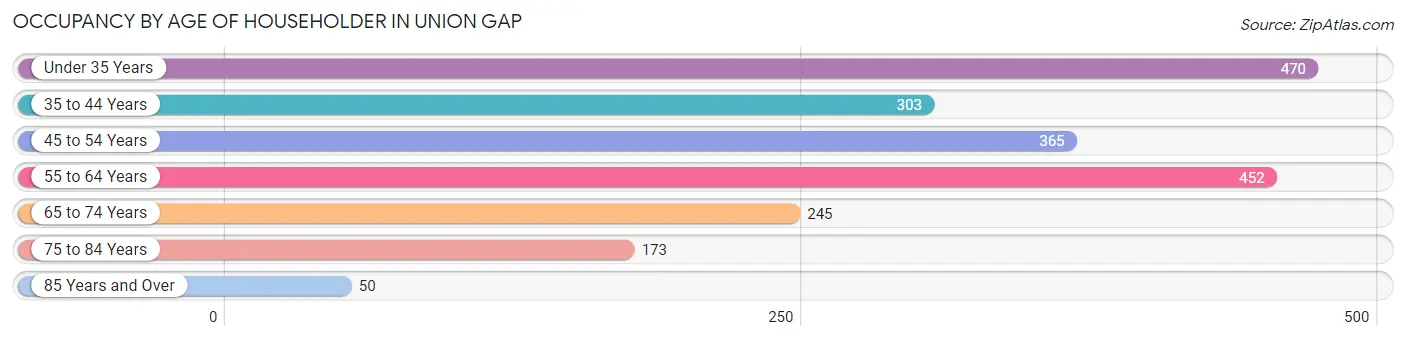
| Age Bracket | # Households | % Households |
| Under 35 Years | 470 | 22.8% |
| 35 to 44 Years | 303 | 14.7% |
| 45 to 54 Years | 365 | 17.7% |
| 55 to 64 Years | 452 | 22.0% |
| 65 to 74 Years | 245 | 11.9% |
| 75 to 84 Years | 173 | 8.4% |
| 85 Years and Over | 50 | 2.4% |
| Total | 2,058 | 100.0% |
Housing Finances in Union Gap
Median Income by Occupancy in Union Gap
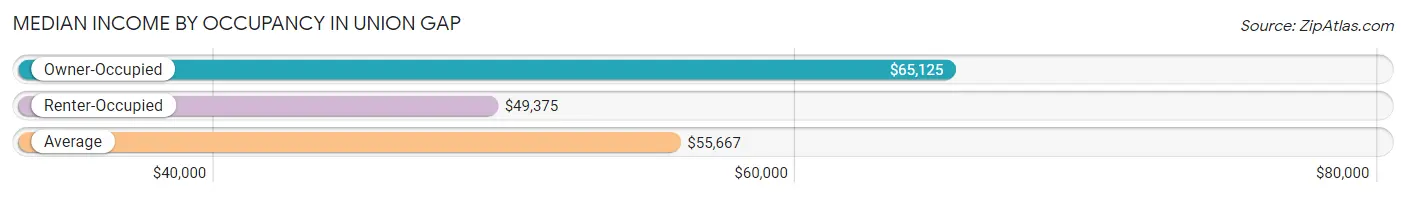
| Occupancy Type | # Households | Median Income |
| Owner-Occupied | 1,393 (67.7%) | $65,125 |
| Renter-Occupied | 665 (32.3%) | $49,375 |
| Average | 2,058 (100.0%) | $55,667 |
Occupancy by Householder Income Bracket in Union Gap
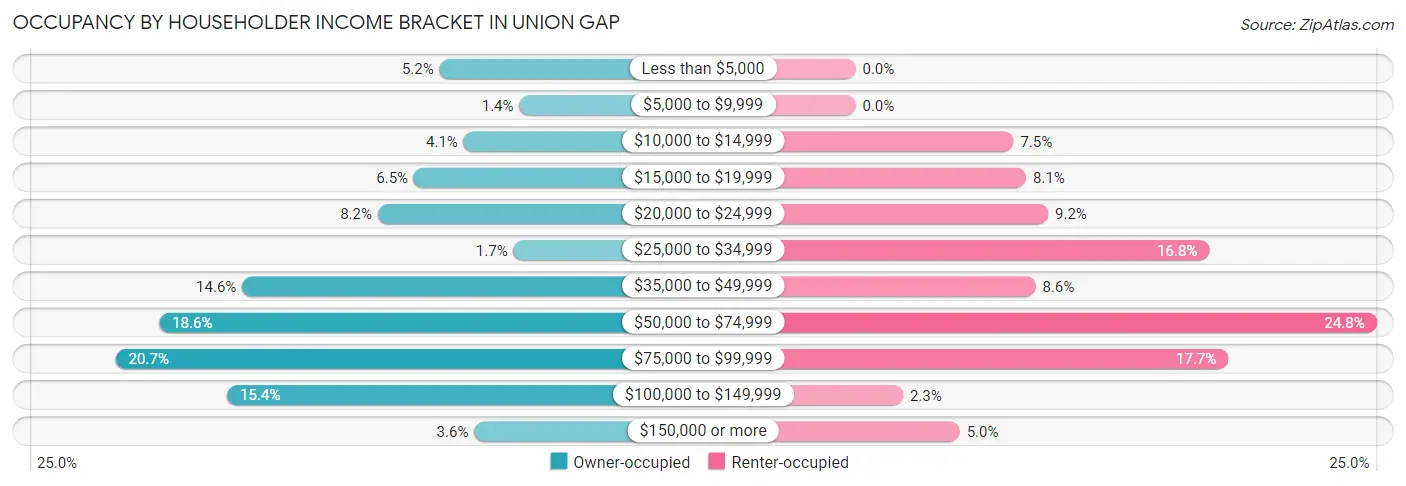
| Income Bracket | Owner-occupied | Renter-occupied |
| Less than $5,000 | 73 (5.2%) | 0 (0.0%) |
| $5,000 to $9,999 | 20 (1.4%) | 0 (0.0%) |
| $10,000 to $14,999 | 57 (4.1%) | 50 (7.5%) |
| $15,000 to $19,999 | 90 (6.5%) | 54 (8.1%) |
| $20,000 to $24,999 | 114 (8.2%) | 61 (9.2%) |
| $25,000 to $34,999 | 24 (1.7%) | 112 (16.8%) |
| $35,000 to $49,999 | 204 (14.6%) | 57 (8.6%) |
| $50,000 to $74,999 | 259 (18.6%) | 165 (24.8%) |
| $75,000 to $99,999 | 288 (20.7%) | 118 (17.7%) |
| $100,000 to $149,999 | 214 (15.4%) | 15 (2.3%) |
| $150,000 or more | 50 (3.6%) | 33 (5.0%) |
| Total | 1,393 (100.0%) | 665 (100.0%) |
Monthly Housing Cost Tiers in Union Gap
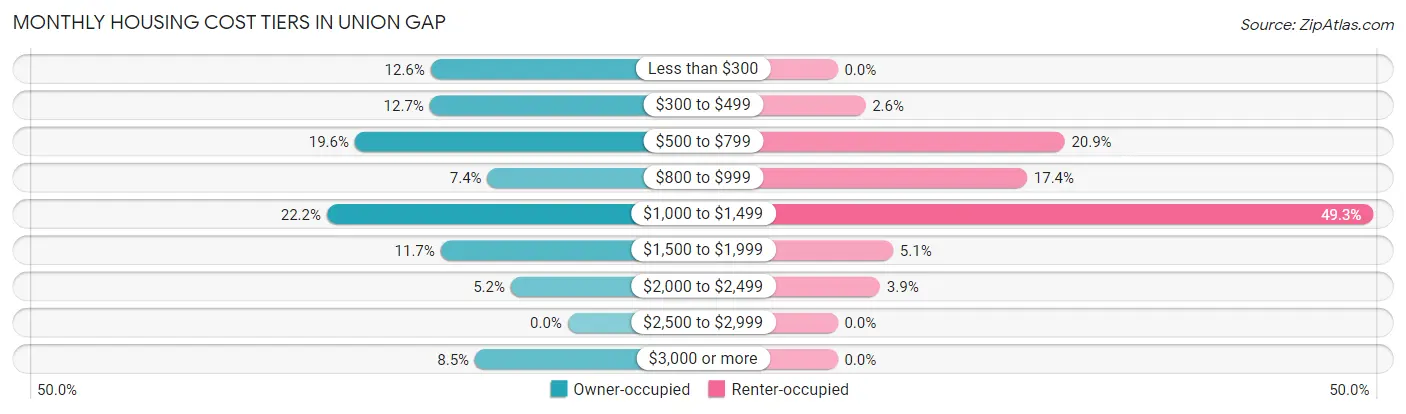
| Monthly Cost | Owner-occupied | Renter-occupied |
| Less than $300 | 176 (12.6%) | 0 (0.0%) |
| $300 to $499 | 177 (12.7%) | 17 (2.6%) |
| $500 to $799 | 273 (19.6%) | 139 (20.9%) |
| $800 to $999 | 103 (7.4%) | 116 (17.4%) |
| $1,000 to $1,499 | 309 (22.2%) | 328 (49.3%) |
| $1,500 to $1,999 | 163 (11.7%) | 34 (5.1%) |
| $2,000 to $2,499 | 73 (5.2%) | 26 (3.9%) |
| $2,500 to $2,999 | 0 (0.0%) | 0 (0.0%) |
| $3,000 or more | 119 (8.5%) | 0 (0.0%) |
| Total | 1,393 (100.0%) | 665 (100.0%) |
Physical Housing Characteristics in Union Gap
Housing Structures in Union Gap
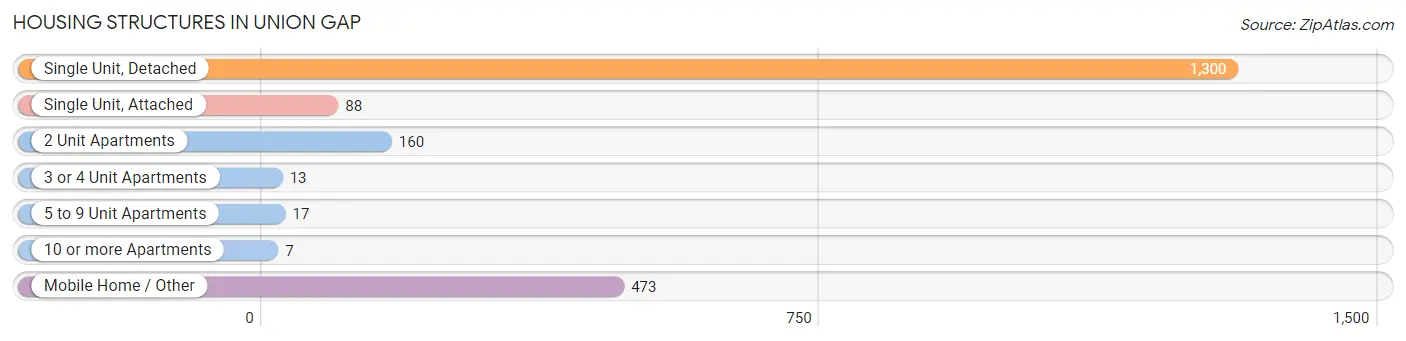
| Structure Type | # Housing Units | % Housing Units |
| Single Unit, Detached | 1,300 | 63.2% |
| Single Unit, Attached | 88 | 4.3% |
| 2 Unit Apartments | 160 | 7.8% |
| 3 or 4 Unit Apartments | 13 | 0.6% |
| 5 to 9 Unit Apartments | 17 | 0.8% |
| 10 or more Apartments | 7 | 0.3% |
| Mobile Home / Other | 473 | 23.0% |
| Total | 2,058 | 100.0% |
Housing Structures by Occupancy in Union Gap
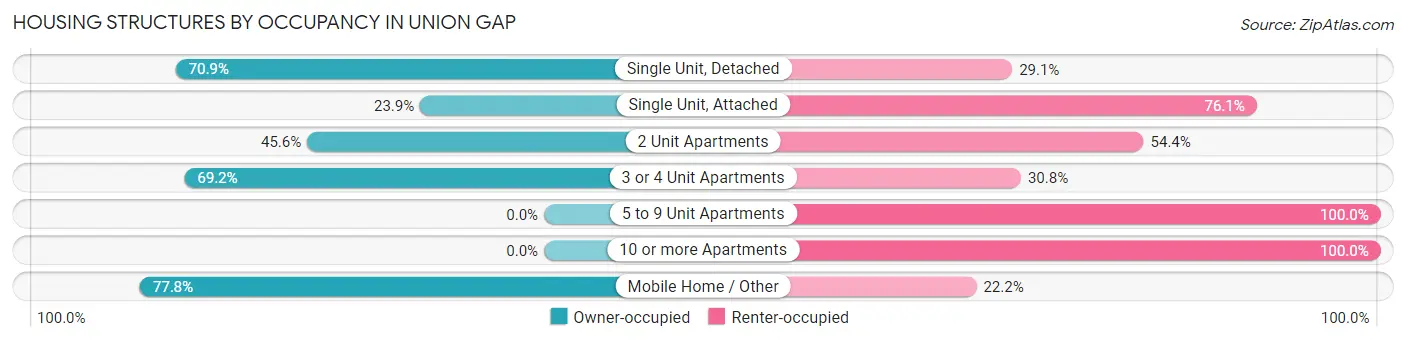
| Structure Type | Owner-occupied | Renter-occupied |
| Single Unit, Detached | 922 (70.9%) | 378 (29.1%) |
| Single Unit, Attached | 21 (23.9%) | 67 (76.1%) |
| 2 Unit Apartments | 73 (45.6%) | 87 (54.4%) |
| 3 or 4 Unit Apartments | 9 (69.2%) | 4 (30.8%) |
| 5 to 9 Unit Apartments | 0 (0.0%) | 17 (100.0%) |
| 10 or more Apartments | 0 (0.0%) | 7 (100.0%) |
| Mobile Home / Other | 368 (77.8%) | 105 (22.2%) |
| Total | 1,393 (67.7%) | 665 (32.3%) |
Housing Structures by Number of Rooms in Union Gap
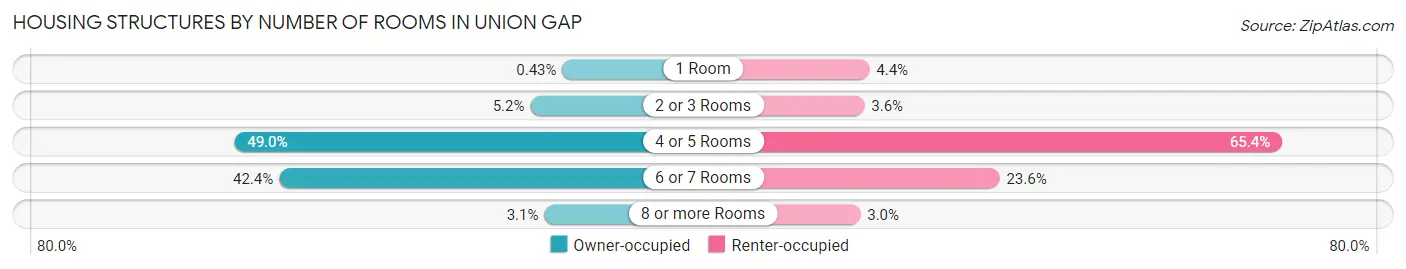
| Number of Rooms | Owner-occupied | Renter-occupied |
| 1 Room | 6 (0.4%) | 29 (4.4%) |
| 2 or 3 Rooms | 72 (5.2%) | 24 (3.6%) |
| 4 or 5 Rooms | 682 (49.0%) | 435 (65.4%) |
| 6 or 7 Rooms | 590 (42.3%) | 157 (23.6%) |
| 8 or more Rooms | 43 (3.1%) | 20 (3.0%) |
| Total | 1,393 (100.0%) | 665 (100.0%) |
Housing Structure by Heating Type in Union Gap
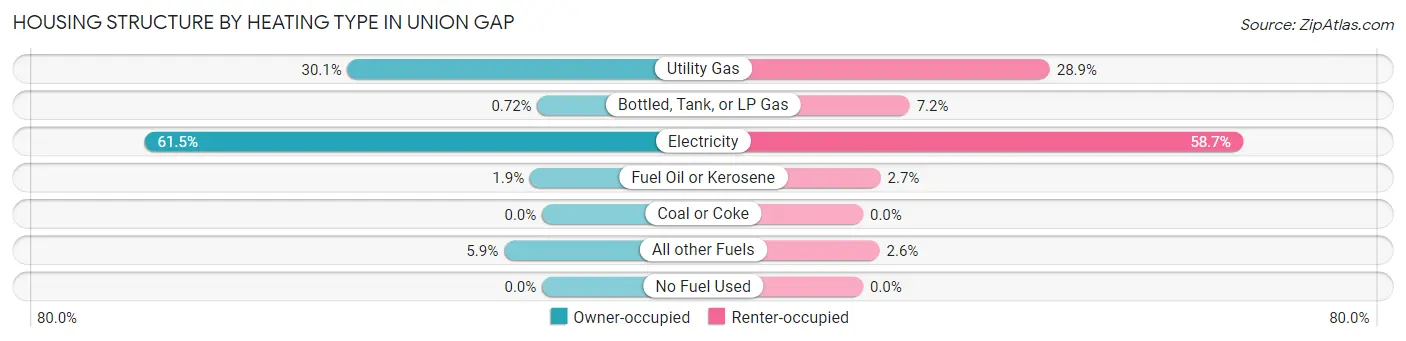
| Heating Type | Owner-occupied | Renter-occupied |
| Utility Gas | 419 (30.1%) | 192 (28.9%) |
| Bottled, Tank, or LP Gas | 10 (0.7%) | 48 (7.2%) |
| Electricity | 856 (61.5%) | 390 (58.7%) |
| Fuel Oil or Kerosene | 26 (1.9%) | 18 (2.7%) |
| Coal or Coke | 0 (0.0%) | 0 (0.0%) |
| All other Fuels | 82 (5.9%) | 17 (2.6%) |
| No Fuel Used | 0 (0.0%) | 0 (0.0%) |
| Total | 1,393 (100.0%) | 665 (100.0%) |
Household Vehicle Usage in Union Gap

| Vehicles per Household | Owner-occupied | Renter-occupied |
| No Vehicle | 52 (3.7%) | 0 (0.0%) |
| 1 Vehicle | 241 (17.3%) | 193 (29.0%) |
| 2 Vehicles | 505 (36.2%) | 265 (39.9%) |
| 3 or more Vehicles | 595 (42.7%) | 207 (31.1%) |
| Total | 1,393 (100.0%) | 665 (100.0%) |
Real Estate & Mortgages in Union Gap
Real Estate and Mortgage Overview in Union Gap
| Characteristic | Without Mortgage | With Mortgage |
| Housing Units | 625 | 768 |
| Median Property Value | $100,200 | $191,600 |
| Median Household Income | $48,075 | $34 |
| Monthly Housing Costs | $430 | $119 |
| Real Estate Taxes | $1,189 | $3 |
Property Value by Mortgage Status in Union Gap
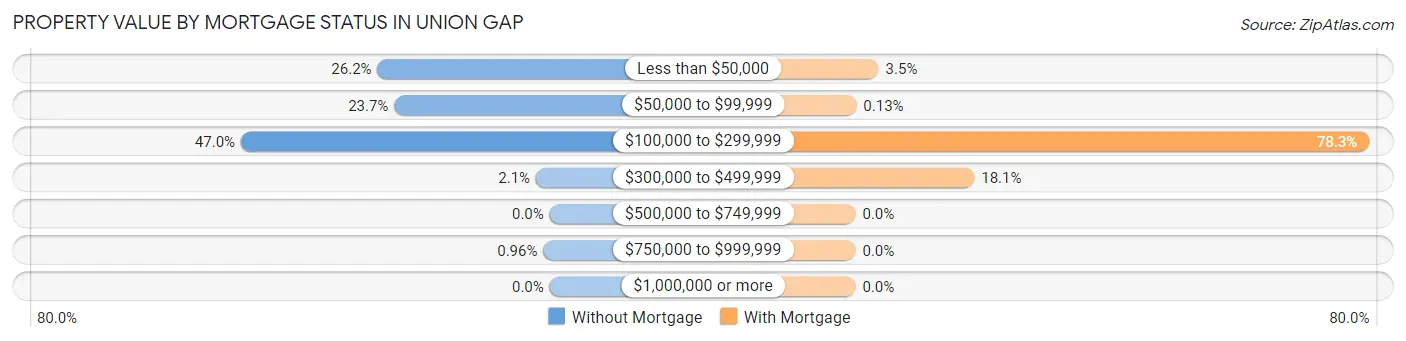
| Property Value | Without Mortgage | With Mortgage |
| Less than $50,000 | 164 (26.2%) | 27 (3.5%) |
| $50,000 to $99,999 | 148 (23.7%) | 1 (0.1%) |
| $100,000 to $299,999 | 294 (47.0%) | 601 (78.3%) |
| $300,000 to $499,999 | 13 (2.1%) | 139 (18.1%) |
| $500,000 to $749,999 | 0 (0.0%) | 0 (0.0%) |
| $750,000 to $999,999 | 6 (1.0%) | 0 (0.0%) |
| $1,000,000 or more | 0 (0.0%) | 0 (0.0%) |
| Total | 625 (100.0%) | 768 (100.0%) |
Household Income by Mortgage Status in Union Gap
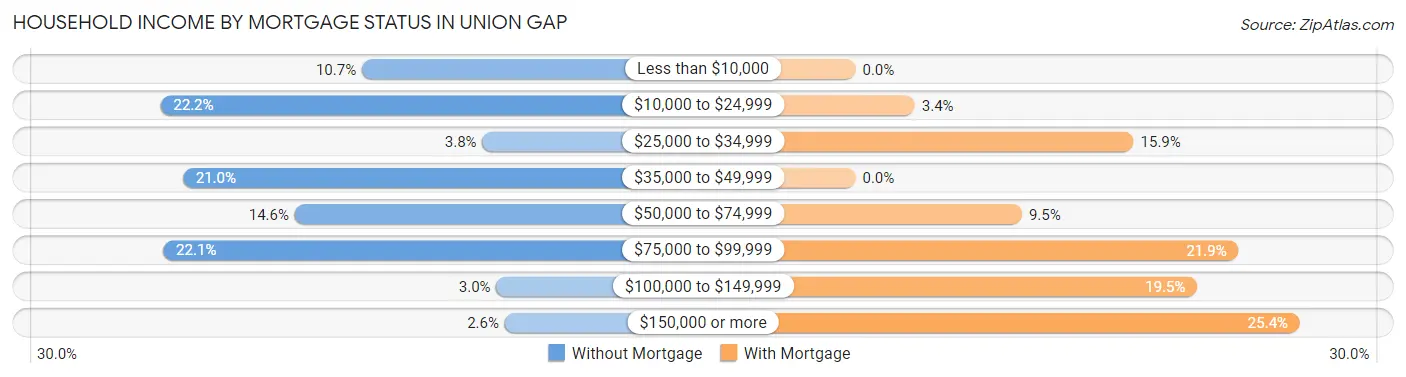
| Household Income | Without Mortgage | With Mortgage |
| Less than $10,000 | 67 (10.7%) | 0 (0.0%) |
| $10,000 to $24,999 | 139 (22.2%) | 26 (3.4%) |
| $25,000 to $34,999 | 24 (3.8%) | 122 (15.9%) |
| $35,000 to $49,999 | 131 (21.0%) | 0 (0.0%) |
| $50,000 to $74,999 | 91 (14.6%) | 73 (9.5%) |
| $75,000 to $99,999 | 138 (22.1%) | 168 (21.9%) |
| $100,000 to $149,999 | 19 (3.0%) | 150 (19.5%) |
| $150,000 or more | 16 (2.6%) | 195 (25.4%) |
| Total | 625 (100.0%) | 768 (100.0%) |
Property Value to Household Income Ratio in Union Gap
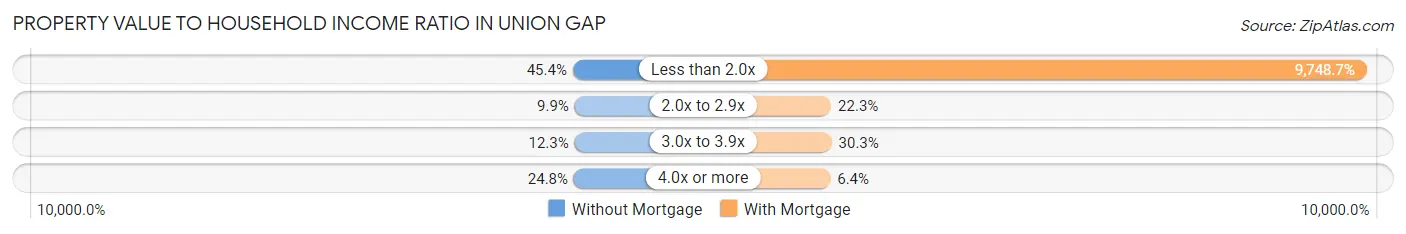
| Value-to-Income Ratio | Without Mortgage | With Mortgage |
| Less than 2.0x | 284 (45.4%) | 74,870 (9,748.7%) |
| 2.0x to 2.9x | 62 (9.9%) | 171 (22.3%) |
| 3.0x to 3.9x | 77 (12.3%) | 233 (30.3%) |
| 4.0x or more | 155 (24.8%) | 49 (6.4%) |
| Total | 625 (100.0%) | 768 (100.0%) |
Real Estate Taxes by Mortgage Status in Union Gap
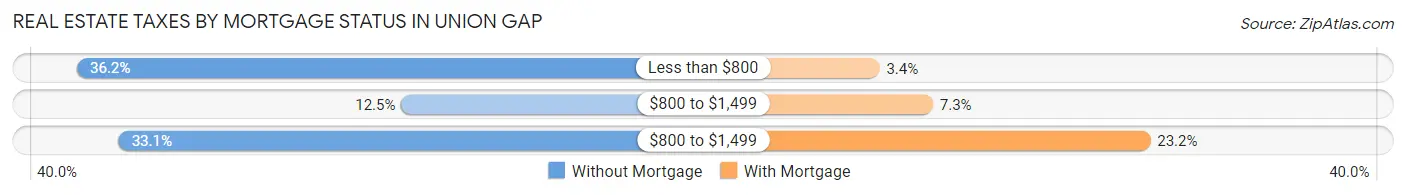
| Property Taxes | Without Mortgage | With Mortgage |
| Less than $800 | 226 (36.2%) | 26 (3.4%) |
| $800 to $1,499 | 78 (12.5%) | 56 (7.3%) |
| $800 to $1,499 | 207 (33.1%) | 178 (23.2%) |
| Total | 625 (100.0%) | 768 (100.0%) |
Health & Disability in Union Gap
Health Insurance Coverage by Age in Union Gap
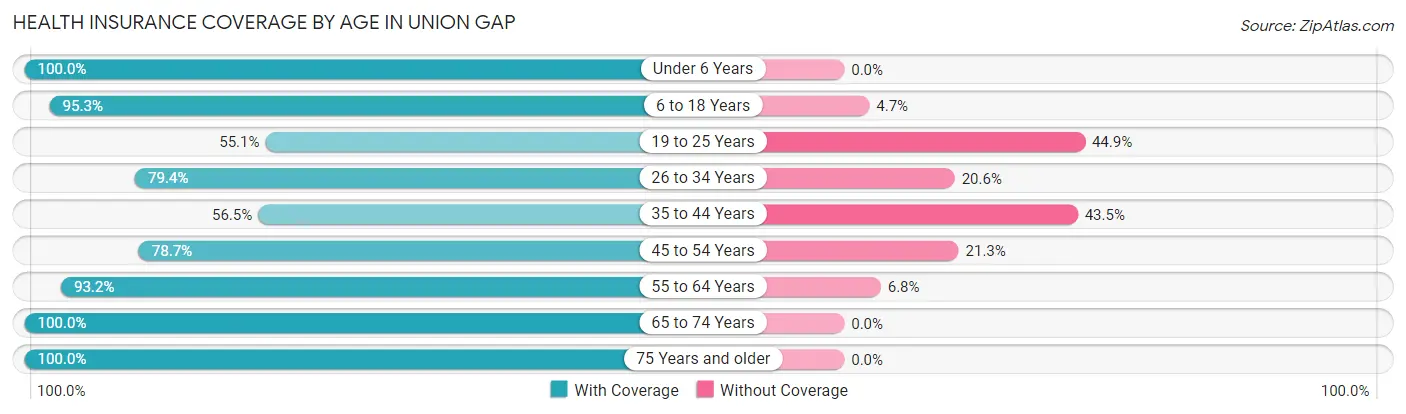
| Age Bracket | With Coverage | Without Coverage |
| Under 6 Years | 679 (100.0%) | 0 (0.0%) |
| 6 to 18 Years | 1,345 (95.3%) | 66 (4.7%) |
| 19 to 25 Years | 334 (55.1%) | 272 (44.9%) |
| 26 to 34 Years | 686 (79.4%) | 178 (20.6%) |
| 35 to 44 Years | 467 (56.5%) | 360 (43.5%) |
| 45 to 54 Years | 513 (78.7%) | 139 (21.3%) |
| 55 to 64 Years | 699 (93.2%) | 51 (6.8%) |
| 65 to 74 Years | 389 (100.0%) | 0 (0.0%) |
| 75 Years and older | 263 (100.0%) | 0 (0.0%) |
| Total | 5,375 (83.5%) | 1,066 (16.6%) |
Health Insurance Coverage by Citizenship Status in Union Gap
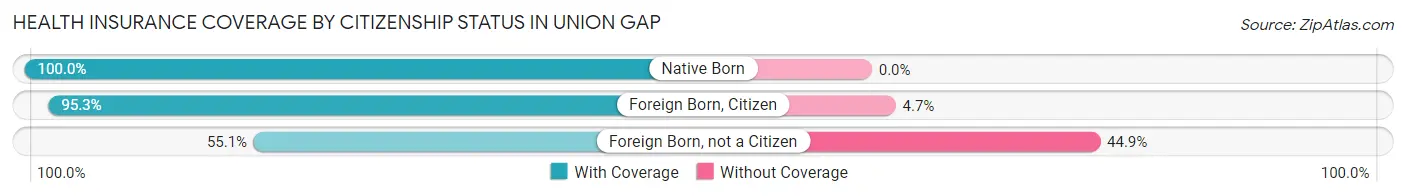
| Citizenship Status | With Coverage | Without Coverage |
| Native Born | 679 (100.0%) | 0 (0.0%) |
| Foreign Born, Citizen | 1,345 (95.3%) | 66 (4.7%) |
| Foreign Born, not a Citizen | 334 (55.1%) | 272 (44.9%) |
Health Insurance Coverage by Household Income in Union Gap
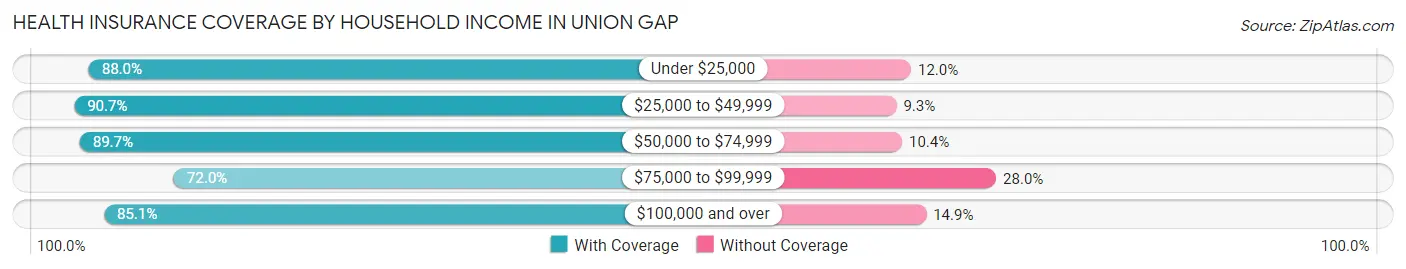
| Household Income | With Coverage | Without Coverage |
| Under $25,000 | 1,008 (88.0%) | 138 (12.0%) |
| $25,000 to $49,999 | 780 (90.7%) | 80 (9.3%) |
| $50,000 to $74,999 | 1,282 (89.6%) | 148 (10.3%) |
| $75,000 to $99,999 | 1,390 (72.0%) | 540 (28.0%) |
| $100,000 and over | 915 (85.1%) | 160 (14.9%) |
Public vs Private Health Insurance Coverage by Age in Union Gap
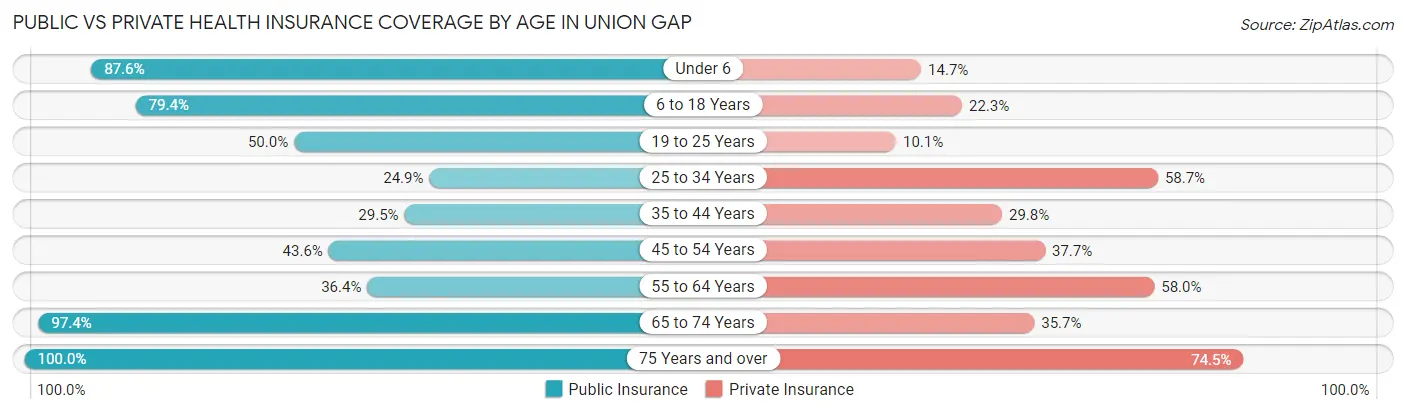
| Age Bracket | Public Insurance | Private Insurance |
| Under 6 | 595 (87.6%) | 100 (14.7%) |
| 6 to 18 Years | 1,120 (79.4%) | 315 (22.3%) |
| 19 to 25 Years | 303 (50.0%) | 61 (10.1%) |
| 25 to 34 Years | 215 (24.9%) | 507 (58.7%) |
| 35 to 44 Years | 244 (29.5%) | 246 (29.7%) |
| 45 to 54 Years | 284 (43.6%) | 246 (37.7%) |
| 55 to 64 Years | 273 (36.4%) | 435 (58.0%) |
| 65 to 74 Years | 379 (97.4%) | 139 (35.7%) |
| 75 Years and over | 263 (100.0%) | 196 (74.5%) |
| Total | 3,676 (57.1%) | 2,245 (34.8%) |
Disability Status by Sex by Age in Union Gap
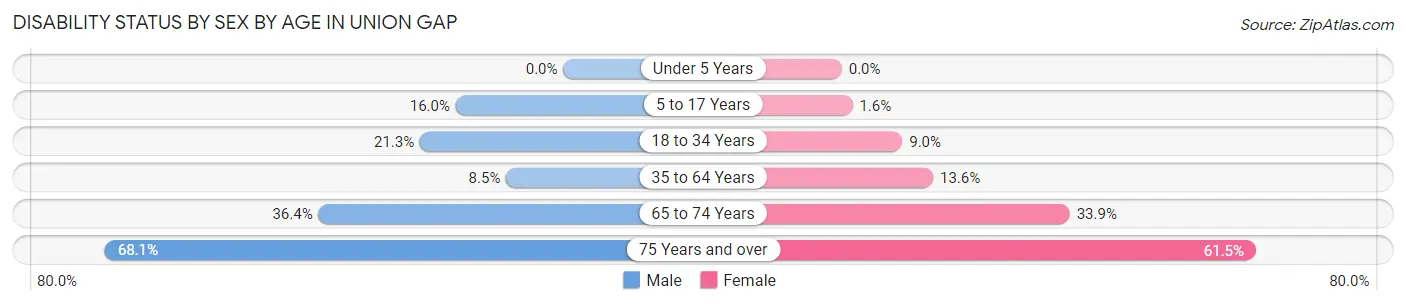
| Age Bracket | Male | Female |
| Under 5 Years | 0 (0.0%) | 0 (0.0%) |
| 5 to 17 Years | 84 (16.0%) | 12 (1.6%) |
| 18 to 34 Years | 190 (21.3%) | 73 (9.0%) |
| 35 to 64 Years | 102 (8.5%) | 139 (13.6%) |
| 65 to 74 Years | 48 (36.4%) | 87 (33.9%) |
| 75 Years and over | 96 (68.1%) | 75 (61.5%) |
Disability Class by Sex by Age in Union Gap
Disability Class: Hearing Difficulty
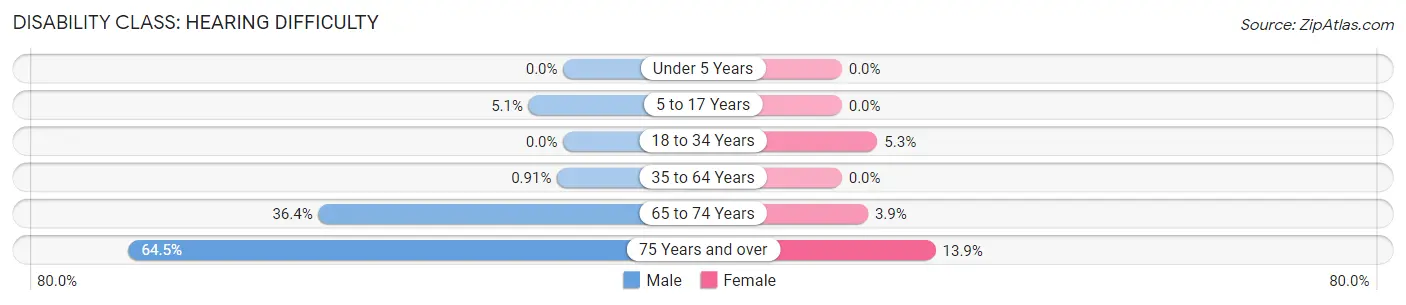
| Age Bracket | Male | Female |
| Under 5 Years | 0 (0.0%) | 0 (0.0%) |
| 5 to 17 Years | 27 (5.1%) | 0 (0.0%) |
| 18 to 34 Years | 0 (0.0%) | 43 (5.3%) |
| 35 to 64 Years | 11 (0.9%) | 0 (0.0%) |
| 65 to 74 Years | 48 (36.4%) | 10 (3.9%) |
| 75 Years and over | 91 (64.5%) | 17 (13.9%) |
Disability Class: Vision Difficulty
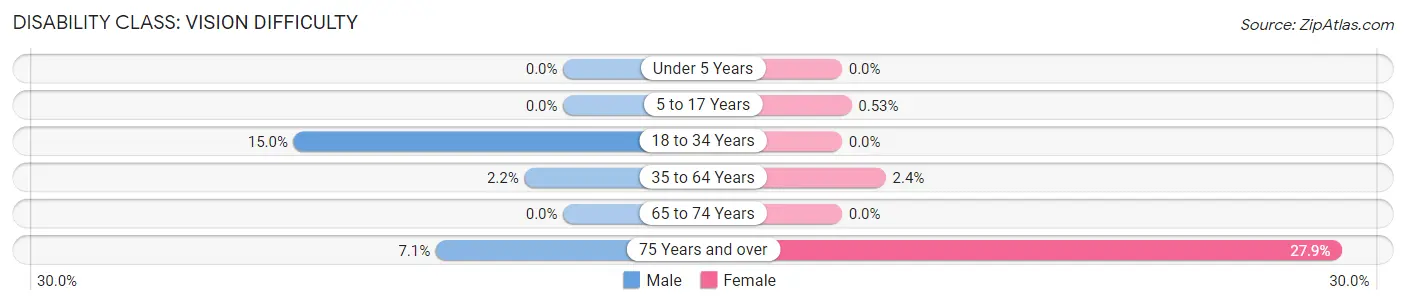
| Age Bracket | Male | Female |
| Under 5 Years | 0 (0.0%) | 0 (0.0%) |
| 5 to 17 Years | 0 (0.0%) | 4 (0.5%) |
| 18 to 34 Years | 134 (15.0%) | 0 (0.0%) |
| 35 to 64 Years | 26 (2.2%) | 25 (2.4%) |
| 65 to 74 Years | 0 (0.0%) | 0 (0.0%) |
| 75 Years and over | 10 (7.1%) | 34 (27.9%) |
Disability Class: Cognitive Difficulty
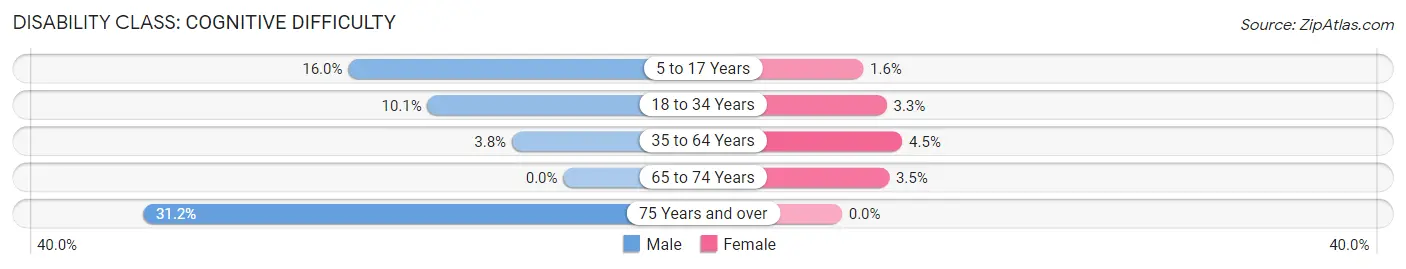
| Age Bracket | Male | Female |
| 5 to 17 Years | 84 (16.0%) | 12 (1.6%) |
| 18 to 34 Years | 90 (10.1%) | 27 (3.3%) |
| 35 to 64 Years | 46 (3.8%) | 46 (4.5%) |
| 65 to 74 Years | 0 (0.0%) | 9 (3.5%) |
| 75 Years and over | 44 (31.2%) | 0 (0.0%) |
Disability Class: Ambulatory Difficulty
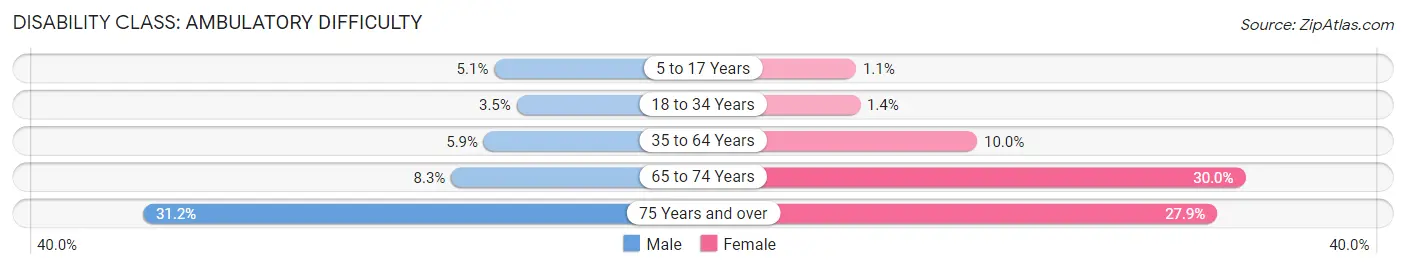
| Age Bracket | Male | Female |
| 5 to 17 Years | 27 (5.1%) | 8 (1.1%) |
| 18 to 34 Years | 31 (3.5%) | 11 (1.3%) |
| 35 to 64 Years | 71 (5.9%) | 103 (10.0%) |
| 65 to 74 Years | 11 (8.3%) | 77 (30.0%) |
| 75 Years and over | 44 (31.2%) | 34 (27.9%) |
Disability Class: Self-Care Difficulty
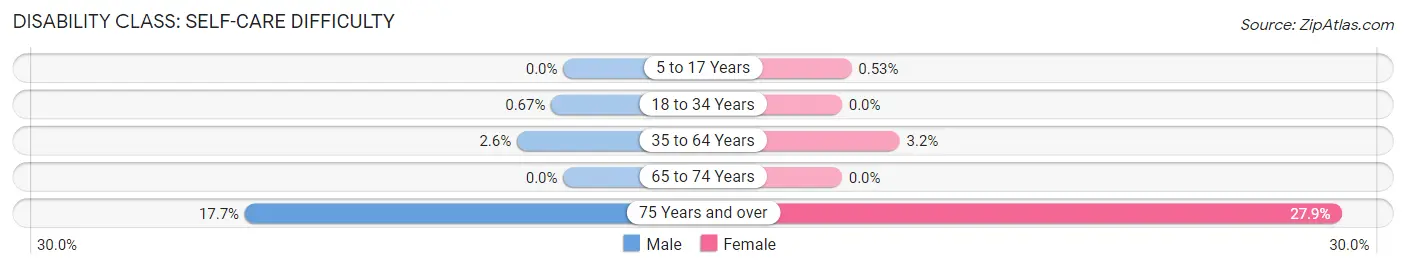
| Age Bracket | Male | Female |
| 5 to 17 Years | 0 (0.0%) | 4 (0.5%) |
| 18 to 34 Years | 6 (0.7%) | 0 (0.0%) |
| 35 to 64 Years | 31 (2.6%) | 33 (3.2%) |
| 65 to 74 Years | 0 (0.0%) | 0 (0.0%) |
| 75 Years and over | 25 (17.7%) | 34 (27.9%) |
Technology Access in Union Gap
Computing Device Access in Union Gap
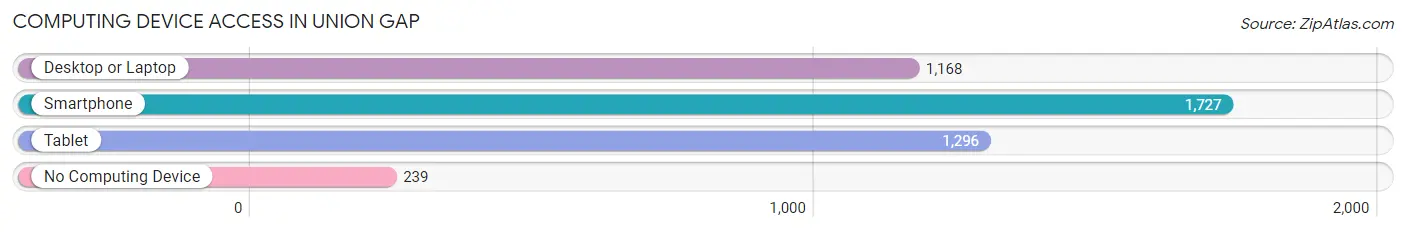
| Device Type | # Households | % Households |
| Desktop or Laptop | 1,168 | 56.8% |
| Smartphone | 1,727 | 83.9% |
| Tablet | 1,296 | 63.0% |
| No Computing Device | 239 | 11.6% |
| Total | 2,058 | 100.0% |
Internet Access in Union Gap
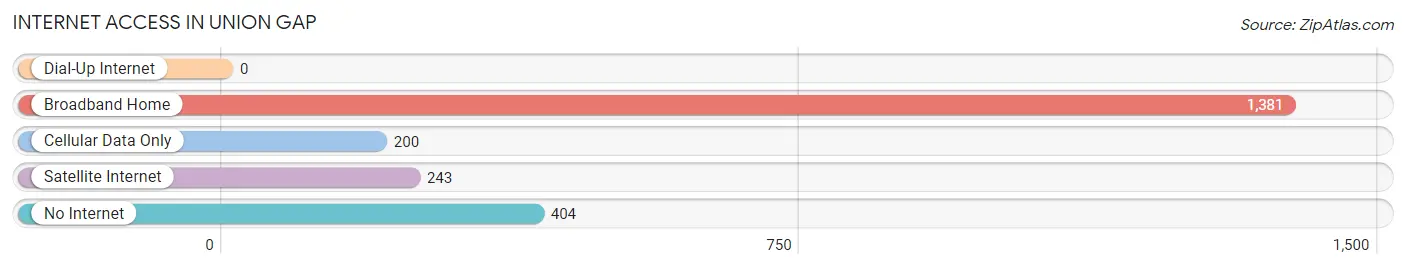
| Internet Type | # Households | % Households |
| Dial-Up Internet | 0 | 0.0% |
| Broadband Home | 1,381 | 67.1% |
| Cellular Data Only | 200 | 9.7% |
| Satellite Internet | 243 | 11.8% |
| No Internet | 404 | 19.6% |
| Total | 2,058 | 100.0% |
Union Gap Summary
Geography
Union Gap is a city located in Yakima County, Washington, United States. It is situated in the Yakima Valley, a region known for its agricultural production. The city is located at the confluence of the Naches and Yakima Rivers, and is surrounded by the Cascade Mountains to the west and the Columbia Plateau to the east. The city has a total area of 4.3 square miles, all of which is land.
History
Union Gap was founded in 1883 by the Union Pacific Railroad. The city was named after the gap in the Cascade Mountains that the railroad had to cross in order to reach the Yakima Valley. The city was incorporated in 1909 and has since grown to become the largest city in Yakima County.
Economy
Union Gap’s economy is largely based on agriculture. The city is home to several large farms, including the Yakima Valley Fruit and Vegetable Company, which is one of the largest producers of apples, pears, and cherries in the United States. The city is also home to several wineries, including the Yakima Valley Winery, which produces award-winning wines.
The city is also home to several manufacturing companies, including the Union Gap Manufacturing Company, which produces a variety of products, including furniture, clothing, and automotive parts. The city is also home to several retail stores, including the Union Gap Mall, which features a variety of stores and restaurants.
Demographics
As of the 2010 census, the population of Union Gap was 8,187. The racial makeup of the city was 79.3% White, 0.7% African American, 1.2% Native American, 0.7% Asian, 0.1% Pacific Islander, 15.2% from other races, and 3.0% from two or more races. Hispanic or Latino of any race were 24.3% of the population.
The median income for a household in the city was $37,917, and the median income for a family was $45,938. The per capita income for the city was $17,845. About 16.2% of families and 20.2% of the population were below the poverty line, including 28.2% of those under age 18 and 8.2% of those age 65 or over.
Conclusion
Union Gap is a city located in Yakima County, Washington, United States. It is situated in the Yakima Valley, a region known for its agricultural production. The city was founded in 1883 by the Union Pacific Railroad and has since grown to become the largest city in Yakima County. The city’s economy is largely based on agriculture, with several large farms and wineries located in the area. The city is also home to several manufacturing companies and retail stores. As of the 2010 census, the population of Union Gap was 8,187, with a median household income of $37,917 and a median family income of $45,938.
Common Questions
What is Per Capita Income in Union Gap?
Per Capita income in Union Gap is $21,667.
What is the Median Family Income in Union Gap?
Median Family Income in Union Gap is $58,681.
What is the Median Household income in Union Gap?
Median Household Income in Union Gap is $55,667.
What is Income or Wage Gap in Union Gap?
Income or Wage Gap in Union Gap is 19.4%.
Women in Union Gap earn 80.6 cents for every dollar earned by a man.
What is Inequality or Gini Index in Union Gap?
Inequality or Gini Index in Union Gap is 0.42.
What is the Total Population of Union Gap?
Total Population of Union Gap is 6,512.
What is the Total Male Population of Union Gap?
Total Male Population of Union Gap is 3,254.
What is the Total Female Population of Union Gap?
Total Female Population of Union Gap is 3,258.
What is the Ratio of Males per 100 Females in Union Gap?
There are 99.88 Males per 100 Females in Union Gap.
What is the Ratio of Females per 100 Males in Union Gap?
There are 100.12 Females per 100 Males in Union Gap.
What is the Median Population Age in Union Gap?
Median Population Age in Union Gap is 31.4 Years.
What is the Average Family Size in Union Gap
Average Family Size in Union Gap is 3.6 People.
What is the Average Household Size in Union Gap
Average Household Size in Union Gap is 3.1 People.
How Large is the Labor Force in Union Gap?
There are 3,039 People in the Labor Forcein in Union Gap.
What is the Percentage of People in the Labor Force in Union Gap?
61.6% of People are in the Labor Force in Union Gap.
What is the Unemployment Rate in Union Gap?
Unemployment Rate in Union Gap is 11.3%.