Clinton, WA Map & Demographics
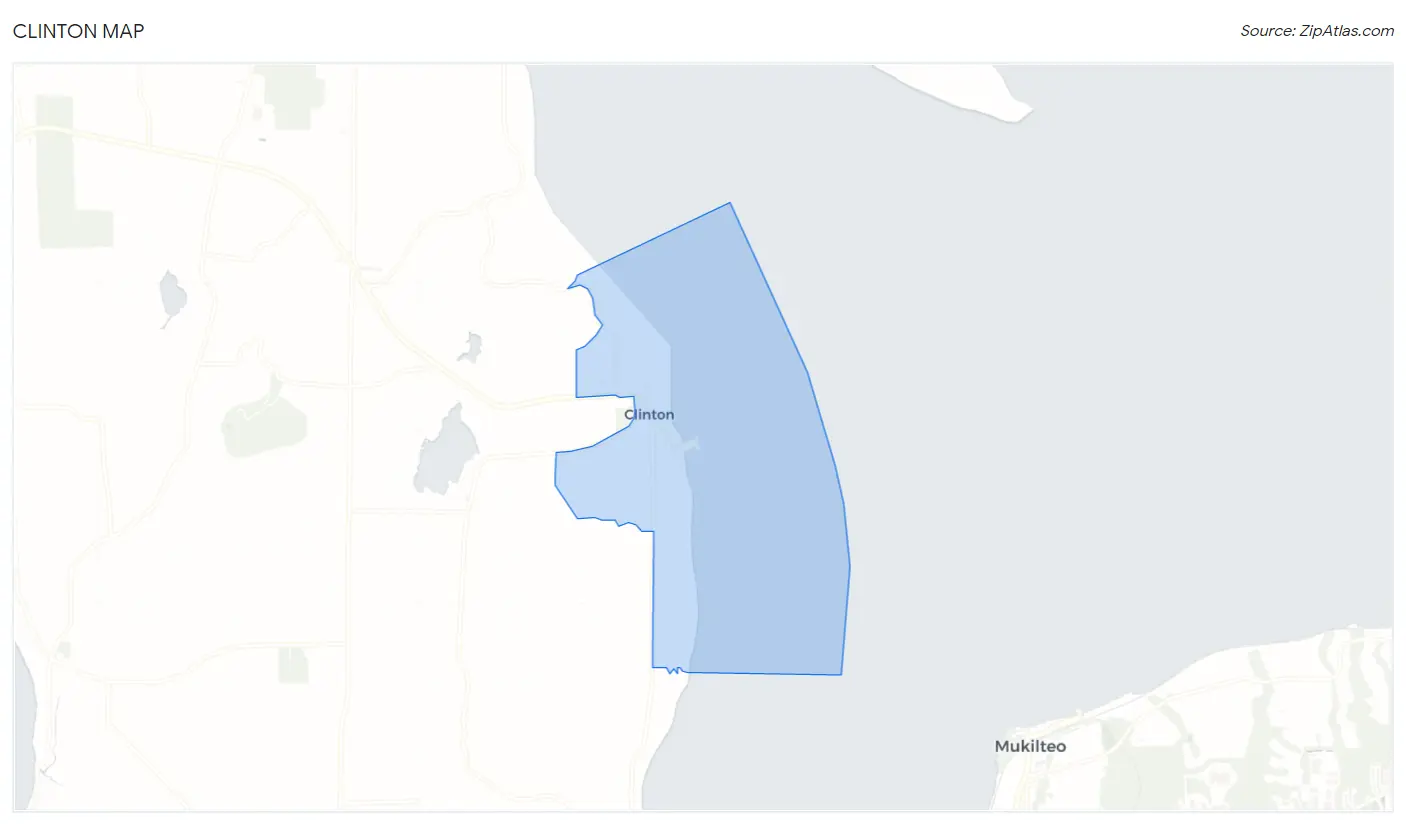
Clinton Map
Clinton Overview
$37,858
PER CAPITA INCOME
$84,327
AVG FAMILY INCOME
$69,570
AVG HOUSEHOLD INCOME
27.3%
WAGE / INCOME GAP [ % ]
72.7¢/ $1
WAGE / INCOME GAP [ $ ]
0.44
INEQUALITY / GINI INDEX
1,165
TOTAL POPULATION
534
MALE POPULATION
631
FEMALE POPULATION
84.63
MALES / 100 FEMALES
118.16
FEMALES / 100 MALES
49.5
MEDIAN AGE
3.0
AVG FAMILY SIZE
2.3
AVG HOUSEHOLD SIZE
476
LABOR FORCE [ PEOPLE ]
49.9%
PERCENT IN LABOR FORCE
7.4%
UNEMPLOYMENT RATE
Clinton Zip Codes
Clinton Area Codes
Income in Clinton
Income Overview in Clinton
Per Capita Income in Clinton is $37,858, while median incomes of families and households are $84,327 and $69,570 respectively.
| Characteristic | Number | Measure |
| Per Capita Income | 1,165 | $37,858 |
| Median Family Income | 292 | $84,327 |
| Mean Family Income | 292 | $114,176 |
| Median Household Income | 507 | $69,570 |
| Mean Household Income | 507 | $89,977 |
| Income Deficit | 292 | $0 |
| Wage / Income Gap (%) | 1,165 | 27.28% |
| Wage / Income Gap ($) | 1,165 | 72.72¢ per $1 |
| Gini / Inequality Index | 1,165 | 0.44 |
Earnings by Sex in Clinton
Average Earnings in Clinton are $49,400, $55,769 for men and $40,556 for women, a difference of 27.3%.
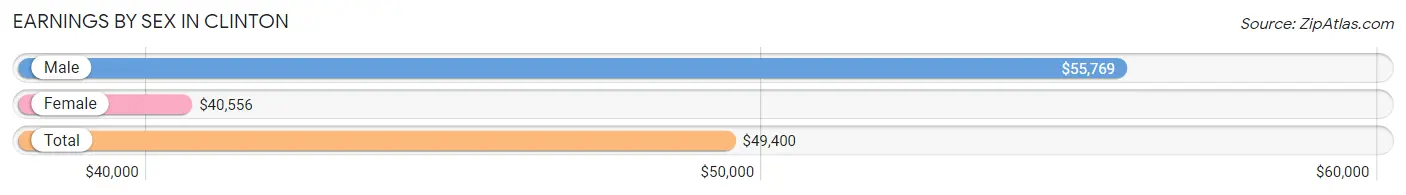
| Sex | Number | Average Earnings |
| Male | 302 (60.4%) | $55,769 |
| Female | 198 (39.6%) | $40,556 |
| Total | 500 (100.0%) | $49,400 |
Earnings by Sex by Income Bracket in Clinton
The most common earnings brackets in Clinton are $65,000 to $74,999 for men (82 | 27.2%) and $30,000 to $34,999 for women (34 | 17.2%).
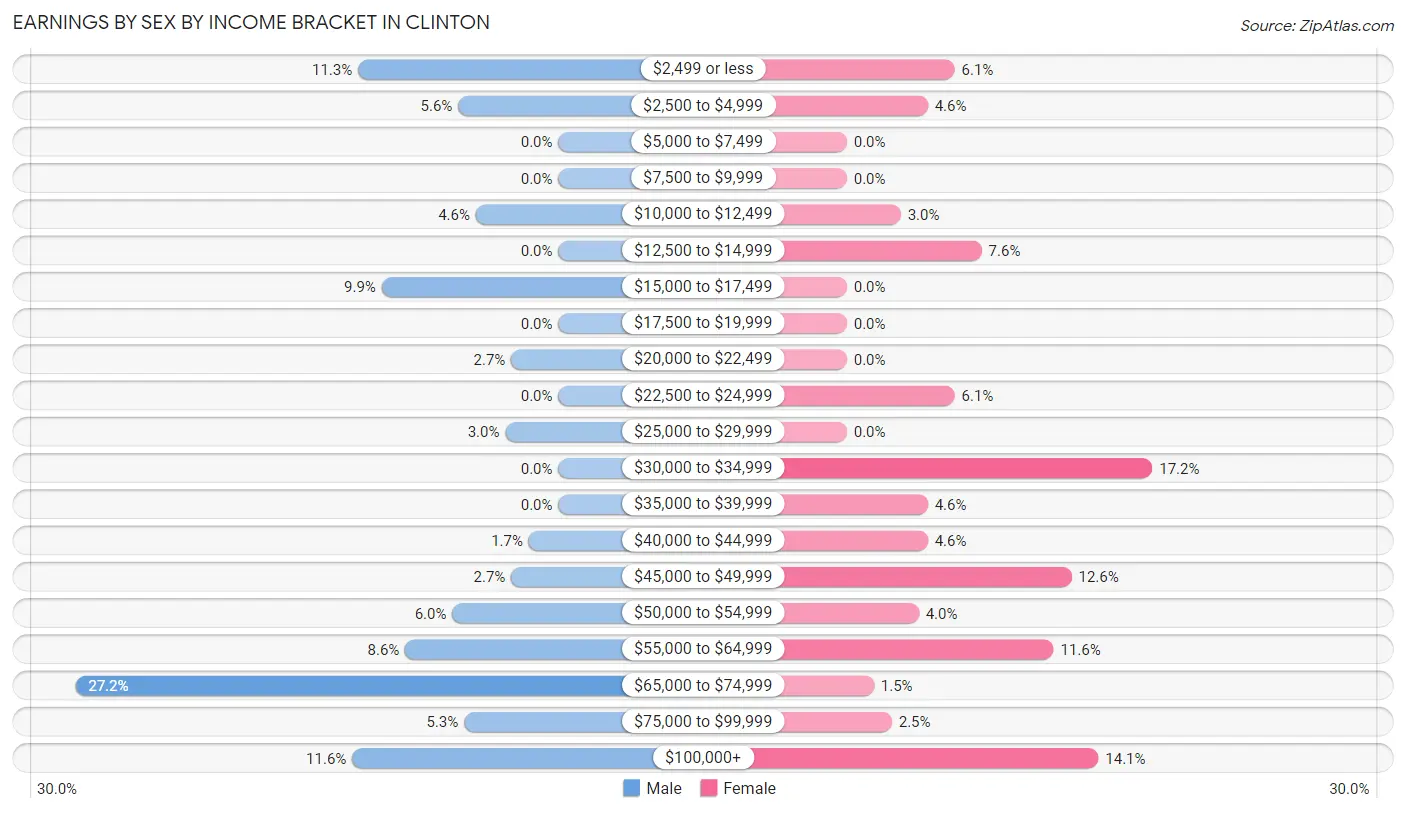
| Income | Male | Female |
| $2,499 or less | 34 (11.3%) | 12 (6.1%) |
| $2,500 to $4,999 | 17 (5.6%) | 9 (4.5%) |
| $5,000 to $7,499 | 0 (0.0%) | 0 (0.0%) |
| $7,500 to $9,999 | 0 (0.0%) | 0 (0.0%) |
| $10,000 to $12,499 | 14 (4.6%) | 6 (3.0%) |
| $12,500 to $14,999 | 0 (0.0%) | 15 (7.6%) |
| $15,000 to $17,499 | 30 (9.9%) | 0 (0.0%) |
| $17,500 to $19,999 | 0 (0.0%) | 0 (0.0%) |
| $20,000 to $22,499 | 8 (2.6%) | 0 (0.0%) |
| $22,500 to $24,999 | 0 (0.0%) | 12 (6.1%) |
| $25,000 to $29,999 | 9 (3.0%) | 0 (0.0%) |
| $30,000 to $34,999 | 0 (0.0%) | 34 (17.2%) |
| $35,000 to $39,999 | 0 (0.0%) | 9 (4.5%) |
| $40,000 to $44,999 | 5 (1.7%) | 9 (4.5%) |
| $45,000 to $49,999 | 8 (2.6%) | 25 (12.6%) |
| $50,000 to $54,999 | 18 (6.0%) | 8 (4.0%) |
| $55,000 to $64,999 | 26 (8.6%) | 23 (11.6%) |
| $65,000 to $74,999 | 82 (27.2%) | 3 (1.5%) |
| $75,000 to $99,999 | 16 (5.3%) | 5 (2.5%) |
| $100,000+ | 35 (11.6%) | 28 (14.1%) |
| Total | 302 (100.0%) | 198 (100.0%) |
Earnings by Sex by Educational Attainment in Clinton
Average earnings in Clinton are $68,828 for men and $38,611 for women, a difference of 43.9%. Men with an educational attainment of bachelor's degree enjoy the highest average annual earnings of $86,719, while those with college or associate's degree education earn the least with $53,750. Women with an educational attainment of graduate degree earn the most with the average annual earnings of $101,806, while those with high school diploma education have the smallest earnings of $33,816.
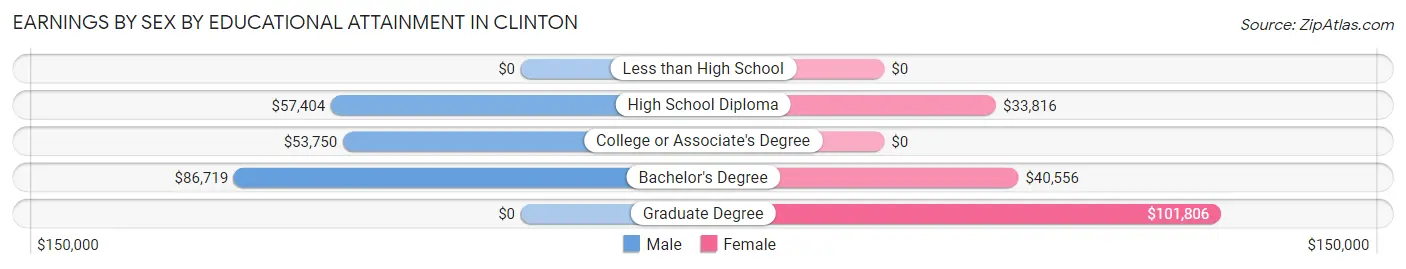
| Educational Attainment | Male Income | Female Income |
| Less than High School | - | - |
| High School Diploma | $57,404 | $33,816 |
| College or Associate's Degree | $53,750 | $0 |
| Bachelor's Degree | $86,719 | $40,556 |
| Graduate Degree | - | - |
| Total | $68,828 | $38,611 |
Family Income in Clinton
Family Income Brackets in Clinton
According to the Clinton family income data, there are 79 families falling into the $100,000 to $149,999 income range, which is the most common income bracket and makes up 27.1% of all families.
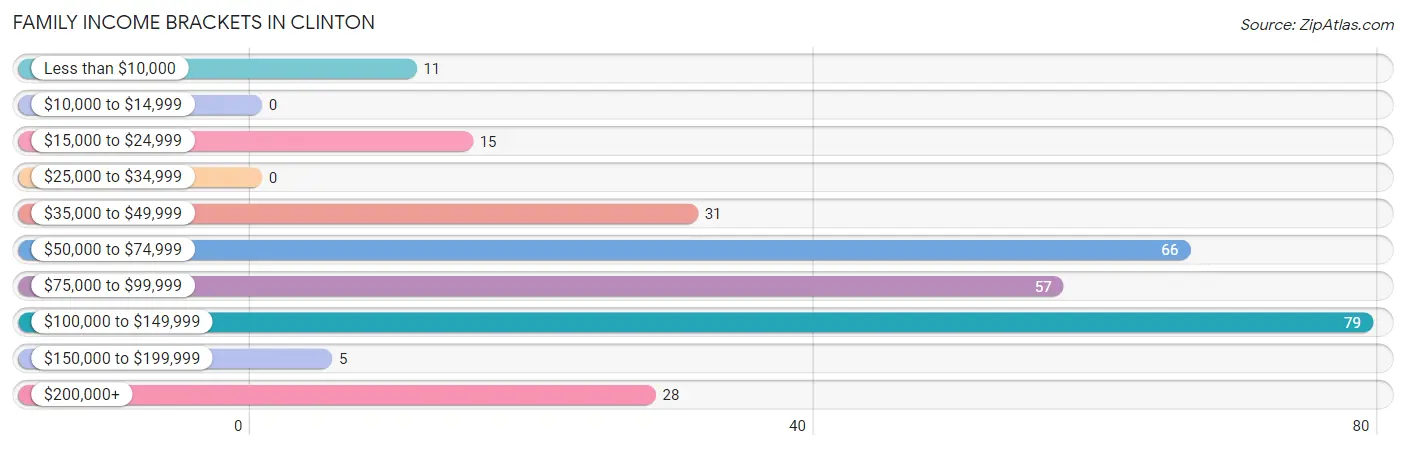
| Income Bracket | # Families | % Families |
| Less than $10,000 | 11 | 3.8% |
| $10,000 to $14,999 | 0 | 0.0% |
| $15,000 to $24,999 | 15 | 5.1% |
| $25,000 to $34,999 | 0 | 0.0% |
| $35,000 to $49,999 | 31 | 10.6% |
| $50,000 to $74,999 | 66 | 22.6% |
| $75,000 to $99,999 | 57 | 19.5% |
| $100,000 to $149,999 | 79 | 27.1% |
| $150,000 to $199,999 | 5 | 1.7% |
| $200,000+ | 28 | 9.6% |
Family Income by Famaliy Size in Clinton
2-person families (168 | 57.5%) account for the highest median family income in Clinton with $99,375 per family, while 2-person families (168 | 57.5%) have the highest median income of $49,688 per family member.
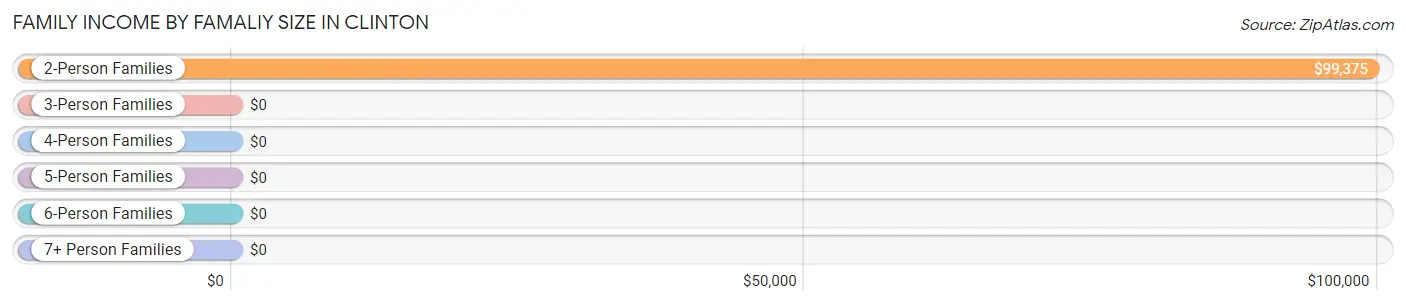
| Income Bracket | # Families | Median Income |
| 2-Person Families | 168 (57.5%) | $99,375 |
| 3-Person Families | 55 (18.8%) | $0 |
| 4-Person Families | 11 (3.8%) | $0 |
| 5-Person Families | 32 (11.0%) | $0 |
| 6-Person Families | 26 (8.9%) | $0 |
| 7+ Person Families | 0 (0.0%) | $0 |
| Total | 292 (100.0%) | $84,327 |
Family Income by Number of Earners in Clinton
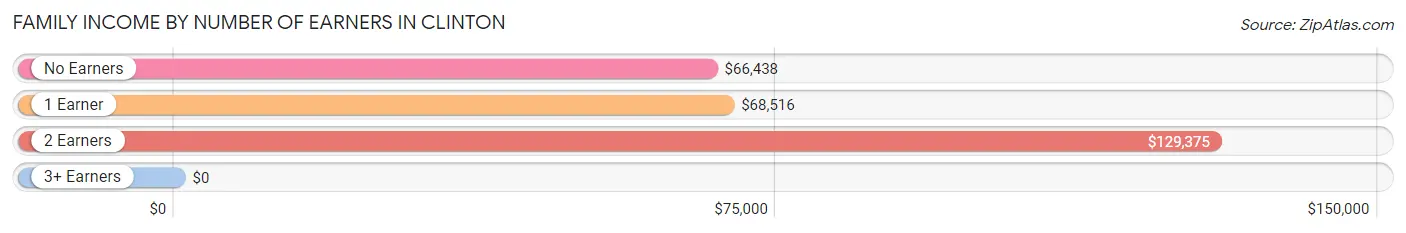
| Number of Earners | # Families | Median Income |
| No Earners | 75 (25.7%) | $66,438 |
| 1 Earner | 88 (30.1%) | $68,516 |
| 2 Earners | 126 (43.1%) | $129,375 |
| 3+ Earners | 3 (1.0%) | $0 |
| Total | 292 (100.0%) | $84,327 |
Household Income in Clinton
Household Income Brackets in Clinton
With 132 households falling in the category, the $50,000 to $74,999 income range is the most frequent in Clinton, accounting for 26.0% of all households. In contrast, only 6 households (1.2%) fall into the $25,000 to $34,999 income bracket, making it the least populous group.
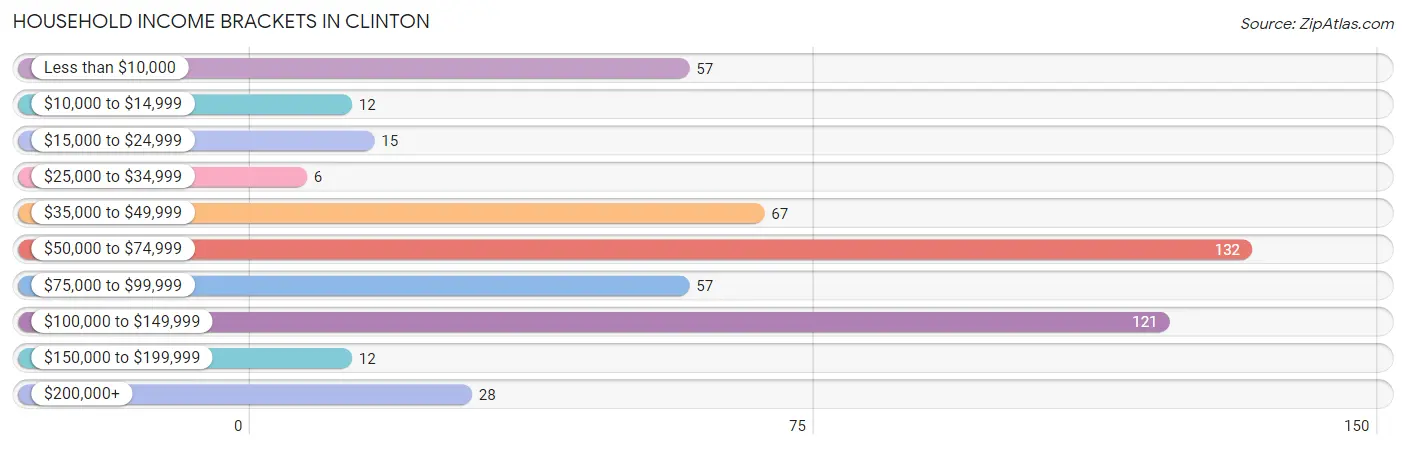
| Income Bracket | # Households | % Households |
| Less than $10,000 | 57 | 11.2% |
| $10,000 to $14,999 | 12 | 2.4% |
| $15,000 to $24,999 | 15 | 3.0% |
| $25,000 to $34,999 | 6 | 1.2% |
| $35,000 to $49,999 | 67 | 13.2% |
| $50,000 to $74,999 | 132 | 26.0% |
| $75,000 to $99,999 | 57 | 11.2% |
| $100,000 to $149,999 | 121 | 23.9% |
| $150,000 to $199,999 | 12 | 2.4% |
| $200,000+ | 28 | 5.5% |
Household Income by Householder Age in Clinton
The median household income in Clinton is $69,570, with the highest median household income of $106,838 found in the 45 to 64 years age bracket for the primary householder. A total of 105 households (20.7%) fall into this category. Meanwhile, the 15 to 24 years age bracket for the primary householder has the lowest median household income of $0, with 13 households (2.6%) in this group.
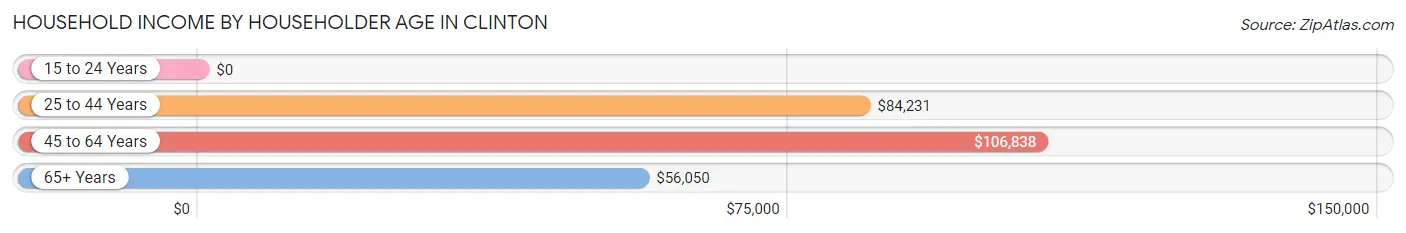
| Income Bracket | # Households | Median Income |
| 15 to 24 Years | 13 (2.6%) | $0 |
| 25 to 44 Years | 122 (24.1%) | $84,231 |
| 45 to 64 Years | 105 (20.7%) | $106,838 |
| 65+ Years | 267 (52.7%) | $56,050 |
| Total | 507 (100.0%) | $69,570 |
Poverty in Clinton
Income Below Poverty by Sex and Age in Clinton
With 17.2% poverty level for males and 9.5% for females among the residents of Clinton, 16 and 17 year old males and 25 to 34 year old females are the most vulnerable to poverty, with 9 males (100.0%) and 13 females (29.5%) in their respective age groups living below the poverty level.
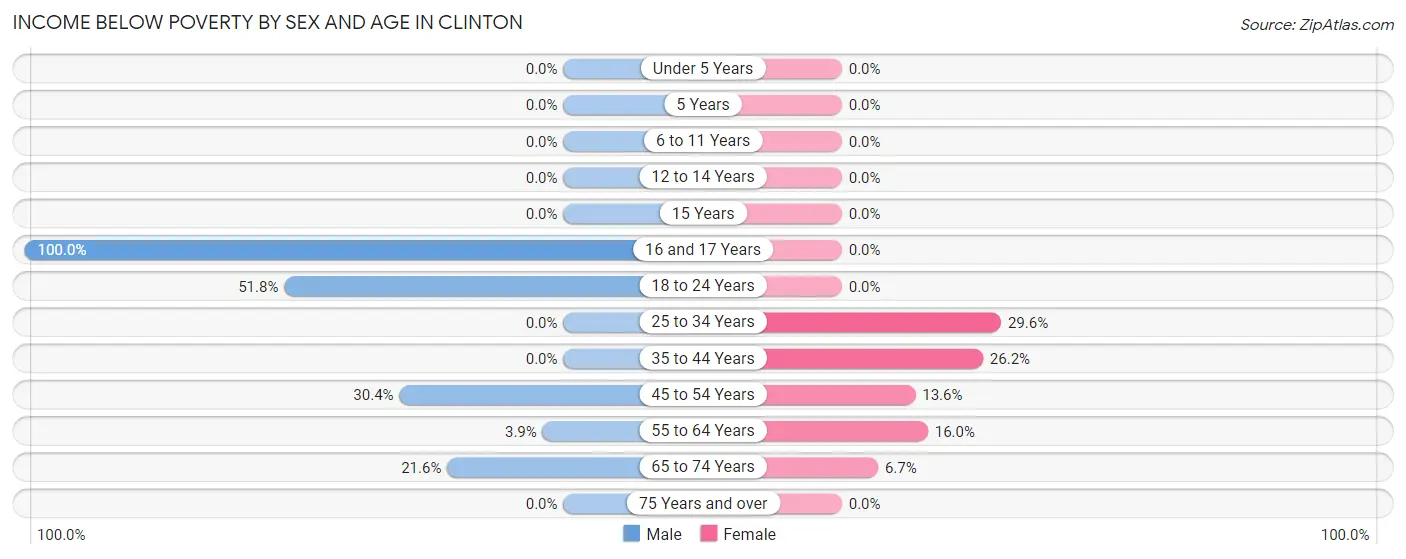
| Age Bracket | Male | Female |
| Under 5 Years | 0 (0.0%) | 0 (0.0%) |
| 5 Years | 0 (0.0%) | 0 (0.0%) |
| 6 to 11 Years | 0 (0.0%) | 0 (0.0%) |
| 12 to 14 Years | 0 (0.0%) | 0 (0.0%) |
| 15 Years | 0 (0.0%) | 0 (0.0%) |
| 16 and 17 Years | 9 (100.0%) | 0 (0.0%) |
| 18 to 24 Years | 43 (51.8%) | 0 (0.0%) |
| 25 to 34 Years | 0 (0.0%) | 13 (29.5%) |
| 35 to 44 Years | 0 (0.0%) | 11 (26.2%) |
| 45 to 54 Years | 14 (30.4%) | 12 (13.6%) |
| 55 to 64 Years | 1 (3.8%) | 15 (16.0%) |
| 65 to 74 Years | 25 (21.5%) | 9 (6.7%) |
| 75 Years and over | 0 (0.0%) | 0 (0.0%) |
| Total | 92 (17.2%) | 60 (9.5%) |
Income Above Poverty by Sex and Age in Clinton
According to the poverty statistics in Clinton, males aged under 5 years and females aged under 5 years are the age groups that are most secure financially, with 100.0% of males and 100.0% of females in these age groups living above the poverty line.
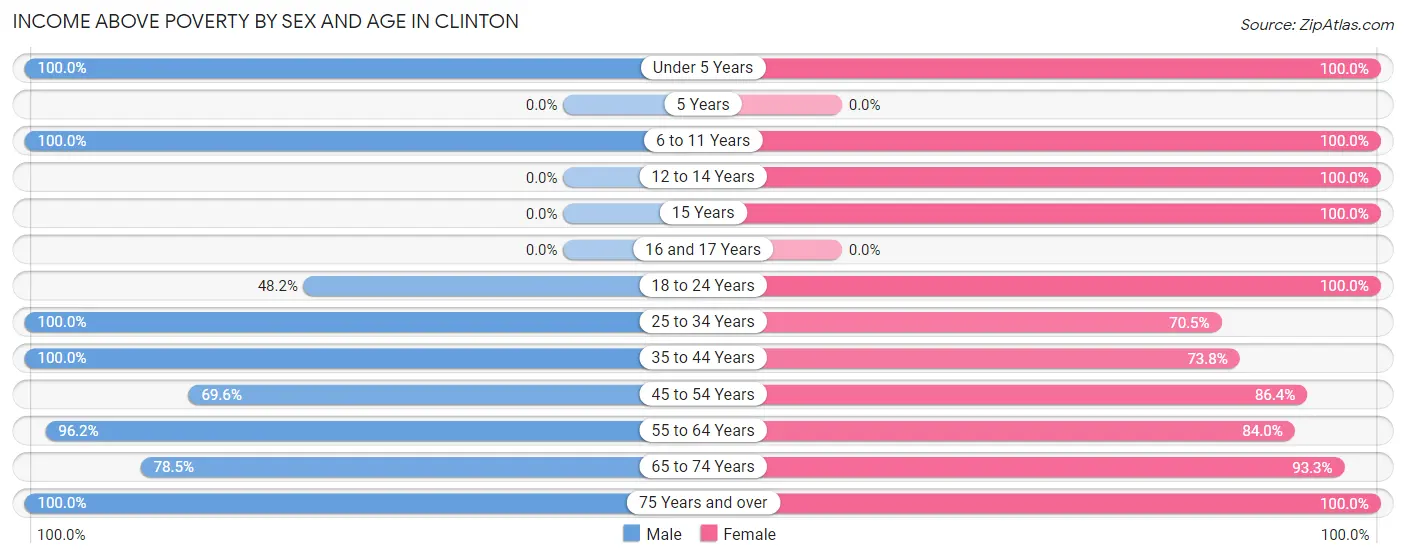
| Age Bracket | Male | Female |
| Under 5 Years | 19 (100.0%) | 43 (100.0%) |
| 5 Years | 0 (0.0%) | 0 (0.0%) |
| 6 to 11 Years | 50 (100.0%) | 15 (100.0%) |
| 12 to 14 Years | 0 (0.0%) | 45 (100.0%) |
| 15 Years | 0 (0.0%) | 40 (100.0%) |
| 16 and 17 Years | 0 (0.0%) | 0 (0.0%) |
| 18 to 24 Years | 40 (48.2%) | 14 (100.0%) |
| 25 to 34 Years | 58 (100.0%) | 31 (70.5%) |
| 35 to 44 Years | 71 (100.0%) | 31 (73.8%) |
| 45 to 54 Years | 32 (69.6%) | 76 (86.4%) |
| 55 to 64 Years | 25 (96.2%) | 79 (84.0%) |
| 65 to 74 Years | 91 (78.4%) | 125 (93.3%) |
| 75 Years and over | 56 (100.0%) | 72 (100.0%) |
| Total | 442 (82.8%) | 571 (90.5%) |
Income Below Poverty Among Married-Couple Families in Clinton
The poverty statistics for married-couple families in Clinton show that 4.2% or 11 of the total 261 families live below the poverty line. Families with 1 or 2 children have the highest poverty rate of 28.9%, comprising of 11 families. On the other hand, families with no children have the lowest poverty rate of 0.0%, which includes 0 families.
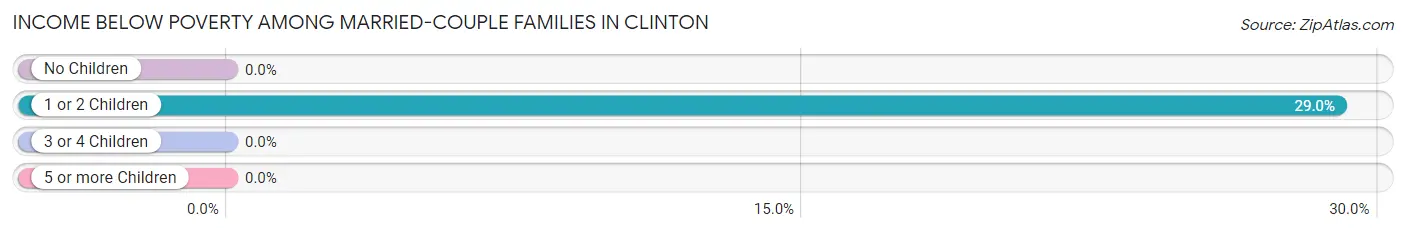
| Children | Above Poverty | Below Poverty |
| No Children | 165 (100.0%) | 0 (0.0%) |
| 1 or 2 Children | 27 (71.1%) | 11 (28.9%) |
| 3 or 4 Children | 58 (100.0%) | 0 (0.0%) |
| 5 or more Children | 0 (0.0%) | 0 (0.0%) |
| Total | 250 (95.8%) | 11 (4.2%) |
Income Below Poverty Among Single-Parent Households in Clinton
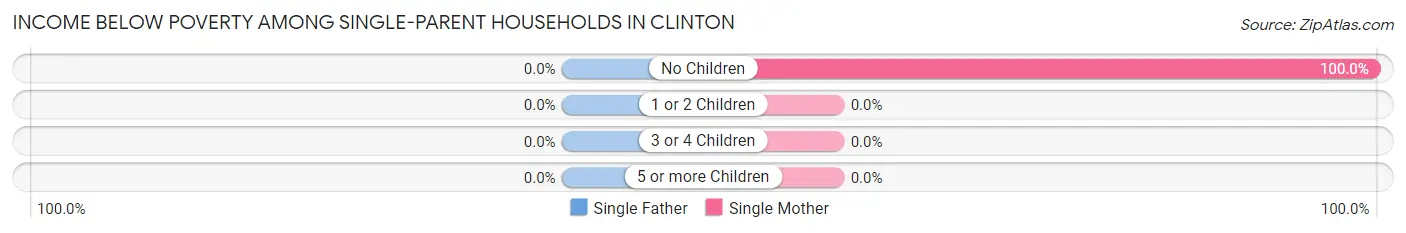
| Children | Single Father | Single Mother |
| No Children | 0 (0.0%) | 15 (100.0%) |
| 1 or 2 Children | 0 (0.0%) | 0 (0.0%) |
| 3 or 4 Children | 0 (0.0%) | 0 (0.0%) |
| 5 or more Children | 0 (0.0%) | 0 (0.0%) |
| Total | 0 (0.0%) | 15 (100.0%) |
Income Below Poverty Among Married-Couple vs Single-Parent Households in Clinton
The poverty data for Clinton shows that 11 of the married-couple family households (4.2%) and 15 of the single-parent households (48.4%) are living below the poverty level. Within the married-couple family households, those with 1 or 2 children have the highest poverty rate, with 11 households (28.9%) falling below the poverty line. Among the single-parent households, those with no children have the highest poverty rate, with 15 household (48.4%) living below poverty.
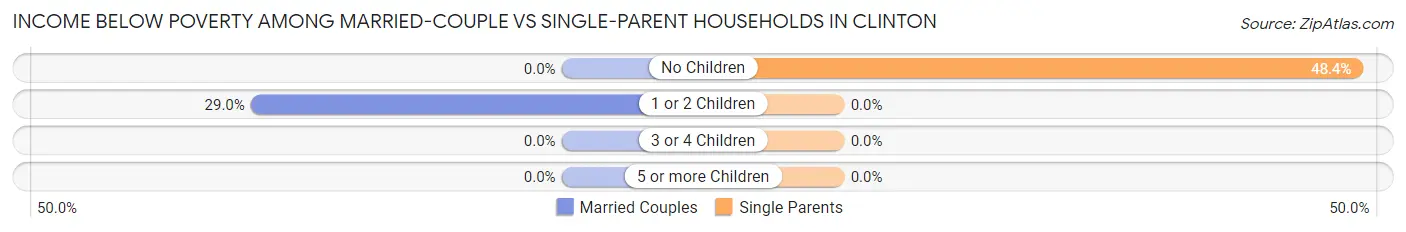
| Children | Married-Couple Families | Single-Parent Households |
| No Children | 0 (0.0%) | 15 (48.4%) |
| 1 or 2 Children | 11 (28.9%) | 0 (0.0%) |
| 3 or 4 Children | 0 (0.0%) | 0 (0.0%) |
| 5 or more Children | 0 (0.0%) | 0 (0.0%) |
| Total | 11 (4.2%) | 15 (48.4%) |
Race in Clinton
The most populous races in Clinton are White / Caucasian (1,012 | 86.9%), Two or more Races (84 | 7.2%), and Asian (66 | 5.7%).
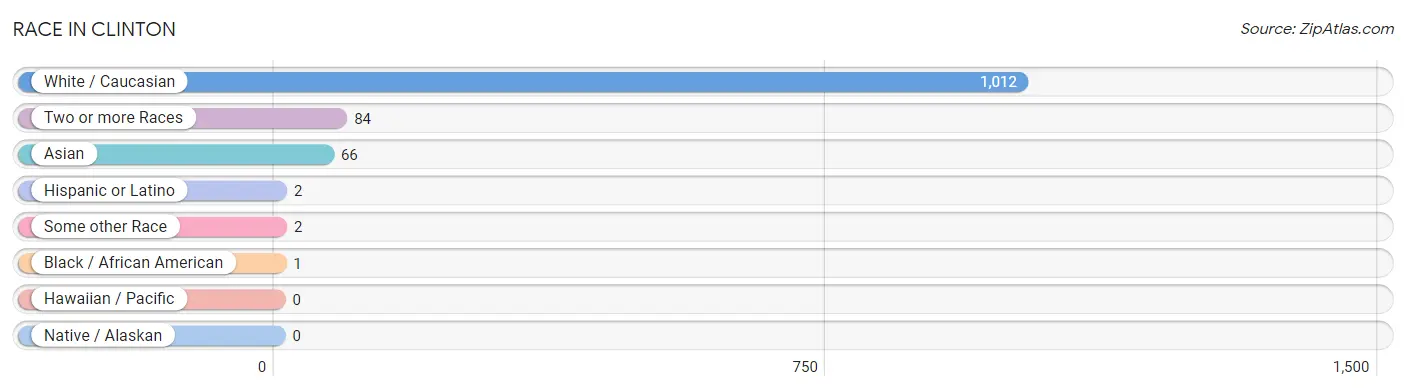
| Race | # Population | % Population |
| Asian | 66 | 5.7% |
| Black / African American | 1 | 0.1% |
| Hawaiian / Pacific | 0 | 0.0% |
| Hispanic or Latino | 2 | 0.2% |
| Native / Alaskan | 0 | 0.0% |
| White / Caucasian | 1,012 | 86.9% |
| Two or more Races | 84 | 7.2% |
| Some other Race | 2 | 0.2% |
| Total | 1,165 | 100.0% |
Ancestry in Clinton
The most populous ancestries reported in Clinton are German (310 | 26.6%), Irish (138 | 11.8%), English (117 | 10.0%), French Canadian (102 | 8.8%), and European (81 | 7.0%), together accounting for 64.2% of all Clinton residents.
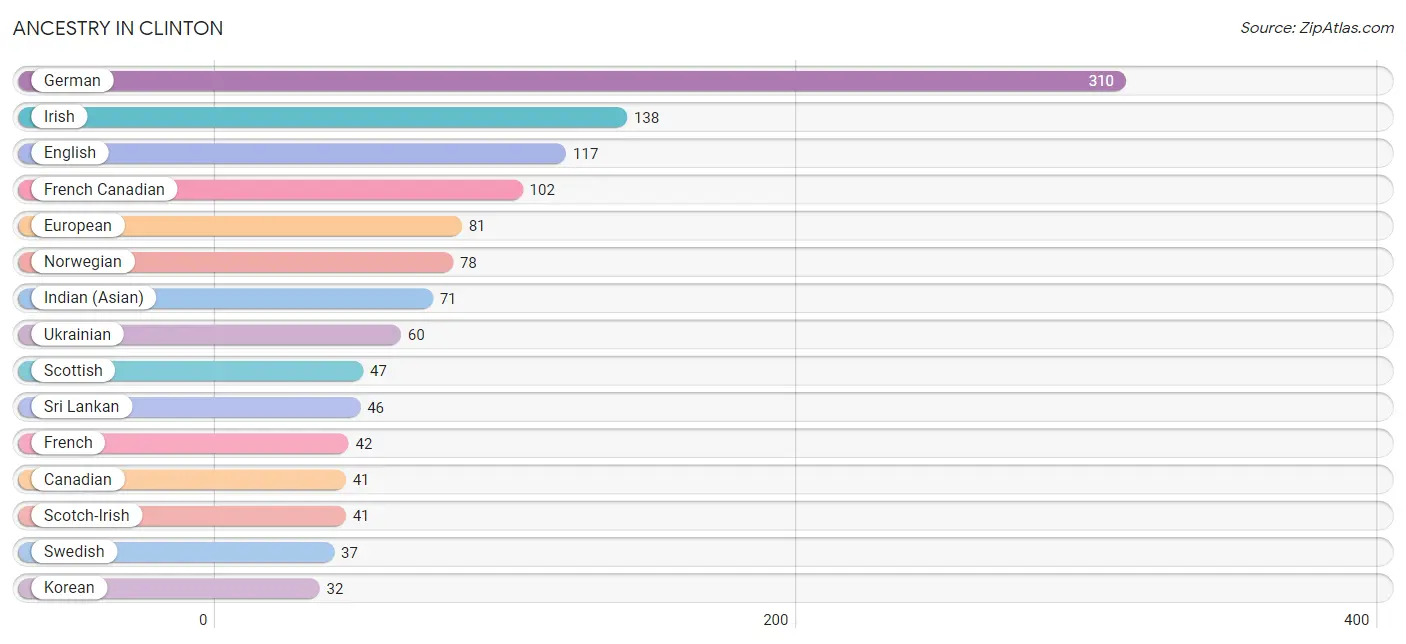
| Ancestry | # Population | % Population |
| American | 24 | 2.1% |
| Bhutanese | 20 | 1.7% |
| Canadian | 41 | 3.5% |
| Danish | 7 | 0.6% |
| English | 117 | 10.0% |
| European | 81 | 7.0% |
| French | 42 | 3.6% |
| French Canadian | 102 | 8.8% |
| German | 310 | 26.6% |
| Indian (Asian) | 71 | 6.1% |
| Irish | 138 | 11.8% |
| Italian | 30 | 2.6% |
| Korean | 32 | 2.8% |
| Mexican | 1 | 0.1% |
| Norwegian | 78 | 6.7% |
| Polish | 17 | 1.5% |
| Russian | 8 | 0.7% |
| Scandinavian | 8 | 0.7% |
| Scotch-Irish | 41 | 3.5% |
| Scottish | 47 | 4.0% |
| Sri Lankan | 46 | 4.0% |
| Swedish | 37 | 3.2% |
| Ukrainian | 60 | 5.1% | View All 23 Rows |
Immigrants in Clinton
The most numerous immigrant groups reported in Clinton came from Asia (29 | 2.5%), South Eastern Asia (29 | 2.5%), Vietnam (29 | 2.5%), Canada (22 | 1.9%), and Europe (16 | 1.4%), together accounting for 10.7% of all Clinton residents.
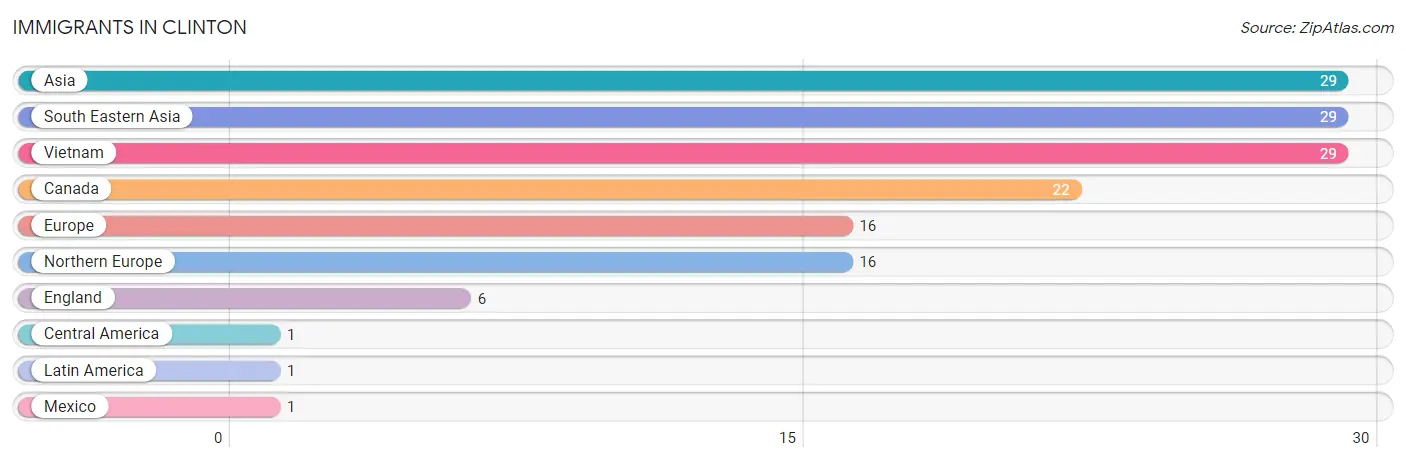
| Immigration Origin | # Population | % Population |
| Asia | 29 | 2.5% |
| Canada | 22 | 1.9% |
| Central America | 1 | 0.1% |
| England | 6 | 0.5% |
| Europe | 16 | 1.4% |
| Latin America | 1 | 0.1% |
| Mexico | 1 | 0.1% |
| Northern Europe | 16 | 1.4% |
| South Eastern Asia | 29 | 2.5% |
| Vietnam | 29 | 2.5% | View All 10 Rows |
Sex and Age in Clinton
Sex and Age in Clinton
The most populous age groups in Clinton are 20 to 24 Years (83 | 15.5%) for men and 65 to 69 Years (73 | 11.6%) for women.
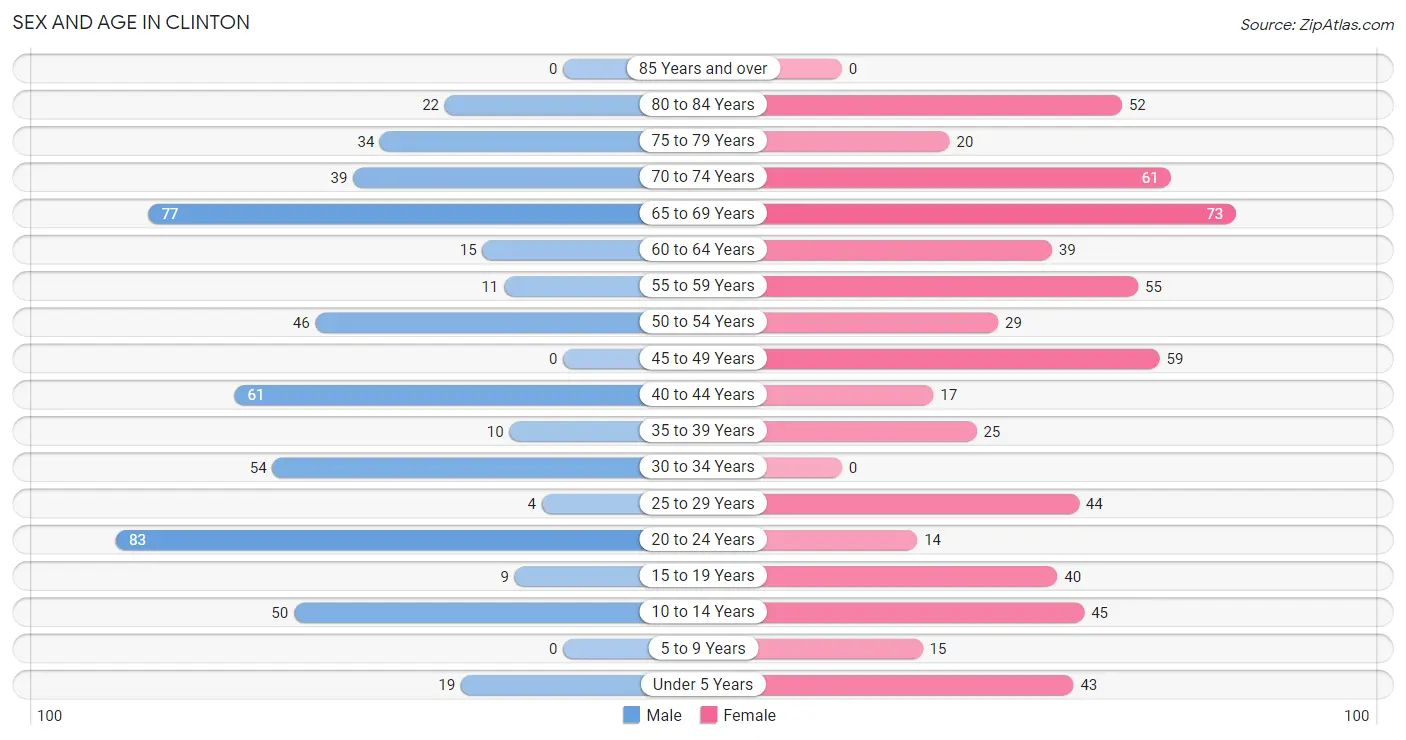
| Age Bracket | Male | Female |
| Under 5 Years | 19 (3.6%) | 43 (6.8%) |
| 5 to 9 Years | 0 (0.0%) | 15 (2.4%) |
| 10 to 14 Years | 50 (9.4%) | 45 (7.1%) |
| 15 to 19 Years | 9 (1.7%) | 40 (6.3%) |
| 20 to 24 Years | 83 (15.5%) | 14 (2.2%) |
| 25 to 29 Years | 4 (0.7%) | 44 (7.0%) |
| 30 to 34 Years | 54 (10.1%) | 0 (0.0%) |
| 35 to 39 Years | 10 (1.9%) | 25 (4.0%) |
| 40 to 44 Years | 61 (11.4%) | 17 (2.7%) |
| 45 to 49 Years | 0 (0.0%) | 59 (9.3%) |
| 50 to 54 Years | 46 (8.6%) | 29 (4.6%) |
| 55 to 59 Years | 11 (2.1%) | 55 (8.7%) |
| 60 to 64 Years | 15 (2.8%) | 39 (6.2%) |
| 65 to 69 Years | 77 (14.4%) | 73 (11.6%) |
| 70 to 74 Years | 39 (7.3%) | 61 (9.7%) |
| 75 to 79 Years | 34 (6.4%) | 20 (3.2%) |
| 80 to 84 Years | 22 (4.1%) | 52 (8.2%) |
| 85 Years and over | 0 (0.0%) | 0 (0.0%) |
| Total | 534 (100.0%) | 631 (100.0%) |
Families and Households in Clinton
Median Family Size in Clinton
The median family size in Clinton is 3.04 persons per family, with married-couple families (261 | 89.4%) accounting for the largest median family size of 3.04 persons per family. On the other hand, single male/father families (16 | 5.5%) represent the smallest median family size with 3.00 persons per family.
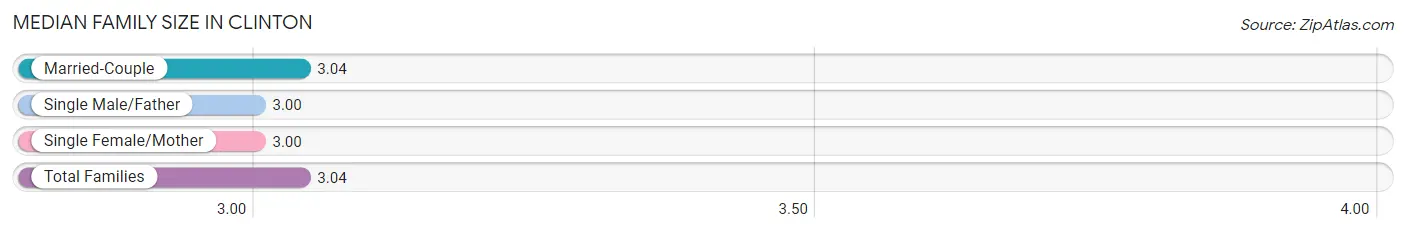
| Family Type | # Families | Family Size |
| Married-Couple | 261 (89.4%) | 3.04 |
| Single Male/Father | 16 (5.5%) | 3.00 |
| Single Female/Mother | 15 (5.1%) | 3.00 |
| Total Families | 292 (100.0%) | 3.04 |
Median Household Size in Clinton
The median household size in Clinton is 2.29 persons per household, with single male/father households (16 | 3.2%) accounting for the largest median household size of 4.19 persons per household. non-family households (215 | 42.4%) represent the smallest median household size with 1.13 persons per household.
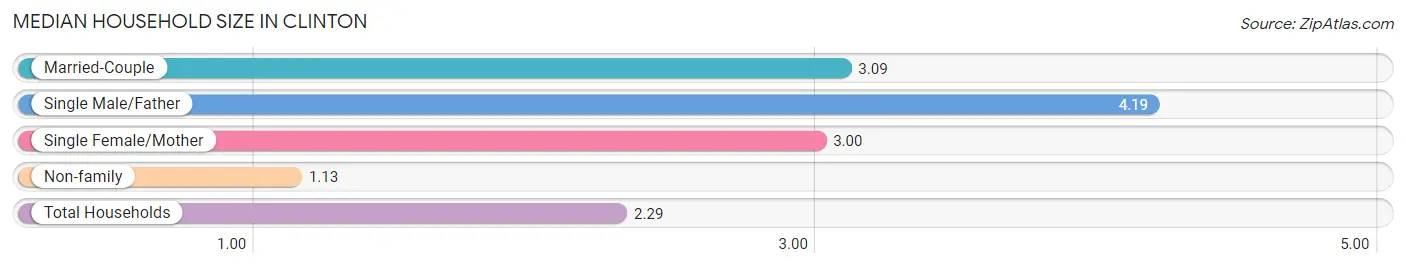
| Household Type | # Households | Household Size |
| Married-Couple | 261 (51.5%) | 3.09 |
| Single Male/Father | 16 (3.2%) | 4.19 |
| Single Female/Mother | 15 (3.0%) | 3.00 |
| Non-family | 215 (42.4%) | 1.13 |
| Total Households | 507 (100.0%) | 2.29 |
Household Size by Marriage Status in Clinton
Out of a total of 507 households in Clinton, 292 (57.6%) are family households, while 215 (42.4%) are nonfamily households. The most numerous type of family households are 2-person households, comprising 168, and the most common type of nonfamily households are 1-person households, comprising 182.
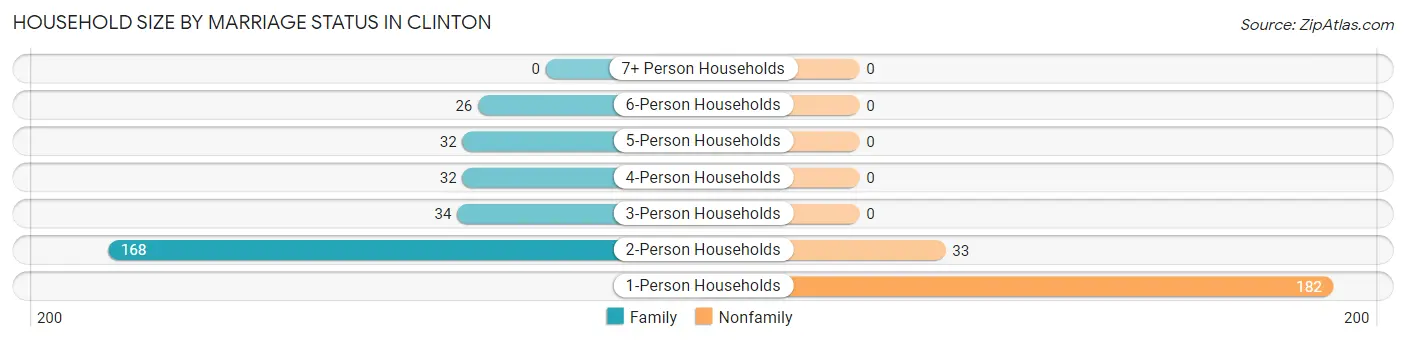
| Household Size | Family Households | Nonfamily Households |
| 1-Person Households | - | 182 (35.9%) |
| 2-Person Households | 168 (33.1%) | 33 (6.5%) |
| 3-Person Households | 34 (6.7%) | 0 (0.0%) |
| 4-Person Households | 32 (6.3%) | 0 (0.0%) |
| 5-Person Households | 32 (6.3%) | 0 (0.0%) |
| 6-Person Households | 26 (5.1%) | 0 (0.0%) |
| 7+ Person Households | 0 (0.0%) | 0 (0.0%) |
| Total | 292 (57.6%) | 215 (42.4%) |
Female Fertility in Clinton
Fertility by Age in Clinton
Average fertility rate in Clinton is 136.0 births per 1,000 women. Women in the age bracket of 20 to 34 years have the highest fertility rate with 466.0 births per 1,000 women. Women in the age bracket of 20 to 34 years acount for 100.0% of all women with births.
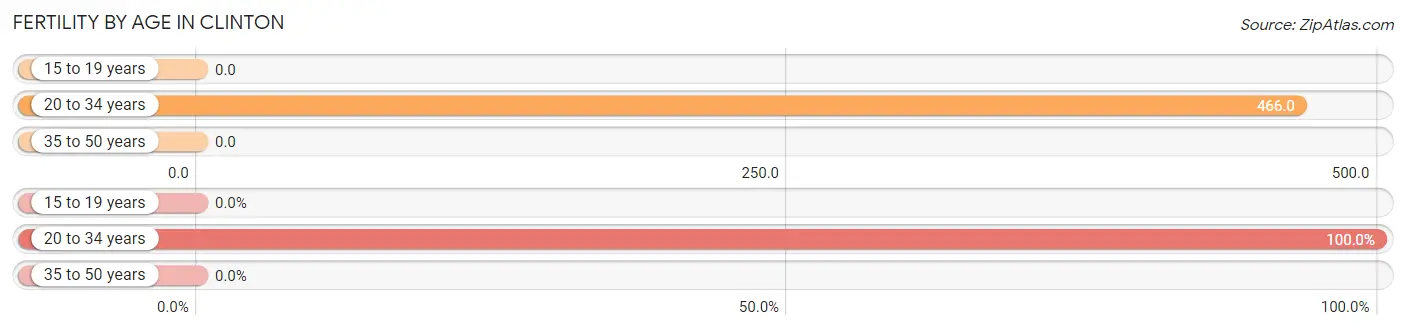
| Age Bracket | Women with Births | Births / 1,000 Women |
| 15 to 19 years | 0 (0.0%) | 0.0 |
| 20 to 34 years | 27 (100.0%) | 466.0 |
| 35 to 50 years | 0 (0.0%) | 0.0 |
| Total | 27 (100.0%) | 136.0 |
Fertility by Age by Marriage Status in Clinton
96.3% of women with births (27) in Clinton are married. The highest percentage of unmarried women with births falls into 20 to 34 years age bracket with 3.7% of them unmarried at the time of birth, while the lowest percentage of unmarried women with births belong to 20 to 34 years age bracket with 3.7% of them unmarried.
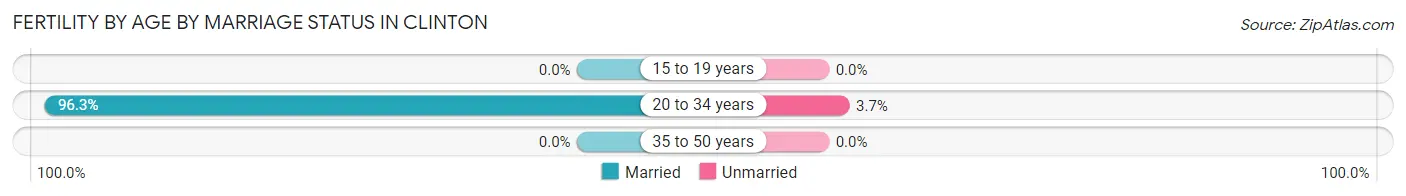
| Age Bracket | Married | Unmarried |
| 15 to 19 years | 0 (0.0%) | 0 (0.0%) |
| 20 to 34 years | 26 (96.3%) | 1 (3.7%) |
| 35 to 50 years | 0 (0.0%) | 0 (0.0%) |
| Total | 26 (96.3%) | 1 (3.7%) |
Fertility by Education in Clinton
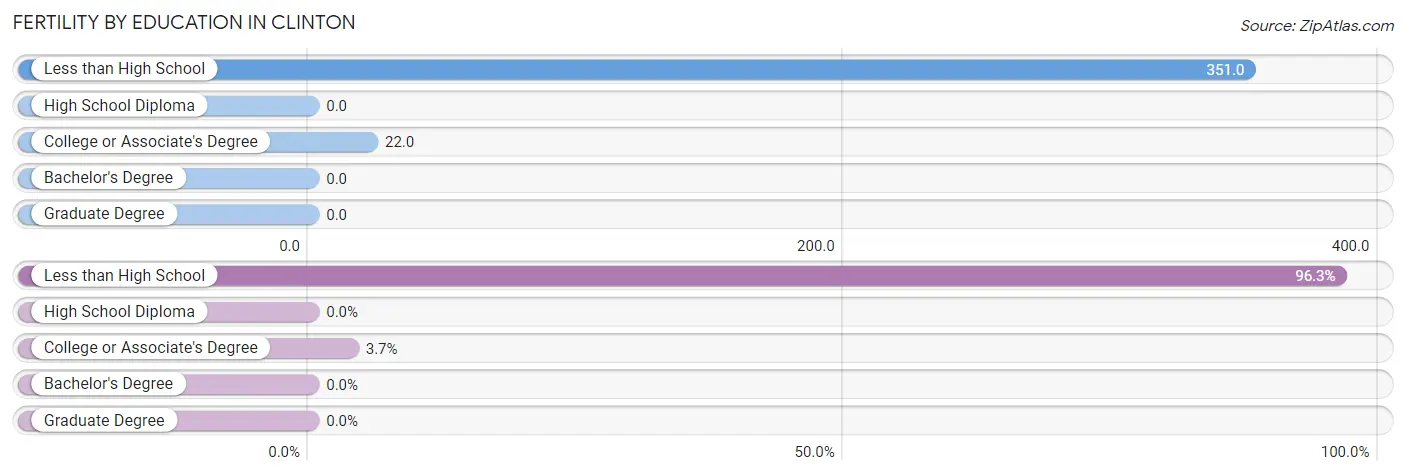
| Educational Attainment | Women with Births | Births / 1,000 Women |
| Less than High School | 26 (96.3%) | 351.0 |
| High School Diploma | 0 (0.0%) | 0.0 |
| College or Associate's Degree | 1 (3.7%) | 22.0 |
| Bachelor's Degree | 0 (0.0%) | 0.0 |
| Graduate Degree | 0 (0.0%) | 0.0 |
| Total | 27 (100.0%) | 136.0 |
Fertility by Education by Marriage Status in Clinton
3.7% of women with births in Clinton are unmarried. Women with the educational attainment of less than high school are most likely to be married with 100.0% of them married at childbirth, while women with the educational attainment of college or associate's degree are least likely to be married with 100.0% of them unmarried at childbirth.
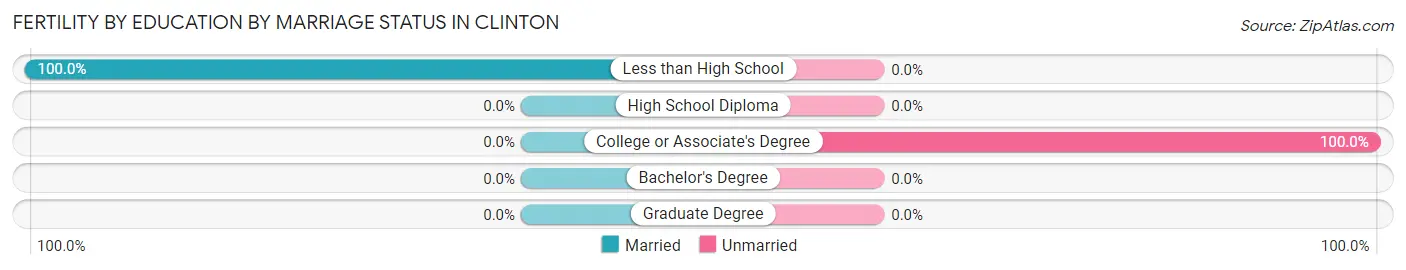
| Educational Attainment | Married | Unmarried |
| Less than High School | 26 (100.0%) | 0 (0.0%) |
| High School Diploma | 0 (0.0%) | 0 (0.0%) |
| College or Associate's Degree | 0 (0.0%) | 1 (100.0%) |
| Bachelor's Degree | 0 (0.0%) | 0 (0.0%) |
| Graduate Degree | 0 (0.0%) | 0 (0.0%) |
| Total | 26 (96.3%) | 1 (3.7%) |
Employment Characteristics in Clinton
Employment by Class of Employer in Clinton
Among the 435 employed individuals in Clinton, private company employees (236 | 54.2%), state government employees (53 | 12.2%), and self-employed (not incorporated) (49 | 11.3%) make up the most common classes of employment.
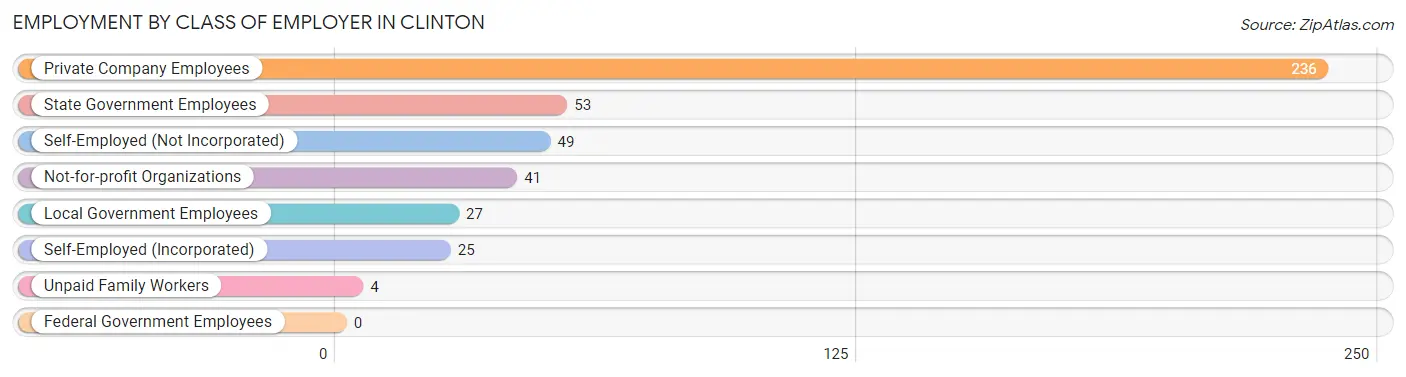
| Employer Class | # Employees | % Employees |
| Private Company Employees | 236 | 54.2% |
| Self-Employed (Incorporated) | 25 | 5.8% |
| Self-Employed (Not Incorporated) | 49 | 11.3% |
| Not-for-profit Organizations | 41 | 9.4% |
| Local Government Employees | 27 | 6.2% |
| State Government Employees | 53 | 12.2% |
| Federal Government Employees | 0 | 0.0% |
| Unpaid Family Workers | 4 | 0.9% |
| Total | 435 | 100.0% |
Employment Status by Age in Clinton
According to the labor force statistics for Clinton, out of the total population over 16 years of age (953), 49.9% or 476 individuals are in the labor force, with 7.4% or 35 of them unemployed. The age group with the highest labor force participation rate is 30 to 34 years, with 100.0% or 54 individuals in the labor force. Within the labor force, the 20 to 24 years age range has the highest percentage of unemployed individuals, with 40.5% or 34 of them being unemployed.
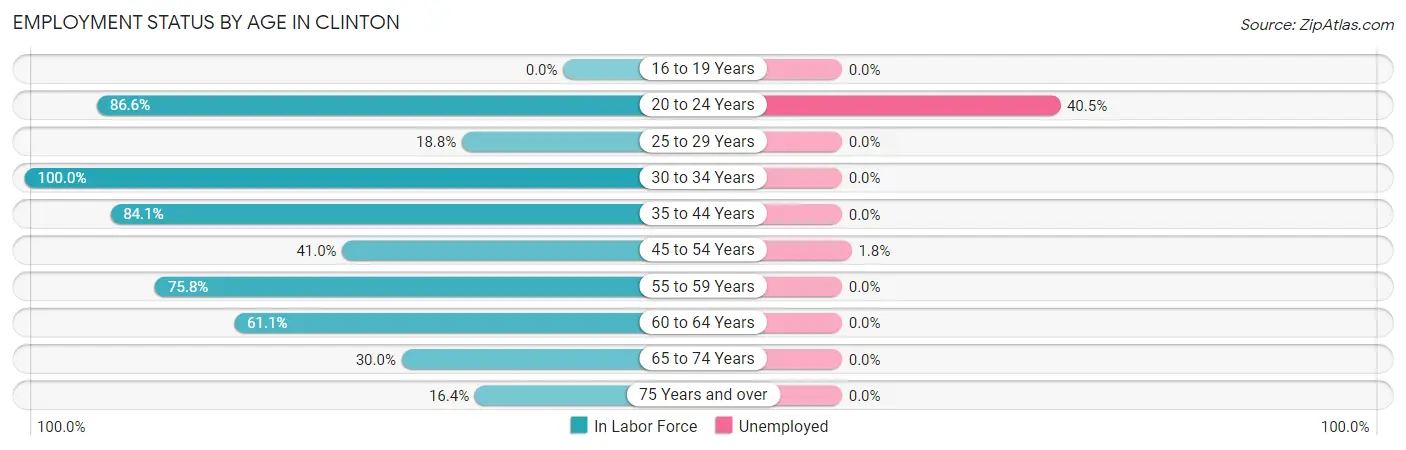
| Age Bracket | In Labor Force | Unemployed |
| 16 to 19 Years | 0 (0.0%) | 0 (0.0%) |
| 20 to 24 Years | 84 (86.6%) | 34 (40.5%) |
| 25 to 29 Years | 9 (18.8%) | 0 (0.0%) |
| 30 to 34 Years | 54 (100.0%) | 0 (0.0%) |
| 35 to 44 Years | 95 (84.1%) | 0 (0.0%) |
| 45 to 54 Years | 55 (41.0%) | 1 (1.8%) |
| 55 to 59 Years | 50 (75.8%) | 0 (0.0%) |
| 60 to 64 Years | 33 (61.1%) | 0 (0.0%) |
| 65 to 74 Years | 75 (30.0%) | 0 (0.0%) |
| 75 Years and over | 21 (16.4%) | 0 (0.0%) |
| Total | 476 (49.9%) | 35 (7.4%) |
Employment Status by Educational Attainment in Clinton
According to labor force statistics for Clinton, 63.1% of individuals (296) out of the total population between 25 and 64 years of age (469) are in the labor force, with 0.3% or 1 of them being unemployed. The group with the highest labor force participation rate are those with the educational attainment of high school diploma, with 80.9% or 110 individuals in the labor force. Within the labor force, individuals with college / associate degree education have the highest percentage of unemployment, with 2.5% or 1 of them being unemployed.
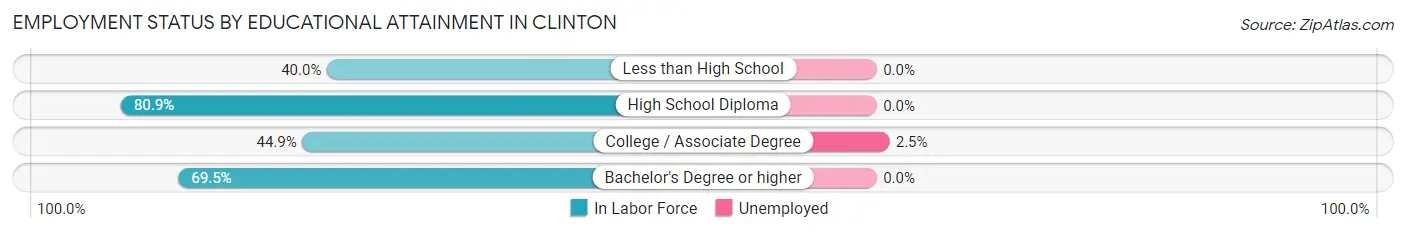
| Educational Attainment | In Labor Force | Unemployed |
| Less than High School | 32 (40.0%) | 0 (0.0%) |
| High School Diploma | 110 (80.9%) | 0 (0.0%) |
| College / Associate Degree | 40 (44.9%) | 2 (2.5%) |
| Bachelor's Degree or higher | 114 (69.5%) | 0 (0.0%) |
| Total | 296 (63.1%) | 1 (0.3%) |
Employment Occupations by Sex in Clinton
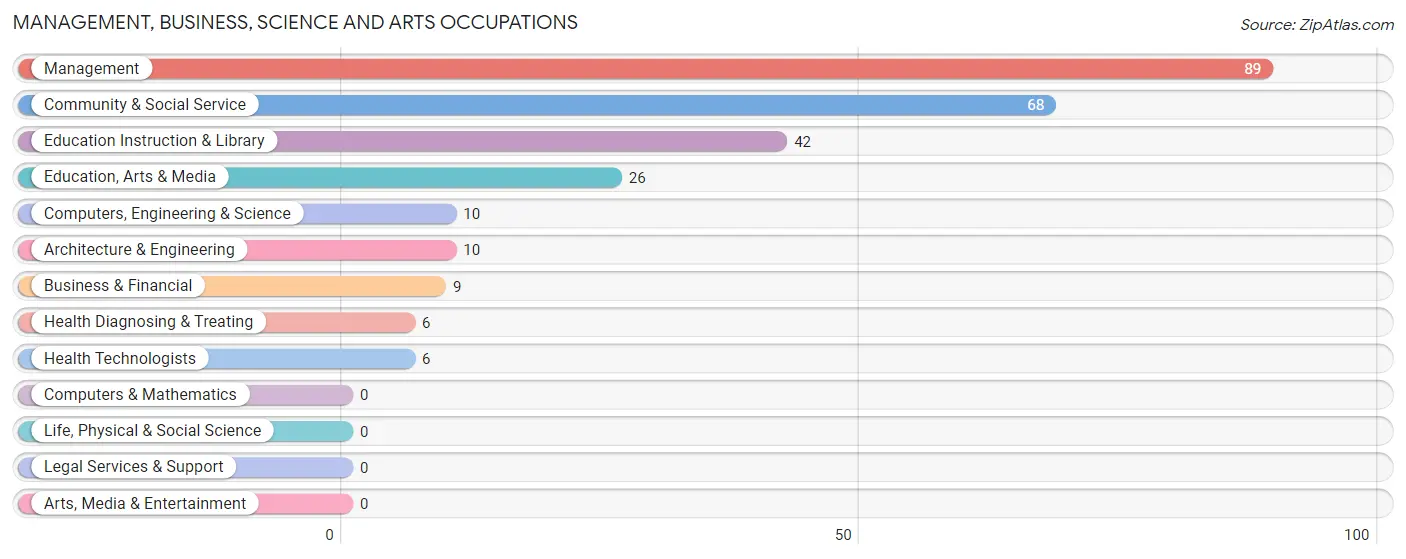
Management, Business, Science and Arts Occupations
The most common Management, Business, Science and Arts occupations in Clinton are Management (89 | 20.2%), Community & Social Service (68 | 15.4%), Education Instruction & Library (42 | 9.5%), Education, Arts & Media (26 | 5.9%), and Computers, Engineering & Science (10 | 2.3%).
Management, Business, Science and Arts Occupations by Sex
Within the Management, Business, Science and Arts occupations in Clinton, the most male-oriented occupations are Computers, Engineering & Science (100.0%), Architecture & Engineering (100.0%), and Education, Arts & Media (100.0%), while the most female-oriented occupations are Business & Financial (100.0%), Education Instruction & Library (100.0%), and Health Diagnosing & Treating (100.0%).
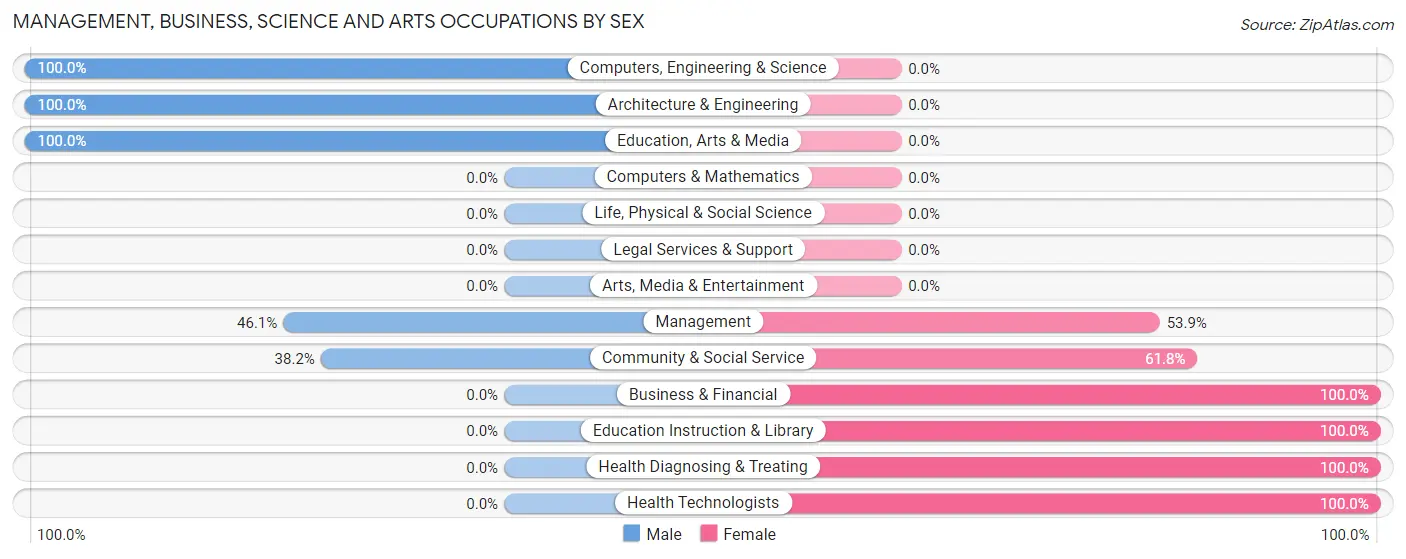
| Occupation | Male | Female |
| Management | 41 (46.1%) | 48 (53.9%) |
| Business & Financial | 0 (0.0%) | 9 (100.0%) |
| Computers, Engineering & Science | 10 (100.0%) | 0 (0.0%) |
| Computers & Mathematics | 0 (0.0%) | 0 (0.0%) |
| Architecture & Engineering | 10 (100.0%) | 0 (0.0%) |
| Life, Physical & Social Science | 0 (0.0%) | 0 (0.0%) |
| Community & Social Service | 26 (38.2%) | 42 (61.8%) |
| Education, Arts & Media | 26 (100.0%) | 0 (0.0%) |
| Legal Services & Support | 0 (0.0%) | 0 (0.0%) |
| Education Instruction & Library | 0 (0.0%) | 42 (100.0%) |
| Arts, Media & Entertainment | 0 (0.0%) | 0 (0.0%) |
| Health Diagnosing & Treating | 0 (0.0%) | 6 (100.0%) |
| Health Technologists | 0 (0.0%) | 6 (100.0%) |
| Total (Category) | 77 (42.3%) | 105 (57.7%) |
| Total (Overall) | 258 (58.5%) | 183 (41.5%) |
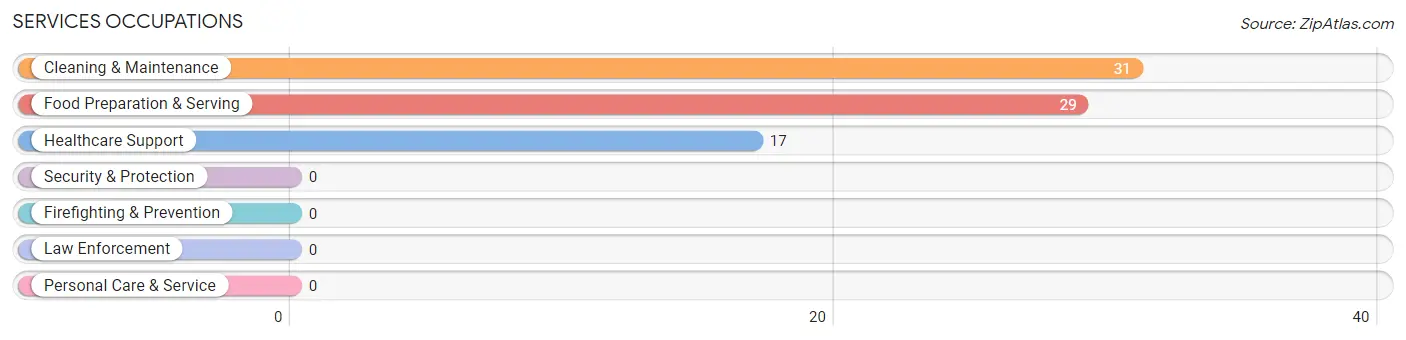
Services Occupations
The most common Services occupations in Clinton are Cleaning & Maintenance (31 | 7.0%), Food Preparation & Serving (29 | 6.6%), and Healthcare Support (17 | 3.8%).
Services Occupations by Sex
Within the Services occupations in Clinton, the most male-oriented occupations are Cleaning & Maintenance (90.3%), Food Preparation & Serving (62.1%), and Healthcare Support (47.1%), while the most female-oriented occupations are Healthcare Support (52.9%), Food Preparation & Serving (37.9%), and Cleaning & Maintenance (9.7%).
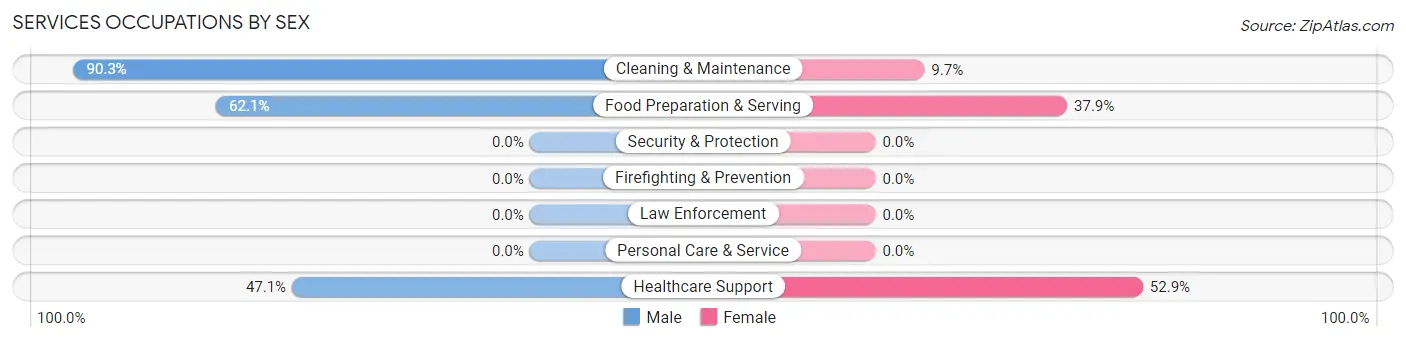
| Occupation | Male | Female |
| Healthcare Support | 8 (47.1%) | 9 (52.9%) |
| Security & Protection | 0 (0.0%) | 0 (0.0%) |
| Firefighting & Prevention | 0 (0.0%) | 0 (0.0%) |
| Law Enforcement | 0 (0.0%) | 0 (0.0%) |
| Food Preparation & Serving | 18 (62.1%) | 11 (37.9%) |
| Cleaning & Maintenance | 28 (90.3%) | 3 (9.7%) |
| Personal Care & Service | 0 (0.0%) | 0 (0.0%) |
| Total (Category) | 54 (70.1%) | 23 (29.9%) |
| Total (Overall) | 258 (58.5%) | 183 (41.5%) |
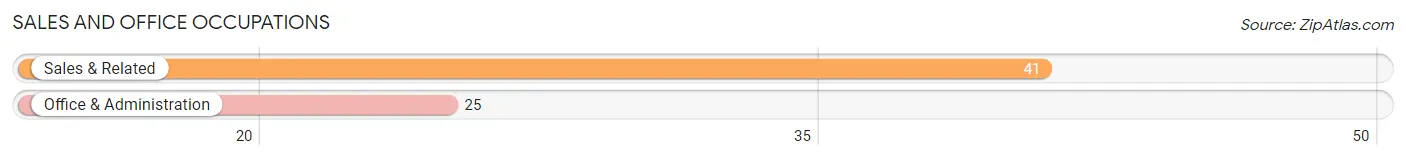
Sales and Office Occupations
The most common Sales and Office occupations in Clinton are Sales & Related (41 | 9.3%), and Office & Administration (25 | 5.7%).
Sales and Office Occupations by Sex
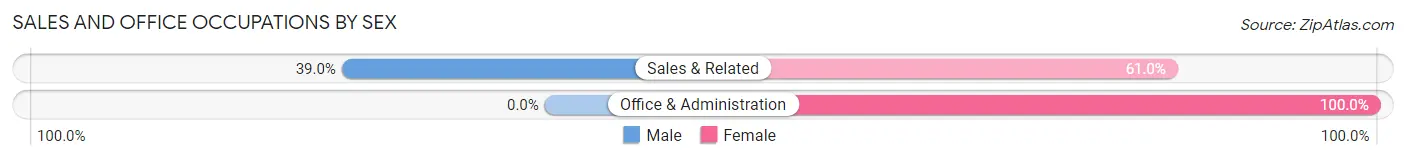
| Occupation | Male | Female |
| Sales & Related | 16 (39.0%) | 25 (61.0%) |
| Office & Administration | 0 (0.0%) | 25 (100.0%) |
| Total (Category) | 16 (24.2%) | 50 (75.8%) |
| Total (Overall) | 258 (58.5%) | 183 (41.5%) |
Natural Resources, Construction and Maintenance Occupations
The most common Natural Resources, Construction and Maintenance occupations in Clinton are Construction & Extraction (74 | 16.8%), Installation, Maintenance & Repair (30 | 6.8%), and Farming, Fishing & Forestry (1 | 0.2%).
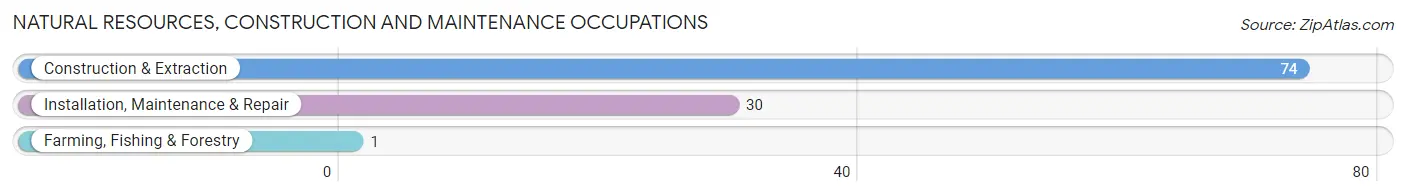
Natural Resources, Construction and Maintenance Occupations by Sex
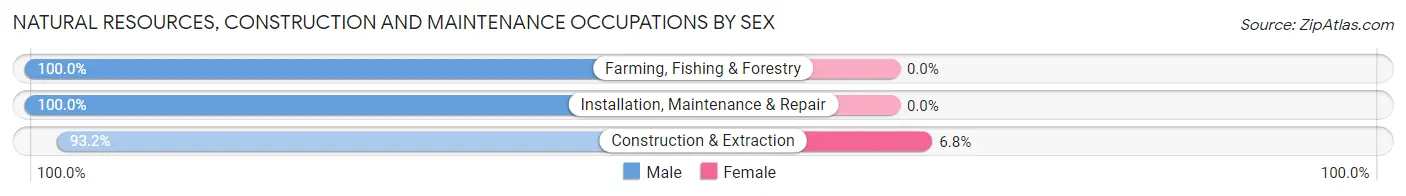
| Occupation | Male | Female |
| Farming, Fishing & Forestry | 1 (100.0%) | 0 (0.0%) |
| Construction & Extraction | 69 (93.2%) | 5 (6.8%) |
| Installation, Maintenance & Repair | 30 (100.0%) | 0 (0.0%) |
| Total (Category) | 100 (95.2%) | 5 (4.8%) |
| Total (Overall) | 258 (58.5%) | 183 (41.5%) |
Production, Transportation and Moving Occupations
The most common Production, Transportation and Moving occupations in Clinton are , and Transportation (11 | 2.5%).
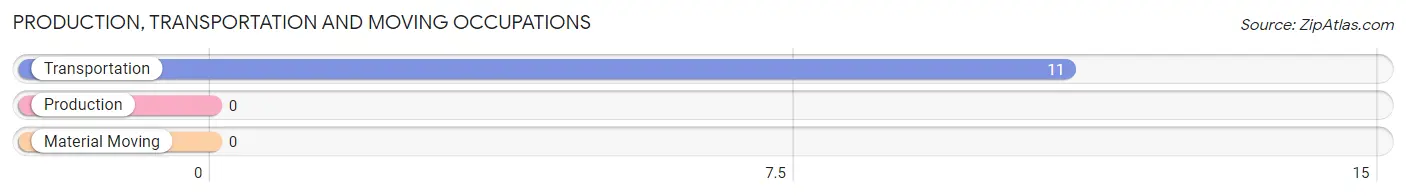
Production, Transportation and Moving Occupations by Sex
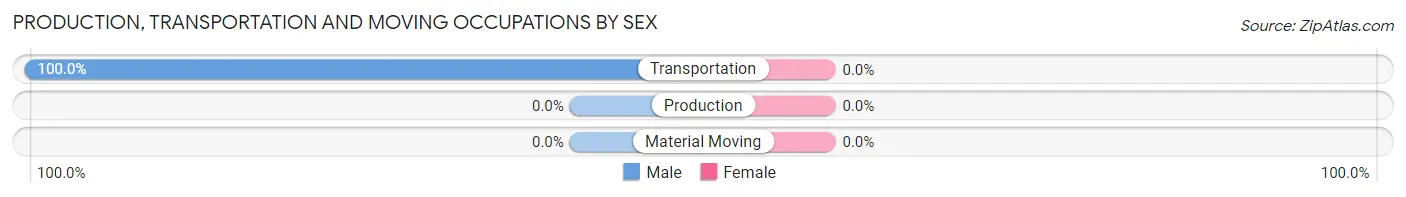
| Occupation | Male | Female |
| Production | 0 (0.0%) | 0 (0.0%) |
| Transportation | 11 (100.0%) | 0 (0.0%) |
| Material Moving | 0 (0.0%) | 0 (0.0%) |
| Total (Category) | 11 (100.0%) | 0 (0.0%) |
| Total (Overall) | 258 (58.5%) | 183 (41.5%) |
Employment Industries by Sex in Clinton
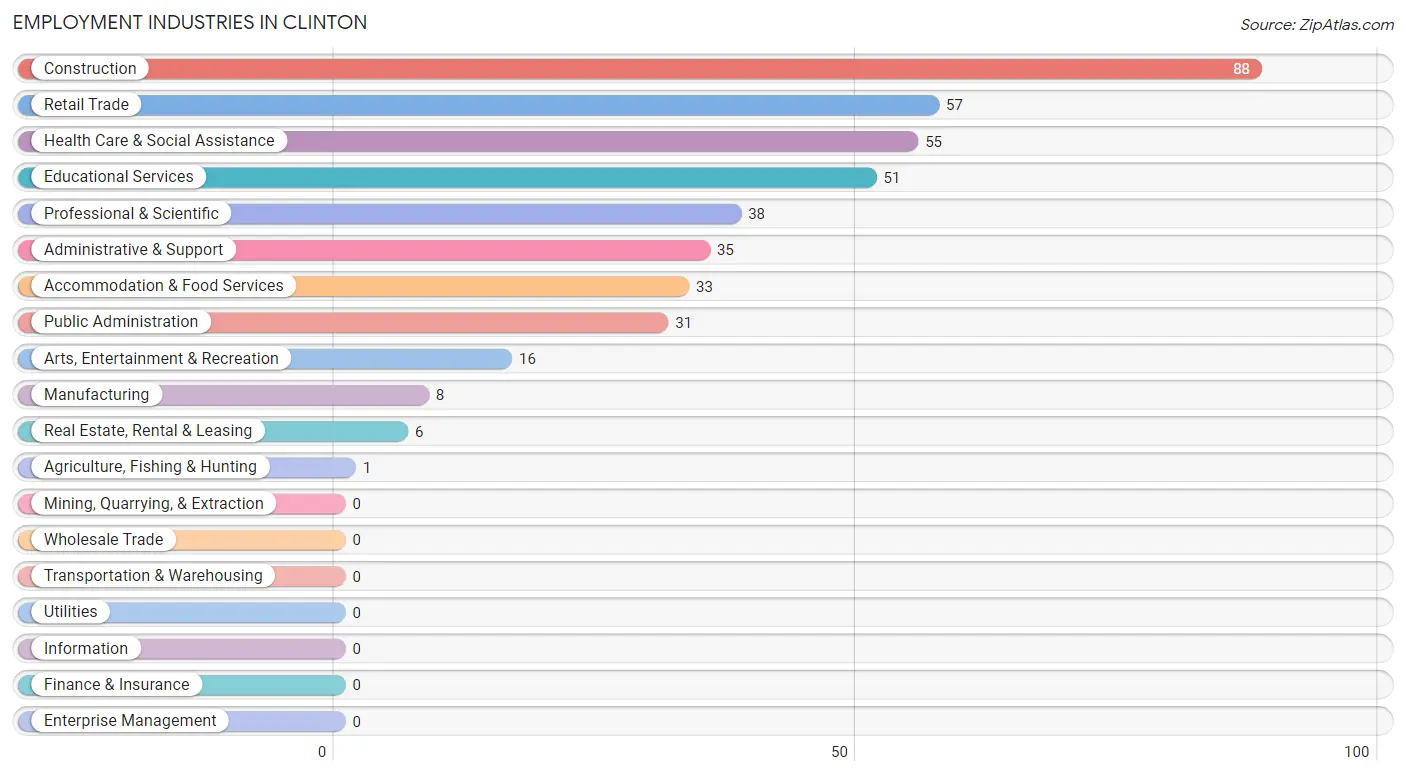
Employment Industries in Clinton
The major employment industries in Clinton include Construction (88 | 20.0%), Retail Trade (57 | 12.9%), Health Care & Social Assistance (55 | 12.5%), Educational Services (51 | 11.6%), and Professional & Scientific (38 | 8.6%).
Employment Industries by Sex in Clinton
The Clinton industries that see more men than women are Agriculture, Fishing & Hunting (100.0%), Manufacturing (100.0%), and Arts, Entertainment & Recreation (100.0%), whereas the industries that tend to have a higher number of women are Real Estate, Rental & Leasing (100.0%), Educational Services (100.0%), and Public Administration (74.2%).
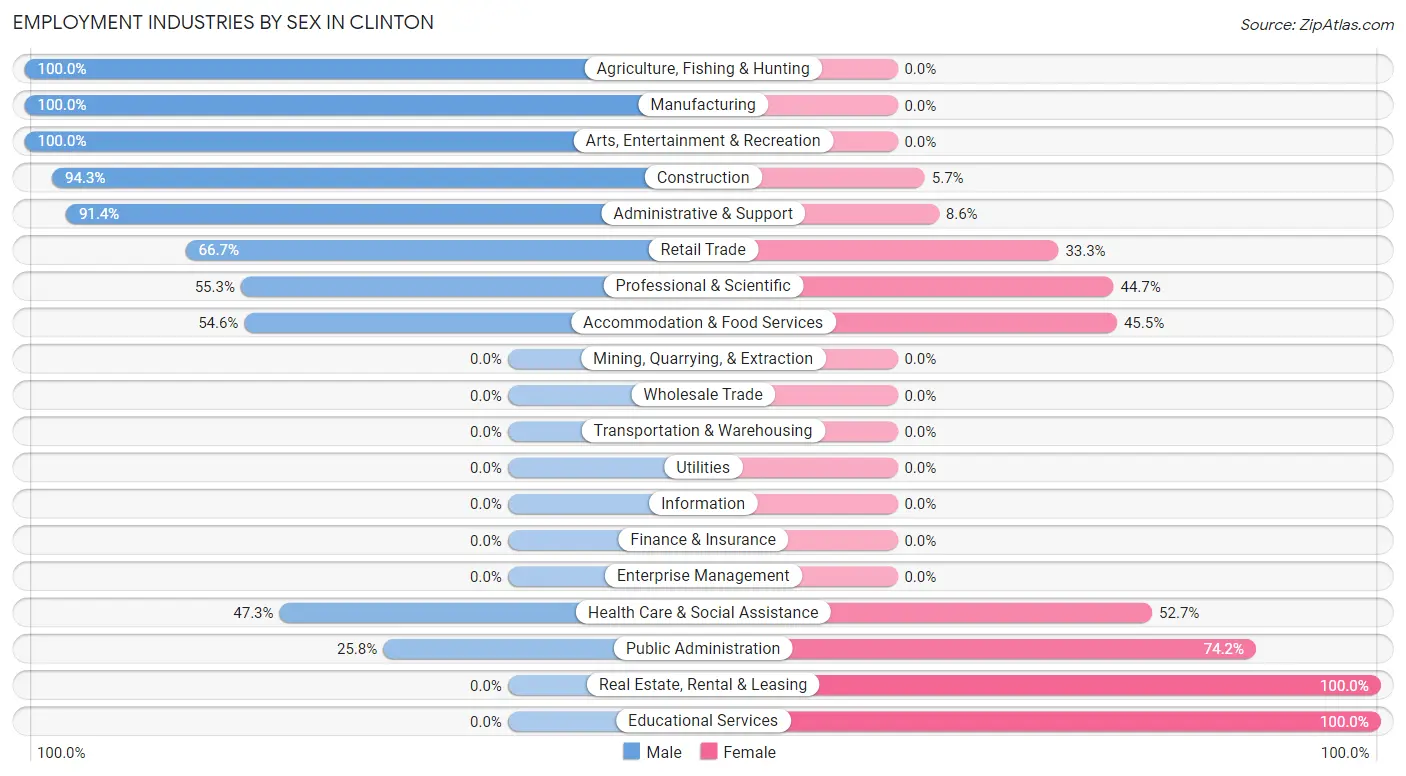
| Industry | Male | Female |
| Agriculture, Fishing & Hunting | 1 (100.0%) | 0 (0.0%) |
| Mining, Quarrying, & Extraction | 0 (0.0%) | 0 (0.0%) |
| Construction | 83 (94.3%) | 5 (5.7%) |
| Manufacturing | 8 (100.0%) | 0 (0.0%) |
| Wholesale Trade | 0 (0.0%) | 0 (0.0%) |
| Retail Trade | 38 (66.7%) | 19 (33.3%) |
| Transportation & Warehousing | 0 (0.0%) | 0 (0.0%) |
| Utilities | 0 (0.0%) | 0 (0.0%) |
| Information | 0 (0.0%) | 0 (0.0%) |
| Finance & Insurance | 0 (0.0%) | 0 (0.0%) |
| Real Estate, Rental & Leasing | 0 (0.0%) | 6 (100.0%) |
| Professional & Scientific | 21 (55.3%) | 17 (44.7%) |
| Enterprise Management | 0 (0.0%) | 0 (0.0%) |
| Administrative & Support | 32 (91.4%) | 3 (8.6%) |
| Educational Services | 0 (0.0%) | 51 (100.0%) |
| Health Care & Social Assistance | 26 (47.3%) | 29 (52.7%) |
| Arts, Entertainment & Recreation | 16 (100.0%) | 0 (0.0%) |
| Accommodation & Food Services | 18 (54.5%) | 15 (45.5%) |
| Public Administration | 8 (25.8%) | 23 (74.2%) |
| Total | 258 (58.5%) | 183 (41.5%) |
Education in Clinton
School Enrollment in Clinton
The most common levels of schooling among the 159 students in Clinton are middle school (135 | 84.9%), elementary school (15 | 9.4%), and high school (9 | 5.7%).
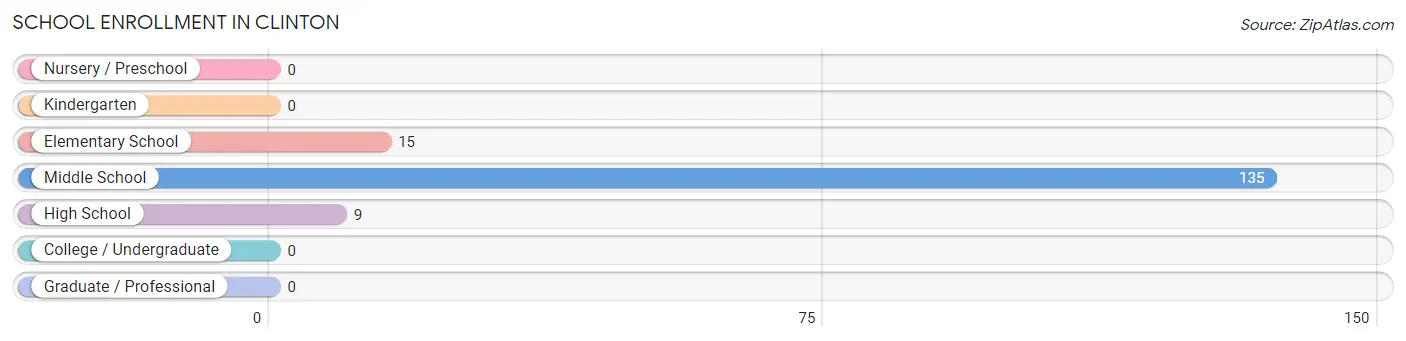
| School Level | # Students | % Students |
| Nursery / Preschool | 0 | 0.0% |
| Kindergarten | 0 | 0.0% |
| Elementary School | 15 | 9.4% |
| Middle School | 135 | 84.9% |
| High School | 9 | 5.7% |
| College / Undergraduate | 0 | 0.0% |
| Graduate / Professional | 0 | 0.0% |
| Total | 159 | 100.0% |
School Enrollment by Age by Funding Source in Clinton
Out of a total of 159 students who are enrolled in schools in Clinton, 133 (83.6%) attend a private institution, while the remaining 26 (16.4%) are enrolled in public schools. The age group of 5 to 9 year old has the highest likelihood of being enrolled in private schools, with 15 (100.0% in the age bracket) enrolled. Conversely, the age group of 15 to 17 year olds has the lowest likelihood of being enrolled in a private school, with 9 (18.4% in the age bracket) attending a public institution.
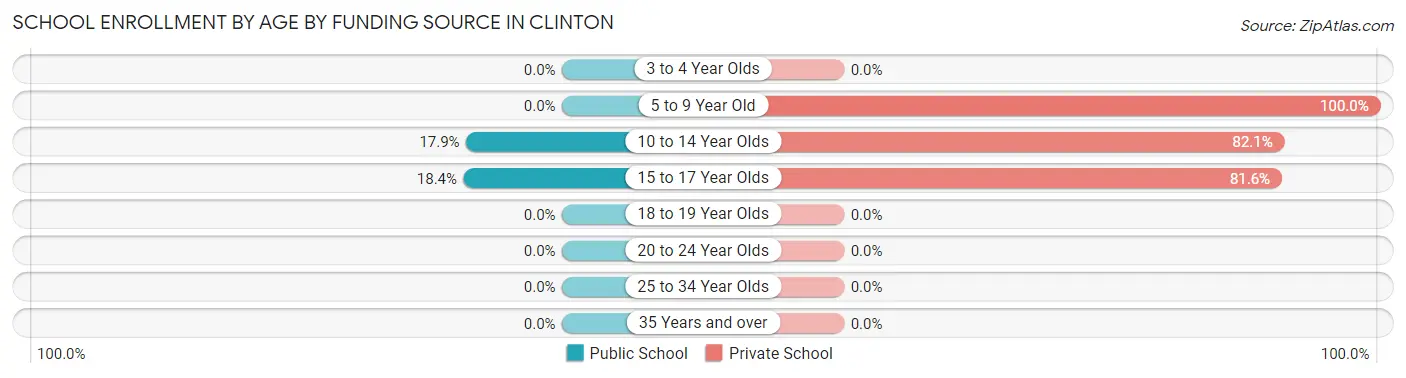
| Age Bracket | Public School | Private School |
| 3 to 4 Year Olds | 0 (0.0%) | 0 (0.0%) |
| 5 to 9 Year Old | 0 (0.0%) | 15 (100.0%) |
| 10 to 14 Year Olds | 17 (17.9%) | 78 (82.1%) |
| 15 to 17 Year Olds | 9 (18.4%) | 40 (81.6%) |
| 18 to 19 Year Olds | 0 (0.0%) | 0 (0.0%) |
| 20 to 24 Year Olds | 0 (0.0%) | 0 (0.0%) |
| 25 to 34 Year Olds | 0 (0.0%) | 0 (0.0%) |
| 35 Years and over | 0 (0.0%) | 0 (0.0%) |
| Total | 26 (16.4%) | 133 (83.6%) |
Educational Attainment by Field of Study in Clinton
Education (92 | 23.2%), bio, nature & agricultural (85 | 21.5%), visual & performing arts (50 | 12.6%), liberal arts & history (26 | 6.6%), and computers & mathematics (22 | 5.6%) are the most common fields of study among 396 individuals in Clinton who have obtained a bachelor's degree or higher.
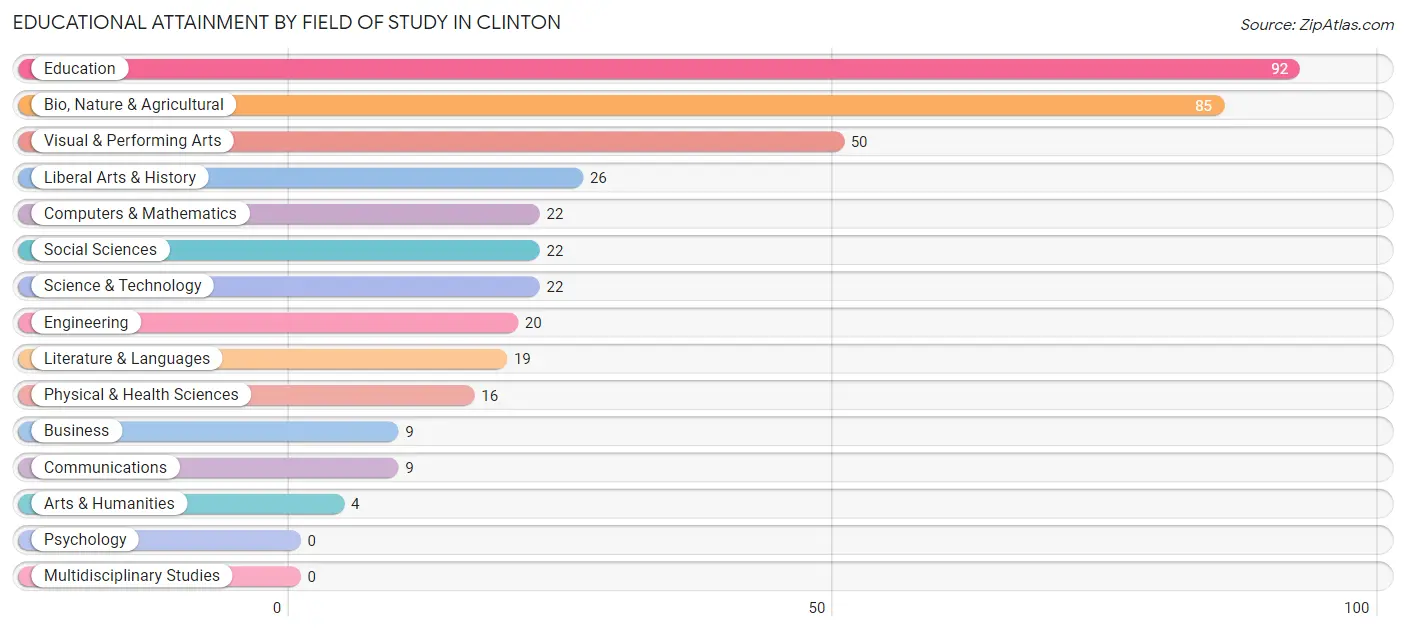
| Field of Study | # Graduates | % Graduates |
| Computers & Mathematics | 22 | 5.6% |
| Bio, Nature & Agricultural | 85 | 21.5% |
| Physical & Health Sciences | 16 | 4.0% |
| Psychology | 0 | 0.0% |
| Social Sciences | 22 | 5.6% |
| Engineering | 20 | 5.1% |
| Multidisciplinary Studies | 0 | 0.0% |
| Science & Technology | 22 | 5.6% |
| Business | 9 | 2.3% |
| Education | 92 | 23.2% |
| Literature & Languages | 19 | 4.8% |
| Liberal Arts & History | 26 | 6.6% |
| Visual & Performing Arts | 50 | 12.6% |
| Communications | 9 | 2.3% |
| Arts & Humanities | 4 | 1.0% |
| Total | 396 | 100.0% |
Transportation & Commute in Clinton
Vehicle Availability by Sex in Clinton
The most prevalent vehicle ownership categories in Clinton are males with 2 vehicles (89, accounting for 34.6%) and females with 2 vehicles (51, making up 50.3%).
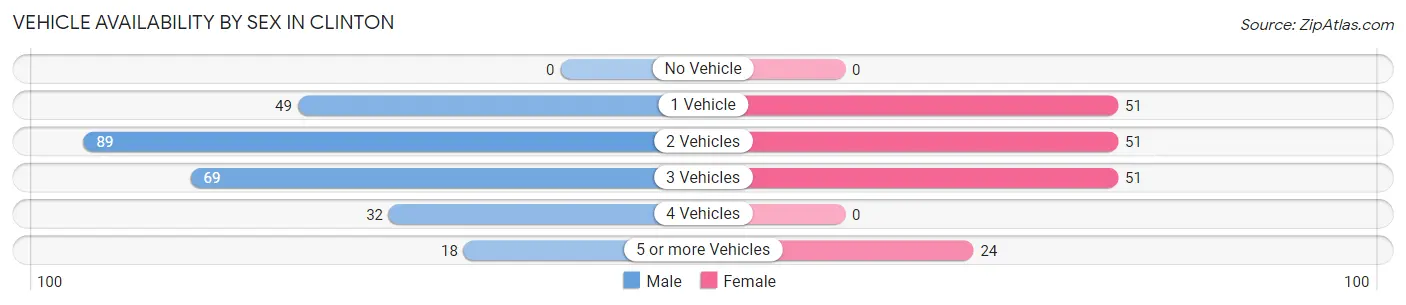
| Vehicles Available | Male | Female |
| No Vehicle | 0 (0.0%) | 0 (0.0%) |
| 1 Vehicle | 49 (19.1%) | 51 (28.8%) |
| 2 Vehicles | 89 (34.6%) | 51 (28.8%) |
| 3 Vehicles | 69 (26.9%) | 51 (28.8%) |
| 4 Vehicles | 32 (12.4%) | 0 (0.0%) |
| 5 or more Vehicles | 18 (7.0%) | 24 (13.6%) |
| Total | 257 (100.0%) | 177 (100.0%) |
Commute Time in Clinton
The most frequently occuring commute durations in Clinton are 90 or more minutes (74 commuters, 23.3%), 10 to 14 minutes (66 commuters, 20.8%), and 5 to 9 minutes (46 commuters, 14.5%).
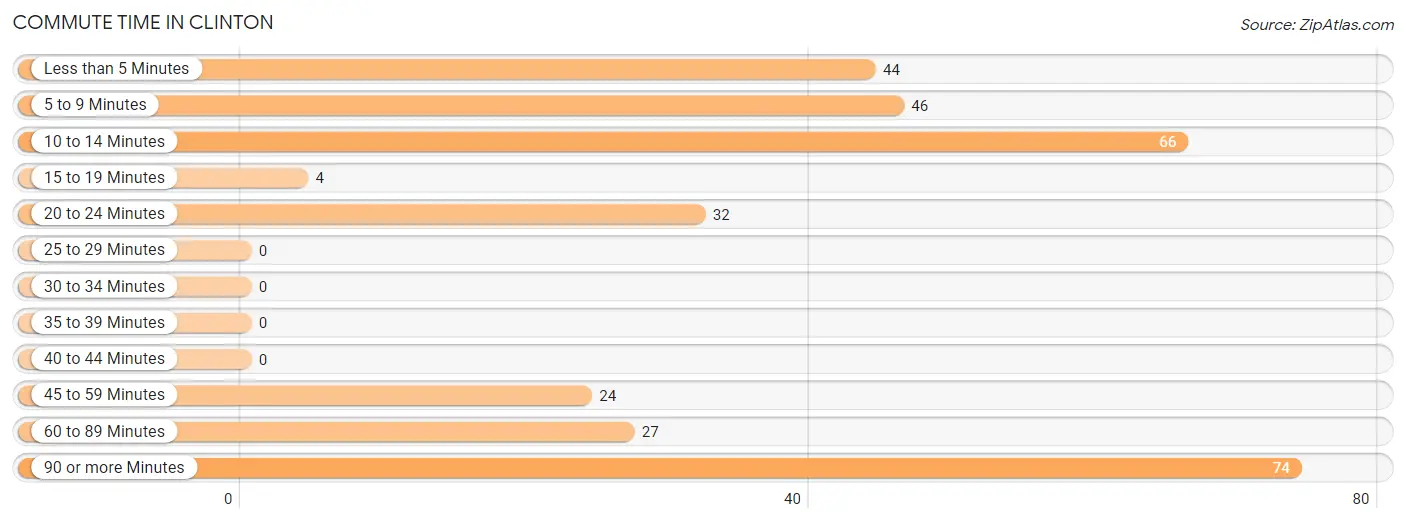
| Commute Time | # Commuters | % Commuters |
| Less than 5 Minutes | 44 | 13.9% |
| 5 to 9 Minutes | 46 | 14.5% |
| 10 to 14 Minutes | 66 | 20.8% |
| 15 to 19 Minutes | 4 | 1.3% |
| 20 to 24 Minutes | 32 | 10.1% |
| 25 to 29 Minutes | 0 | 0.0% |
| 30 to 34 Minutes | 0 | 0.0% |
| 35 to 39 Minutes | 0 | 0.0% |
| 40 to 44 Minutes | 0 | 0.0% |
| 45 to 59 Minutes | 24 | 7.6% |
| 60 to 89 Minutes | 27 | 8.5% |
| 90 or more Minutes | 74 | 23.3% |
Commute Time by Sex in Clinton
The most common commute times in Clinton are 90 or more minutes (66 commuters, 32.5%) for males and 10 to 14 minutes (42 commuters, 36.8%) for females.
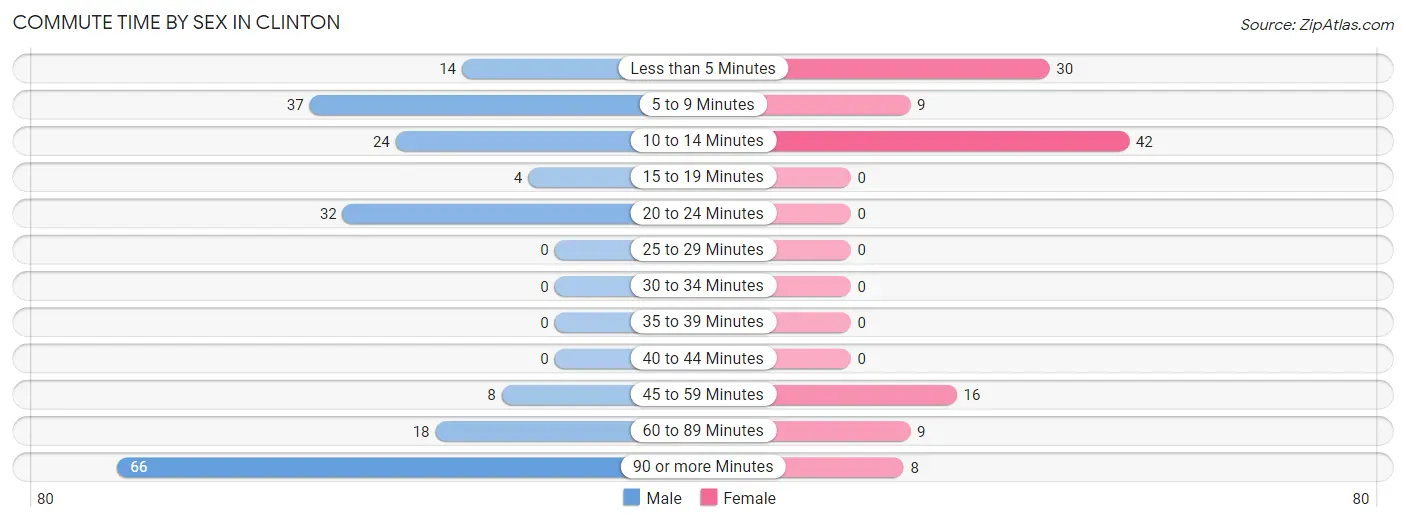
| Commute Time | Male | Female |
| Less than 5 Minutes | 14 (6.9%) | 30 (26.3%) |
| 5 to 9 Minutes | 37 (18.2%) | 9 (7.9%) |
| 10 to 14 Minutes | 24 (11.8%) | 42 (36.8%) |
| 15 to 19 Minutes | 4 (2.0%) | 0 (0.0%) |
| 20 to 24 Minutes | 32 (15.8%) | 0 (0.0%) |
| 25 to 29 Minutes | 0 (0.0%) | 0 (0.0%) |
| 30 to 34 Minutes | 0 (0.0%) | 0 (0.0%) |
| 35 to 39 Minutes | 0 (0.0%) | 0 (0.0%) |
| 40 to 44 Minutes | 0 (0.0%) | 0 (0.0%) |
| 45 to 59 Minutes | 8 (3.9%) | 16 (14.0%) |
| 60 to 89 Minutes | 18 (8.9%) | 9 (7.9%) |
| 90 or more Minutes | 66 (32.5%) | 8 (7.0%) |
Time of Departure to Work by Sex in Clinton
The most frequent times of departure to work in Clinton are 7:30 AM to 7:59 AM (64, 31.5%) for males and 12:00 PM to 3:59 PM (30, 26.3%) for females.
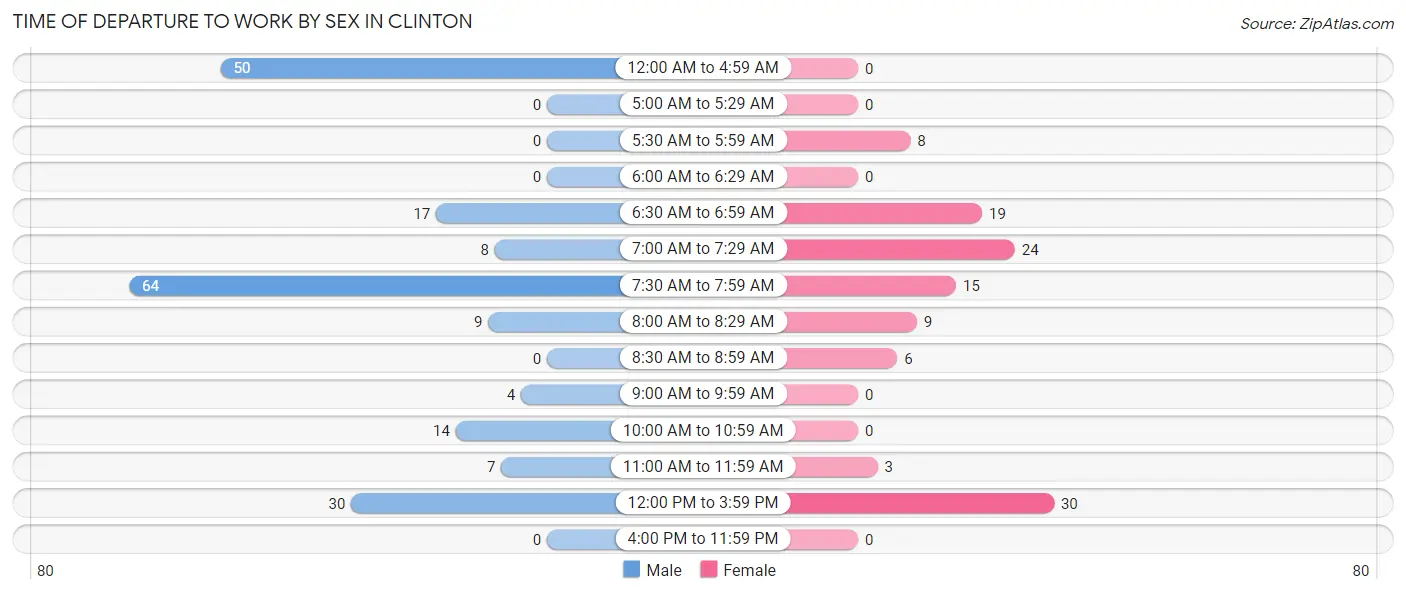
| Time of Departure | Male | Female |
| 12:00 AM to 4:59 AM | 50 (24.6%) | 0 (0.0%) |
| 5:00 AM to 5:29 AM | 0 (0.0%) | 0 (0.0%) |
| 5:30 AM to 5:59 AM | 0 (0.0%) | 8 (7.0%) |
| 6:00 AM to 6:29 AM | 0 (0.0%) | 0 (0.0%) |
| 6:30 AM to 6:59 AM | 17 (8.4%) | 19 (16.7%) |
| 7:00 AM to 7:29 AM | 8 (3.9%) | 24 (21.0%) |
| 7:30 AM to 7:59 AM | 64 (31.5%) | 15 (13.2%) |
| 8:00 AM to 8:29 AM | 9 (4.4%) | 9 (7.9%) |
| 8:30 AM to 8:59 AM | 0 (0.0%) | 6 (5.3%) |
| 9:00 AM to 9:59 AM | 4 (2.0%) | 0 (0.0%) |
| 10:00 AM to 10:59 AM | 14 (6.9%) | 0 (0.0%) |
| 11:00 AM to 11:59 AM | 7 (3.5%) | 3 (2.6%) |
| 12:00 PM to 3:59 PM | 30 (14.8%) | 30 (26.3%) |
| 4:00 PM to 11:59 PM | 0 (0.0%) | 0 (0.0%) |
| Total | 203 (100.0%) | 114 (100.0%) |
Housing Occupancy in Clinton
Occupancy by Ownership in Clinton
Of the total 507 dwellings in Clinton, owner-occupied units account for 417 (82.3%), while renter-occupied units make up 90 (17.7%).
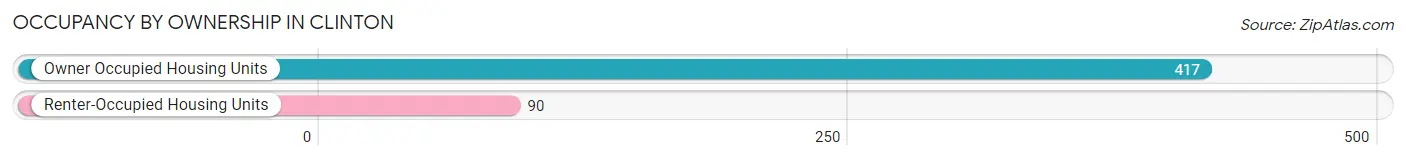
| Occupancy | # Housing Units | % Housing Units |
| Owner Occupied Housing Units | 417 | 82.3% |
| Renter-Occupied Housing Units | 90 | 17.7% |
| Total Occupied Housing Units | 507 | 100.0% |
Occupancy by Household Size in Clinton
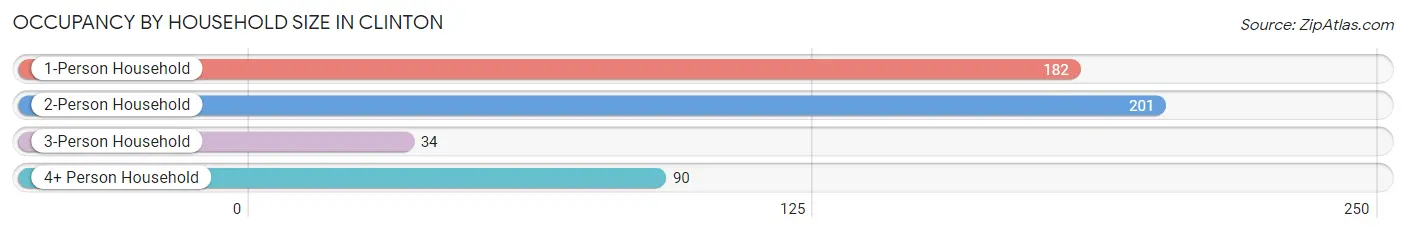
| Household Size | # Housing Units | % Housing Units |
| 1-Person Household | 182 | 35.9% |
| 2-Person Household | 201 | 39.6% |
| 3-Person Household | 34 | 6.7% |
| 4+ Person Household | 90 | 17.7% |
| Total Housing Units | 507 | 100.0% |
Occupancy by Ownership by Household Size in Clinton
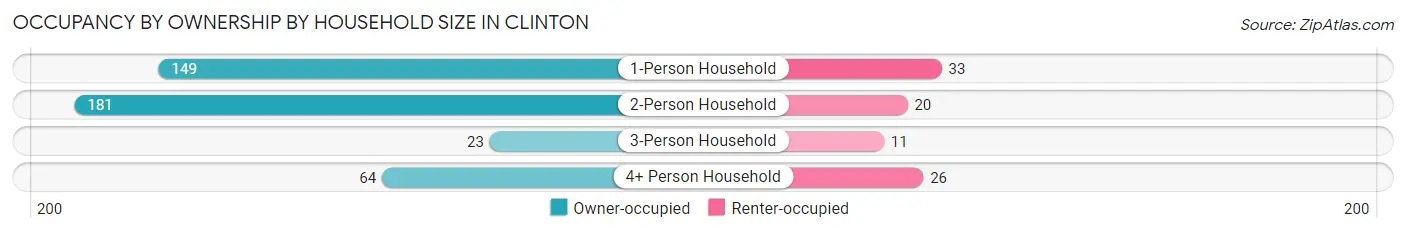
| Household Size | Owner-occupied | Renter-occupied |
| 1-Person Household | 149 (81.9%) | 33 (18.1%) |
| 2-Person Household | 181 (90.0%) | 20 (10.0%) |
| 3-Person Household | 23 (67.6%) | 11 (32.4%) |
| 4+ Person Household | 64 (71.1%) | 26 (28.9%) |
| Total Housing Units | 417 (82.3%) | 90 (17.7%) |
Occupancy by Educational Attainment in Clinton
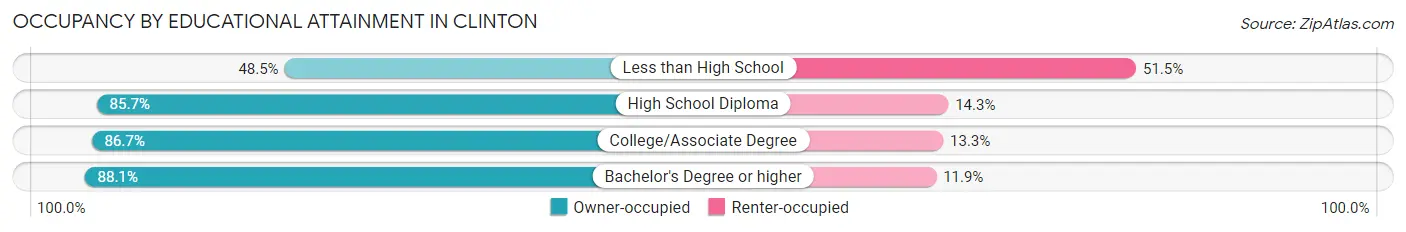
| Household Size | Owner-occupied | Renter-occupied |
| Less than High School | 32 (48.5%) | 34 (51.5%) |
| High School Diploma | 78 (85.7%) | 13 (14.3%) |
| College/Associate Degree | 85 (86.7%) | 13 (13.3%) |
| Bachelor's Degree or higher | 222 (88.1%) | 30 (11.9%) |
Occupancy by Age of Householder in Clinton
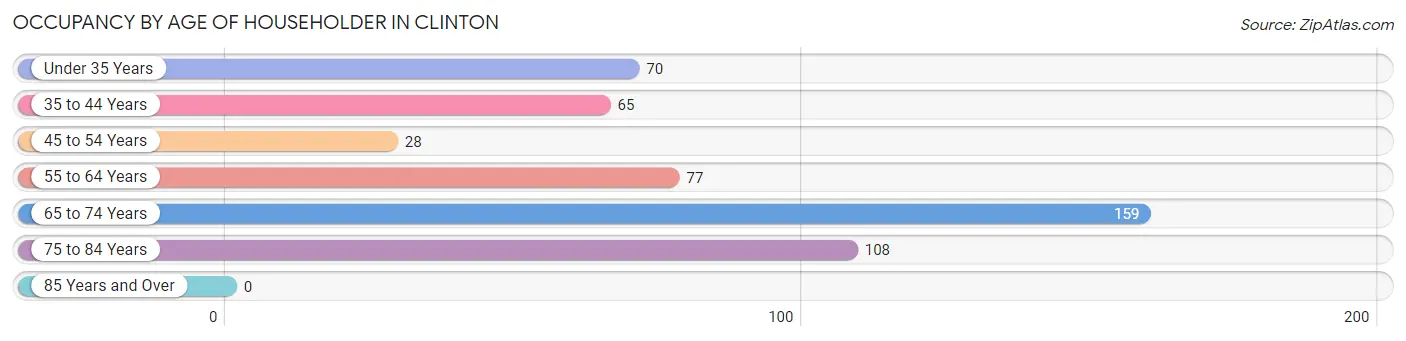
| Age Bracket | # Households | % Households |
| Under 35 Years | 70 | 13.8% |
| 35 to 44 Years | 65 | 12.8% |
| 45 to 54 Years | 28 | 5.5% |
| 55 to 64 Years | 77 | 15.2% |
| 65 to 74 Years | 159 | 31.4% |
| 75 to 84 Years | 108 | 21.3% |
| 85 Years and Over | 0 | 0.0% |
| Total | 507 | 100.0% |
Housing Finances in Clinton
Median Income by Occupancy in Clinton
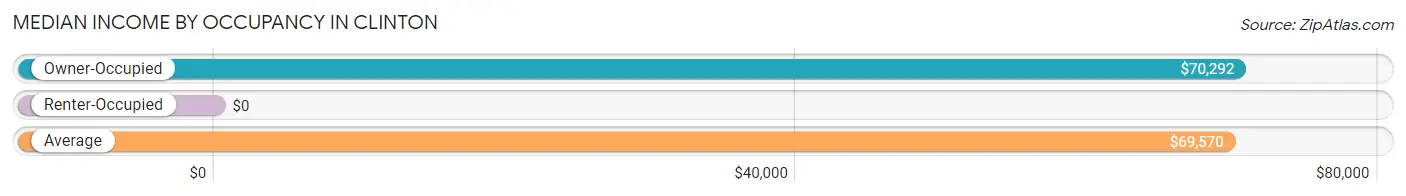
| Occupancy Type | # Households | Median Income |
| Owner-Occupied | 417 (82.3%) | $70,292 |
| Renter-Occupied | 90 (17.7%) | $0 |
| Average | 507 (100.0%) | $69,570 |
Occupancy by Householder Income Bracket in Clinton
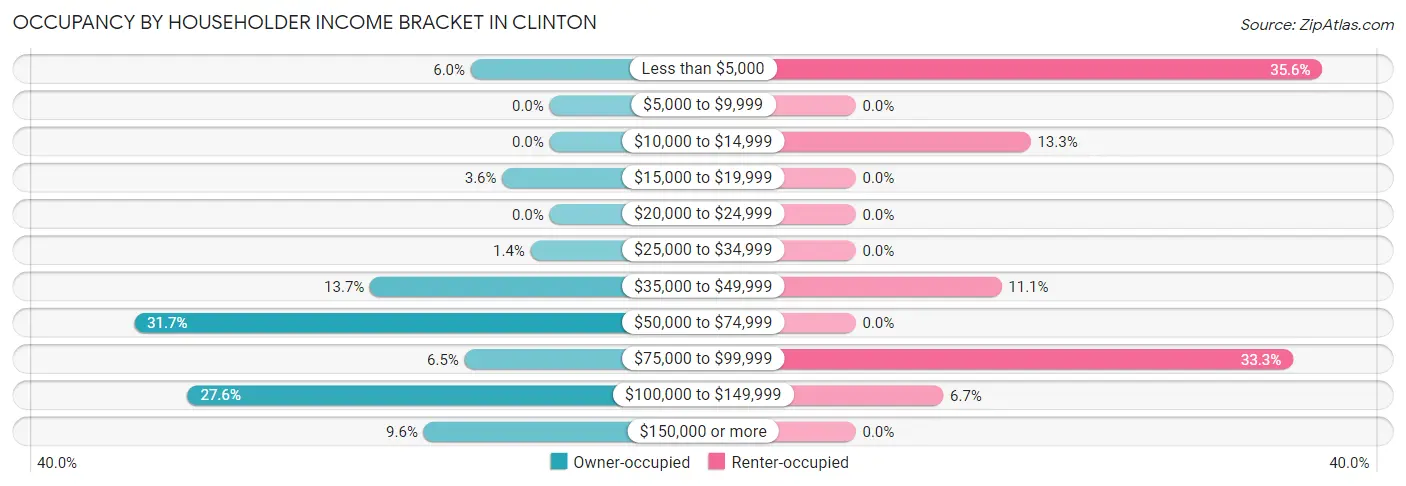
| Income Bracket | Owner-occupied | Renter-occupied |
| Less than $5,000 | 25 (6.0%) | 32 (35.6%) |
| $5,000 to $9,999 | 0 (0.0%) | 0 (0.0%) |
| $10,000 to $14,999 | 0 (0.0%) | 12 (13.3%) |
| $15,000 to $19,999 | 15 (3.6%) | 0 (0.0%) |
| $20,000 to $24,999 | 0 (0.0%) | 0 (0.0%) |
| $25,000 to $34,999 | 6 (1.4%) | 0 (0.0%) |
| $35,000 to $49,999 | 57 (13.7%) | 10 (11.1%) |
| $50,000 to $74,999 | 132 (31.7%) | 0 (0.0%) |
| $75,000 to $99,999 | 27 (6.5%) | 30 (33.3%) |
| $100,000 to $149,999 | 115 (27.6%) | 6 (6.7%) |
| $150,000 or more | 40 (9.6%) | 0 (0.0%) |
| Total | 417 (100.0%) | 90 (100.0%) |
Monthly Housing Cost Tiers in Clinton
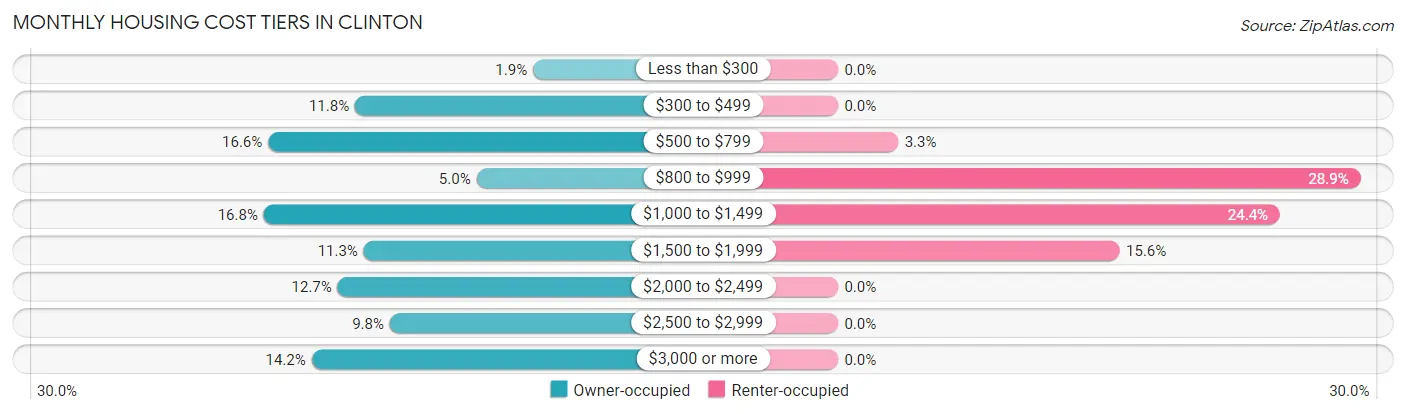
| Monthly Cost | Owner-occupied | Renter-occupied |
| Less than $300 | 8 (1.9%) | 0 (0.0%) |
| $300 to $499 | 49 (11.7%) | 0 (0.0%) |
| $500 to $799 | 69 (16.6%) | 3 (3.3%) |
| $800 to $999 | 21 (5.0%) | 26 (28.9%) |
| $1,000 to $1,499 | 70 (16.8%) | 22 (24.4%) |
| $1,500 to $1,999 | 47 (11.3%) | 14 (15.6%) |
| $2,000 to $2,499 | 53 (12.7%) | 0 (0.0%) |
| $2,500 to $2,999 | 41 (9.8%) | 0 (0.0%) |
| $3,000 or more | 59 (14.1%) | 0 (0.0%) |
| Total | 417 (100.0%) | 90 (100.0%) |
Physical Housing Characteristics in Clinton
Housing Structures in Clinton
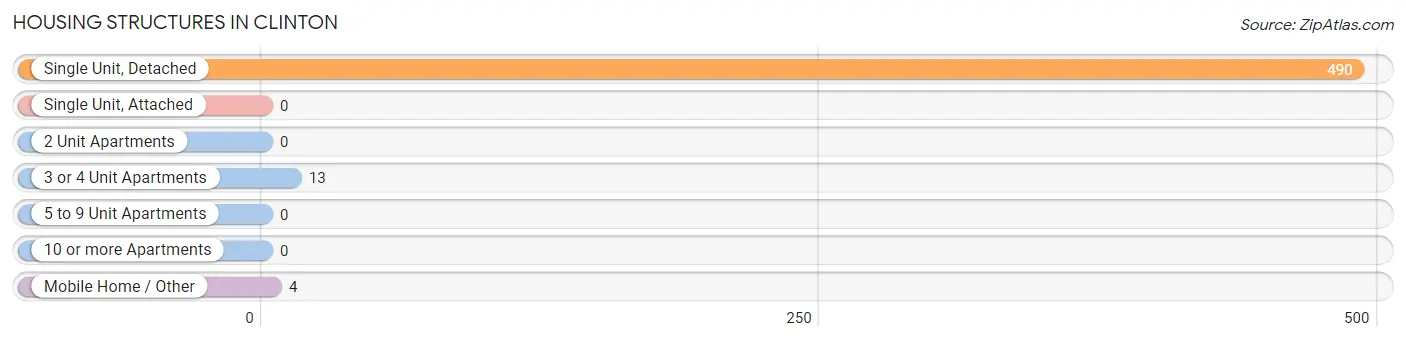
| Structure Type | # Housing Units | % Housing Units |
| Single Unit, Detached | 490 | 96.7% |
| Single Unit, Attached | 0 | 0.0% |
| 2 Unit Apartments | 0 | 0.0% |
| 3 or 4 Unit Apartments | 13 | 2.6% |
| 5 to 9 Unit Apartments | 0 | 0.0% |
| 10 or more Apartments | 0 | 0.0% |
| Mobile Home / Other | 4 | 0.8% |
| Total | 507 | 100.0% |
Housing Structures by Occupancy in Clinton
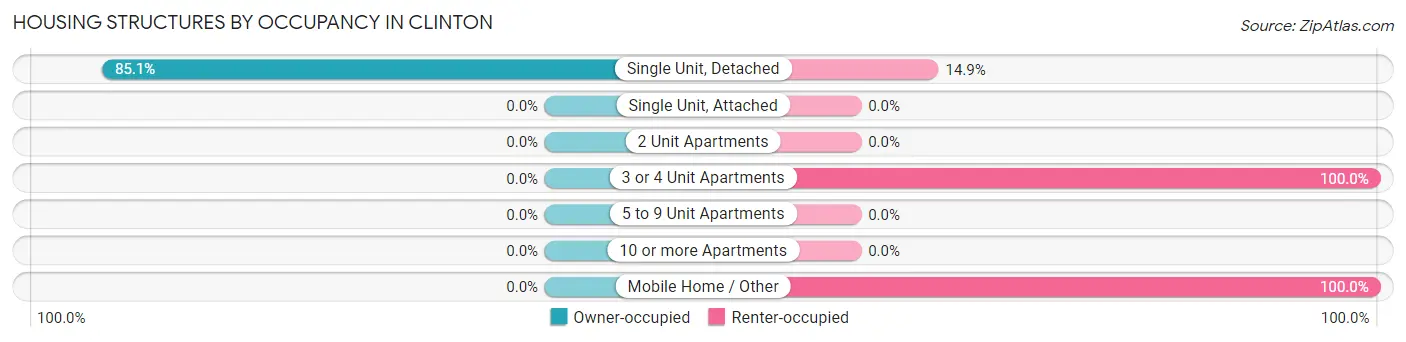
| Structure Type | Owner-occupied | Renter-occupied |
| Single Unit, Detached | 417 (85.1%) | 73 (14.9%) |
| Single Unit, Attached | 0 (0.0%) | 0 (0.0%) |
| 2 Unit Apartments | 0 (0.0%) | 0 (0.0%) |
| 3 or 4 Unit Apartments | 0 (0.0%) | 13 (100.0%) |
| 5 to 9 Unit Apartments | 0 (0.0%) | 0 (0.0%) |
| 10 or more Apartments | 0 (0.0%) | 0 (0.0%) |
| Mobile Home / Other | 0 (0.0%) | 4 (100.0%) |
| Total | 417 (82.3%) | 90 (17.7%) |
Housing Structures by Number of Rooms in Clinton
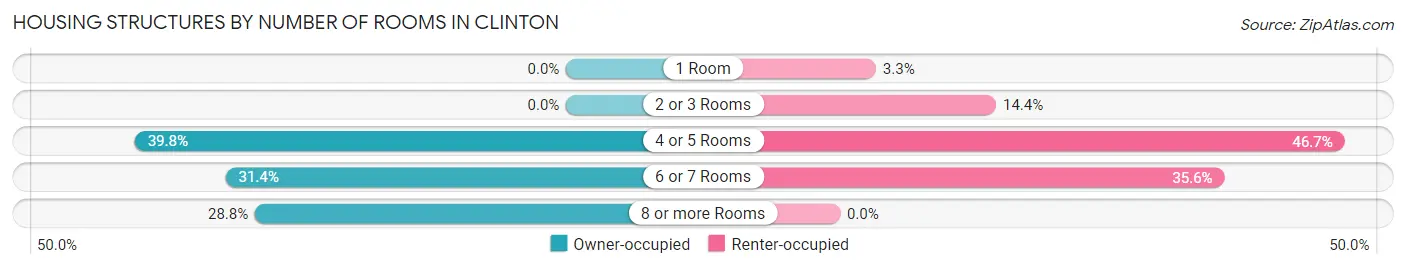
| Number of Rooms | Owner-occupied | Renter-occupied |
| 1 Room | 0 (0.0%) | 3 (3.3%) |
| 2 or 3 Rooms | 0 (0.0%) | 13 (14.4%) |
| 4 or 5 Rooms | 166 (39.8%) | 42 (46.7%) |
| 6 or 7 Rooms | 131 (31.4%) | 32 (35.6%) |
| 8 or more Rooms | 120 (28.8%) | 0 (0.0%) |
| Total | 417 (100.0%) | 90 (100.0%) |
Housing Structure by Heating Type in Clinton
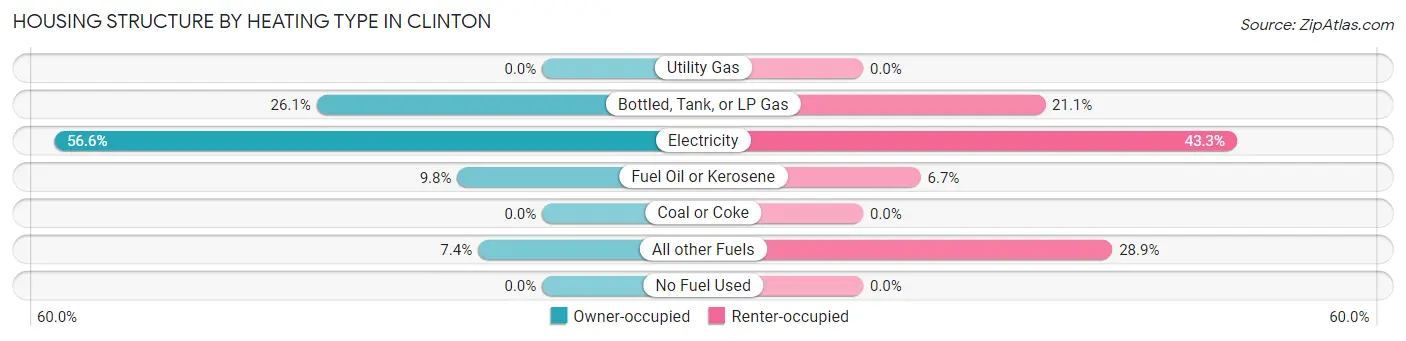
| Heating Type | Owner-occupied | Renter-occupied |
| Utility Gas | 0 (0.0%) | 0 (0.0%) |
| Bottled, Tank, or LP Gas | 109 (26.1%) | 19 (21.1%) |
| Electricity | 236 (56.6%) | 39 (43.3%) |
| Fuel Oil or Kerosene | 41 (9.8%) | 6 (6.7%) |
| Coal or Coke | 0 (0.0%) | 0 (0.0%) |
| All other Fuels | 31 (7.4%) | 26 (28.9%) |
| No Fuel Used | 0 (0.0%) | 0 (0.0%) |
| Total | 417 (100.0%) | 90 (100.0%) |
Household Vehicle Usage in Clinton
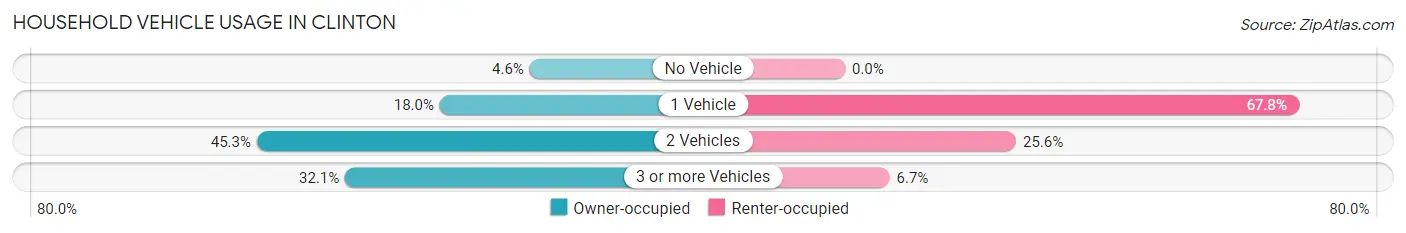
| Vehicles per Household | Owner-occupied | Renter-occupied |
| No Vehicle | 19 (4.6%) | 0 (0.0%) |
| 1 Vehicle | 75 (18.0%) | 61 (67.8%) |
| 2 Vehicles | 189 (45.3%) | 23 (25.6%) |
| 3 or more Vehicles | 134 (32.1%) | 6 (6.7%) |
| Total | 417 (100.0%) | 90 (100.0%) |
Real Estate & Mortgages in Clinton
Real Estate and Mortgage Overview in Clinton
| Characteristic | Without Mortgage | With Mortgage |
| Housing Units | 155 | 262 |
| Median Property Value | $552,400 | $623,000 |
| Median Household Income | $65,982 | $32 |
| Monthly Housing Costs | $703 | $59 |
| Real Estate Taxes | $4,292 | $0 |
Property Value by Mortgage Status in Clinton
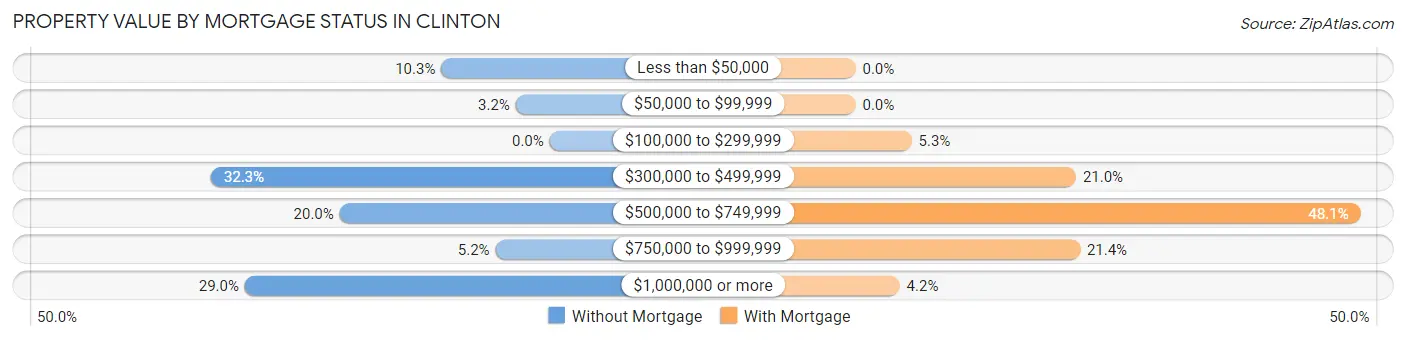
| Property Value | Without Mortgage | With Mortgage |
| Less than $50,000 | 16 (10.3%) | 0 (0.0%) |
| $50,000 to $99,999 | 5 (3.2%) | 0 (0.0%) |
| $100,000 to $299,999 | 0 (0.0%) | 14 (5.3%) |
| $300,000 to $499,999 | 50 (32.3%) | 55 (21.0%) |
| $500,000 to $749,999 | 31 (20.0%) | 126 (48.1%) |
| $750,000 to $999,999 | 8 (5.2%) | 56 (21.4%) |
| $1,000,000 or more | 45 (29.0%) | 11 (4.2%) |
| Total | 155 (100.0%) | 262 (100.0%) |
Household Income by Mortgage Status in Clinton
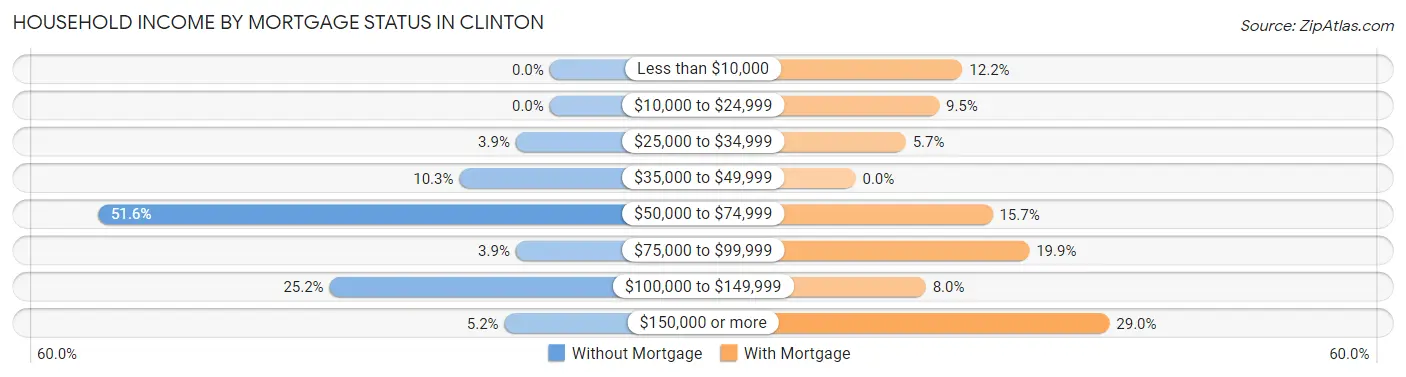
| Household Income | Without Mortgage | With Mortgage |
| Less than $10,000 | 0 (0.0%) | 32 (12.2%) |
| $10,000 to $24,999 | 0 (0.0%) | 25 (9.5%) |
| $25,000 to $34,999 | 6 (3.9%) | 15 (5.7%) |
| $35,000 to $49,999 | 16 (10.3%) | 0 (0.0%) |
| $50,000 to $74,999 | 80 (51.6%) | 41 (15.7%) |
| $75,000 to $99,999 | 6 (3.9%) | 52 (19.9%) |
| $100,000 to $149,999 | 39 (25.2%) | 21 (8.0%) |
| $150,000 or more | 8 (5.2%) | 76 (29.0%) |
| Total | 155 (100.0%) | 262 (100.0%) |
Property Value to Household Income Ratio in Clinton
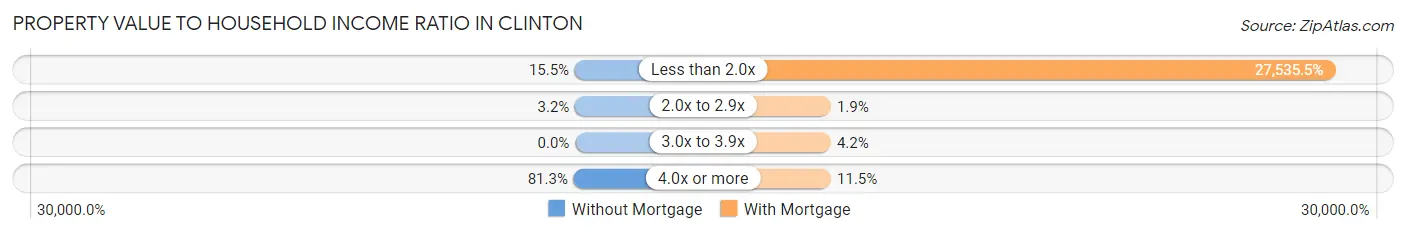
| Value-to-Income Ratio | Without Mortgage | With Mortgage |
| Less than 2.0x | 24 (15.5%) | 72,143 (27,535.5%) |
| 2.0x to 2.9x | 5 (3.2%) | 5 (1.9%) |
| 3.0x to 3.9x | 0 (0.0%) | 11 (4.2%) |
| 4.0x or more | 126 (81.3%) | 30 (11.5%) |
| Total | 155 (100.0%) | 262 (100.0%) |
Real Estate Taxes by Mortgage Status in Clinton
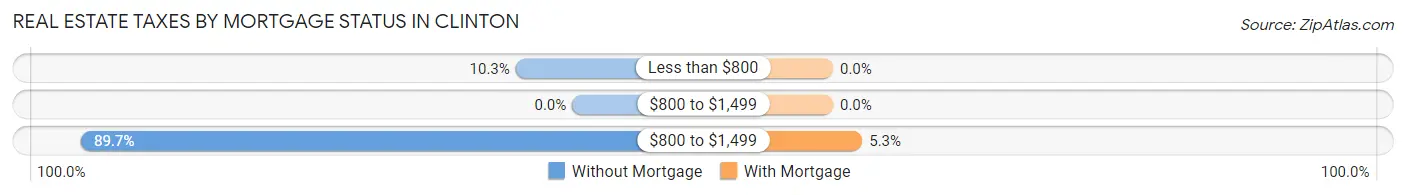
| Property Taxes | Without Mortgage | With Mortgage |
| Less than $800 | 16 (10.3%) | 0 (0.0%) |
| $800 to $1,499 | 0 (0.0%) | 0 (0.0%) |
| $800 to $1,499 | 139 (89.7%) | 14 (5.3%) |
| Total | 155 (100.0%) | 262 (100.0%) |
Health & Disability in Clinton
Health Insurance Coverage by Age in Clinton
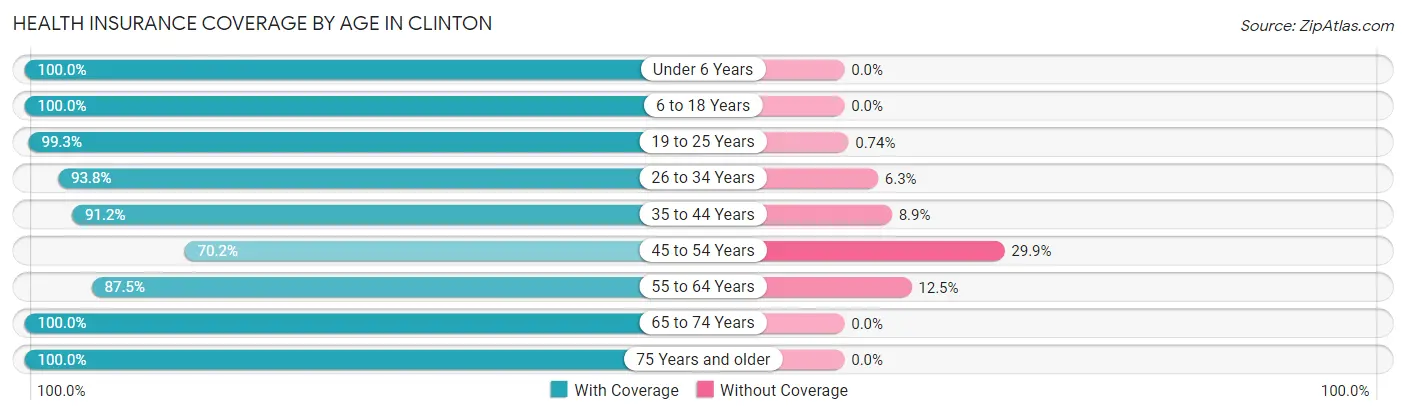
| Age Bracket | With Coverage | Without Coverage |
| Under 6 Years | 62 (100.0%) | 0 (0.0%) |
| 6 to 18 Years | 159 (100.0%) | 0 (0.0%) |
| 19 to 25 Years | 134 (99.3%) | 1 (0.7%) |
| 26 to 34 Years | 60 (93.8%) | 4 (6.2%) |
| 35 to 44 Years | 103 (91.1%) | 10 (8.8%) |
| 45 to 54 Years | 94 (70.2%) | 40 (29.8%) |
| 55 to 64 Years | 105 (87.5%) | 15 (12.5%) |
| 65 to 74 Years | 250 (100.0%) | 0 (0.0%) |
| 75 Years and older | 128 (100.0%) | 0 (0.0%) |
| Total | 1,095 (94.0%) | 70 (6.0%) |
Health Insurance Coverage by Citizenship Status in Clinton
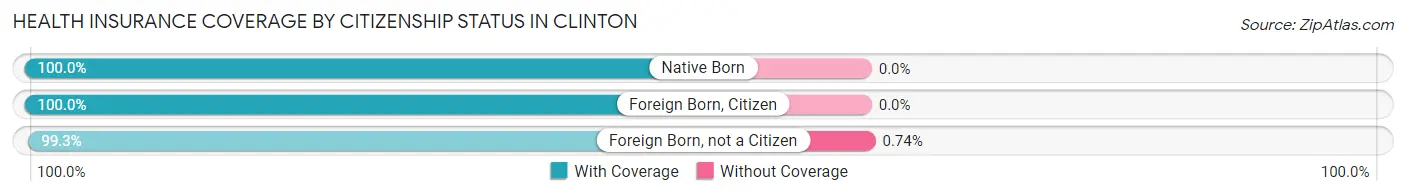
| Citizenship Status | With Coverage | Without Coverage |
| Native Born | 62 (100.0%) | 0 (0.0%) |
| Foreign Born, Citizen | 159 (100.0%) | 0 (0.0%) |
| Foreign Born, not a Citizen | 134 (99.3%) | 1 (0.7%) |
Health Insurance Coverage by Household Income in Clinton
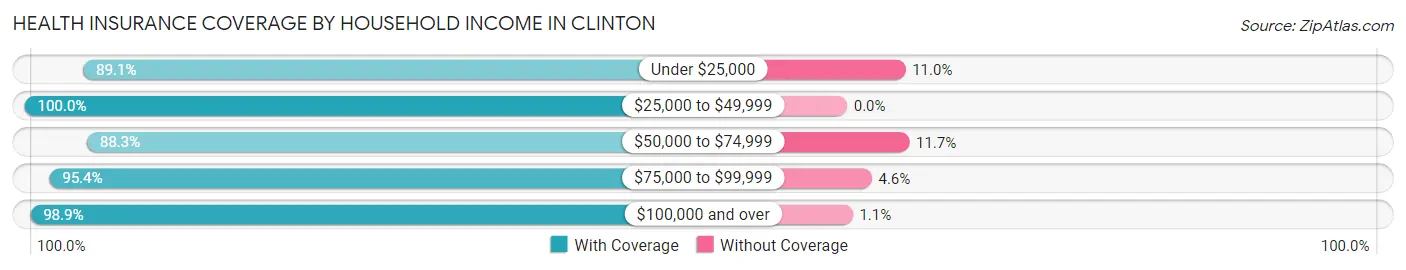
| Household Income | With Coverage | Without Coverage |
| Under $25,000 | 122 (89.0%) | 15 (11.0%) |
| $25,000 to $49,999 | 89 (100.0%) | 0 (0.0%) |
| $50,000 to $74,999 | 303 (88.3%) | 40 (11.7%) |
| $75,000 to $99,999 | 206 (95.4%) | 10 (4.6%) |
| $100,000 and over | 372 (98.9%) | 4 (1.1%) |
Public vs Private Health Insurance Coverage by Age in Clinton
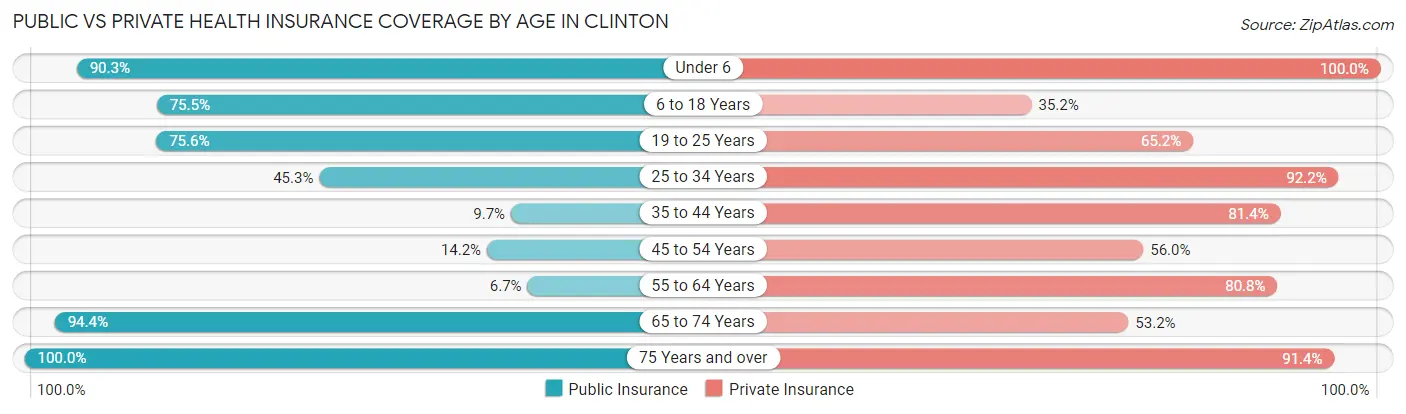
| Age Bracket | Public Insurance | Private Insurance |
| Under 6 | 56 (90.3%) | 62 (100.0%) |
| 6 to 18 Years | 120 (75.5%) | 56 (35.2%) |
| 19 to 25 Years | 102 (75.6%) | 88 (65.2%) |
| 25 to 34 Years | 29 (45.3%) | 59 (92.2%) |
| 35 to 44 Years | 11 (9.7%) | 92 (81.4%) |
| 45 to 54 Years | 19 (14.2%) | 75 (56.0%) |
| 55 to 64 Years | 8 (6.7%) | 97 (80.8%) |
| 65 to 74 Years | 236 (94.4%) | 133 (53.2%) |
| 75 Years and over | 128 (100.0%) | 117 (91.4%) |
| Total | 709 (60.9%) | 779 (66.9%) |
Disability Status by Sex by Age in Clinton
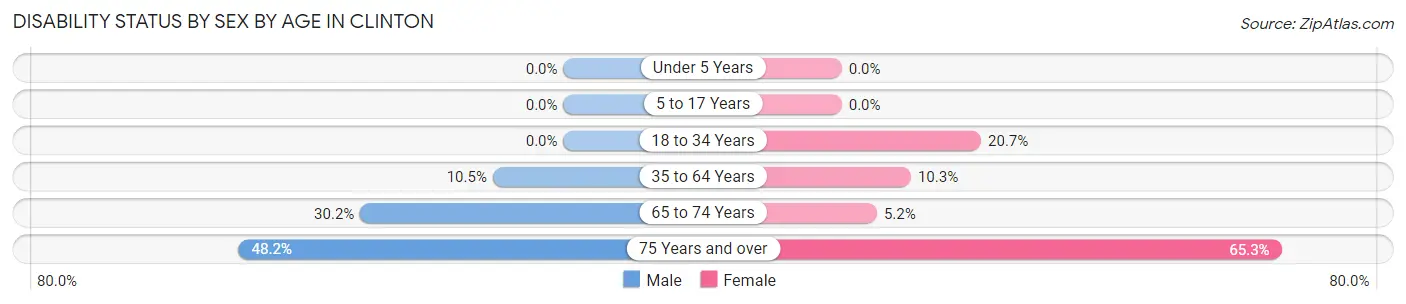
| Age Bracket | Male | Female |
| Under 5 Years | 0 (0.0%) | 0 (0.0%) |
| 5 to 17 Years | 0 (0.0%) | 0 (0.0%) |
| 18 to 34 Years | 0 (0.0%) | 12 (20.7%) |
| 35 to 64 Years | 15 (10.5%) | 23 (10.3%) |
| 65 to 74 Years | 35 (30.2%) | 7 (5.2%) |
| 75 Years and over | 27 (48.2%) | 47 (65.3%) |
Disability Class by Sex by Age in Clinton
Disability Class: Hearing Difficulty
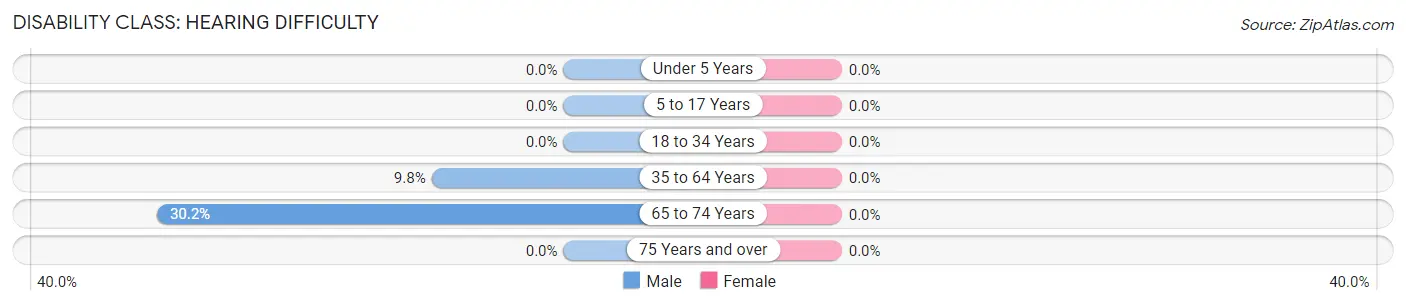
| Age Bracket | Male | Female |
| Under 5 Years | 0 (0.0%) | 0 (0.0%) |
| 5 to 17 Years | 0 (0.0%) | 0 (0.0%) |
| 18 to 34 Years | 0 (0.0%) | 0 (0.0%) |
| 35 to 64 Years | 14 (9.8%) | 0 (0.0%) |
| 65 to 74 Years | 35 (30.2%) | 0 (0.0%) |
| 75 Years and over | 0 (0.0%) | 0 (0.0%) |
Disability Class: Vision Difficulty
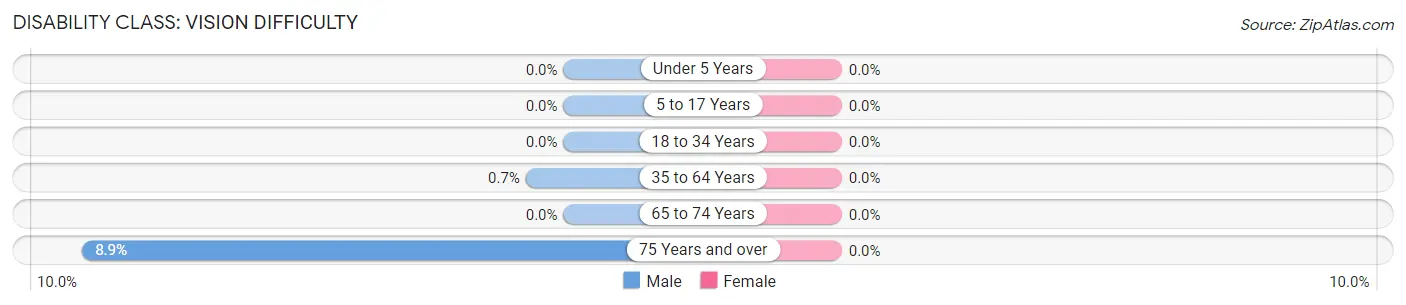
| Age Bracket | Male | Female |
| Under 5 Years | 0 (0.0%) | 0 (0.0%) |
| 5 to 17 Years | 0 (0.0%) | 0 (0.0%) |
| 18 to 34 Years | 0 (0.0%) | 0 (0.0%) |
| 35 to 64 Years | 1 (0.7%) | 0 (0.0%) |
| 65 to 74 Years | 0 (0.0%) | 0 (0.0%) |
| 75 Years and over | 5 (8.9%) | 0 (0.0%) |
Disability Class: Cognitive Difficulty
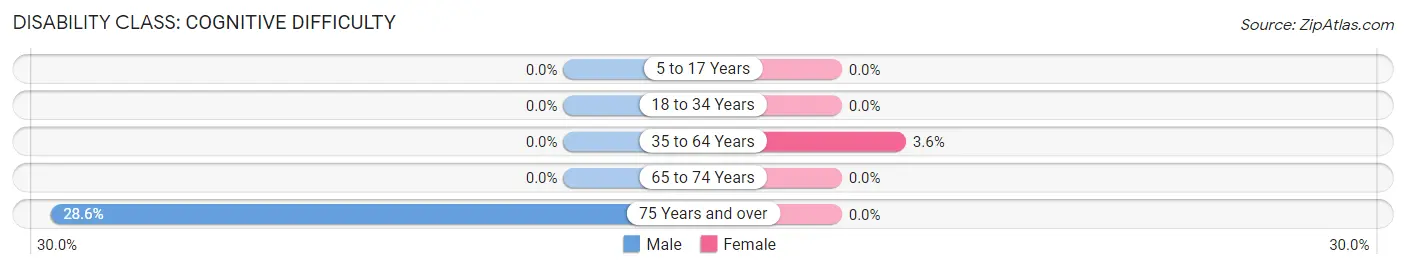
| Age Bracket | Male | Female |
| 5 to 17 Years | 0 (0.0%) | 0 (0.0%) |
| 18 to 34 Years | 0 (0.0%) | 0 (0.0%) |
| 35 to 64 Years | 0 (0.0%) | 8 (3.6%) |
| 65 to 74 Years | 0 (0.0%) | 0 (0.0%) |
| 75 Years and over | 16 (28.6%) | 0 (0.0%) |
Disability Class: Ambulatory Difficulty
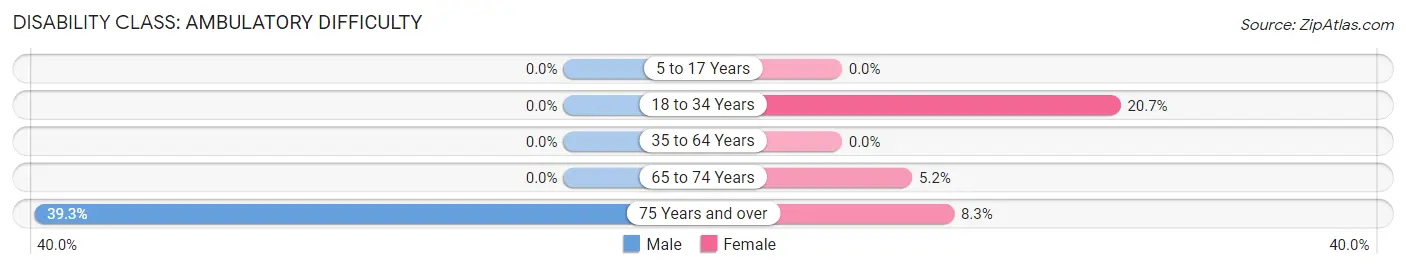
| Age Bracket | Male | Female |
| 5 to 17 Years | 0 (0.0%) | 0 (0.0%) |
| 18 to 34 Years | 0 (0.0%) | 12 (20.7%) |
| 35 to 64 Years | 0 (0.0%) | 0 (0.0%) |
| 65 to 74 Years | 0 (0.0%) | 7 (5.2%) |
| 75 Years and over | 22 (39.3%) | 6 (8.3%) |
Disability Class: Self-Care Difficulty

| Age Bracket | Male | Female |
| 5 to 17 Years | 0 (0.0%) | 0 (0.0%) |
| 18 to 34 Years | 0 (0.0%) | 0 (0.0%) |
| 35 to 64 Years | 0 (0.0%) | 8 (3.6%) |
| 65 to 74 Years | 0 (0.0%) | 0 (0.0%) |
| 75 Years and over | 16 (28.6%) | 0 (0.0%) |
Technology Access in Clinton
Computing Device Access in Clinton
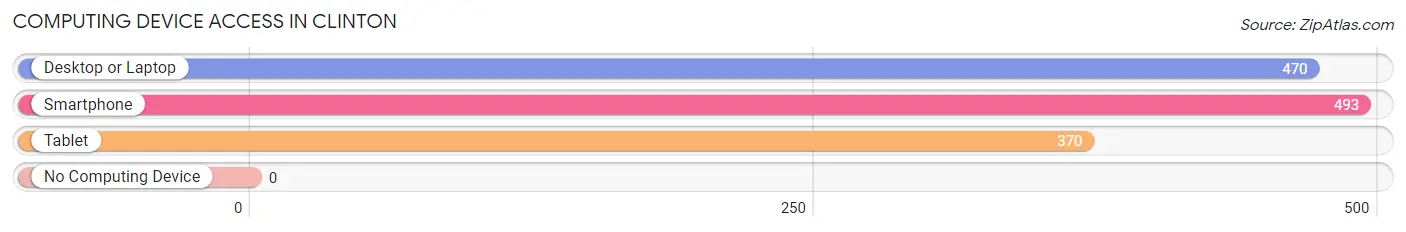
| Device Type | # Households | % Households |
| Desktop or Laptop | 470 | 92.7% |
| Smartphone | 493 | 97.2% |
| Tablet | 370 | 73.0% |
| No Computing Device | 0 | 0.0% |
| Total | 507 | 100.0% |
Internet Access in Clinton
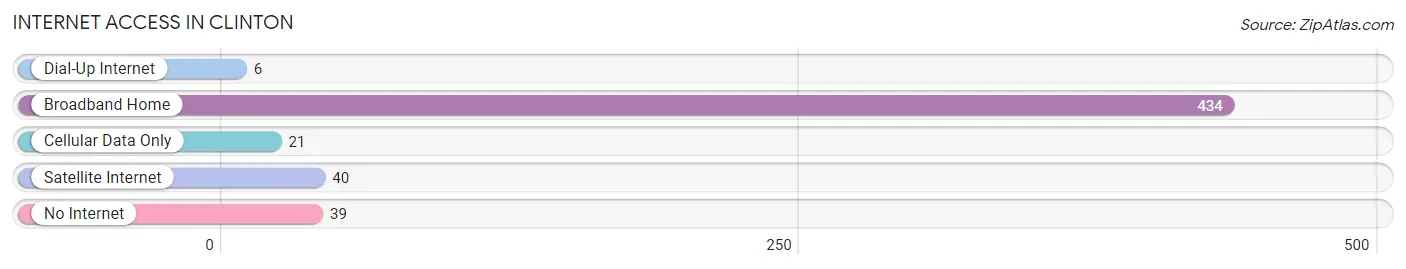
| Internet Type | # Households | % Households |
| Dial-Up Internet | 6 | 1.2% |
| Broadband Home | 434 | 85.6% |
| Cellular Data Only | 21 | 4.1% |
| Satellite Internet | 40 | 7.9% |
| No Internet | 39 | 7.7% |
| Total | 507 | 100.0% |
Clinton Summary
Clinton, Washington is a small town located on Whidbey Island in Island County, Washington. It is situated on the south end of the island, just north of the city of Oak Harbor. The town has a population of about 1,876 people, according to the 2010 census.
History
The area that is now Clinton was first settled in the late 1800s by a group of settlers from the nearby town of Coupeville. The settlers named the area Clinton after the nearby Clinton Creek. The town was officially incorporated in 1909.
In the early 1900s, the town was a popular destination for tourists, who came to enjoy the area's natural beauty and recreational activities. The town was also home to a number of businesses, including a sawmill, a cannery, and a hotel.
Geography
Clinton is located on the south end of Whidbey Island, just north of the city of Oak Harbor. The town is situated on a peninsula that juts out into the Puget Sound. The town is surrounded by water on three sides, with the Strait of Juan de Fuca to the west, Saratoga Passage to the north, and Admiralty Inlet to the east.
The town is located in a temperate rainforest climate, with mild temperatures year-round and abundant rainfall. The average annual precipitation is around 40 inches.
Economy
The economy of Clinton is largely based on tourism and the service industry. The town is home to a number of restaurants, shops, and other businesses that cater to tourists. The town is also home to a number of marinas, which provide services to boaters and other visitors to the area.
The town is also home to a number of small businesses, including a grocery store, a hardware store, and a gas station. The town is also home to a number of art galleries and other cultural attractions.
Demographics
According to the 2010 census, the population of Clinton was 1,876. The racial makeup of the town was 91.3% White, 2.2% Native American, 0.7% Asian, 0.3% African American, 0.1% Pacific Islander, and 4.4% from other races. The median household income was $50,938, and the median family income was $60,938.
Conclusion
Clinton, Washington is a small town located on Whidbey Island in Island County, Washington. It is situated on the south end of the island, just north of the city of Oak Harbor. The town has a population of about 1,876 people, according to the 2010 census. The economy of Clinton is largely based on tourism and the service industry, and the town is home to a number of restaurants, shops, and other businesses that cater to tourists. The town is also home to a number of small businesses, including a grocery store, a hardware store, and a gas station. The racial makeup of the town was 91.3% White, 2.2% Native American, 0.7% Asian, 0.3% African American, 0.1% Pacific Islander, and 4.4% from other races. The median household income was $50,938, and the median family income was $60,938.
Common Questions
What is Per Capita Income in Clinton?
Per Capita income in Clinton is $37,858.
What is the Median Family Income in Clinton?
Median Family Income in Clinton is $84,327.
What is the Median Household income in Clinton?
Median Household Income in Clinton is $69,570.
What is Income or Wage Gap in Clinton?
Income or Wage Gap in Clinton is 27.3%.
Women in Clinton earn 72.7 cents for every dollar earned by a man.
What is Inequality or Gini Index in Clinton?
Inequality or Gini Index in Clinton is 0.44.
What is the Total Population of Clinton?
Total Population of Clinton is 1,165.
What is the Total Male Population of Clinton?
Total Male Population of Clinton is 534.
What is the Total Female Population of Clinton?
Total Female Population of Clinton is 631.
What is the Ratio of Males per 100 Females in Clinton?
There are 84.63 Males per 100 Females in Clinton.
What is the Ratio of Females per 100 Males in Clinton?
There are 118.16 Females per 100 Males in Clinton.
What is the Median Population Age in Clinton?
Median Population Age in Clinton is 49.5 Years.
What is the Average Family Size in Clinton
Average Family Size in Clinton is 3.0 People.
What is the Average Household Size in Clinton
Average Household Size in Clinton is 2.3 People.
How Large is the Labor Force in Clinton?
There are 476 People in the Labor Forcein in Clinton.
What is the Percentage of People in the Labor Force in Clinton?
49.9% of People are in the Labor Force in Clinton.
What is the Unemployment Rate in Clinton?
Unemployment Rate in Clinton is 7.4%.