Nisqually Indian Community, WA Map & Demographics
Nisqually Indian Community Map
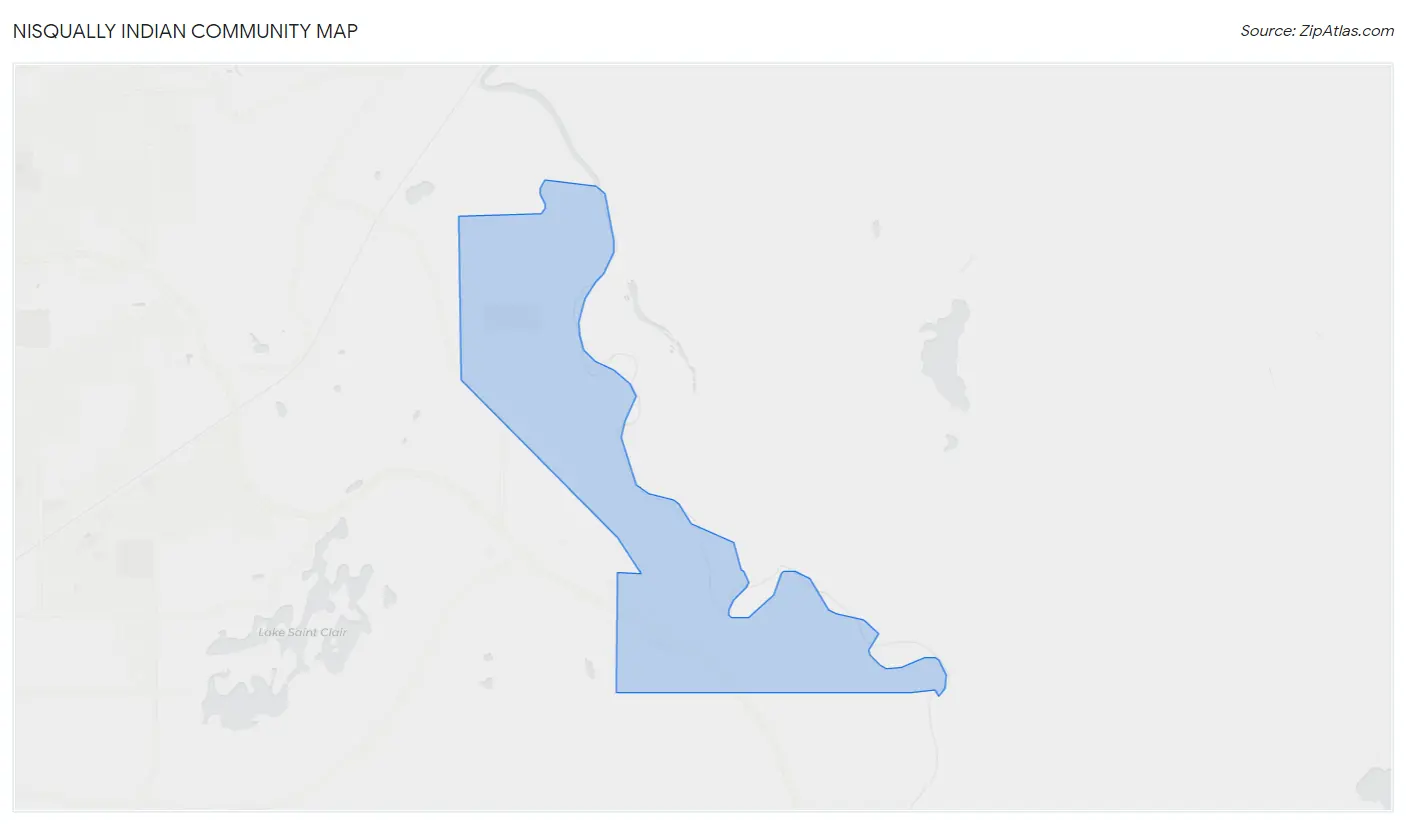
Nisqually Indian Community Overview
$26,462
PER CAPITA INCOME
$83,036
AVG FAMILY INCOME
$78,333
AVG HOUSEHOLD INCOME
11.3%
WAGE / INCOME GAP [ % ]
88.7¢/ $1
WAGE / INCOME GAP [ $ ]
$7,997
FAMILY INCOME DEFICIT
0.42
INEQUALITY / GINI INDEX
593
TOTAL POPULATION
333
MALE POPULATION
260
FEMALE POPULATION
128.08
MALES / 100 FEMALES
78.08
FEMALES / 100 MALES
36.0
MEDIAN AGE
3.5
AVG FAMILY SIZE
3.1
AVG HOUSEHOLD SIZE
187
LABOR FORCE [ PEOPLE ]
45.0%
PERCENT IN LABOR FORCE
9.7%
UNEMPLOYMENT RATE
Income in Nisqually Indian Community
Income Overview in Nisqually Indian Community
Per Capita Income in Nisqually Indian Community is $26,462, while median incomes of families and households are $83,036 and $78,333 respectively.
| Characteristic | Number | Measure |
| Per Capita Income | 593 | $26,462 |
| Median Family Income | 143 | $83,036 |
| Mean Family Income | 143 | $87,006 |
| Median Household Income | 194 | $78,333 |
| Mean Household Income | 194 | $82,724 |
| Income Deficit | 143 | $7,997 |
| Wage / Income Gap (%) | 593 | 11.31% |
| Wage / Income Gap ($) | 593 | 88.69¢ per $1 |
| Gini / Inequality Index | 593 | 0.42 |
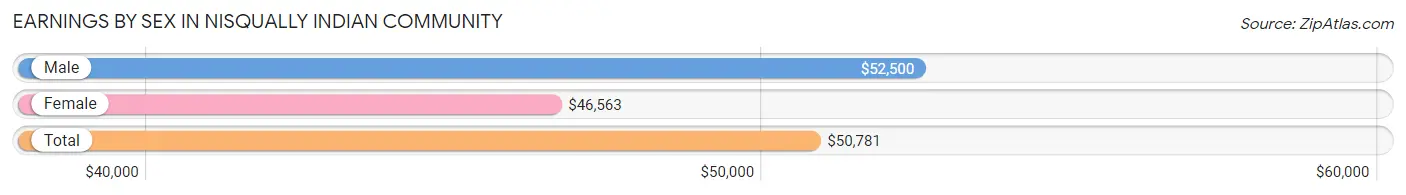
Earnings by Sex in Nisqually Indian Community
Average Earnings in Nisqually Indian Community are $50,781, $52,500 for men and $46,563 for women, a difference of 11.3%.
| Sex | Number | Average Earnings |
| Male | 94 (51.4%) | $52,500 |
| Female | 89 (48.6%) | $46,563 |
| Total | 183 (100.0%) | $50,781 |
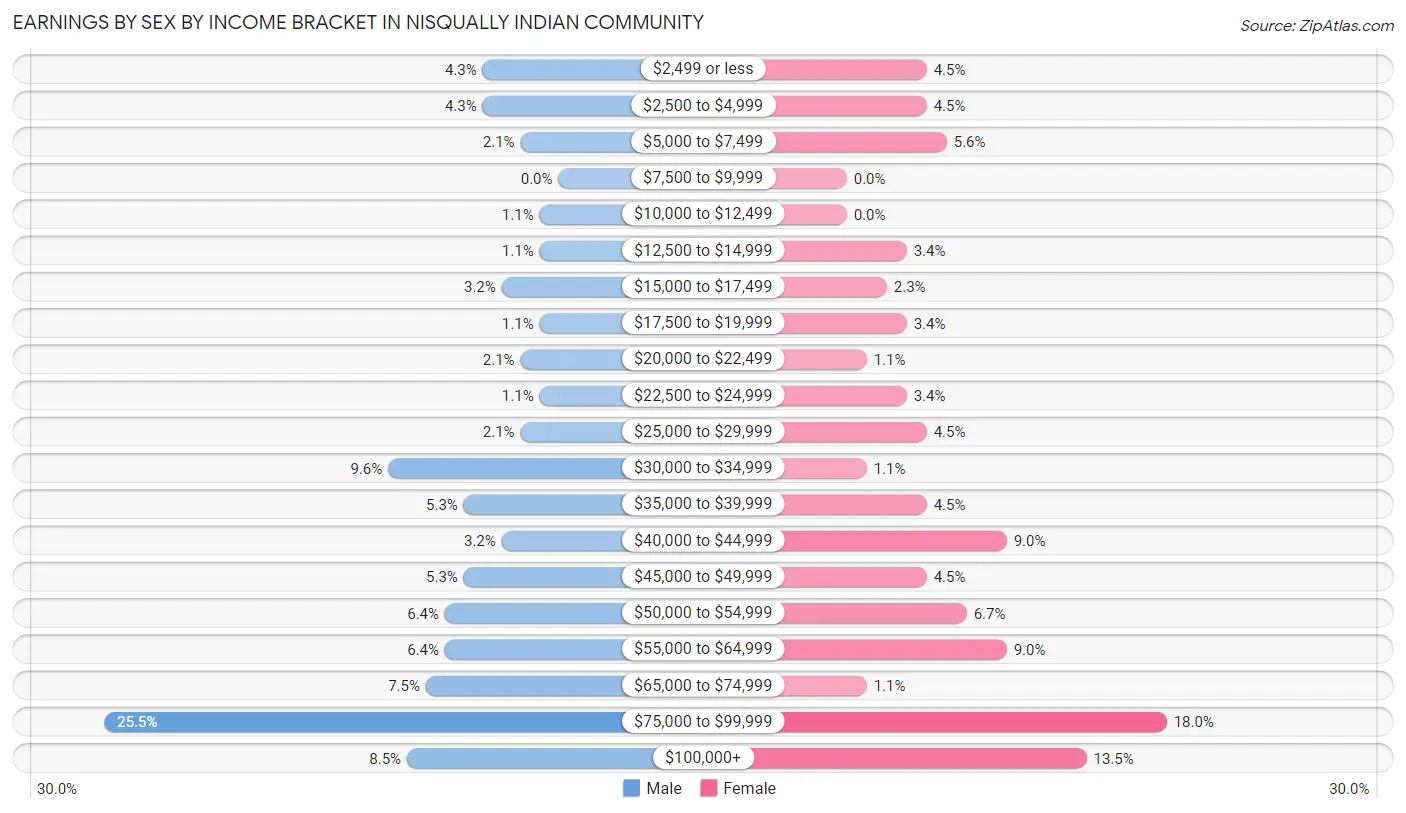
Earnings by Sex by Income Bracket in Nisqually Indian Community
The most common earnings brackets in Nisqually Indian Community are $75,000 to $99,999 for men (24 | 25.5%) and $75,000 to $99,999 for women (16 | 18.0%).
| Income | Male | Female |
| $2,499 or less | 4 (4.3%) | 4 (4.5%) |
| $2,500 to $4,999 | 4 (4.3%) | 4 (4.5%) |
| $5,000 to $7,499 | 2 (2.1%) | 5 (5.6%) |
| $7,500 to $9,999 | 0 (0.0%) | 0 (0.0%) |
| $10,000 to $12,499 | 1 (1.1%) | 0 (0.0%) |
| $12,500 to $14,999 | 1 (1.1%) | 3 (3.4%) |
| $15,000 to $17,499 | 3 (3.2%) | 2 (2.2%) |
| $17,500 to $19,999 | 1 (1.1%) | 3 (3.4%) |
| $20,000 to $22,499 | 2 (2.1%) | 1 (1.1%) |
| $22,500 to $24,999 | 1 (1.1%) | 3 (3.4%) |
| $25,000 to $29,999 | 2 (2.1%) | 4 (4.5%) |
| $30,000 to $34,999 | 9 (9.6%) | 1 (1.1%) |
| $35,000 to $39,999 | 5 (5.3%) | 4 (4.5%) |
| $40,000 to $44,999 | 3 (3.2%) | 8 (9.0%) |
| $45,000 to $49,999 | 5 (5.3%) | 4 (4.5%) |
| $50,000 to $54,999 | 6 (6.4%) | 6 (6.7%) |
| $55,000 to $64,999 | 6 (6.4%) | 8 (9.0%) |
| $65,000 to $74,999 | 7 (7.4%) | 1 (1.1%) |
| $75,000 to $99,999 | 24 (25.5%) | 16 (18.0%) |
| $100,000+ | 8 (8.5%) | 12 (13.5%) |
| Total | 94 (100.0%) | 89 (100.0%) |
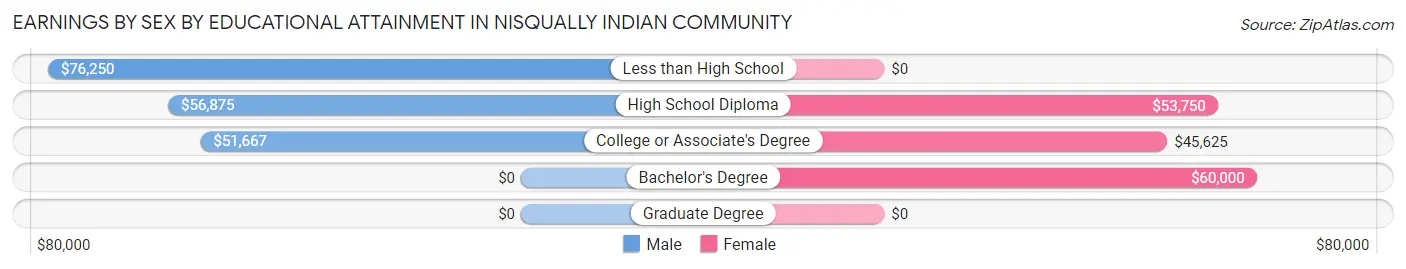
Earnings by Sex by Educational Attainment in Nisqually Indian Community
Average earnings in Nisqually Indian Community are $56,250 for men and $52,188 for women, a difference of 7.2%. Men with an educational attainment of less than high school enjoy the highest average annual earnings of $76,250, while those with college or associate's degree education earn the least with $51,667. Women with an educational attainment of bachelor's degree earn the most with the average annual earnings of $60,000, while those with college or associate's degree education have the smallest earnings of $45,625.
| Educational Attainment | Male Income | Female Income |
| Less than High School | $76,250 | $0 |
| High School Diploma | $56,875 | $53,750 |
| College or Associate's Degree | $51,667 | $45,625 |
| Bachelor's Degree | - | - |
| Graduate Degree | - | - |
| Total | $56,250 | $52,188 |
Family Income in Nisqually Indian Community
Family Income Brackets in Nisqually Indian Community
According to the Nisqually Indian Community family income data, there are 29 families falling into the $100,000 to $149,999 income range, which is the most common income bracket and makes up 20.3% of all families. Conversely, the $15,000 to $24,999 income bracket is the least frequent group with only 2 families (1.4%) belonging to this category.
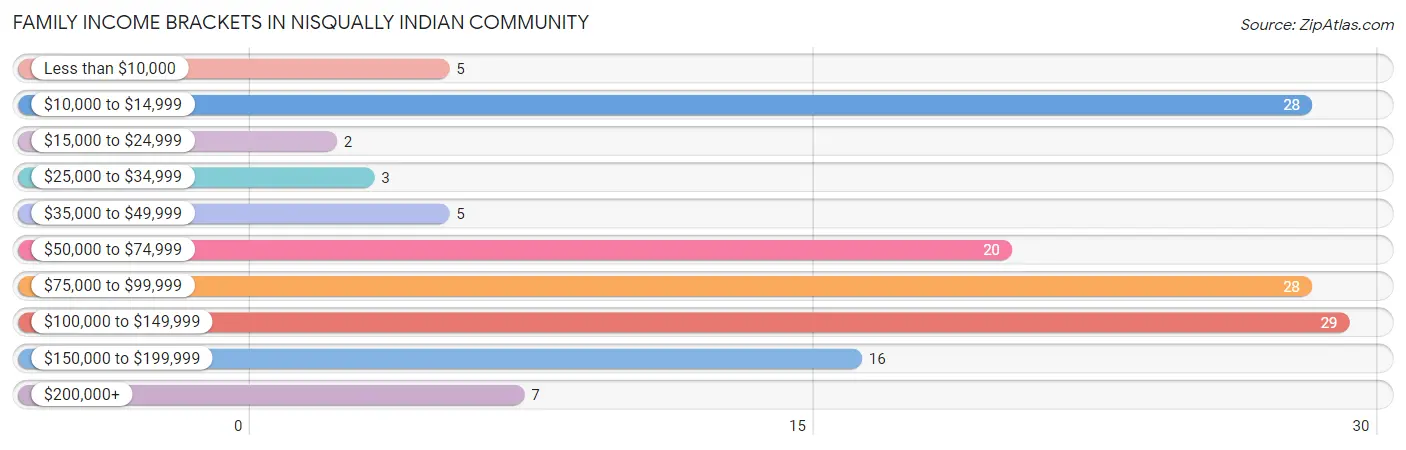
| Income Bracket | # Families | % Families |
| Less than $10,000 | 5 | 3.5% |
| $10,000 to $14,999 | 28 | 19.6% |
| $15,000 to $24,999 | 2 | 1.4% |
| $25,000 to $34,999 | 3 | 2.1% |
| $35,000 to $49,999 | 5 | 3.5% |
| $50,000 to $74,999 | 20 | 14.0% |
| $75,000 to $99,999 | 28 | 19.6% |
| $100,000 to $149,999 | 29 | 20.3% |
| $150,000 to $199,999 | 16 | 11.2% |
| $200,000+ | 7 | 4.9% |
Family Income by Famaliy Size in Nisqually Indian Community
4-person families (16 | 11.2%) account for the highest median family income in Nisqually Indian Community with $127,500 per family, while 2-person families (76 | 53.1%) have the highest median income of $33,750 per family member.
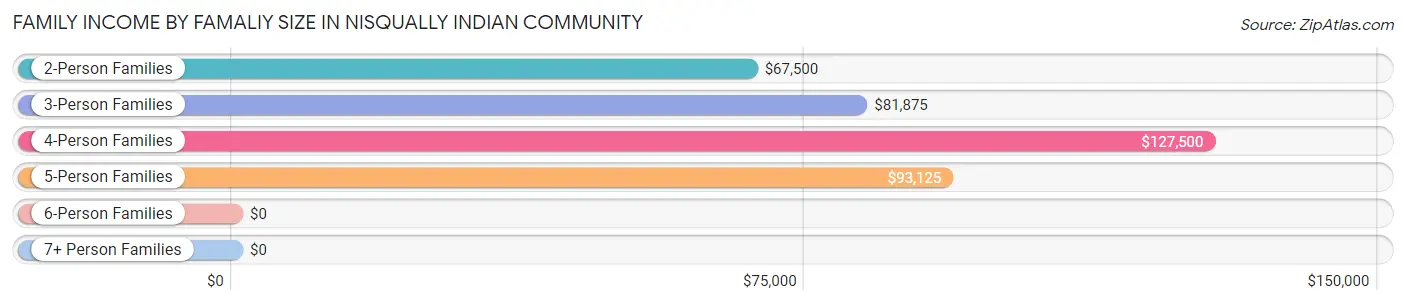
| Income Bracket | # Families | Median Income |
| 2-Person Families | 76 (53.1%) | $67,500 |
| 3-Person Families | 29 (20.3%) | $81,875 |
| 4-Person Families | 16 (11.2%) | $127,500 |
| 5-Person Families | 17 (11.9%) | $93,125 |
| 6-Person Families | 2 (1.4%) | $0 |
| 7+ Person Families | 3 (2.1%) | $0 |
| Total | 143 (100.0%) | $83,036 |
Family Income by Number of Earners in Nisqually Indian Community
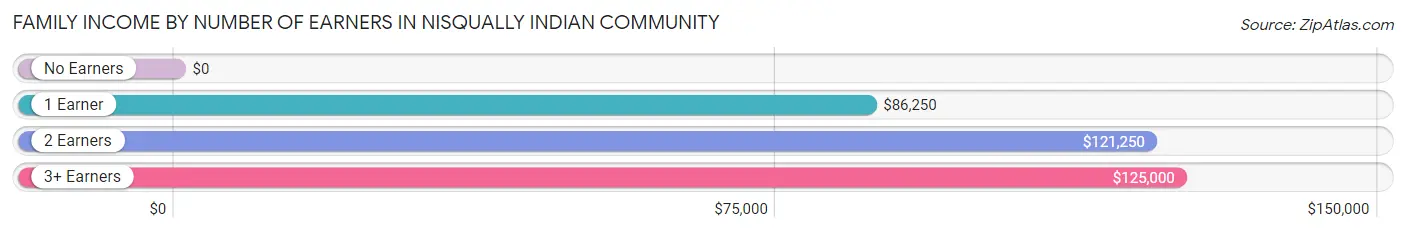
| Number of Earners | # Families | Median Income |
| No Earners | 52 (36.4%) | $0 |
| 1 Earner | 45 (31.5%) | $86,250 |
| 2 Earners | 38 (26.6%) | $121,250 |
| 3+ Earners | 8 (5.6%) | $125,000 |
| Total | 143 (100.0%) | $83,036 |
Household Income in Nisqually Indian Community
Household Income Brackets in Nisqually Indian Community
With 41 households falling in the category, the $100,000 to $149,999 income range is the most frequent in Nisqually Indian Community, accounting for 21.1% of all households. In contrast, only 5 households (2.6%) fall into the $25,000 to $34,999 income bracket, making it the least populous group.
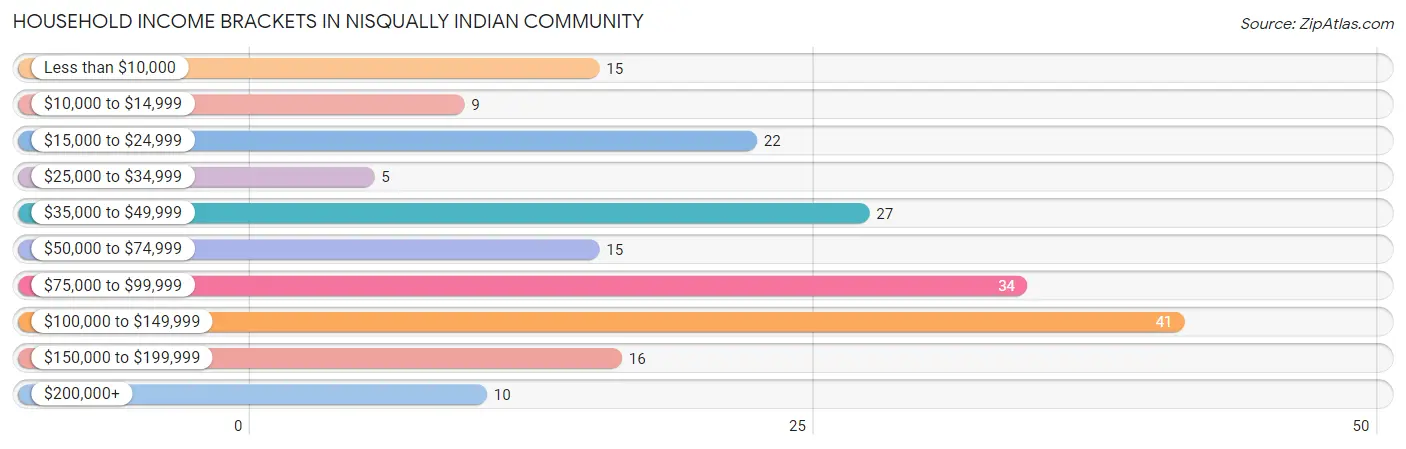
| Income Bracket | # Households | % Households |
| Less than $10,000 | 15 | 7.7% |
| $10,000 to $14,999 | 9 | 4.6% |
| $15,000 to $24,999 | 22 | 11.3% |
| $25,000 to $34,999 | 5 | 2.6% |
| $35,000 to $49,999 | 27 | 13.9% |
| $50,000 to $74,999 | 15 | 7.7% |
| $75,000 to $99,999 | 34 | 17.5% |
| $100,000 to $149,999 | 41 | 21.1% |
| $150,000 to $199,999 | 16 | 8.2% |
| $200,000+ | 10 | 5.2% |
Household Income by Householder Age in Nisqually Indian Community
The median household income in Nisqually Indian Community is $78,333, with the highest median household income of $99,063 found in the 45 to 64 years age bracket for the primary householder. A total of 67 households (34.5%) fall into this category.
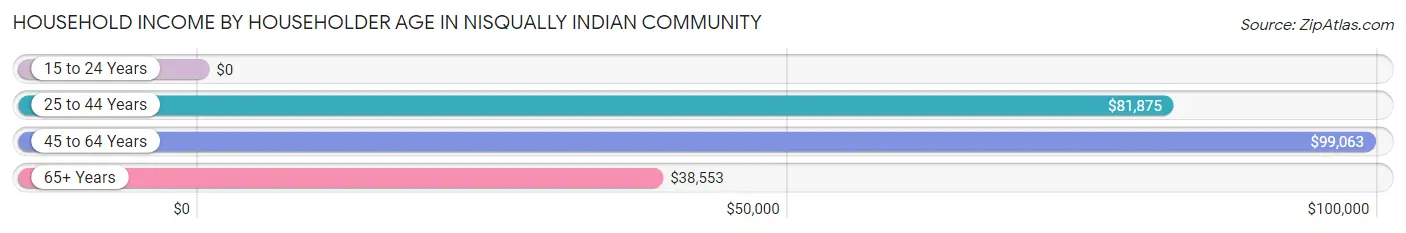
| Income Bracket | # Households | Median Income |
| 15 to 24 Years | 0 (0.0%) | $0 |
| 25 to 44 Years | 41 (21.1%) | $81,875 |
| 45 to 64 Years | 67 (34.5%) | $99,063 |
| 65+ Years | 86 (44.3%) | $38,553 |
| Total | 194 (100.0%) | $78,333 |
Poverty in Nisqually Indian Community
Income Below Poverty by Sex and Age in Nisqually Indian Community
With 23.8% poverty level for males and 12.4% for females among the residents of Nisqually Indian Community, 16 and 17 year old males and 16 and 17 year old females are the most vulnerable to poverty, with 4 males (66.7%) and 4 females (33.3%) in their respective age groups living below the poverty level.
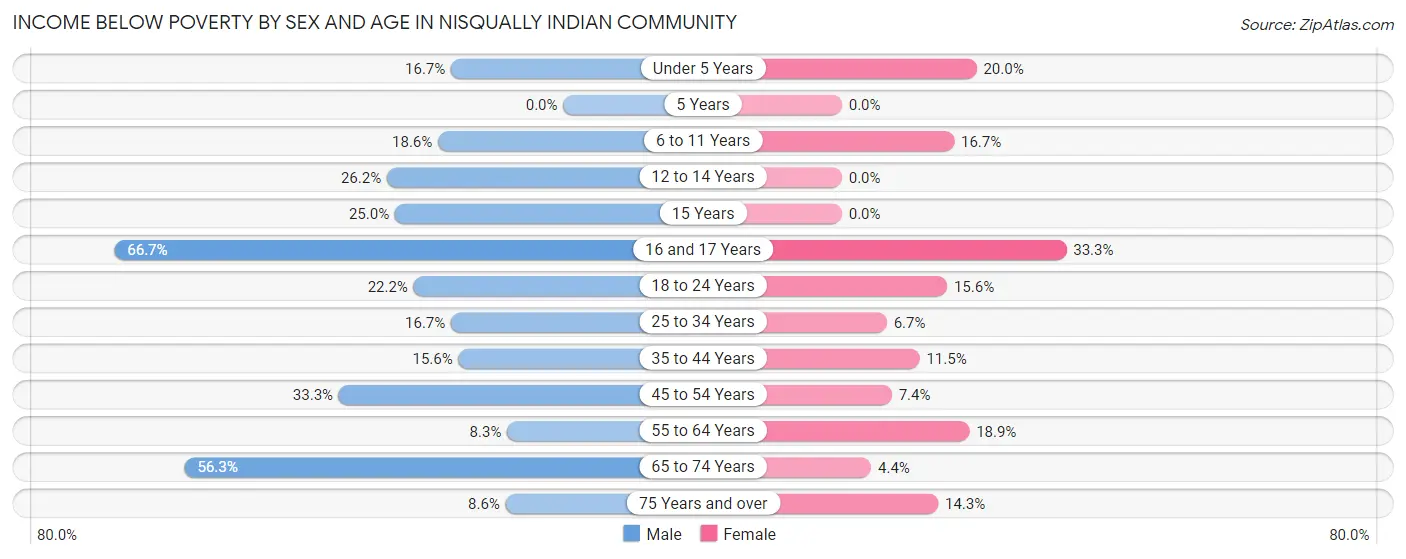
| Age Bracket | Male | Female |
| Under 5 Years | 2 (16.7%) | 2 (20.0%) |
| 5 Years | 0 (0.0%) | 0 (0.0%) |
| 6 to 11 Years | 8 (18.6%) | 3 (16.7%) |
| 12 to 14 Years | 11 (26.2%) | 0 (0.0%) |
| 15 Years | 1 (25.0%) | 0 (0.0%) |
| 16 and 17 Years | 4 (66.7%) | 4 (33.3%) |
| 18 to 24 Years | 2 (22.2%) | 5 (15.6%) |
| 25 to 34 Years | 3 (16.7%) | 2 (6.7%) |
| 35 to 44 Years | 7 (15.6%) | 3 (11.5%) |
| 45 to 54 Years | 6 (33.3%) | 2 (7.4%) |
| 55 to 64 Years | 3 (8.3%) | 7 (18.9%) |
| 65 to 74 Years | 27 (56.2%) | 1 (4.3%) |
| 75 Years and over | 3 (8.6%) | 2 (14.3%) |
| Total | 77 (23.8%) | 31 (12.4%) |
Income Above Poverty by Sex and Age in Nisqually Indian Community
According to the poverty statistics in Nisqually Indian Community, males aged 5 years and females aged 5 years are the age groups that are most secure financially, with 100.0% of males and 100.0% of females in these age groups living above the poverty line.
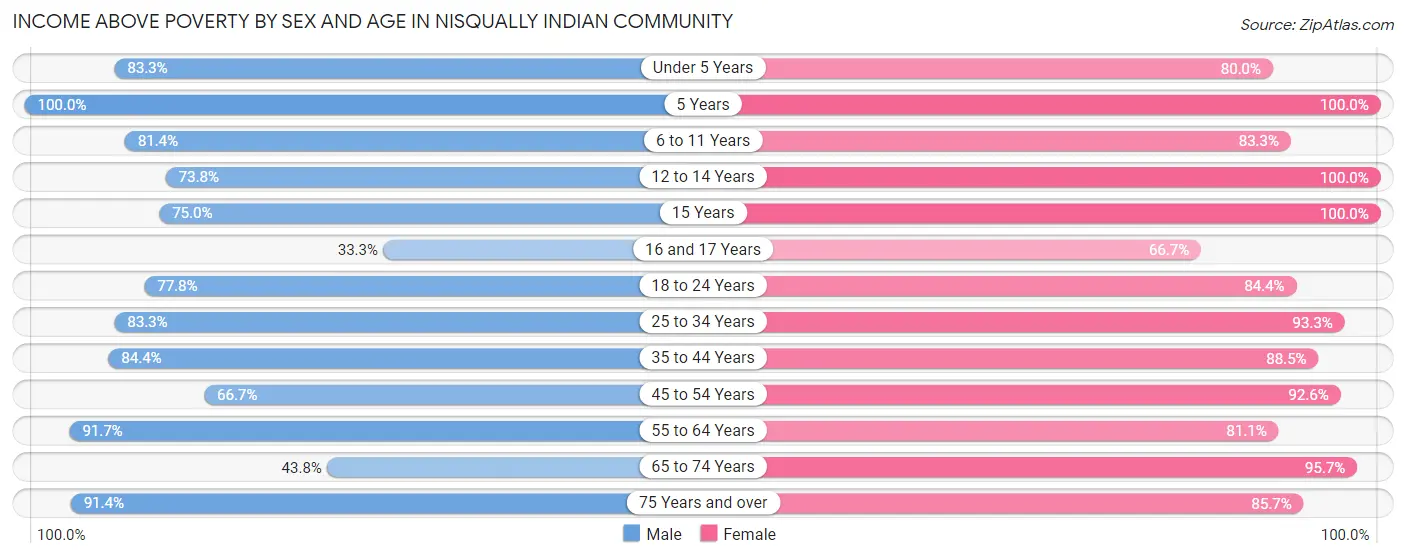
| Age Bracket | Male | Female |
| Under 5 Years | 10 (83.3%) | 8 (80.0%) |
| 5 Years | 8 (100.0%) | 6 (100.0%) |
| 6 to 11 Years | 35 (81.4%) | 15 (83.3%) |
| 12 to 14 Years | 31 (73.8%) | 13 (100.0%) |
| 15 Years | 3 (75.0%) | 2 (100.0%) |
| 16 and 17 Years | 2 (33.3%) | 8 (66.7%) |
| 18 to 24 Years | 7 (77.8%) | 27 (84.4%) |
| 25 to 34 Years | 15 (83.3%) | 28 (93.3%) |
| 35 to 44 Years | 38 (84.4%) | 23 (88.5%) |
| 45 to 54 Years | 12 (66.7%) | 25 (92.6%) |
| 55 to 64 Years | 33 (91.7%) | 30 (81.1%) |
| 65 to 74 Years | 21 (43.8%) | 22 (95.7%) |
| 75 Years and over | 32 (91.4%) | 12 (85.7%) |
| Total | 247 (76.2%) | 219 (87.6%) |
Income Below Poverty Among Married-Couple Families in Nisqually Indian Community
The poverty statistics for married-couple families in Nisqually Indian Community show that 26.4% or 23 of the total 87 families live below the poverty line. Families with 3 or 4 children have the highest poverty rate of 60.0%, comprising of 3 families. On the other hand, families with 1 or 2 children have the lowest poverty rate of 0.0%, which includes 0 families.
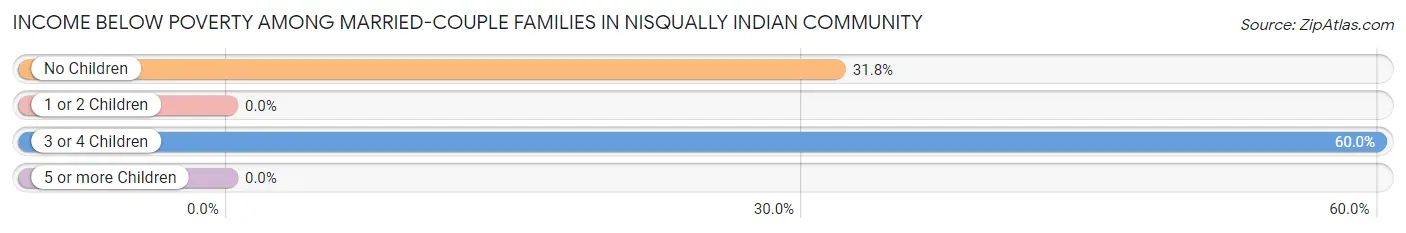
| Children | Above Poverty | Below Poverty |
| No Children | 43 (68.2%) | 20 (31.8%) |
| 1 or 2 Children | 18 (100.0%) | 0 (0.0%) |
| 3 or 4 Children | 2 (40.0%) | 3 (60.0%) |
| 5 or more Children | 1 (100.0%) | 0 (0.0%) |
| Total | 64 (73.6%) | 23 (26.4%) |
Income Below Poverty Among Single-Parent Households in Nisqually Indian Community
According to the poverty data in Nisqually Indian Community, 47.4% or 9 single-father households and 13.5% or 5 single-mother households are living below the poverty line. Among single-father households, those with 3 or 4 children have the highest poverty rate, with 1 households (100.0%) experiencing poverty. Likewise, among single-mother households, those with 1 or 2 children have the highest poverty rate, with 4 households (23.5%) falling below the poverty line.
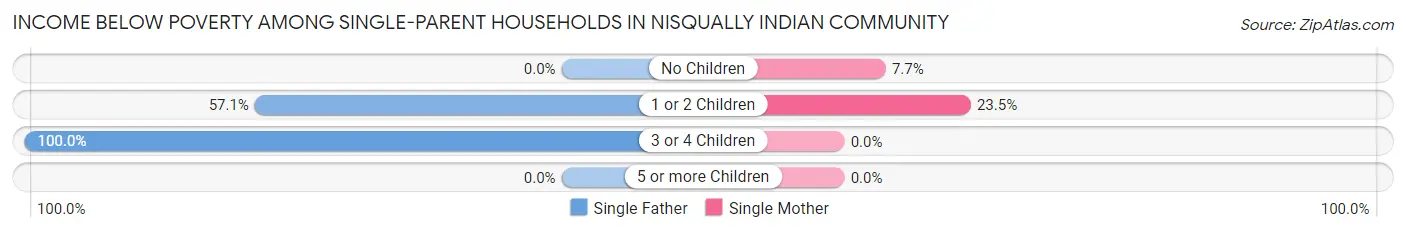
| Children | Single Father | Single Mother |
| No Children | 0 (0.0%) | 1 (7.7%) |
| 1 or 2 Children | 8 (57.1%) | 4 (23.5%) |
| 3 or 4 Children | 1 (100.0%) | 0 (0.0%) |
| 5 or more Children | 0 (0.0%) | 0 (0.0%) |
| Total | 9 (47.4%) | 5 (13.5%) |
Income Below Poverty Among Married-Couple vs Single-Parent Households in Nisqually Indian Community
The poverty data for Nisqually Indian Community shows that 23 of the married-couple family households (26.4%) and 14 of the single-parent households (25.0%) are living below the poverty level. Within the married-couple family households, those with 3 or 4 children have the highest poverty rate, with 3 households (60.0%) falling below the poverty line. Among the single-parent households, those with 1 or 2 children have the highest poverty rate, with 12 household (38.7%) living below poverty.
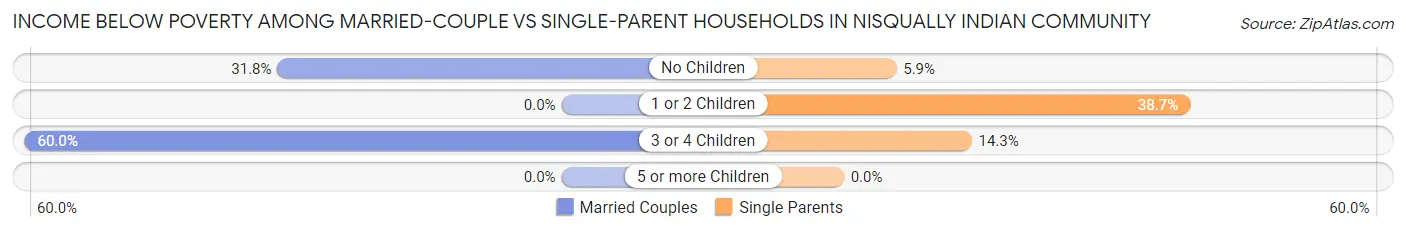
| Children | Married-Couple Families | Single-Parent Households |
| No Children | 20 (31.8%) | 1 (5.9%) |
| 1 or 2 Children | 0 (0.0%) | 12 (38.7%) |
| 3 or 4 Children | 3 (60.0%) | 1 (14.3%) |
| 5 or more Children | 0 (0.0%) | 0 (0.0%) |
| Total | 23 (26.4%) | 14 (25.0%) |
Race in Nisqually Indian Community
The most populous races in Nisqually Indian Community are Native / Alaskan (360 | 60.7%), White / Caucasian (158 | 26.6%), and Two or more Races (46 | 7.8%).
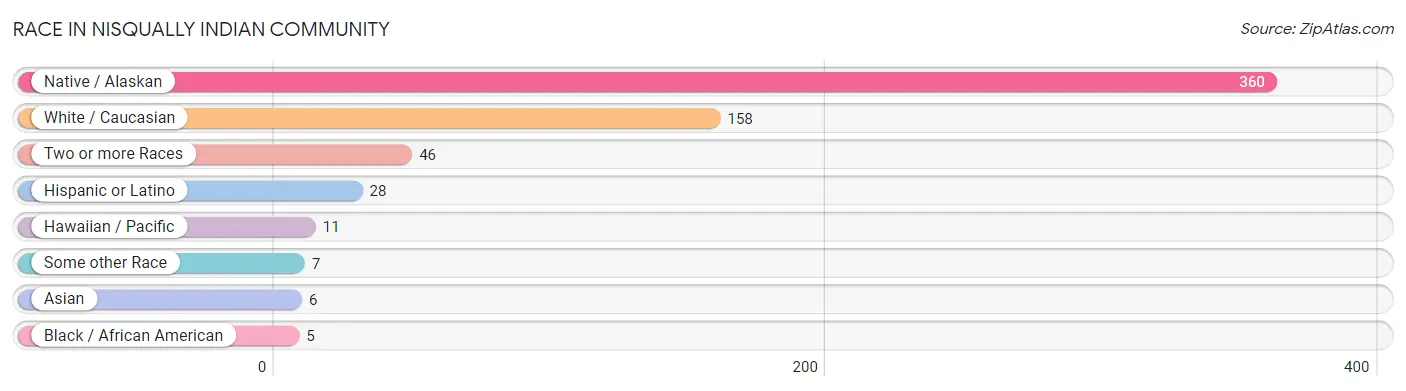
| Race | # Population | % Population |
| Asian | 6 | 1.0% |
| Black / African American | 5 | 0.8% |
| Hawaiian / Pacific | 11 | 1.8% |
| Hispanic or Latino | 28 | 4.7% |
| Native / Alaskan | 360 | 60.7% |
| White / Caucasian | 158 | 26.6% |
| Two or more Races | 46 | 7.8% |
| Some other Race | 7 | 1.2% |
| Total | 593 | 100.0% |
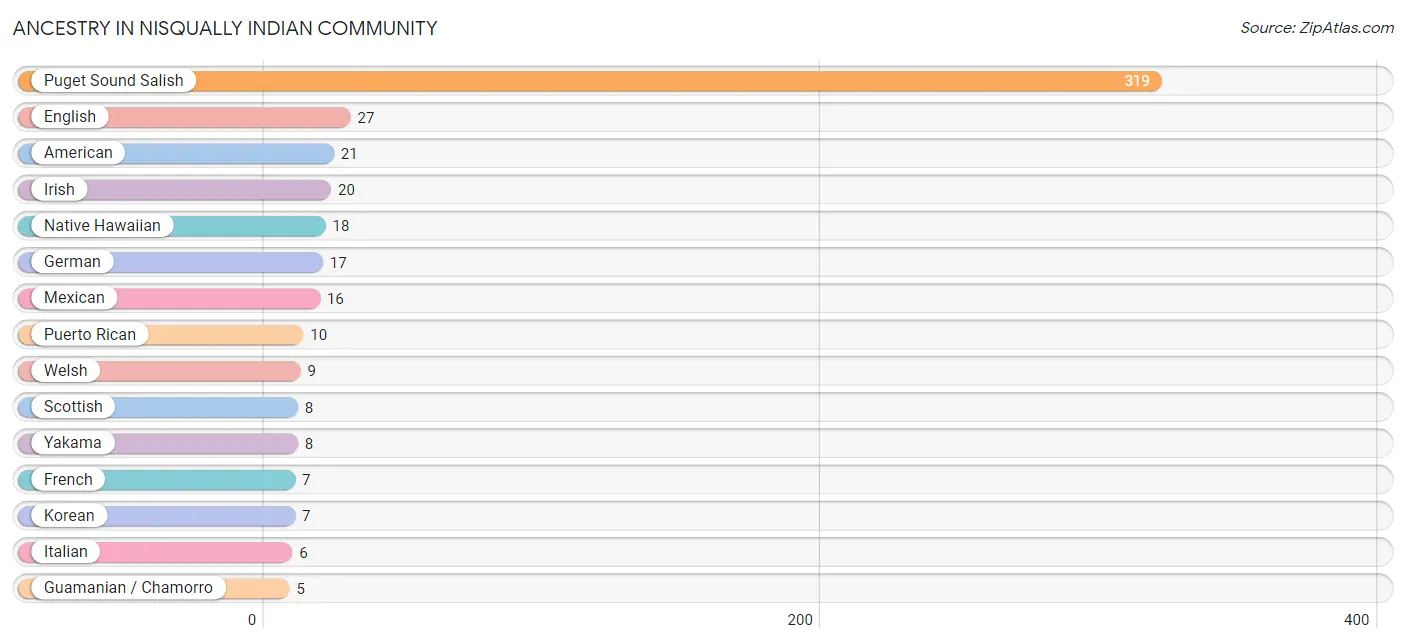
Ancestry in Nisqually Indian Community
The most populous ancestries reported in Nisqually Indian Community are Puget Sound Salish (319 | 53.8%), English (27 | 4.5%), American (21 | 3.5%), Irish (20 | 3.4%), and Native Hawaiian (18 | 3.0%), together accounting for 68.3% of all Nisqually Indian Community residents.
| Ancestry | # Population | % Population |
| American | 21 | 3.5% |
| Apache | 2 | 0.3% |
| Australian | 2 | 0.3% |
| Bhutanese | 2 | 0.3% |
| Blackfeet | 4 | 0.7% |
| Burmese | 4 | 0.7% |
| Central American Indian | 2 | 0.3% |
| Cheyenne | 1 | 0.2% |
| Chinese | 3 | 0.5% |
| Chippewa | 2 | 0.3% |
| Colville | 2 | 0.3% |
| Czech | 3 | 0.5% |
| Eastern European | 2 | 0.3% |
| English | 27 | 4.5% |
| French | 7 | 1.2% |
| French American Indian | 1 | 0.2% |
| French Canadian | 3 | 0.5% |
| German | 17 | 2.9% |
| Guamanian / Chamorro | 5 | 0.8% |
| Irish | 20 | 3.4% |
| Italian | 6 | 1.0% |
| Korean | 7 | 1.2% |
| Mexican | 16 | 2.7% |
| Native Hawaiian | 18 | 3.0% |
| Navajo | 4 | 0.7% |
| Northern European | 2 | 0.3% |
| Norwegian | 3 | 0.5% |
| Peruvian | 2 | 0.3% |
| Polish | 1 | 0.2% |
| Puerto Rican | 10 | 1.7% |
| Puget Sound Salish | 319 | 53.8% |
| Russian | 2 | 0.3% |
| Samoan | 1 | 0.2% |
| Scottish | 8 | 1.3% |
| Sioux | 1 | 0.2% |
| South American | 2 | 0.3% |
| Sri Lankan | 1 | 0.2% |
| Swedish | 1 | 0.2% |
| Swiss | 1 | 0.2% |
| Welsh | 9 | 1.5% |
| Yakama | 8 | 1.3% | View All 41 Rows |
Immigrants in Nisqually Indian Community
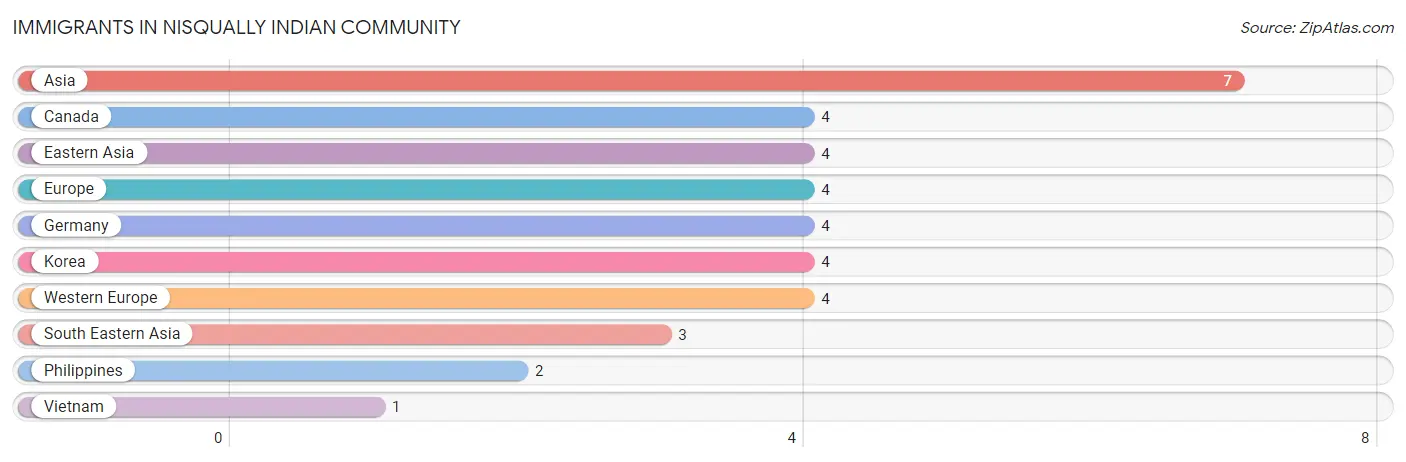
The most numerous immigrant groups reported in Nisqually Indian Community came from Asia (7 | 1.2%), Canada (4 | 0.7%), Eastern Asia (4 | 0.7%), Europe (4 | 0.7%), and Germany (4 | 0.7%), together accounting for 3.9% of all Nisqually Indian Community residents.
| Immigration Origin | # Population | % Population |
| Asia | 7 | 1.2% |
| Canada | 4 | 0.7% |
| Eastern Asia | 4 | 0.7% |
| Europe | 4 | 0.7% |
| Germany | 4 | 0.7% |
| Korea | 4 | 0.7% |
| Philippines | 2 | 0.3% |
| South Eastern Asia | 3 | 0.5% |
| Vietnam | 1 | 0.2% |
| Western Europe | 4 | 0.7% | View All 10 Rows |
Sex and Age in Nisqually Indian Community
Sex and Age in Nisqually Indian Community
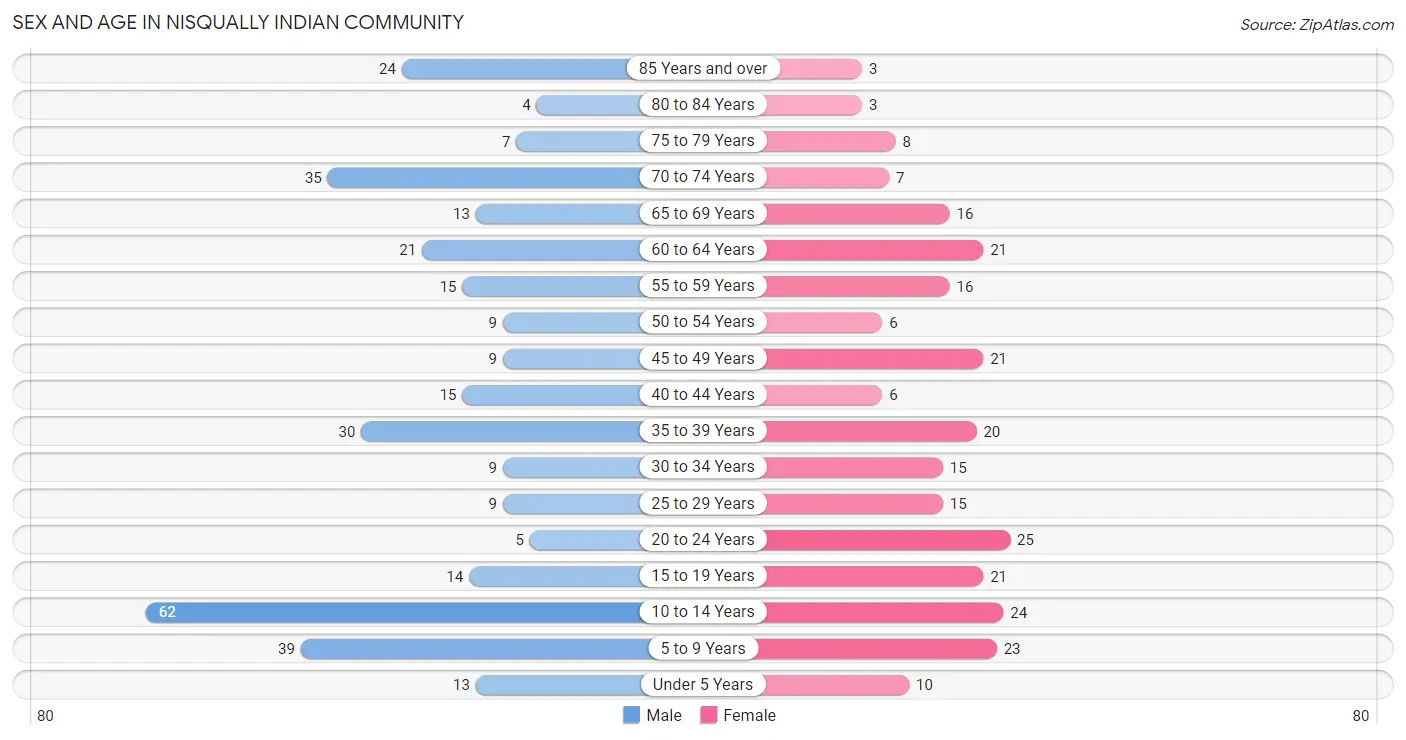
The most populous age groups in Nisqually Indian Community are 10 to 14 Years (62 | 18.6%) for men and 20 to 24 Years (25 | 9.6%) for women.
| Age Bracket | Male | Female |
| Under 5 Years | 13 (3.9%) | 10 (3.8%) |
| 5 to 9 Years | 39 (11.7%) | 23 (8.8%) |
| 10 to 14 Years | 62 (18.6%) | 24 (9.2%) |
| 15 to 19 Years | 14 (4.2%) | 21 (8.1%) |
| 20 to 24 Years | 5 (1.5%) | 25 (9.6%) |
| 25 to 29 Years | 9 (2.7%) | 15 (5.8%) |
| 30 to 34 Years | 9 (2.7%) | 15 (5.8%) |
| 35 to 39 Years | 30 (9.0%) | 20 (7.7%) |
| 40 to 44 Years | 15 (4.5%) | 6 (2.3%) |
| 45 to 49 Years | 9 (2.7%) | 21 (8.1%) |
| 50 to 54 Years | 9 (2.7%) | 6 (2.3%) |
| 55 to 59 Years | 15 (4.5%) | 16 (6.1%) |
| 60 to 64 Years | 21 (6.3%) | 21 (8.1%) |
| 65 to 69 Years | 13 (3.9%) | 16 (6.1%) |
| 70 to 74 Years | 35 (10.5%) | 7 (2.7%) |
| 75 to 79 Years | 7 (2.1%) | 8 (3.1%) |
| 80 to 84 Years | 4 (1.2%) | 3 (1.1%) |
| 85 Years and over | 24 (7.2%) | 3 (1.1%) |
| Total | 333 (100.0%) | 260 (100.0%) |
Families and Households in Nisqually Indian Community
Median Family Size in Nisqually Indian Community
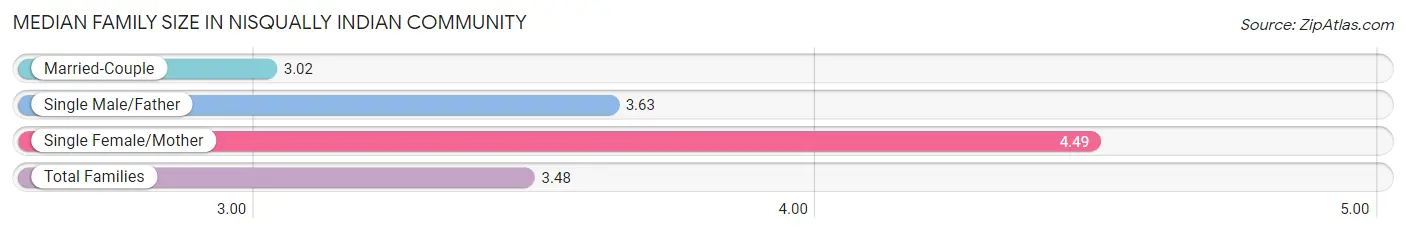
The median family size in Nisqually Indian Community is 3.48 persons per family, with single female/mother families (37 | 25.9%) accounting for the largest median family size of 4.49 persons per family. On the other hand, married-couple families (87 | 60.8%) represent the smallest median family size with 3.02 persons per family.
| Family Type | # Families | Family Size |
| Married-Couple | 87 (60.8%) | 3.02 |
| Single Male/Father | 19 (13.3%) | 3.63 |
| Single Female/Mother | 37 (25.9%) | 4.49 |
| Total Families | 143 (100.0%) | 3.48 |
Median Household Size in Nisqually Indian Community
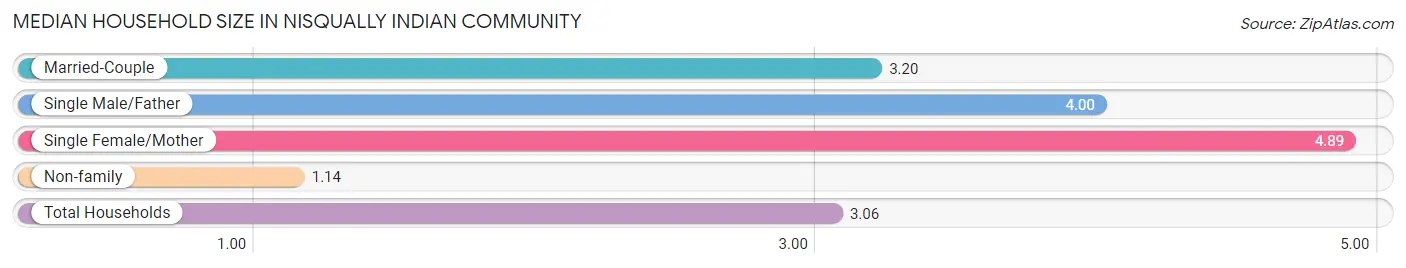
The median household size in Nisqually Indian Community is 3.06 persons per household, with single female/mother households (37 | 19.1%) accounting for the largest median household size of 4.89 persons per household. non-family households (51 | 26.3%) represent the smallest median household size with 1.14 persons per household.
| Household Type | # Households | Household Size |
| Married-Couple | 87 (44.9%) | 3.20 |
| Single Male/Father | 19 (9.8%) | 4.00 |
| Single Female/Mother | 37 (19.1%) | 4.89 |
| Non-family | 51 (26.3%) | 1.14 |
| Total Households | 194 (100.0%) | 3.06 |
Household Size by Marriage Status in Nisqually Indian Community
Out of a total of 194 households in Nisqually Indian Community, 143 (73.7%) are family households, while 51 (26.3%) are nonfamily households. The most numerous type of family households are 2-person households, comprising 56, and the most common type of nonfamily households are 1-person households, comprising 48.
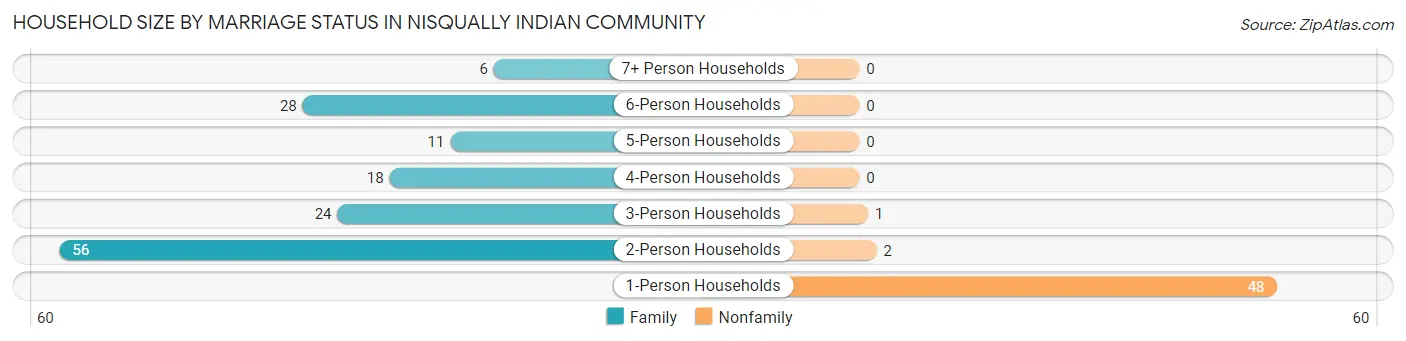
| Household Size | Family Households | Nonfamily Households |
| 1-Person Households | - | 48 (24.7%) |
| 2-Person Households | 56 (28.9%) | 2 (1.0%) |
| 3-Person Households | 24 (12.4%) | 1 (0.5%) |
| 4-Person Households | 18 (9.3%) | 0 (0.0%) |
| 5-Person Households | 11 (5.7%) | 0 (0.0%) |
| 6-Person Households | 28 (14.4%) | 0 (0.0%) |
| 7+ Person Households | 6 (3.1%) | 0 (0.0%) |
| Total | 143 (73.7%) | 51 (26.3%) |
Female Fertility in Nisqually Indian Community
Fertility by Age in Nisqually Indian Community
Average fertility rate in Nisqually Indian Community is 98.0 births per 1,000 women. Women in the age bracket of 20 to 34 years have the highest fertility rate with 164.0 births per 1,000 women. Women in the age bracket of 20 to 34 years acount for 75.0% of all women with births.
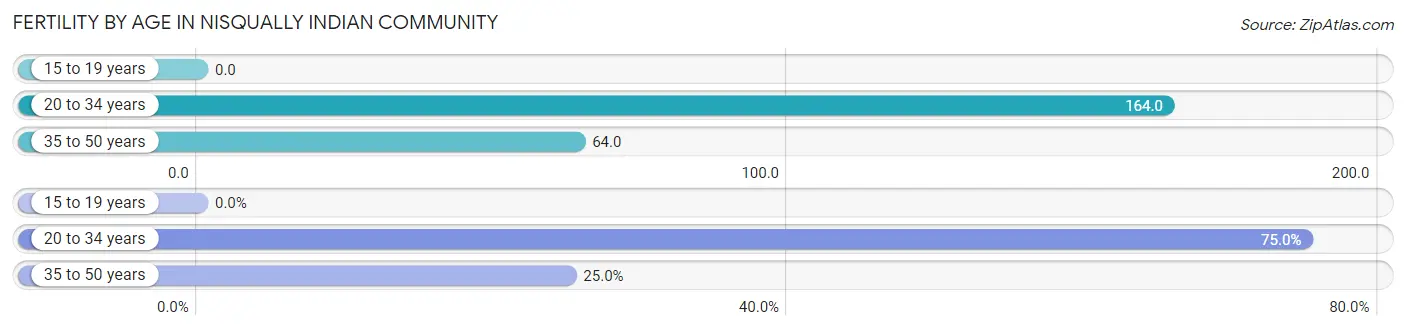
| Age Bracket | Women with Births | Births / 1,000 Women |
| 15 to 19 years | 0 (0.0%) | 0.0 |
| 20 to 34 years | 9 (75.0%) | 164.0 |
| 35 to 50 years | 3 (25.0%) | 64.0 |
| Total | 12 (100.0%) | 98.0 |
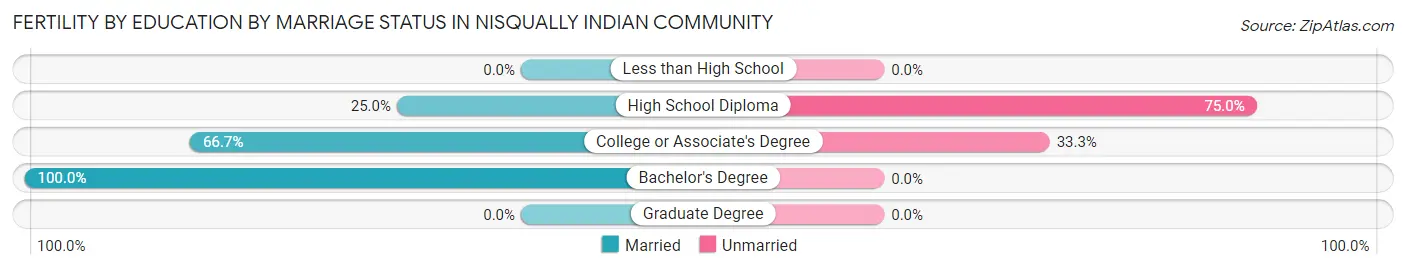
Fertility by Age by Marriage Status in Nisqually Indian Community
58.3% of women with births (12) in Nisqually Indian Community are married. The highest percentage of unmarried women with births falls into 35 to 50 years age bracket with 66.7% of them unmarried at the time of birth, while the lowest percentage of unmarried women with births belong to 20 to 34 years age bracket with 33.3% of them unmarried.
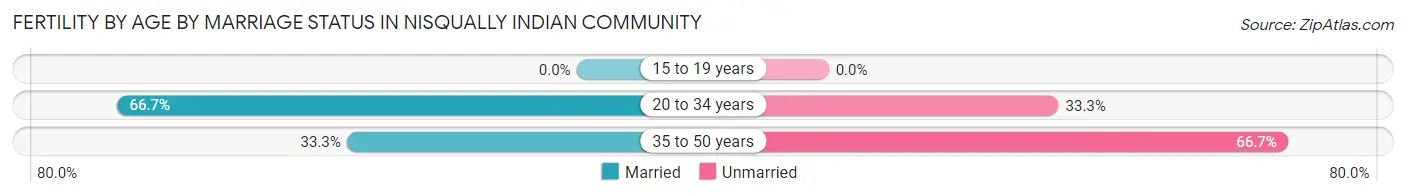
| Age Bracket | Married | Unmarried |
| 15 to 19 years | 0 (0.0%) | 0 (0.0%) |
| 20 to 34 years | 6 (66.7%) | 3 (33.3%) |
| 35 to 50 years | 1 (33.3%) | 2 (66.7%) |
| Total | 7 (58.3%) | 5 (41.7%) |
Fertility by Education in Nisqually Indian Community
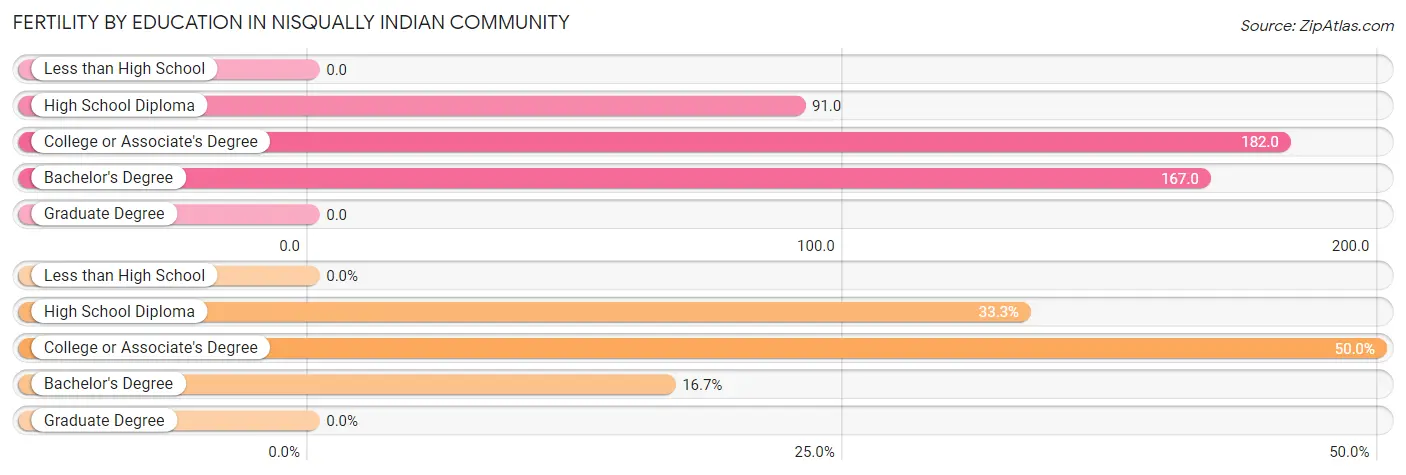
| Educational Attainment | Women with Births | Births / 1,000 Women |
| Less than High School | 0 (0.0%) | 0.0 |
| High School Diploma | 4 (33.3%) | 91.0 |
| College or Associate's Degree | 6 (50.0%) | 182.0 |
| Bachelor's Degree | 2 (16.7%) | 167.0 |
| Graduate Degree | 0 (0.0%) | 0.0 |
| Total | 12 (100.0%) | 98.0 |
Fertility by Education by Marriage Status in Nisqually Indian Community
41.7% of women with births in Nisqually Indian Community are unmarried. Women with the educational attainment of bachelor's degree are most likely to be married with 100.0% of them married at childbirth, while women with the educational attainment of high school diploma are least likely to be married with 75.0% of them unmarried at childbirth.
| Educational Attainment | Married | Unmarried |
| Less than High School | 0 (0.0%) | 0 (0.0%) |
| High School Diploma | 1 (25.0%) | 3 (75.0%) |
| College or Associate's Degree | 4 (66.7%) | 2 (33.3%) |
| Bachelor's Degree | 2 (100.0%) | 0 (0.0%) |
| Graduate Degree | 0 (0.0%) | 0 (0.0%) |
| Total | 7 (58.3%) | 5 (41.7%) |
Employment Characteristics in Nisqually Indian Community
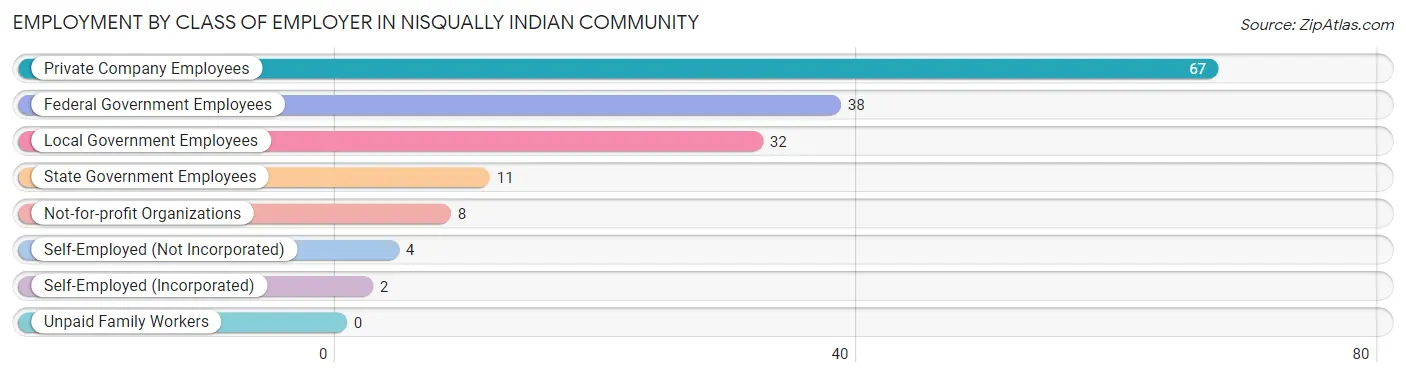
Employment by Class of Employer in Nisqually Indian Community
Among the 162 employed individuals in Nisqually Indian Community, private company employees (67 | 41.4%), federal government employees (38 | 23.5%), and local government employees (32 | 19.8%) make up the most common classes of employment.
| Employer Class | # Employees | % Employees |
| Private Company Employees | 67 | 41.4% |
| Self-Employed (Incorporated) | 2 | 1.2% |
| Self-Employed (Not Incorporated) | 4 | 2.5% |
| Not-for-profit Organizations | 8 | 4.9% |
| Local Government Employees | 32 | 19.8% |
| State Government Employees | 11 | 6.8% |
| Federal Government Employees | 38 | 23.5% |
| Unpaid Family Workers | 0 | 0.0% |
| Total | 162 | 100.0% |
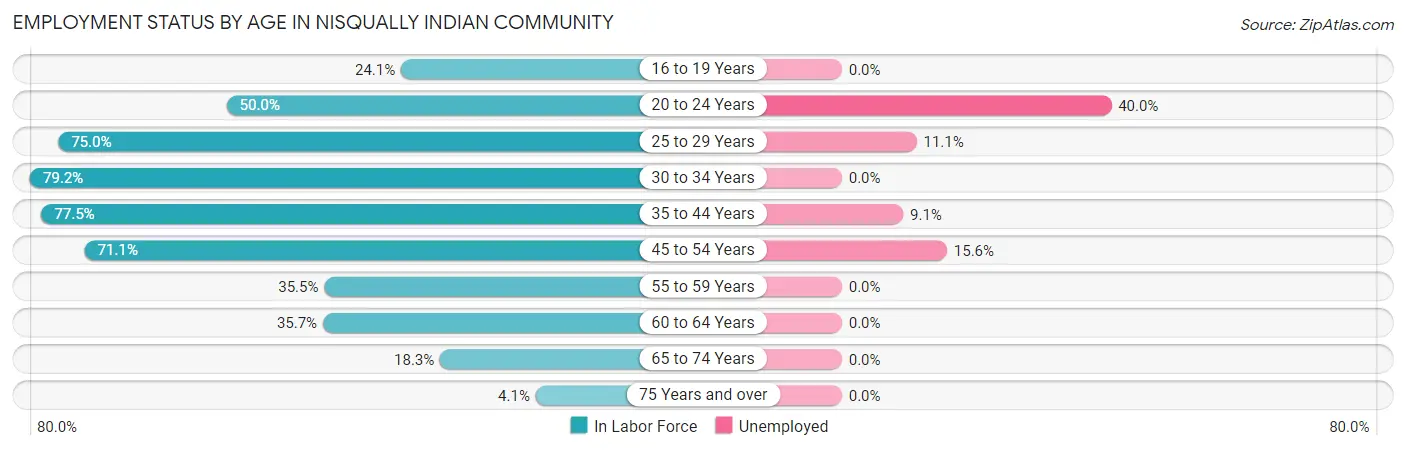
Employment Status by Age in Nisqually Indian Community
According to the labor force statistics for Nisqually Indian Community, out of the total population over 16 years of age (416), 45.0% or 187 individuals are in the labor force, with 9.7% or 18 of them unemployed. The age group with the highest labor force participation rate is 30 to 34 years, with 79.2% or 19 individuals in the labor force. Within the labor force, the 20 to 24 years age range has the highest percentage of unemployed individuals, with 40.0% or 6 of them being unemployed.
| Age Bracket | In Labor Force | Unemployed |
| 16 to 19 Years | 7 (24.1%) | 0 (0.0%) |
| 20 to 24 Years | 15 (50.0%) | 6 (40.0%) |
| 25 to 29 Years | 18 (75.0%) | 2 (11.1%) |
| 30 to 34 Years | 19 (79.2%) | 0 (0.0%) |
| 35 to 44 Years | 55 (77.5%) | 5 (9.1%) |
| 45 to 54 Years | 32 (71.1%) | 5 (15.6%) |
| 55 to 59 Years | 11 (35.5%) | 0 (0.0%) |
| 60 to 64 Years | 15 (35.7%) | 0 (0.0%) |
| 65 to 74 Years | 13 (18.3%) | 0 (0.0%) |
| 75 Years and over | 2 (4.1%) | 0 (0.0%) |
| Total | 187 (45.0%) | 18 (9.7%) |
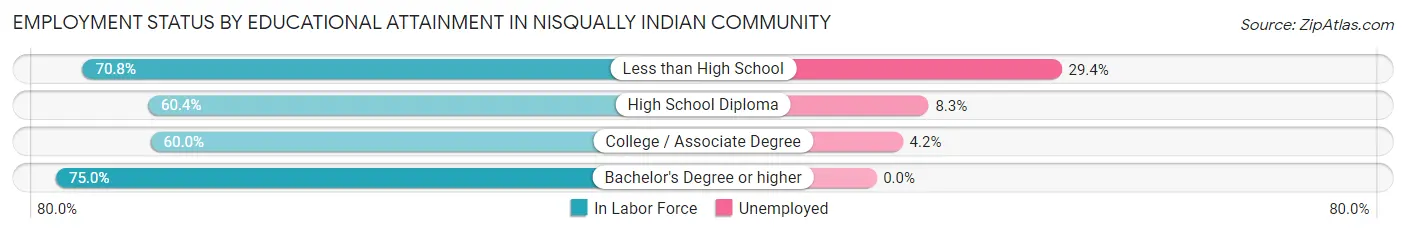
Employment Status by Educational Attainment in Nisqually Indian Community
According to labor force statistics for Nisqually Indian Community, 63.3% of individuals (150) out of the total population between 25 and 64 years of age (237) are in the labor force, with 8.1% or 12 of them being unemployed. The group with the highest labor force participation rate are those with the educational attainment of bachelor's degree or higher, with 75.0% or 24 individuals in the labor force. Within the labor force, individuals with less than high school education have the highest percentage of unemployment, with 29.4% or 5 of them being unemployed.
| Educational Attainment | In Labor Force | Unemployed |
| Less than High School | 17 (70.8%) | 7 (29.4%) |
| High School Diploma | 61 (60.4%) | 8 (8.3%) |
| College / Associate Degree | 48 (60.0%) | 3 (4.2%) |
| Bachelor's Degree or higher | 24 (75.0%) | 0 (0.0%) |
| Total | 150 (63.3%) | 19 (8.1%) |
Employment Occupations by Sex in Nisqually Indian Community
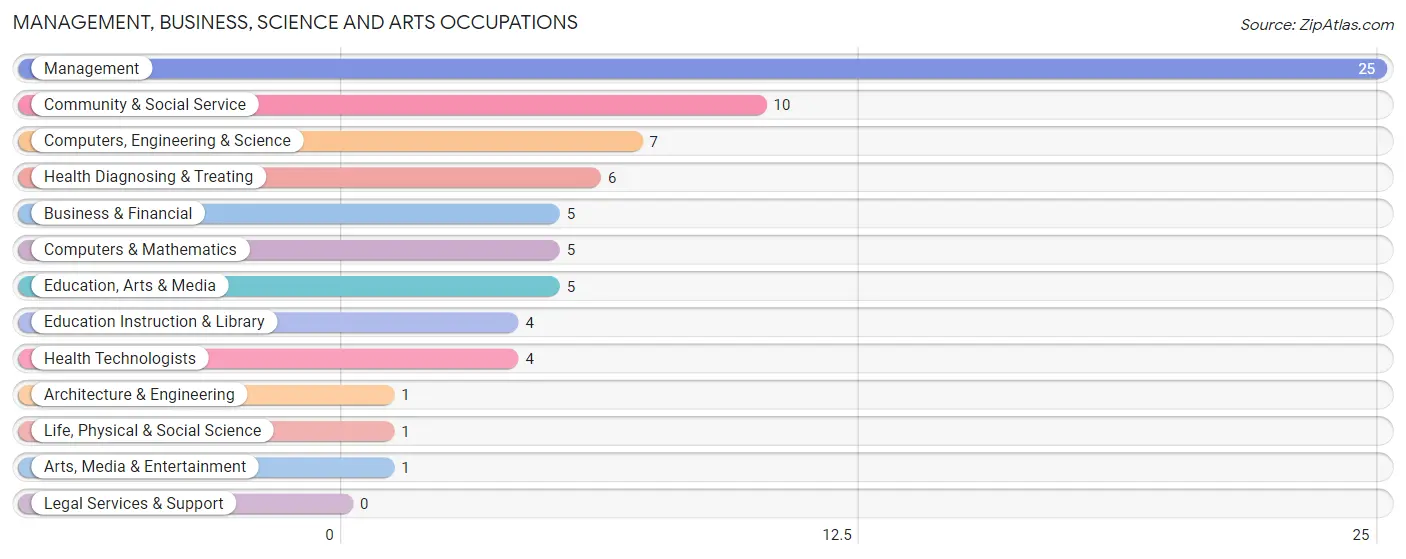
Management, Business, Science and Arts Occupations
The most common Management, Business, Science and Arts occupations in Nisqually Indian Community are Management (25 | 14.9%), Community & Social Service (10 | 5.9%), Computers, Engineering & Science (7 | 4.2%), Health Diagnosing & Treating (6 | 3.6%), and Business & Financial (5 | 3.0%).
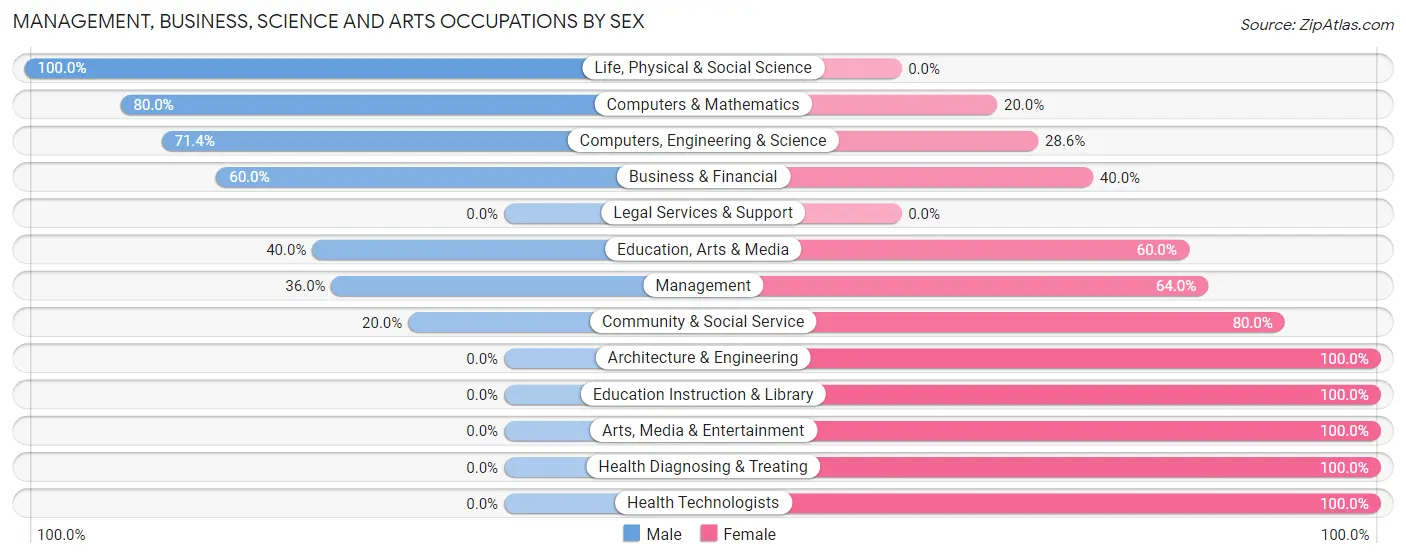
Management, Business, Science and Arts Occupations by Sex
Within the Management, Business, Science and Arts occupations in Nisqually Indian Community, the most male-oriented occupations are Life, Physical & Social Science (100.0%), Computers & Mathematics (80.0%), and Computers, Engineering & Science (71.4%), while the most female-oriented occupations are Architecture & Engineering (100.0%), Education Instruction & Library (100.0%), and Arts, Media & Entertainment (100.0%).
| Occupation | Male | Female |
| Management | 9 (36.0%) | 16 (64.0%) |
| Business & Financial | 3 (60.0%) | 2 (40.0%) |
| Computers, Engineering & Science | 5 (71.4%) | 2 (28.6%) |
| Computers & Mathematics | 4 (80.0%) | 1 (20.0%) |
| Architecture & Engineering | 0 (0.0%) | 1 (100.0%) |
| Life, Physical & Social Science | 1 (100.0%) | 0 (0.0%) |
| Community & Social Service | 2 (20.0%) | 8 (80.0%) |
| Education, Arts & Media | 2 (40.0%) | 3 (60.0%) |
| Legal Services & Support | 0 (0.0%) | 0 (0.0%) |
| Education Instruction & Library | 0 (0.0%) | 4 (100.0%) |
| Arts, Media & Entertainment | 0 (0.0%) | 1 (100.0%) |
| Health Diagnosing & Treating | 0 (0.0%) | 6 (100.0%) |
| Health Technologists | 0 (0.0%) | 4 (100.0%) |
| Total (Category) | 19 (35.8%) | 34 (64.1%) |
| Total (Overall) | 85 (50.6%) | 83 (49.4%) |
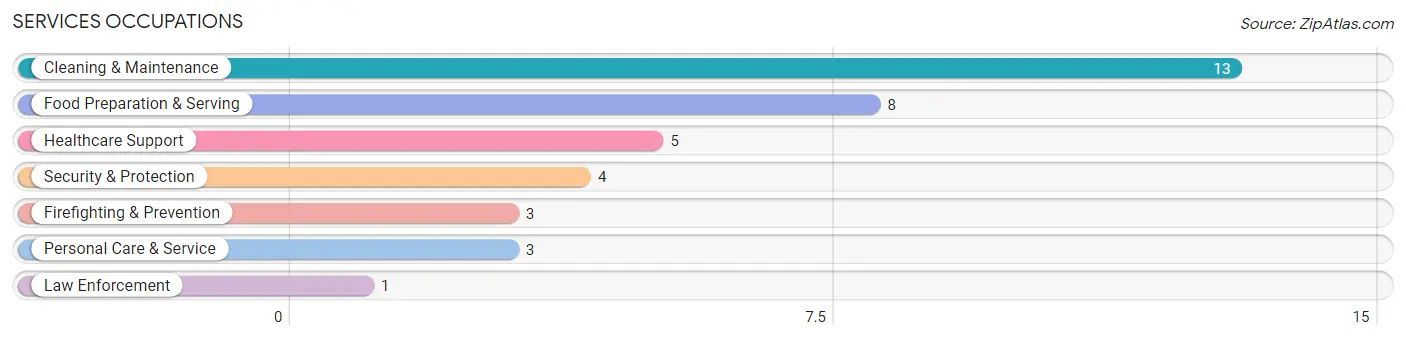
Services Occupations
The most common Services occupations in Nisqually Indian Community are Cleaning & Maintenance (13 | 7.7%), Food Preparation & Serving (8 | 4.8%), Healthcare Support (5 | 3.0%), Security & Protection (4 | 2.4%), and Firefighting & Prevention (3 | 1.8%).
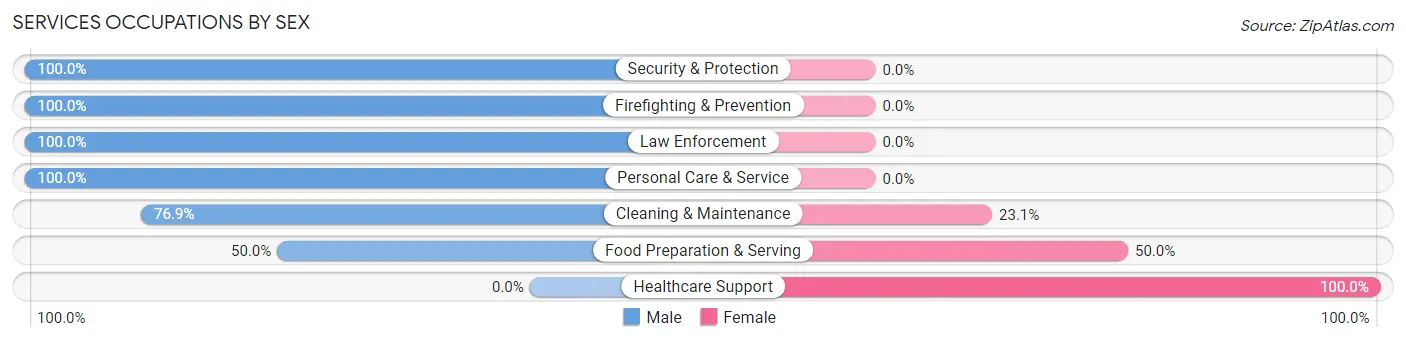
Services Occupations by Sex
Within the Services occupations in Nisqually Indian Community, the most male-oriented occupations are Security & Protection (100.0%), Firefighting & Prevention (100.0%), and Law Enforcement (100.0%), while the most female-oriented occupations are Healthcare Support (100.0%), Food Preparation & Serving (50.0%), and Cleaning & Maintenance (23.1%).
| Occupation | Male | Female |
| Healthcare Support | 0 (0.0%) | 5 (100.0%) |
| Security & Protection | 4 (100.0%) | 0 (0.0%) |
| Firefighting & Prevention | 3 (100.0%) | 0 (0.0%) |
| Law Enforcement | 1 (100.0%) | 0 (0.0%) |
| Food Preparation & Serving | 4 (50.0%) | 4 (50.0%) |
| Cleaning & Maintenance | 10 (76.9%) | 3 (23.1%) |
| Personal Care & Service | 3 (100.0%) | 0 (0.0%) |
| Total (Category) | 21 (63.6%) | 12 (36.4%) |
| Total (Overall) | 85 (50.6%) | 83 (49.4%) |
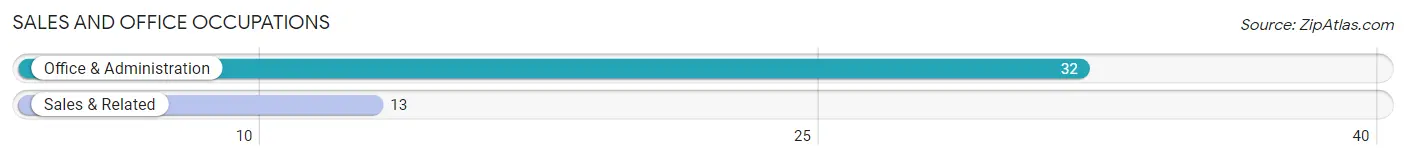
Sales and Office Occupations
The most common Sales and Office occupations in Nisqually Indian Community are Office & Administration (32 | 19.1%), and Sales & Related (13 | 7.7%).
Sales and Office Occupations by Sex
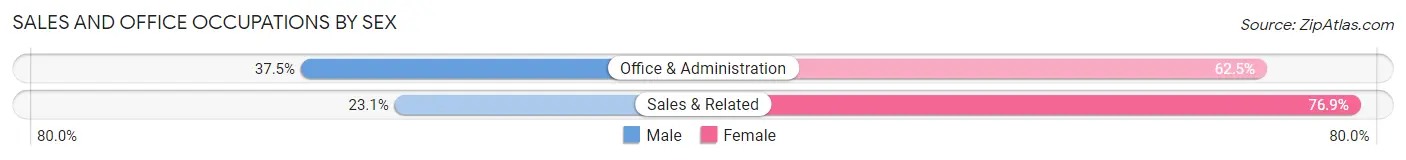
| Occupation | Male | Female |
| Sales & Related | 3 (23.1%) | 10 (76.9%) |
| Office & Administration | 12 (37.5%) | 20 (62.5%) |
| Total (Category) | 15 (33.3%) | 30 (66.7%) |
| Total (Overall) | 85 (50.6%) | 83 (49.4%) |
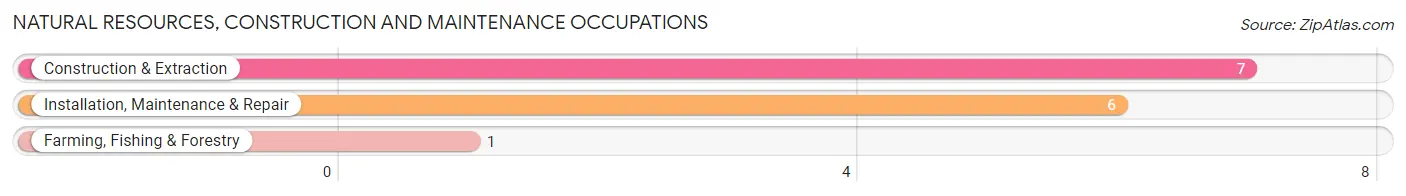
Natural Resources, Construction and Maintenance Occupations
The most common Natural Resources, Construction and Maintenance occupations in Nisqually Indian Community are Construction & Extraction (7 | 4.2%), Installation, Maintenance & Repair (6 | 3.6%), and Farming, Fishing & Forestry (1 | 0.6%).
Natural Resources, Construction and Maintenance Occupations by Sex
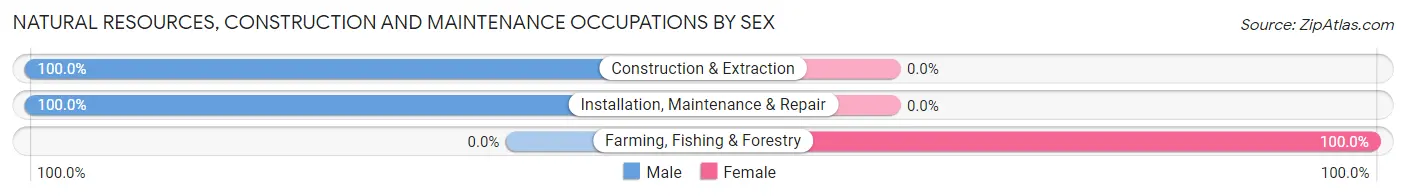
| Occupation | Male | Female |
| Farming, Fishing & Forestry | 0 (0.0%) | 1 (100.0%) |
| Construction & Extraction | 7 (100.0%) | 0 (0.0%) |
| Installation, Maintenance & Repair | 6 (100.0%) | 0 (0.0%) |
| Total (Category) | 13 (92.9%) | 1 (7.1%) |
| Total (Overall) | 85 (50.6%) | 83 (49.4%) |
Production, Transportation and Moving Occupations
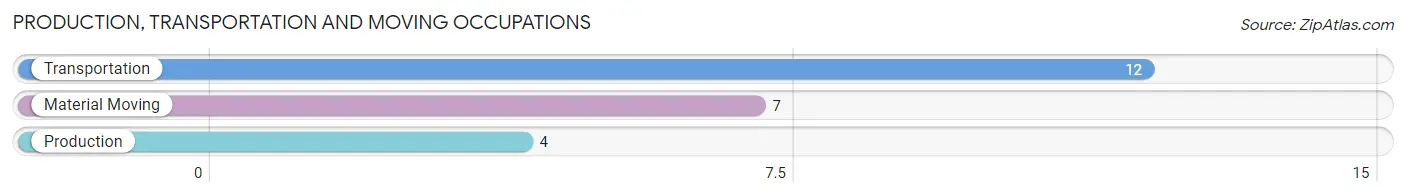
The most common Production, Transportation and Moving occupations in Nisqually Indian Community are Transportation (12 | 7.1%), Material Moving (7 | 4.2%), and Production (4 | 2.4%).
Production, Transportation and Moving Occupations by Sex
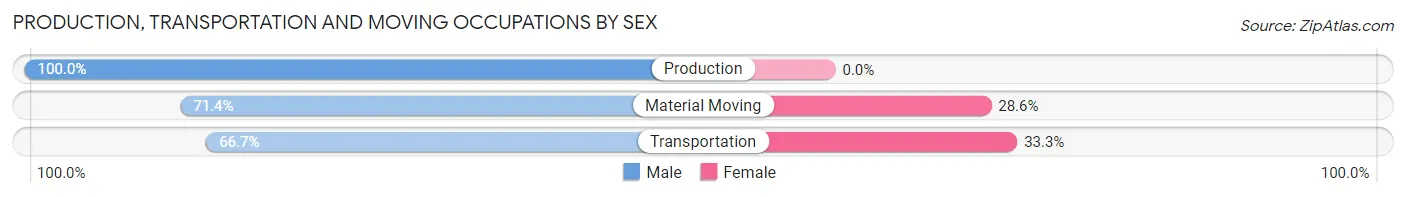
| Occupation | Male | Female |
| Production | 4 (100.0%) | 0 (0.0%) |
| Transportation | 8 (66.7%) | 4 (33.3%) |
| Material Moving | 5 (71.4%) | 2 (28.6%) |
| Total (Category) | 17 (73.9%) | 6 (26.1%) |
| Total (Overall) | 85 (50.6%) | 83 (49.4%) |
Employment Industries by Sex in Nisqually Indian Community
Employment Industries in Nisqually Indian Community
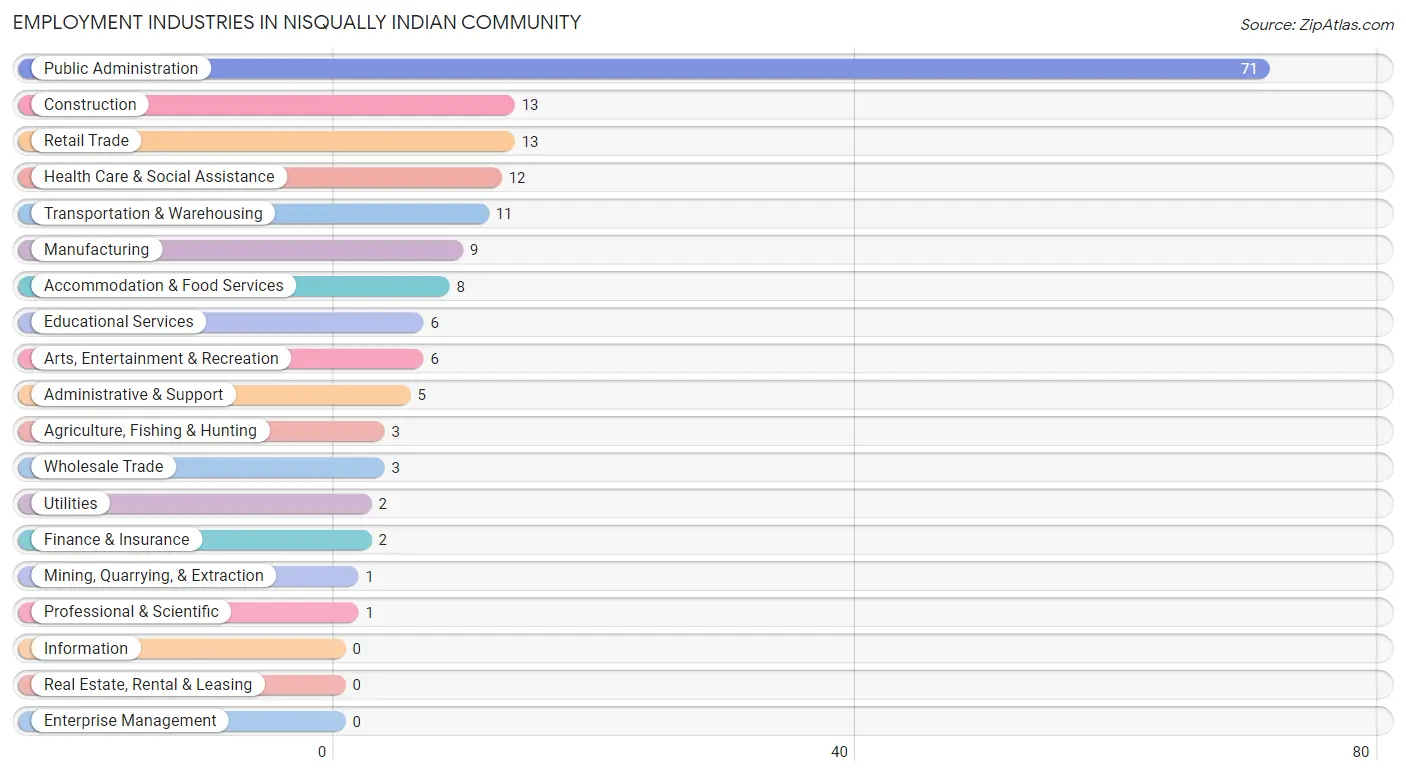
The major employment industries in Nisqually Indian Community include Public Administration (71 | 42.3%), Construction (13 | 7.7%), Retail Trade (13 | 7.7%), Health Care & Social Assistance (12 | 7.1%), and Transportation & Warehousing (11 | 6.6%).
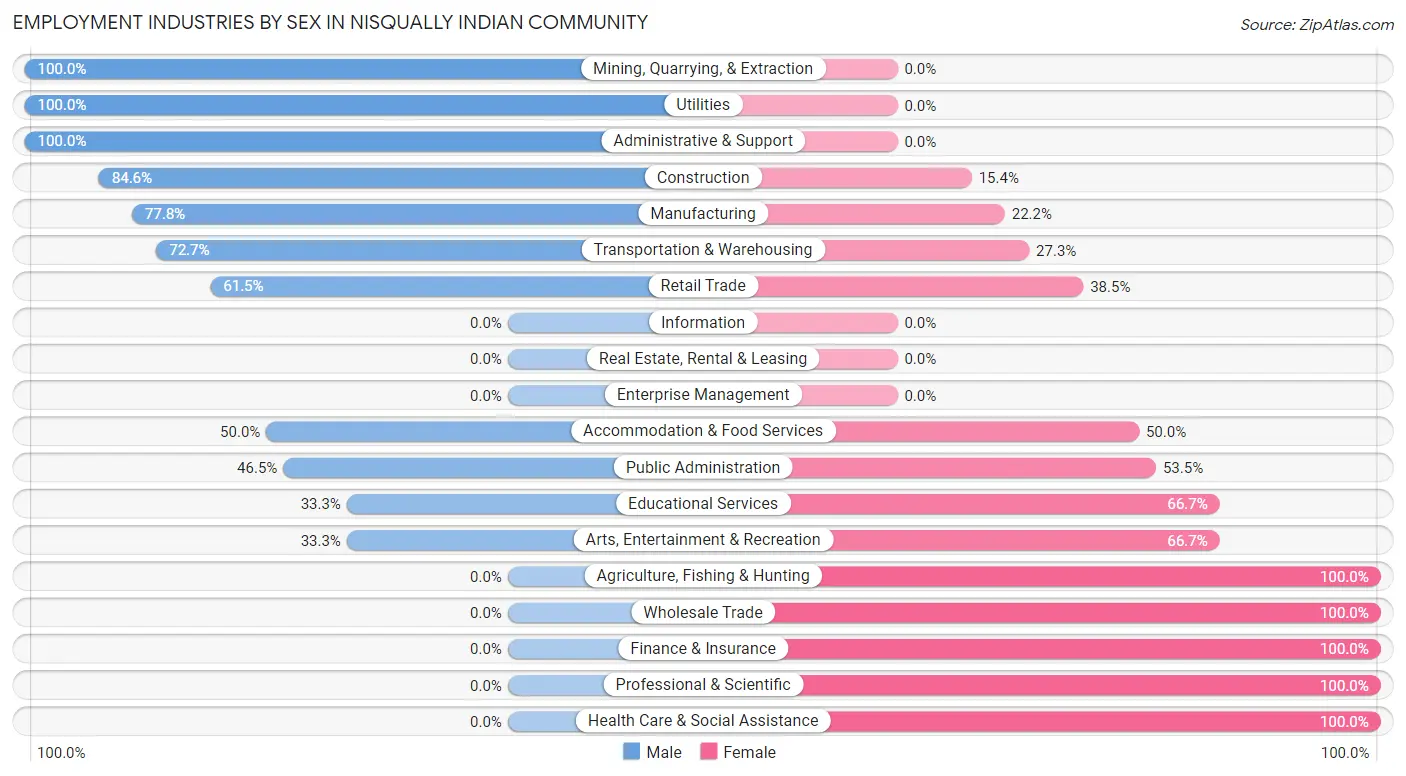
Employment Industries by Sex in Nisqually Indian Community
The Nisqually Indian Community industries that see more men than women are Mining, Quarrying, & Extraction (100.0%), Utilities (100.0%), and Administrative & Support (100.0%), whereas the industries that tend to have a higher number of women are Agriculture, Fishing & Hunting (100.0%), Wholesale Trade (100.0%), and Finance & Insurance (100.0%).
| Industry | Male | Female |
| Agriculture, Fishing & Hunting | 0 (0.0%) | 3 (100.0%) |
| Mining, Quarrying, & Extraction | 1 (100.0%) | 0 (0.0%) |
| Construction | 11 (84.6%) | 2 (15.4%) |
| Manufacturing | 7 (77.8%) | 2 (22.2%) |
| Wholesale Trade | 0 (0.0%) | 3 (100.0%) |
| Retail Trade | 8 (61.5%) | 5 (38.5%) |
| Transportation & Warehousing | 8 (72.7%) | 3 (27.3%) |
| Utilities | 2 (100.0%) | 0 (0.0%) |
| Information | 0 (0.0%) | 0 (0.0%) |
| Finance & Insurance | 0 (0.0%) | 2 (100.0%) |
| Real Estate, Rental & Leasing | 0 (0.0%) | 0 (0.0%) |
| Professional & Scientific | 0 (0.0%) | 1 (100.0%) |
| Enterprise Management | 0 (0.0%) | 0 (0.0%) |
| Administrative & Support | 5 (100.0%) | 0 (0.0%) |
| Educational Services | 2 (33.3%) | 4 (66.7%) |
| Health Care & Social Assistance | 0 (0.0%) | 12 (100.0%) |
| Arts, Entertainment & Recreation | 2 (33.3%) | 4 (66.7%) |
| Accommodation & Food Services | 4 (50.0%) | 4 (50.0%) |
| Public Administration | 33 (46.5%) | 38 (53.5%) |
| Total | 85 (50.6%) | 83 (49.4%) |
Education in Nisqually Indian Community
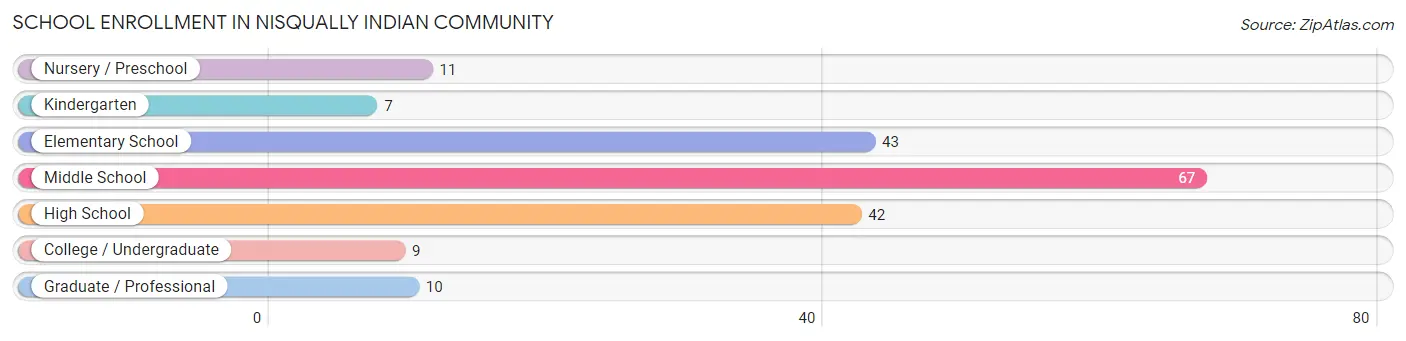
School Enrollment in Nisqually Indian Community
The most common levels of schooling among the 189 students in Nisqually Indian Community are middle school (67 | 35.4%), elementary school (43 | 22.8%), and high school (42 | 22.2%).
| School Level | # Students | % Students |
| Nursery / Preschool | 11 | 5.8% |
| Kindergarten | 7 | 3.7% |
| Elementary School | 43 | 22.8% |
| Middle School | 67 | 35.4% |
| High School | 42 | 22.2% |
| College / Undergraduate | 9 | 4.8% |
| Graduate / Professional | 10 | 5.3% |
| Total | 189 | 100.0% |
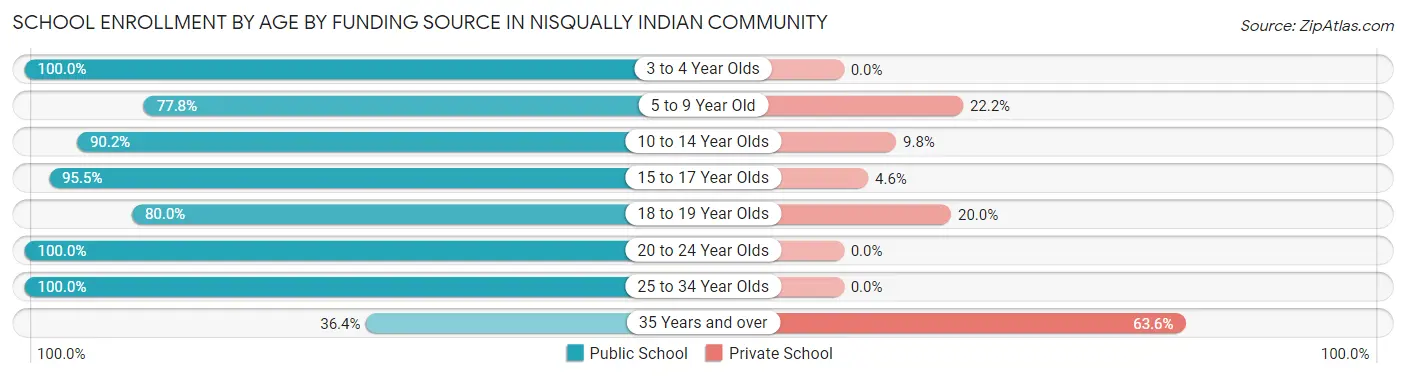
School Enrollment by Age by Funding Source in Nisqually Indian Community
Out of a total of 189 students who are enrolled in schools in Nisqually Indian Community, 29 (15.3%) attend a private institution, while the remaining 160 (84.7%) are enrolled in public schools. The age group of 35 years and over has the highest likelihood of being enrolled in private schools, with 7 (63.6% in the age bracket) enrolled. Conversely, the age group of 3 to 4 year olds has the lowest likelihood of being enrolled in a private school, with 4 (100.0% in the age bracket) attending a public institution.
| Age Bracket | Public School | Private School |
| 3 to 4 Year Olds | 4 (100.0%) | 0 (0.0%) |
| 5 to 9 Year Old | 42 (77.8%) | 12 (22.2%) |
| 10 to 14 Year Olds | 74 (90.2%) | 8 (9.8%) |
| 15 to 17 Year Olds | 21 (95.5%) | 1 (4.5%) |
| 18 to 19 Year Olds | 4 (80.0%) | 1 (20.0%) |
| 20 to 24 Year Olds | 9 (100.0%) | 0 (0.0%) |
| 25 to 34 Year Olds | 2 (100.0%) | 0 (0.0%) |
| 35 Years and over | 4 (36.4%) | 7 (63.6%) |
| Total | 160 (84.7%) | 29 (15.3%) |
Educational Attainment by Field of Study in Nisqually Indian Community
Business (13 | 21.7%), social sciences (11 | 18.3%), education (10 | 16.7%), science & technology (7 | 11.7%), and arts & humanities (5 | 8.3%) are the most common fields of study among 60 individuals in Nisqually Indian Community who have obtained a bachelor's degree or higher.
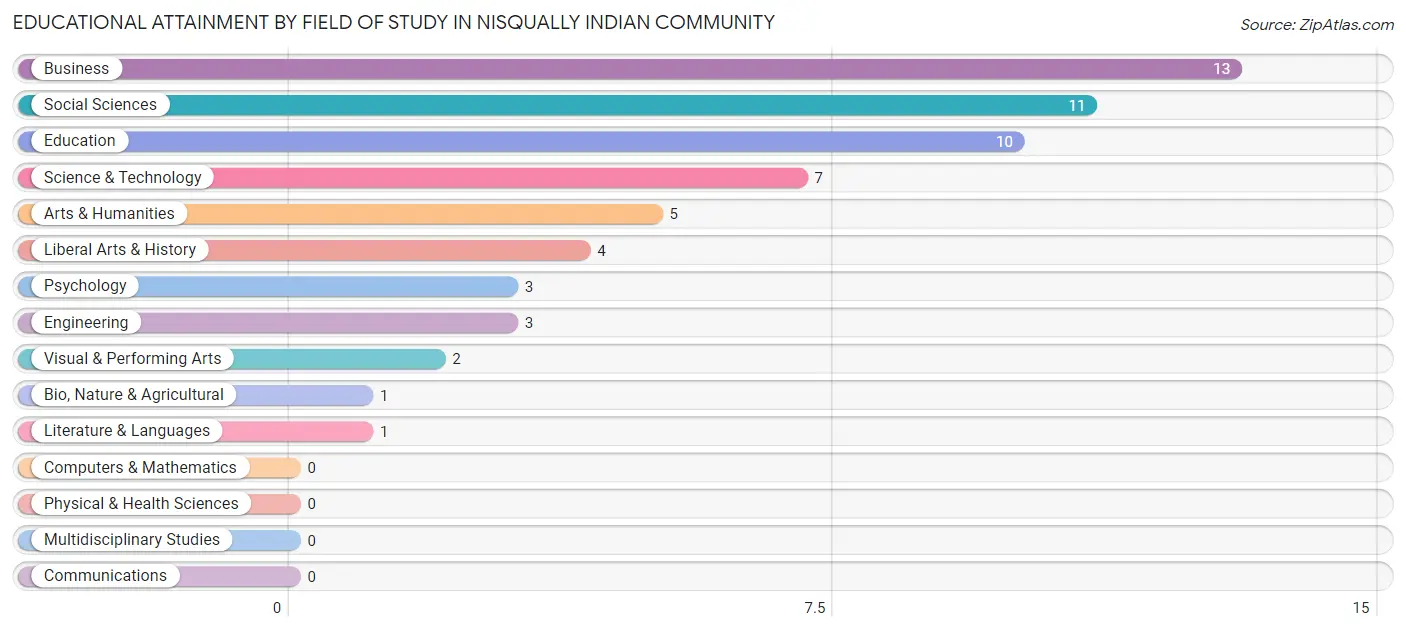
| Field of Study | # Graduates | % Graduates |
| Computers & Mathematics | 0 | 0.0% |
| Bio, Nature & Agricultural | 1 | 1.7% |
| Physical & Health Sciences | 0 | 0.0% |
| Psychology | 3 | 5.0% |
| Social Sciences | 11 | 18.3% |
| Engineering | 3 | 5.0% |
| Multidisciplinary Studies | 0 | 0.0% |
| Science & Technology | 7 | 11.7% |
| Business | 13 | 21.7% |
| Education | 10 | 16.7% |
| Literature & Languages | 1 | 1.7% |
| Liberal Arts & History | 4 | 6.7% |
| Visual & Performing Arts | 2 | 3.3% |
| Communications | 0 | 0.0% |
| Arts & Humanities | 5 | 8.3% |
| Total | 60 | 100.0% |
Transportation & Commute in Nisqually Indian Community
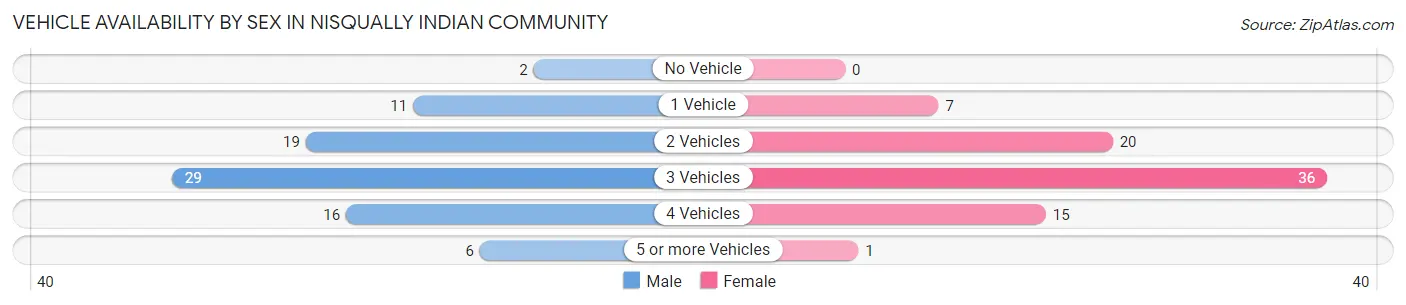
Vehicle Availability by Sex in Nisqually Indian Community
The most prevalent vehicle ownership categories in Nisqually Indian Community are males with 3 vehicles (29, accounting for 34.9%) and females with 3 vehicles (36, making up 36.7%).
| Vehicles Available | Male | Female |
| No Vehicle | 2 (2.4%) | 0 (0.0%) |
| 1 Vehicle | 11 (13.3%) | 7 (8.9%) |
| 2 Vehicles | 19 (22.9%) | 20 (25.3%) |
| 3 Vehicles | 29 (34.9%) | 36 (45.6%) |
| 4 Vehicles | 16 (19.3%) | 15 (19.0%) |
| 5 or more Vehicles | 6 (7.2%) | 1 (1.3%) |
| Total | 83 (100.0%) | 79 (100.0%) |
Commute Time in Nisqually Indian Community
The most frequently occuring commute durations in Nisqually Indian Community are 5 to 9 minutes (48 commuters, 31.2%), less than 5 minutes (19 commuters, 12.3%), and 15 to 19 minutes (16 commuters, 10.4%).
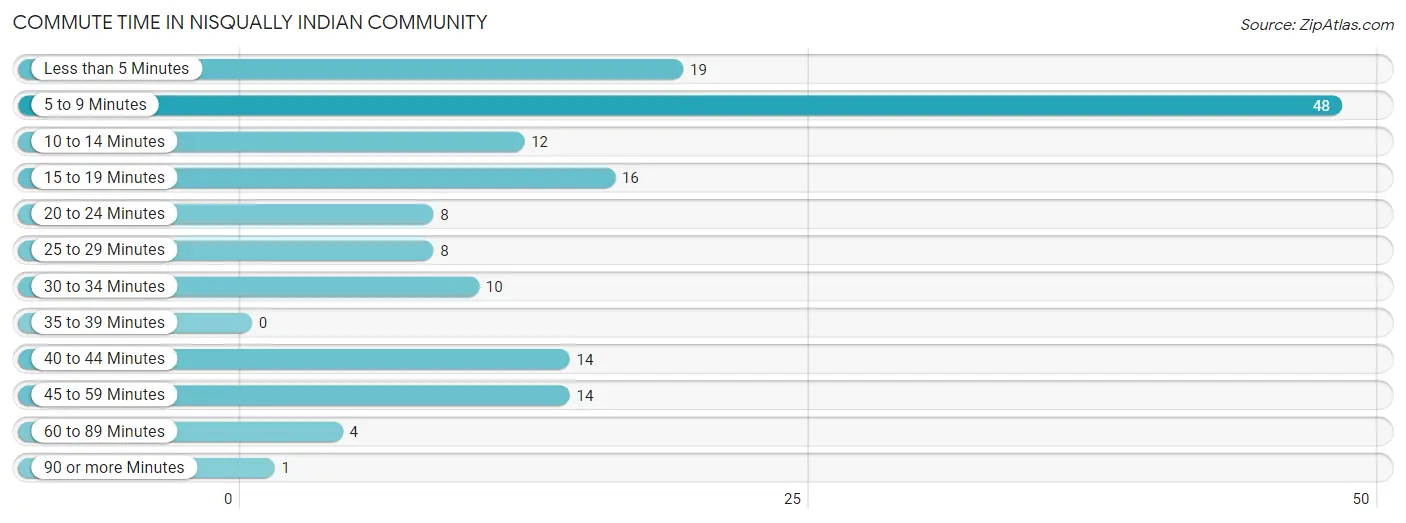
| Commute Time | # Commuters | % Commuters |
| Less than 5 Minutes | 19 | 12.3% |
| 5 to 9 Minutes | 48 | 31.2% |
| 10 to 14 Minutes | 12 | 7.8% |
| 15 to 19 Minutes | 16 | 10.4% |
| 20 to 24 Minutes | 8 | 5.2% |
| 25 to 29 Minutes | 8 | 5.2% |
| 30 to 34 Minutes | 10 | 6.5% |
| 35 to 39 Minutes | 0 | 0.0% |
| 40 to 44 Minutes | 14 | 9.1% |
| 45 to 59 Minutes | 14 | 9.1% |
| 60 to 89 Minutes | 4 | 2.6% |
| 90 or more Minutes | 1 | 0.6% |
Commute Time by Sex in Nisqually Indian Community
The most common commute times in Nisqually Indian Community are 5 to 9 minutes (17 commuters, 22.4%) for males and 5 to 9 minutes (31 commuters, 39.7%) for females.
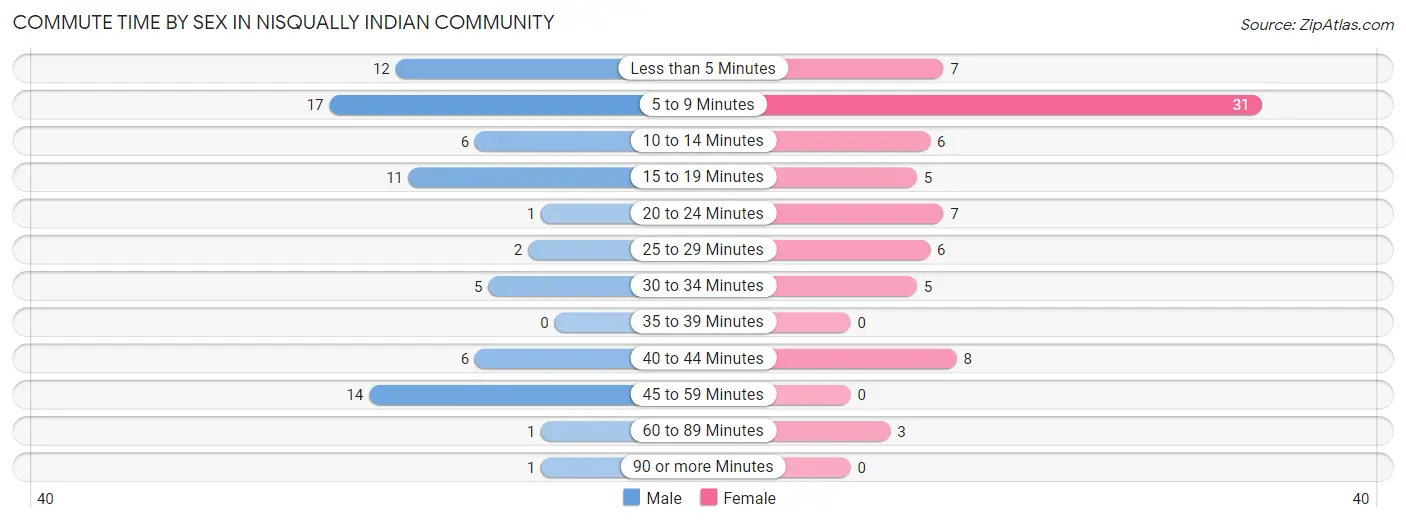
| Commute Time | Male | Female |
| Less than 5 Minutes | 12 (15.8%) | 7 (9.0%) |
| 5 to 9 Minutes | 17 (22.4%) | 31 (39.7%) |
| 10 to 14 Minutes | 6 (7.9%) | 6 (7.7%) |
| 15 to 19 Minutes | 11 (14.5%) | 5 (6.4%) |
| 20 to 24 Minutes | 1 (1.3%) | 7 (9.0%) |
| 25 to 29 Minutes | 2 (2.6%) | 6 (7.7%) |
| 30 to 34 Minutes | 5 (6.6%) | 5 (6.4%) |
| 35 to 39 Minutes | 0 (0.0%) | 0 (0.0%) |
| 40 to 44 Minutes | 6 (7.9%) | 8 (10.3%) |
| 45 to 59 Minutes | 14 (18.4%) | 0 (0.0%) |
| 60 to 89 Minutes | 1 (1.3%) | 3 (3.8%) |
| 90 or more Minutes | 1 (1.3%) | 0 (0.0%) |
Time of Departure to Work by Sex in Nisqually Indian Community
The most frequent times of departure to work in Nisqually Indian Community are 6:00 AM to 6:29 AM (26, 34.2%) for males and 7:30 AM to 7:59 AM (23, 29.5%) for females.
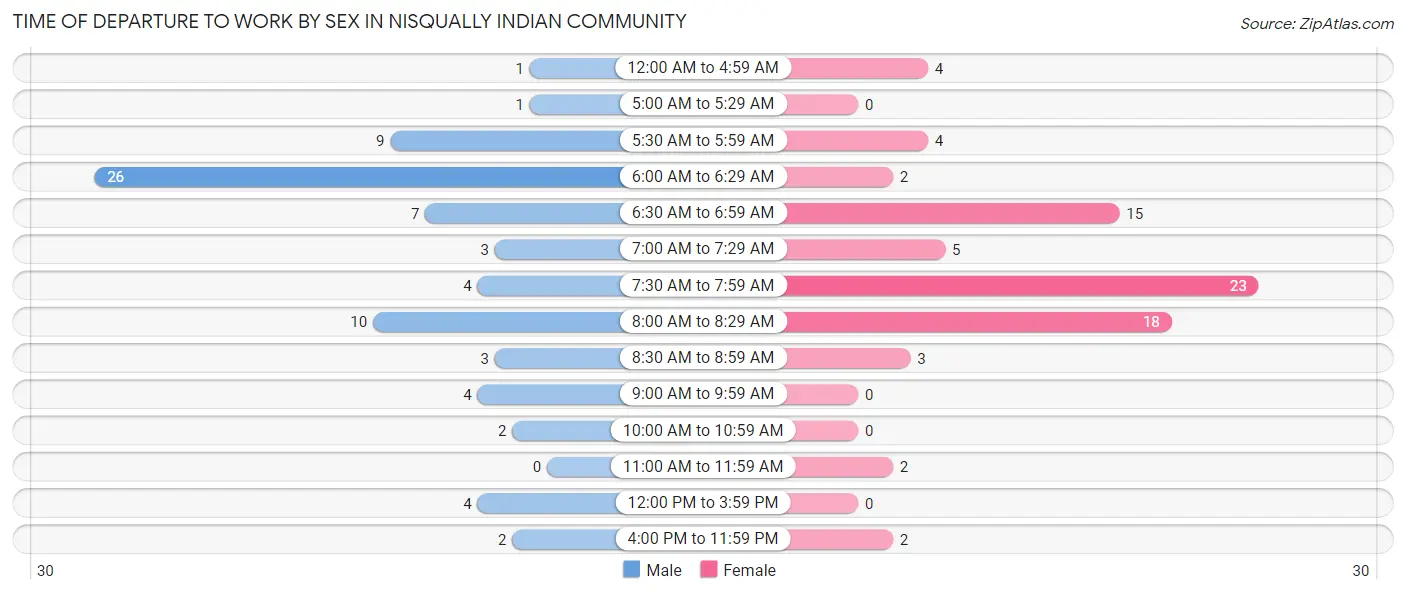
| Time of Departure | Male | Female |
| 12:00 AM to 4:59 AM | 1 (1.3%) | 4 (5.1%) |
| 5:00 AM to 5:29 AM | 1 (1.3%) | 0 (0.0%) |
| 5:30 AM to 5:59 AM | 9 (11.8%) | 4 (5.1%) |
| 6:00 AM to 6:29 AM | 26 (34.2%) | 2 (2.6%) |
| 6:30 AM to 6:59 AM | 7 (9.2%) | 15 (19.2%) |
| 7:00 AM to 7:29 AM | 3 (4.0%) | 5 (6.4%) |
| 7:30 AM to 7:59 AM | 4 (5.3%) | 23 (29.5%) |
| 8:00 AM to 8:29 AM | 10 (13.2%) | 18 (23.1%) |
| 8:30 AM to 8:59 AM | 3 (4.0%) | 3 (3.8%) |
| 9:00 AM to 9:59 AM | 4 (5.3%) | 0 (0.0%) |
| 10:00 AM to 10:59 AM | 2 (2.6%) | 0 (0.0%) |
| 11:00 AM to 11:59 AM | 0 (0.0%) | 2 (2.6%) |
| 12:00 PM to 3:59 PM | 4 (5.3%) | 0 (0.0%) |
| 4:00 PM to 11:59 PM | 2 (2.6%) | 2 (2.6%) |
| Total | 76 (100.0%) | 78 (100.0%) |
Housing Occupancy in Nisqually Indian Community
Occupancy by Ownership in Nisqually Indian Community
Of the total 194 dwellings in Nisqually Indian Community, owner-occupied units account for 165 (85.1%), while renter-occupied units make up 29 (14.9%).
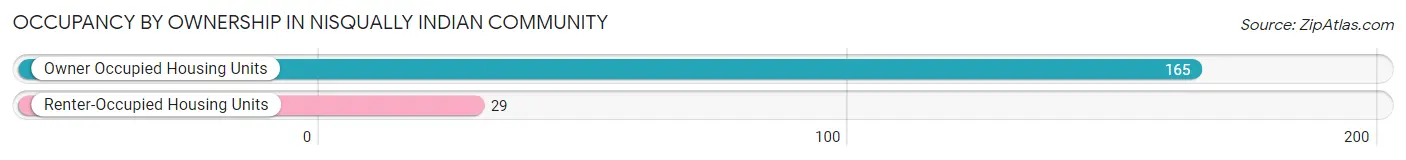
| Occupancy | # Housing Units | % Housing Units |
| Owner Occupied Housing Units | 165 | 85.1% |
| Renter-Occupied Housing Units | 29 | 14.9% |
| Total Occupied Housing Units | 194 | 100.0% |
Occupancy by Household Size in Nisqually Indian Community
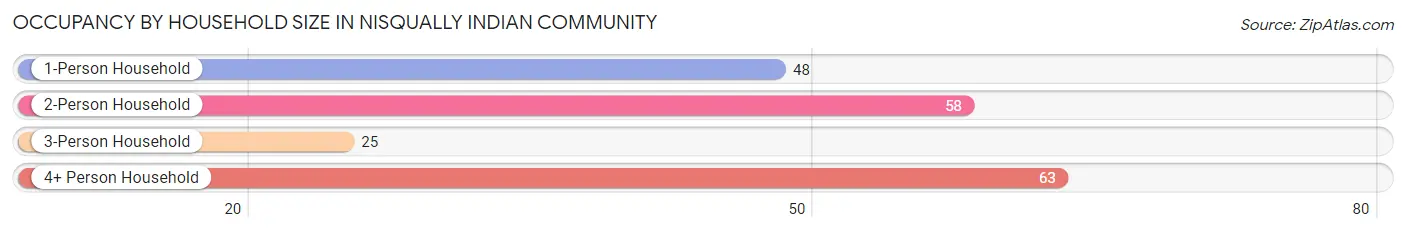
| Household Size | # Housing Units | % Housing Units |
| 1-Person Household | 48 | 24.7% |
| 2-Person Household | 58 | 29.9% |
| 3-Person Household | 25 | 12.9% |
| 4+ Person Household | 63 | 32.5% |
| Total Housing Units | 194 | 100.0% |
Occupancy by Ownership by Household Size in Nisqually Indian Community
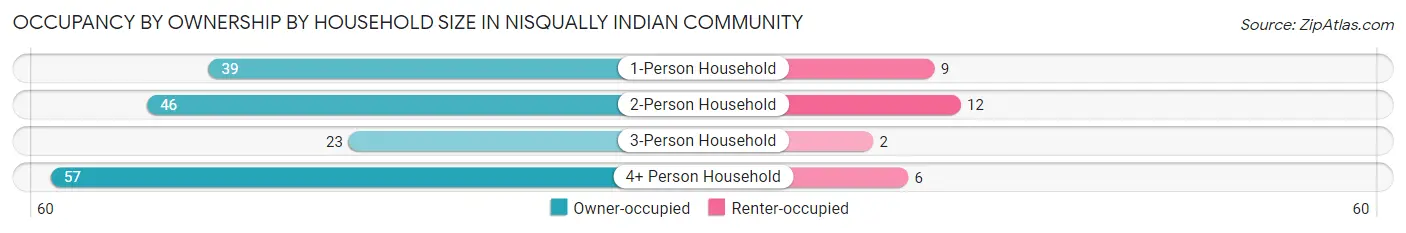
| Household Size | Owner-occupied | Renter-occupied |
| 1-Person Household | 39 (81.2%) | 9 (18.8%) |
| 2-Person Household | 46 (79.3%) | 12 (20.7%) |
| 3-Person Household | 23 (92.0%) | 2 (8.0%) |
| 4+ Person Household | 57 (90.5%) | 6 (9.5%) |
| Total Housing Units | 165 (85.1%) | 29 (14.9%) |
Occupancy by Educational Attainment in Nisqually Indian Community
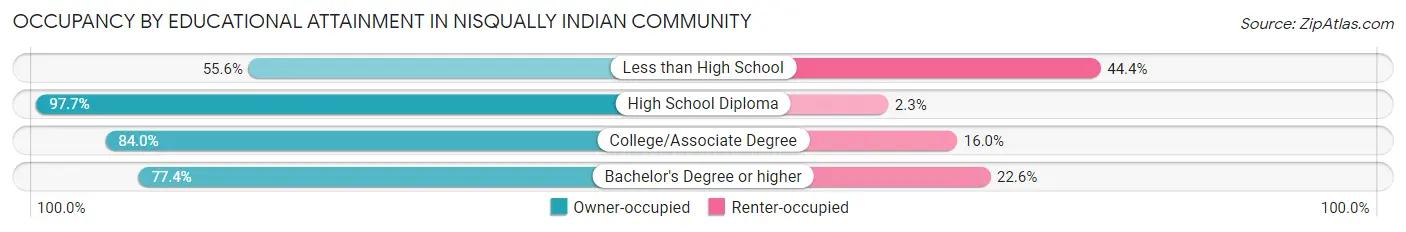
| Household Size | Owner-occupied | Renter-occupied |
| Less than High School | 15 (55.6%) | 12 (44.4%) |
| High School Diploma | 84 (97.7%) | 2 (2.3%) |
| College/Associate Degree | 42 (84.0%) | 8 (16.0%) |
| Bachelor's Degree or higher | 24 (77.4%) | 7 (22.6%) |
Occupancy by Age of Householder in Nisqually Indian Community
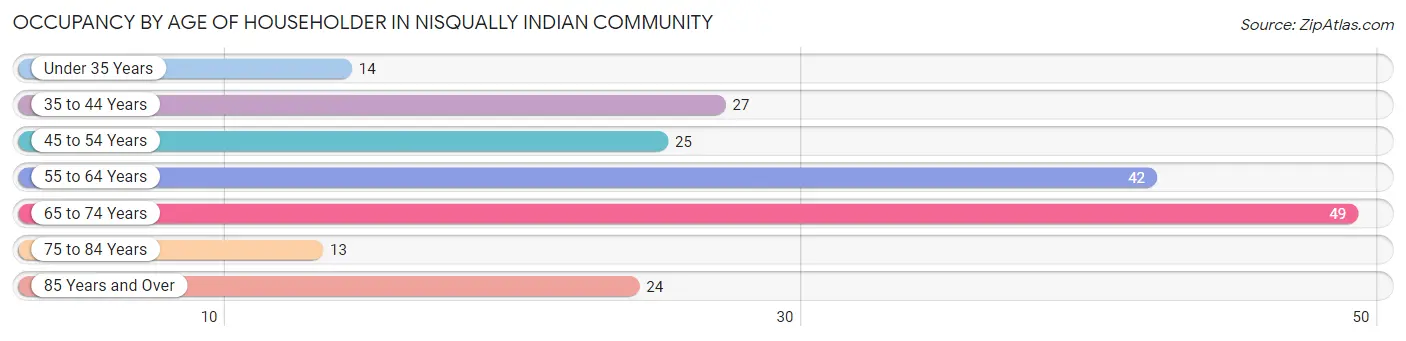
| Age Bracket | # Households | % Households |
| Under 35 Years | 14 | 7.2% |
| 35 to 44 Years | 27 | 13.9% |
| 45 to 54 Years | 25 | 12.9% |
| 55 to 64 Years | 42 | 21.6% |
| 65 to 74 Years | 49 | 25.3% |
| 75 to 84 Years | 13 | 6.7% |
| 85 Years and Over | 24 | 12.4% |
| Total | 194 | 100.0% |
Housing Finances in Nisqually Indian Community
Median Income by Occupancy in Nisqually Indian Community
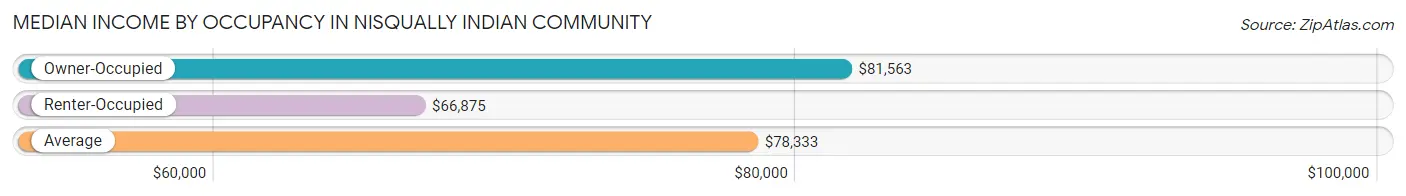
| Occupancy Type | # Households | Median Income |
| Owner-Occupied | 165 (85.1%) | $81,563 |
| Renter-Occupied | 29 (14.9%) | $66,875 |
| Average | 194 (100.0%) | $78,333 |
Occupancy by Householder Income Bracket in Nisqually Indian Community
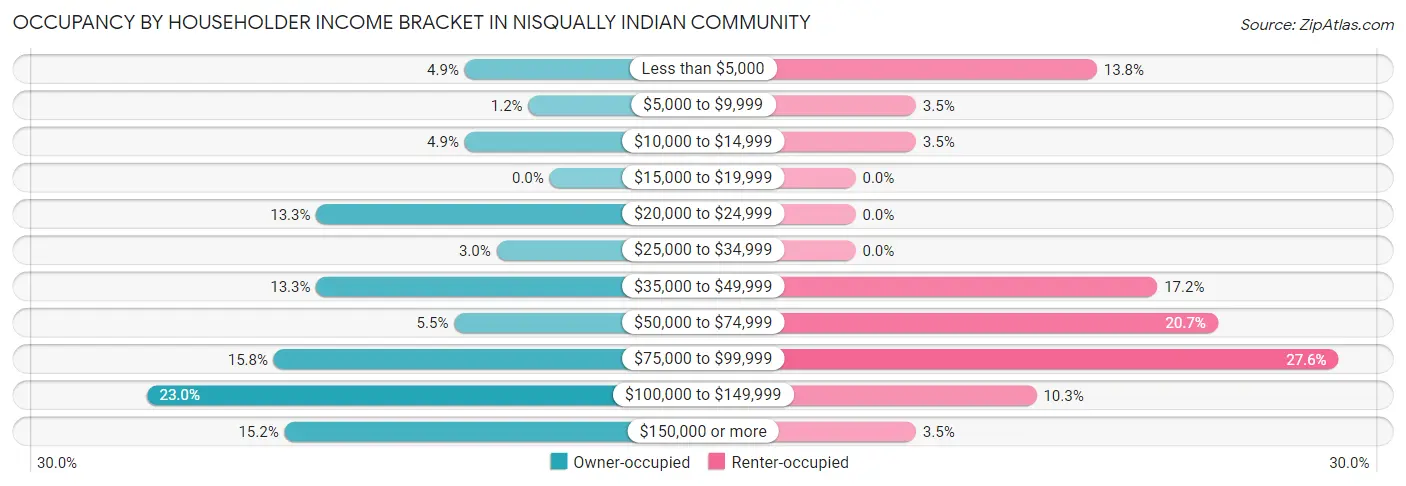
| Income Bracket | Owner-occupied | Renter-occupied |
| Less than $5,000 | 8 (4.9%) | 4 (13.8%) |
| $5,000 to $9,999 | 2 (1.2%) | 1 (3.5%) |
| $10,000 to $14,999 | 8 (4.9%) | 1 (3.5%) |
| $15,000 to $19,999 | 0 (0.0%) | 0 (0.0%) |
| $20,000 to $24,999 | 22 (13.3%) | 0 (0.0%) |
| $25,000 to $34,999 | 5 (3.0%) | 0 (0.0%) |
| $35,000 to $49,999 | 22 (13.3%) | 5 (17.2%) |
| $50,000 to $74,999 | 9 (5.4%) | 6 (20.7%) |
| $75,000 to $99,999 | 26 (15.8%) | 8 (27.6%) |
| $100,000 to $149,999 | 38 (23.0%) | 3 (10.3%) |
| $150,000 or more | 25 (15.1%) | 1 (3.5%) |
| Total | 165 (100.0%) | 29 (100.0%) |
Monthly Housing Cost Tiers in Nisqually Indian Community
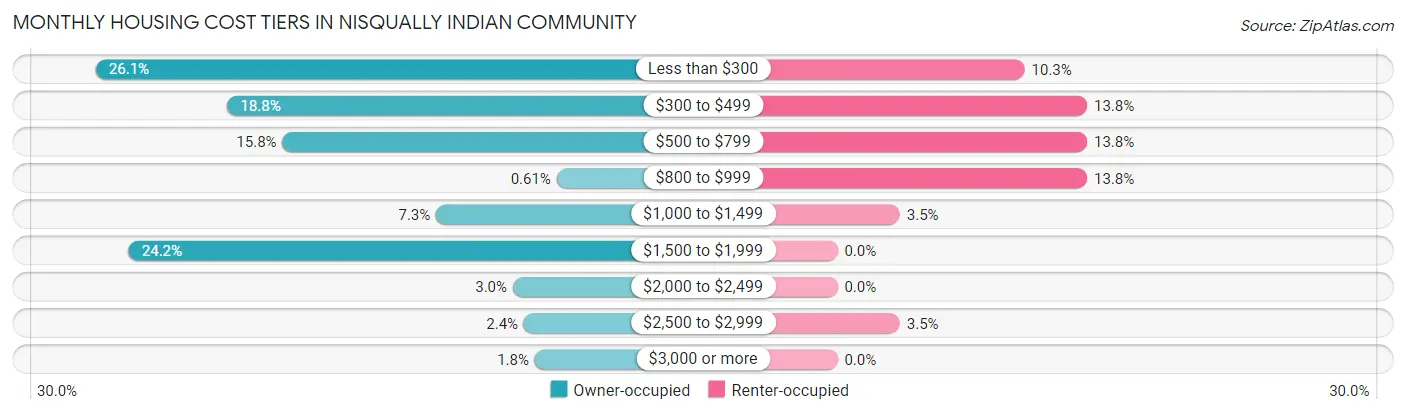
| Monthly Cost | Owner-occupied | Renter-occupied |
| Less than $300 | 43 (26.1%) | 3 (10.3%) |
| $300 to $499 | 31 (18.8%) | 4 (13.8%) |
| $500 to $799 | 26 (15.8%) | 4 (13.8%) |
| $800 to $999 | 1 (0.6%) | 4 (13.8%) |
| $1,000 to $1,499 | 12 (7.3%) | 1 (3.5%) |
| $1,500 to $1,999 | 40 (24.2%) | 0 (0.0%) |
| $2,000 to $2,499 | 5 (3.0%) | 0 (0.0%) |
| $2,500 to $2,999 | 4 (2.4%) | 1 (3.5%) |
| $3,000 or more | 3 (1.8%) | 0 (0.0%) |
| Total | 165 (100.0%) | 29 (100.0%) |
Physical Housing Characteristics in Nisqually Indian Community
Housing Structures in Nisqually Indian Community
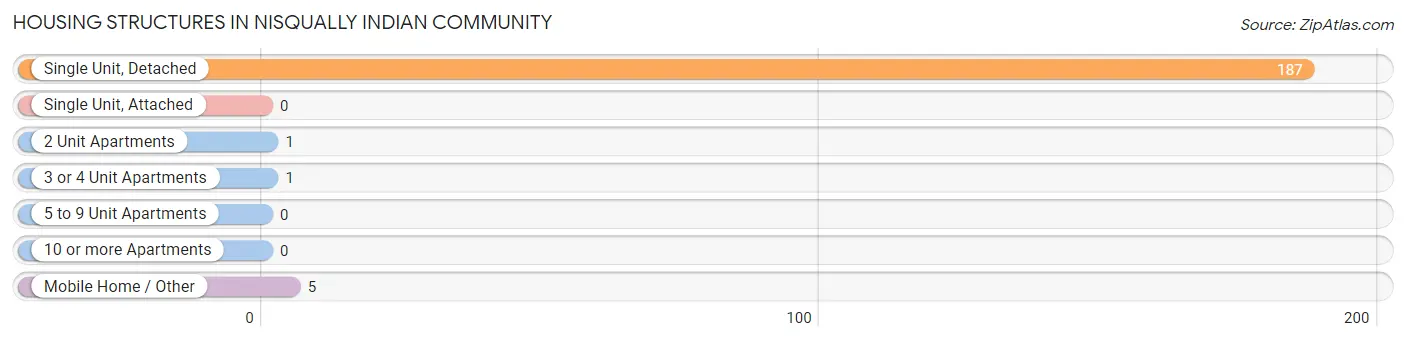
| Structure Type | # Housing Units | % Housing Units |
| Single Unit, Detached | 187 | 96.4% |
| Single Unit, Attached | 0 | 0.0% |
| 2 Unit Apartments | 1 | 0.5% |
| 3 or 4 Unit Apartments | 1 | 0.5% |
| 5 to 9 Unit Apartments | 0 | 0.0% |
| 10 or more Apartments | 0 | 0.0% |
| Mobile Home / Other | 5 | 2.6% |
| Total | 194 | 100.0% |
Housing Structures by Occupancy in Nisqually Indian Community
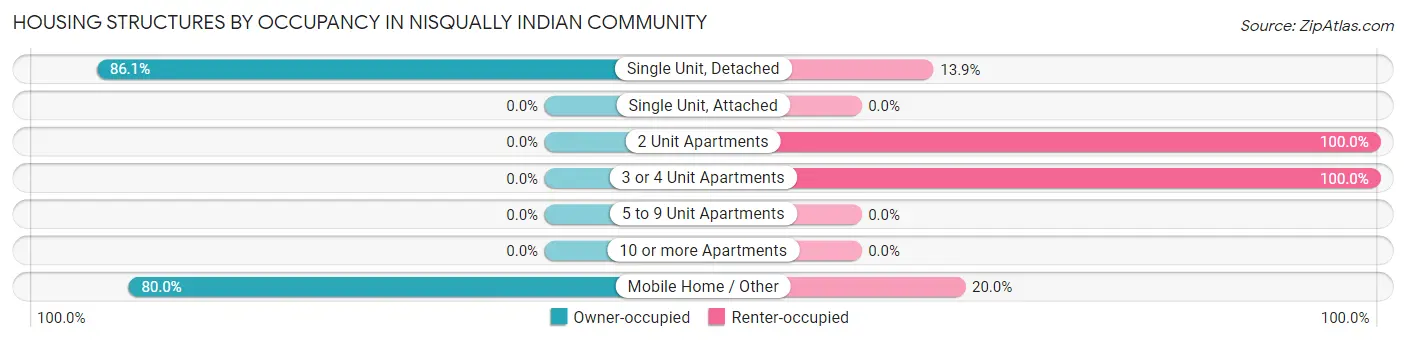
| Structure Type | Owner-occupied | Renter-occupied |
| Single Unit, Detached | 161 (86.1%) | 26 (13.9%) |
| Single Unit, Attached | 0 (0.0%) | 0 (0.0%) |
| 2 Unit Apartments | 0 (0.0%) | 1 (100.0%) |
| 3 or 4 Unit Apartments | 0 (0.0%) | 1 (100.0%) |
| 5 to 9 Unit Apartments | 0 (0.0%) | 0 (0.0%) |
| 10 or more Apartments | 0 (0.0%) | 0 (0.0%) |
| Mobile Home / Other | 4 (80.0%) | 1 (20.0%) |
| Total | 165 (85.1%) | 29 (14.9%) |
Housing Structures by Number of Rooms in Nisqually Indian Community
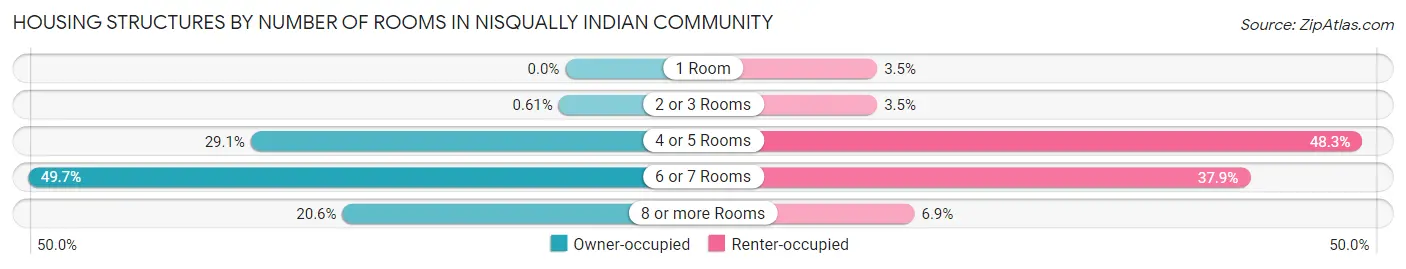
| Number of Rooms | Owner-occupied | Renter-occupied |
| 1 Room | 0 (0.0%) | 1 (3.5%) |
| 2 or 3 Rooms | 1 (0.6%) | 1 (3.5%) |
| 4 or 5 Rooms | 48 (29.1%) | 14 (48.3%) |
| 6 or 7 Rooms | 82 (49.7%) | 11 (37.9%) |
| 8 or more Rooms | 34 (20.6%) | 2 (6.9%) |
| Total | 165 (100.0%) | 29 (100.0%) |
Housing Structure by Heating Type in Nisqually Indian Community
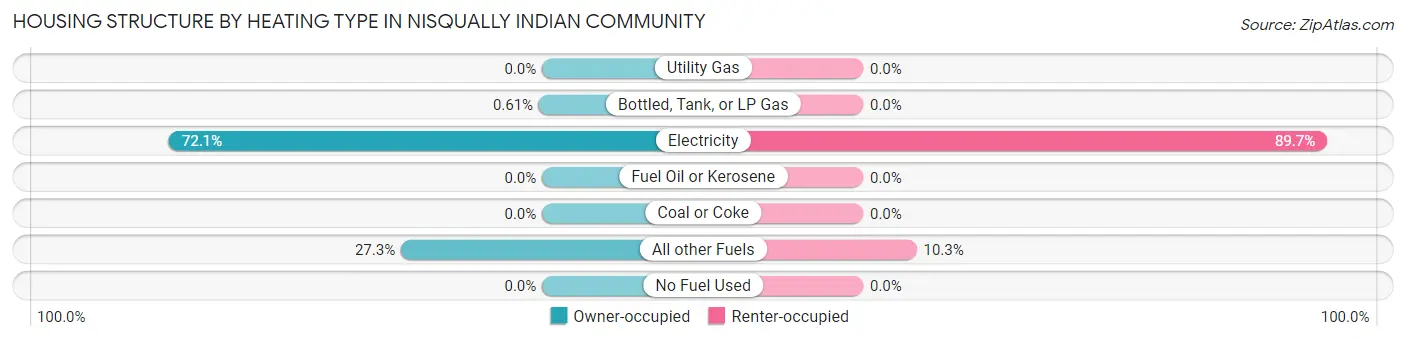
| Heating Type | Owner-occupied | Renter-occupied |
| Utility Gas | 0 (0.0%) | 0 (0.0%) |
| Bottled, Tank, or LP Gas | 1 (0.6%) | 0 (0.0%) |
| Electricity | 119 (72.1%) | 26 (89.7%) |
| Fuel Oil or Kerosene | 0 (0.0%) | 0 (0.0%) |
| Coal or Coke | 0 (0.0%) | 0 (0.0%) |
| All other Fuels | 45 (27.3%) | 3 (10.3%) |
| No Fuel Used | 0 (0.0%) | 0 (0.0%) |
| Total | 165 (100.0%) | 29 (100.0%) |
Household Vehicle Usage in Nisqually Indian Community
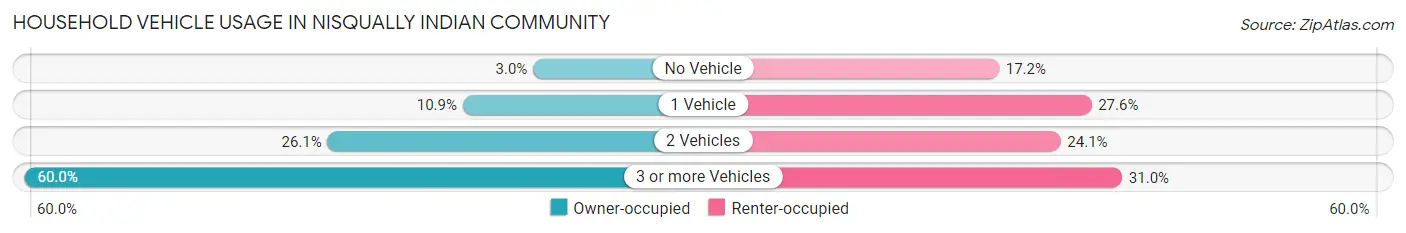
| Vehicles per Household | Owner-occupied | Renter-occupied |
| No Vehicle | 5 (3.0%) | 5 (17.2%) |
| 1 Vehicle | 18 (10.9%) | 8 (27.6%) |
| 2 Vehicles | 43 (26.1%) | 7 (24.1%) |
| 3 or more Vehicles | 99 (60.0%) | 9 (31.0%) |
| Total | 165 (100.0%) | 29 (100.0%) |
Real Estate & Mortgages in Nisqually Indian Community
Real Estate and Mortgage Overview in Nisqually Indian Community
| Characteristic | Without Mortgage | With Mortgage |
| Housing Units | 84 | 81 |
| Median Property Value | $236,100 | $330,900 |
| Median Household Income | $90,833 | $13 |
| Monthly Housing Costs | $308 | $3 |
| Real Estate Taxes | $4,278 | $27 |
Property Value by Mortgage Status in Nisqually Indian Community
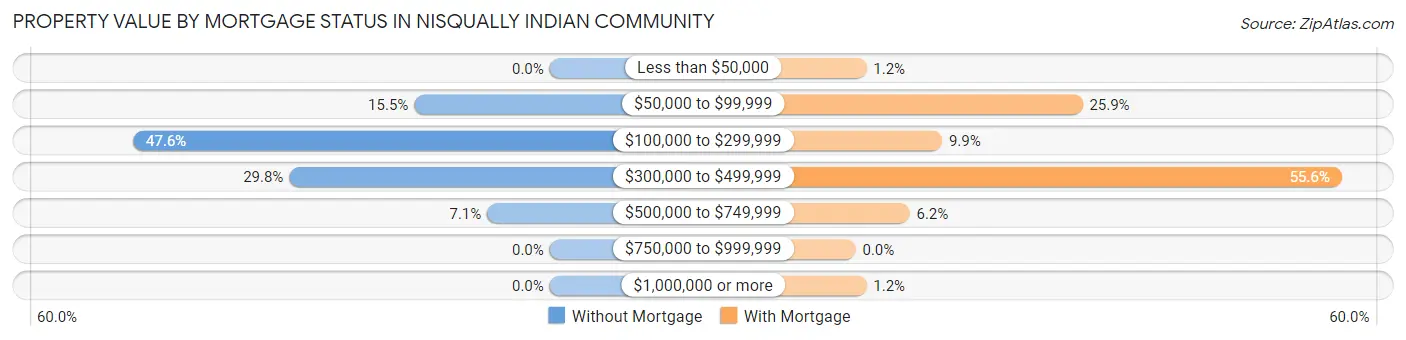
| Property Value | Without Mortgage | With Mortgage |
| Less than $50,000 | 0 (0.0%) | 1 (1.2%) |
| $50,000 to $99,999 | 13 (15.5%) | 21 (25.9%) |
| $100,000 to $299,999 | 40 (47.6%) | 8 (9.9%) |
| $300,000 to $499,999 | 25 (29.8%) | 45 (55.6%) |
| $500,000 to $749,999 | 6 (7.1%) | 5 (6.2%) |
| $750,000 to $999,999 | 0 (0.0%) | 0 (0.0%) |
| $1,000,000 or more | 0 (0.0%) | 1 (1.2%) |
| Total | 84 (100.0%) | 81 (100.0%) |
Household Income by Mortgage Status in Nisqually Indian Community
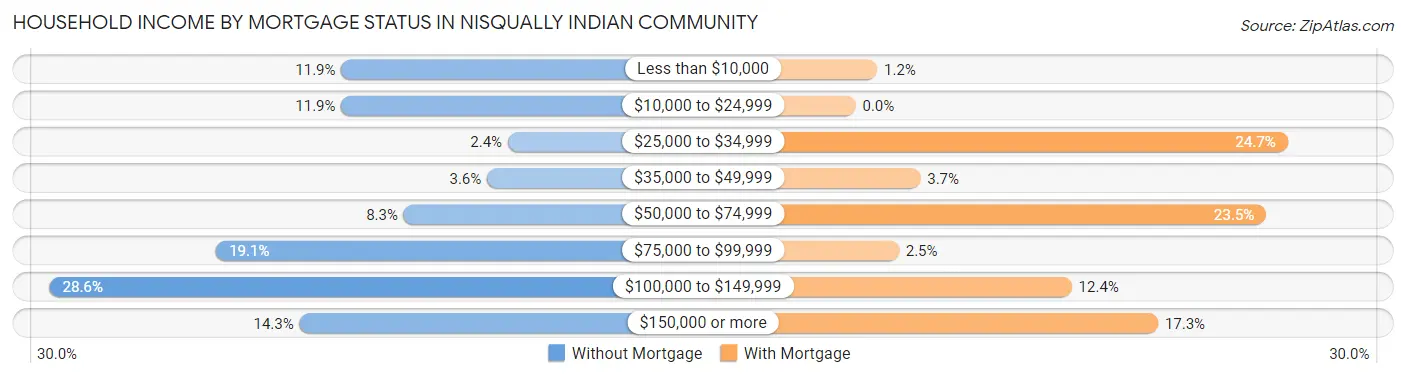
| Household Income | Without Mortgage | With Mortgage |
| Less than $10,000 | 10 (11.9%) | 1 (1.2%) |
| $10,000 to $24,999 | 10 (11.9%) | 0 (0.0%) |
| $25,000 to $34,999 | 2 (2.4%) | 20 (24.7%) |
| $35,000 to $49,999 | 3 (3.6%) | 3 (3.7%) |
| $50,000 to $74,999 | 7 (8.3%) | 19 (23.5%) |
| $75,000 to $99,999 | 16 (19.1%) | 2 (2.5%) |
| $100,000 to $149,999 | 24 (28.6%) | 10 (12.3%) |
| $150,000 or more | 12 (14.3%) | 14 (17.3%) |
| Total | 84 (100.0%) | 81 (100.0%) |
Property Value to Household Income Ratio in Nisqually Indian Community
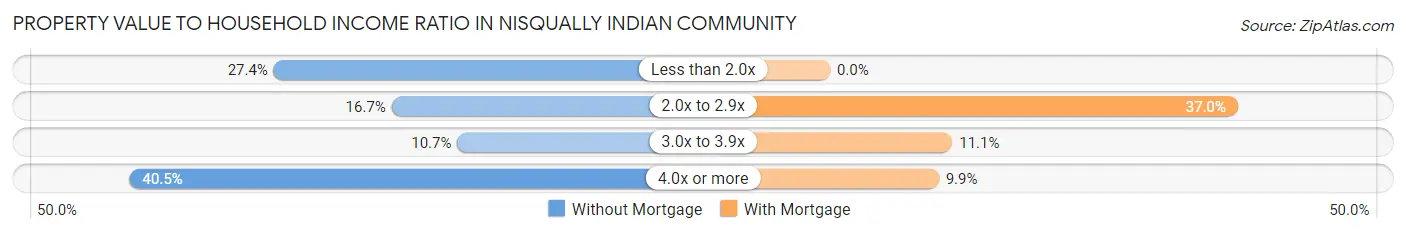
| Value-to-Income Ratio | Without Mortgage | With Mortgage |
| Less than 2.0x | 23 (27.4%) | 0 (0.0%) |
| 2.0x to 2.9x | 14 (16.7%) | 30 (37.0%) |
| 3.0x to 3.9x | 9 (10.7%) | 9 (11.1%) |
| 4.0x or more | 34 (40.5%) | 8 (9.9%) |
| Total | 84 (100.0%) | 81 (100.0%) |
Real Estate Taxes by Mortgage Status in Nisqually Indian Community
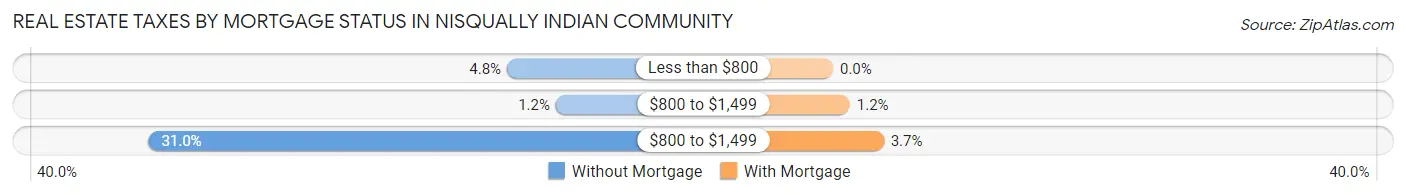
| Property Taxes | Without Mortgage | With Mortgage |
| Less than $800 | 4 (4.8%) | 0 (0.0%) |
| $800 to $1,499 | 1 (1.2%) | 1 (1.2%) |
| $800 to $1,499 | 26 (30.9%) | 3 (3.7%) |
| Total | 84 (100.0%) | 81 (100.0%) |
Health & Disability in Nisqually Indian Community
Health Insurance Coverage by Age in Nisqually Indian Community
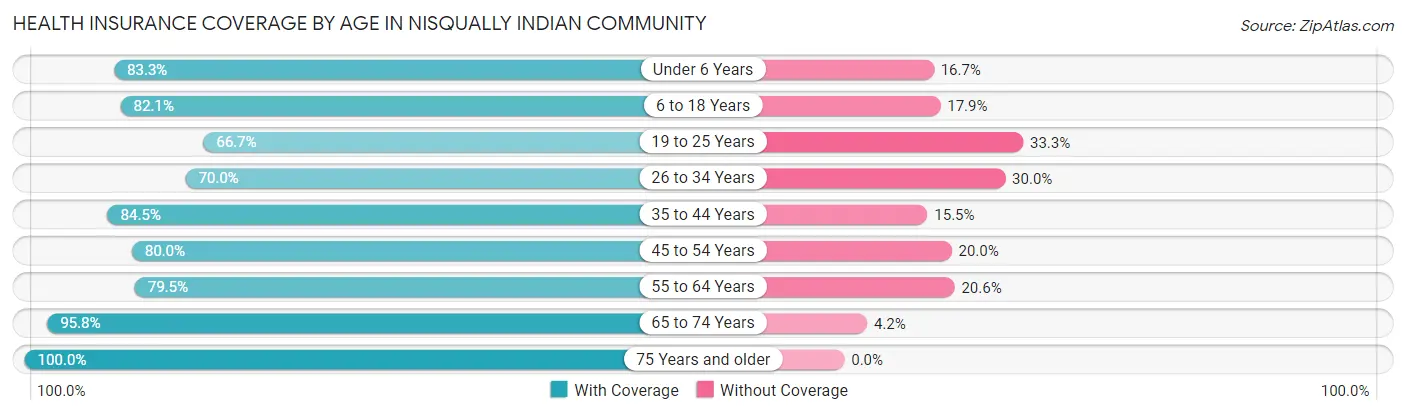
| Age Bracket | With Coverage | Without Coverage |
| Under 6 Years | 35 (83.3%) | 7 (16.7%) |
| 6 to 18 Years | 133 (82.1%) | 29 (17.9%) |
| 19 to 25 Years | 26 (66.7%) | 13 (33.3%) |
| 26 to 34 Years | 28 (70.0%) | 12 (30.0%) |
| 35 to 44 Years | 60 (84.5%) | 11 (15.5%) |
| 45 to 54 Years | 36 (80.0%) | 9 (20.0%) |
| 55 to 64 Years | 58 (79.4%) | 15 (20.5%) |
| 65 to 74 Years | 68 (95.8%) | 3 (4.2%) |
| 75 Years and older | 49 (100.0%) | 0 (0.0%) |
| Total | 493 (83.3%) | 99 (16.7%) |
Health Insurance Coverage by Citizenship Status in Nisqually Indian Community
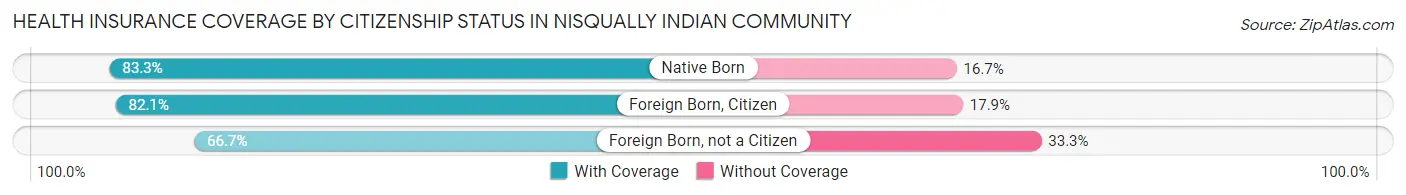
| Citizenship Status | With Coverage | Without Coverage |
| Native Born | 35 (83.3%) | 7 (16.7%) |
| Foreign Born, Citizen | 133 (82.1%) | 29 (17.9%) |
| Foreign Born, not a Citizen | 26 (66.7%) | 13 (33.3%) |
Health Insurance Coverage by Household Income in Nisqually Indian Community
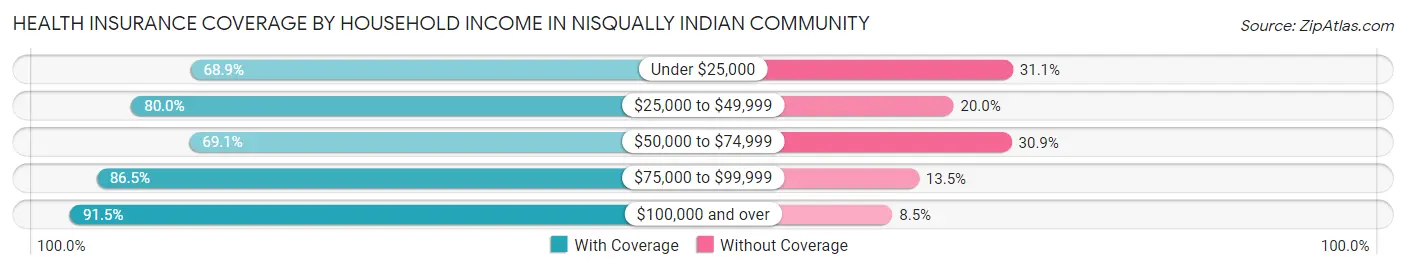
| Household Income | With Coverage | Without Coverage |
| Under $25,000 | 62 (68.9%) | 28 (31.1%) |
| $25,000 to $49,999 | 52 (80.0%) | 13 (20.0%) |
| $50,000 to $74,999 | 47 (69.1%) | 21 (30.9%) |
| $75,000 to $99,999 | 96 (86.5%) | 15 (13.5%) |
| $100,000 and over | 236 (91.5%) | 22 (8.5%) |
Public vs Private Health Insurance Coverage by Age in Nisqually Indian Community
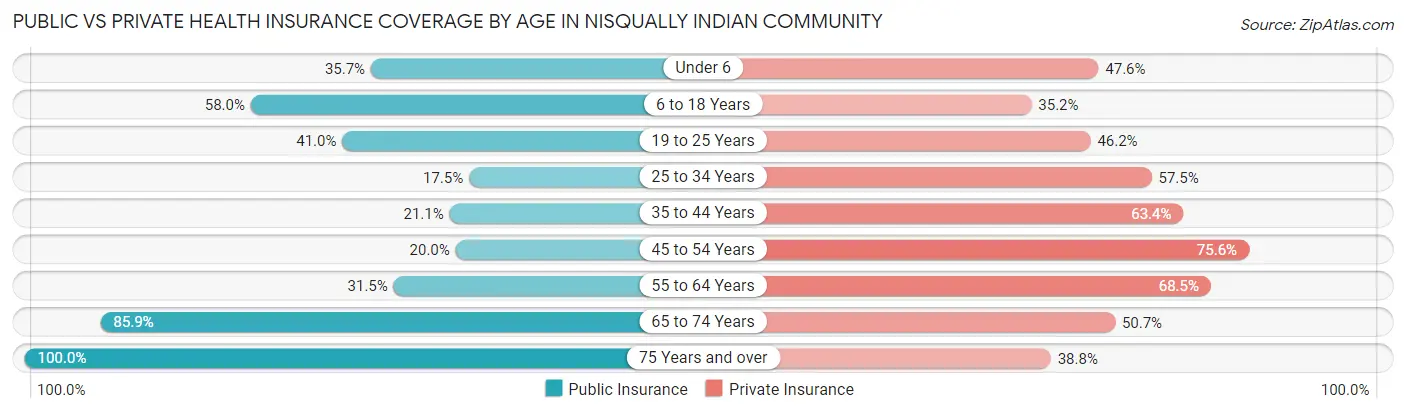
| Age Bracket | Public Insurance | Private Insurance |
| Under 6 | 15 (35.7%) | 20 (47.6%) |
| 6 to 18 Years | 94 (58.0%) | 57 (35.2%) |
| 19 to 25 Years | 16 (41.0%) | 18 (46.2%) |
| 25 to 34 Years | 7 (17.5%) | 23 (57.5%) |
| 35 to 44 Years | 15 (21.1%) | 45 (63.4%) |
| 45 to 54 Years | 9 (20.0%) | 34 (75.6%) |
| 55 to 64 Years | 23 (31.5%) | 50 (68.5%) |
| 65 to 74 Years | 61 (85.9%) | 36 (50.7%) |
| 75 Years and over | 49 (100.0%) | 19 (38.8%) |
| Total | 289 (48.8%) | 302 (51.0%) |
Disability Status by Sex by Age in Nisqually Indian Community
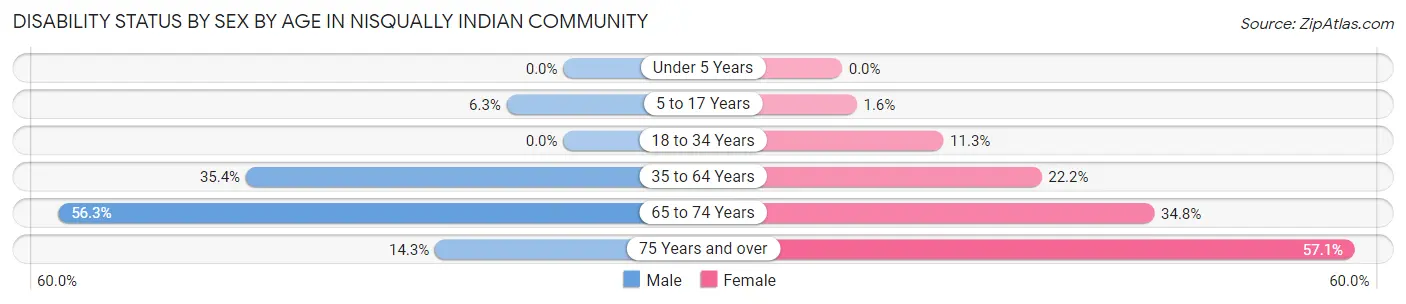
| Age Bracket | Male | Female |
| Under 5 Years | 0 (0.0%) | 0 (0.0%) |
| 5 to 17 Years | 7 (6.3%) | 1 (1.6%) |
| 18 to 34 Years | 0 (0.0%) | 7 (11.3%) |
| 35 to 64 Years | 35 (35.3%) | 20 (22.2%) |
| 65 to 74 Years | 27 (56.2%) | 8 (34.8%) |
| 75 Years and over | 5 (14.3%) | 8 (57.1%) |
Disability Class by Sex by Age in Nisqually Indian Community
Disability Class: Hearing Difficulty
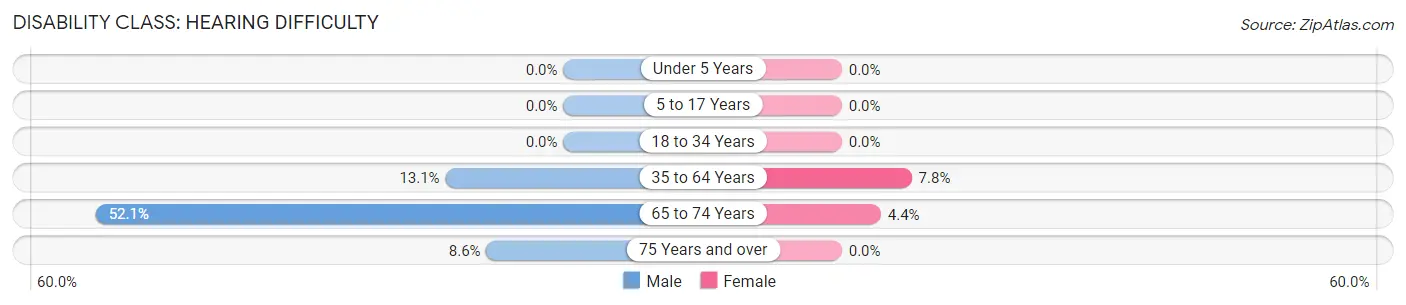
| Age Bracket | Male | Female |
| Under 5 Years | 0 (0.0%) | 0 (0.0%) |
| 5 to 17 Years | 0 (0.0%) | 0 (0.0%) |
| 18 to 34 Years | 0 (0.0%) | 0 (0.0%) |
| 35 to 64 Years | 13 (13.1%) | 7 (7.8%) |
| 65 to 74 Years | 25 (52.1%) | 1 (4.3%) |
| 75 Years and over | 3 (8.6%) | 0 (0.0%) |
Disability Class: Vision Difficulty
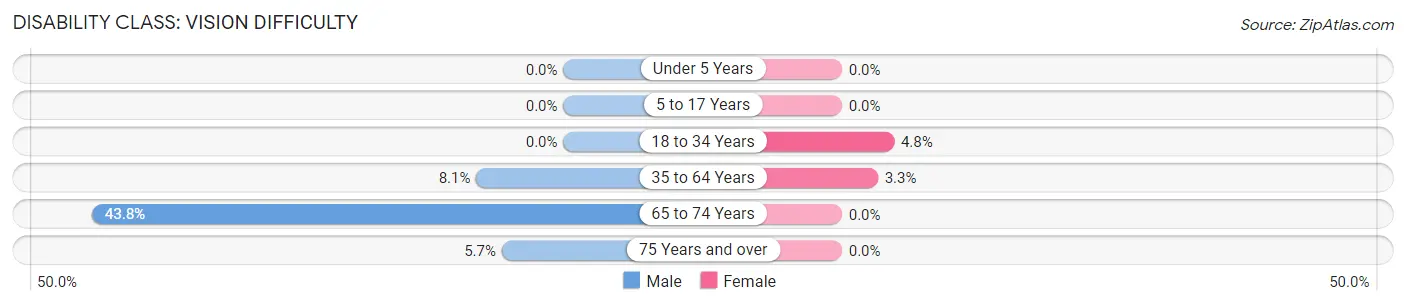
| Age Bracket | Male | Female |
| Under 5 Years | 0 (0.0%) | 0 (0.0%) |
| 5 to 17 Years | 0 (0.0%) | 0 (0.0%) |
| 18 to 34 Years | 0 (0.0%) | 3 (4.8%) |
| 35 to 64 Years | 8 (8.1%) | 3 (3.3%) |
| 65 to 74 Years | 21 (43.8%) | 0 (0.0%) |
| 75 Years and over | 2 (5.7%) | 0 (0.0%) |
Disability Class: Cognitive Difficulty
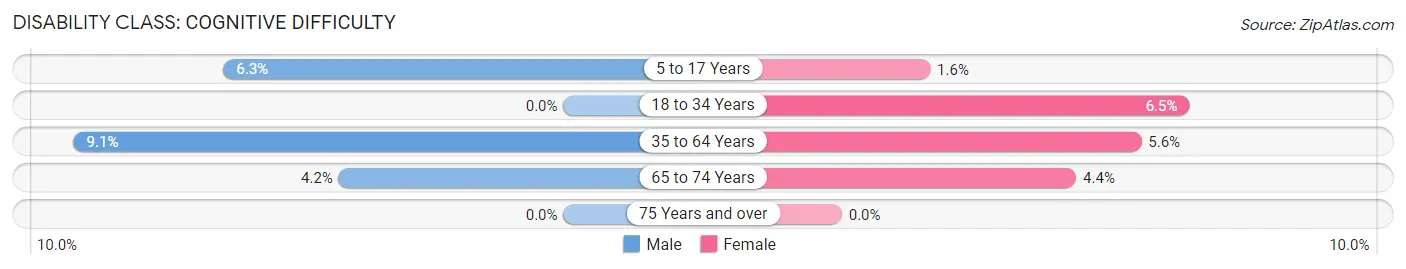
| Age Bracket | Male | Female |
| 5 to 17 Years | 7 (6.3%) | 1 (1.6%) |
| 18 to 34 Years | 0 (0.0%) | 4 (6.5%) |
| 35 to 64 Years | 9 (9.1%) | 5 (5.6%) |
| 65 to 74 Years | 2 (4.2%) | 1 (4.3%) |
| 75 Years and over | 0 (0.0%) | 0 (0.0%) |
Disability Class: Ambulatory Difficulty
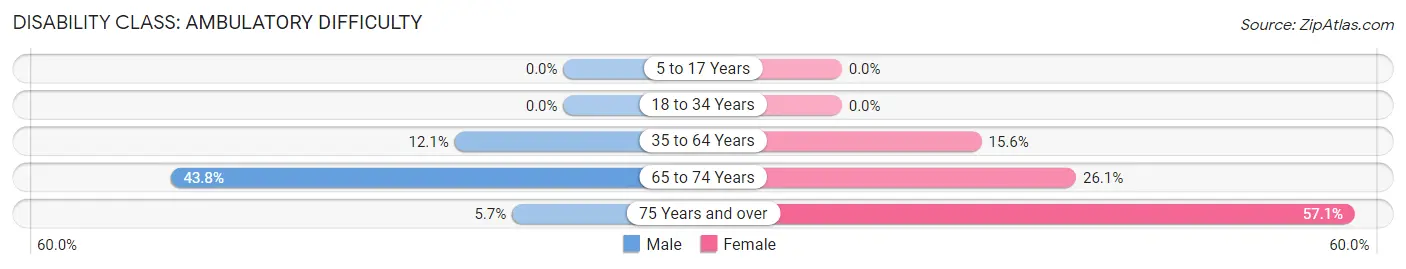
| Age Bracket | Male | Female |
| 5 to 17 Years | 0 (0.0%) | 0 (0.0%) |
| 18 to 34 Years | 0 (0.0%) | 0 (0.0%) |
| 35 to 64 Years | 12 (12.1%) | 14 (15.6%) |
| 65 to 74 Years | 21 (43.8%) | 6 (26.1%) |
| 75 Years and over | 2 (5.7%) | 8 (57.1%) |
Disability Class: Self-Care Difficulty
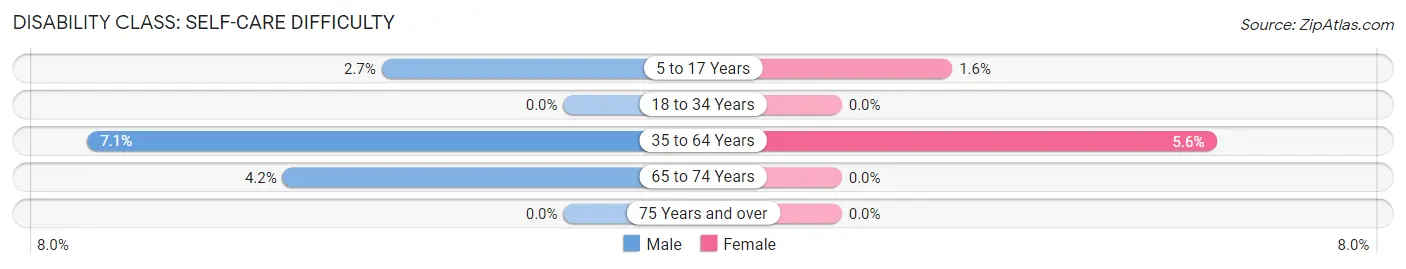
| Age Bracket | Male | Female |
| 5 to 17 Years | 3 (2.7%) | 1 (1.6%) |
| 18 to 34 Years | 0 (0.0%) | 0 (0.0%) |
| 35 to 64 Years | 7 (7.1%) | 5 (5.6%) |
| 65 to 74 Years | 2 (4.2%) | 0 (0.0%) |
| 75 Years and over | 0 (0.0%) | 0 (0.0%) |
Technology Access in Nisqually Indian Community
Computing Device Access in Nisqually Indian Community
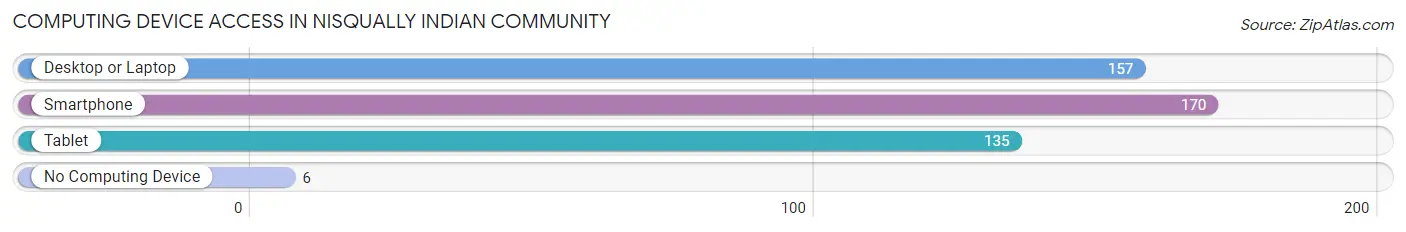
| Device Type | # Households | % Households |
| Desktop or Laptop | 157 | 80.9% |
| Smartphone | 170 | 87.6% |
| Tablet | 135 | 69.6% |
| No Computing Device | 6 | 3.1% |
| Total | 194 | 100.0% |
Internet Access in Nisqually Indian Community
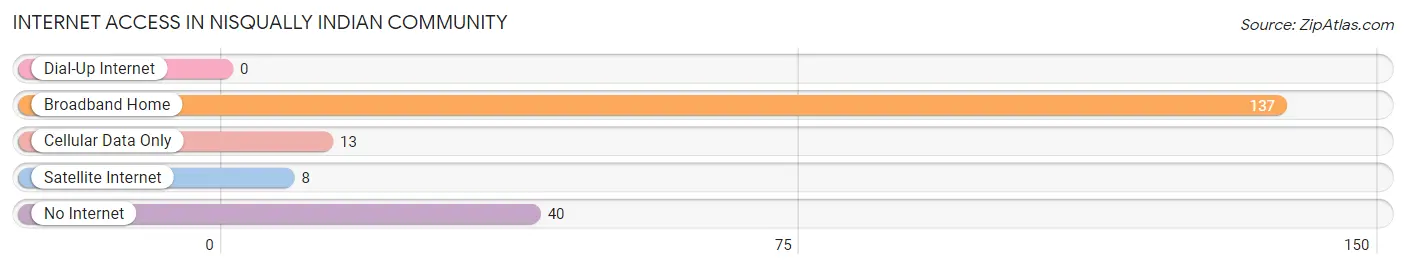
| Internet Type | # Households | % Households |
| Dial-Up Internet | 0 | 0.0% |
| Broadband Home | 137 | 70.6% |
| Cellular Data Only | 13 | 6.7% |
| Satellite Internet | 8 | 4.1% |
| No Internet | 40 | 20.6% |
| Total | 194 | 100.0% |
Nisqually Indian Community Summary
The Nisqually Indian Community is a federally recognized Native American tribe located in western Washington State. The Nisqually Indian Community is a signatory to the Treaty of Medicine Creek, which was signed in 1854. The Nisqually Indian Community is located in the Nisqually River Valley, which is located in the southern part of the Puget Sound region. The Nisqually Indian Community is comprised of approximately 1,000 members, with a majority of them living on the Nisqually Reservation.
History
The Nisqually Indian Community has a long and rich history that dates back thousands of years. The Nisqually people are part of the Coast Salish people, who have lived in the Puget Sound region for thousands of years. The Nisqually people were a semi-nomadic people who lived off the land and the resources of the Nisqually River Valley. The Nisqually people were known for their fishing and hunting skills, as well as their basket weaving and cedar bark weaving.
The Nisqually people were first encountered by Europeans in 1792, when Captain George Vancouver explored the Puget Sound region. The Nisqually people were friendly and welcoming to the Europeans, and the two groups were able to establish a peaceful relationship. In 1854, the Nisqually people signed the Treaty of Medicine Creek, which established the Nisqually Reservation. The treaty also granted the Nisqually people fishing rights, hunting rights, and the right to practice their traditional customs and beliefs.
Geography
The Nisqually Indian Community is located in the Nisqually River Valley, which is located in the southern part of the Puget Sound region. The Nisqually Reservation is located on the Nisqually River, which is approximately 25 miles south of Tacoma, Washington. The Nisqually Reservation is approximately 2,000 acres in size and is located in both Thurston and Pierce Counties. The Nisqually Reservation is surrounded by the Nisqually National Wildlife Refuge, which is a protected area that is home to a variety of wildlife species.
Economy
The Nisqually Indian Community has a diversified economy that includes both traditional and modern industries. The Nisqually people are known for their fishing and hunting skills, and the Nisqually Reservation is home to a variety of fish and wildlife species. The Nisqually people also have a long history of basket weaving and cedar bark weaving, which are still practiced today. The Nisqually people also have a thriving timber industry, which includes logging and milling operations.
The Nisqually Indian Community also has a number of modern businesses, including a casino, a hotel, and a retail store. The Nisqually Indian Community also has a number of educational and cultural programs, including a language program, a cultural center, and a museum. The Nisqually Indian Community also has a number of health and social services, including a health clinic, a dental clinic, and a social services office.
Demographics
As of the 2010 census, the Nisqually Indian Community had a population of 1,039. The majority of the population (94.3%) identified as Native American, with the remaining population identifying as white (3.2%), Asian (1.2%), and other (1.3%). The median age of the population was 33.7 years, and the median household income was $37,917. The majority of the population (90.3%) spoke English as their primary language, with the remaining population speaking Spanish (3.2%), Nisqually (2.2%), and other languages (4.3%).
Common Questions
What is Per Capita Income in Nisqually Indian Community?
Per Capita income in Nisqually Indian Community is $26,462.
What is the Median Family Income in Nisqually Indian Community?
Median Family Income in Nisqually Indian Community is $83,036.
What is the Median Household income in Nisqually Indian Community?
Median Household Income in Nisqually Indian Community is $78,333.
What is Income or Wage Gap in Nisqually Indian Community?
Income or Wage Gap in Nisqually Indian Community is 11.3%.
Women in Nisqually Indian Community earn 88.7 cents for every dollar earned by a man.
What is Family Income Deficit in Nisqually Indian Community?
Family Income Deficit in Nisqually Indian Community is $7,997.
Families that are below poverty line in Nisqually Indian Community earn $7,997 less on average than the poverty threshold level.
What is Inequality or Gini Index in Nisqually Indian Community?
Inequality or Gini Index in Nisqually Indian Community is 0.42.
What is the Total Population of Nisqually Indian Community?
Total Population of Nisqually Indian Community is 593.
What is the Total Male Population of Nisqually Indian Community?
Total Male Population of Nisqually Indian Community is 333.
What is the Total Female Population of Nisqually Indian Community?
Total Female Population of Nisqually Indian Community is 260.
What is the Ratio of Males per 100 Females in Nisqually Indian Community?
There are 128.08 Males per 100 Females in Nisqually Indian Community.
What is the Ratio of Females per 100 Males in Nisqually Indian Community?
There are 78.08 Females per 100 Males in Nisqually Indian Community.
What is the Median Population Age in Nisqually Indian Community?
Median Population Age in Nisqually Indian Community is 36.0 Years.
What is the Average Family Size in Nisqually Indian Community
Average Family Size in Nisqually Indian Community is 3.5 People.
What is the Average Household Size in Nisqually Indian Community
Average Household Size in Nisqually Indian Community is 3.1 People.
How Large is the Labor Force in Nisqually Indian Community?
There are 187 People in the Labor Forcein in Nisqually Indian Community.
What is the Percentage of People in the Labor Force in Nisqually Indian Community?
45.0% of People are in the Labor Force in Nisqually Indian Community.
What is the Unemployment Rate in Nisqually Indian Community?
Unemployment Rate in Nisqually Indian Community is 9.7%.