Prescott, WA Map & Demographics
Prescott Map
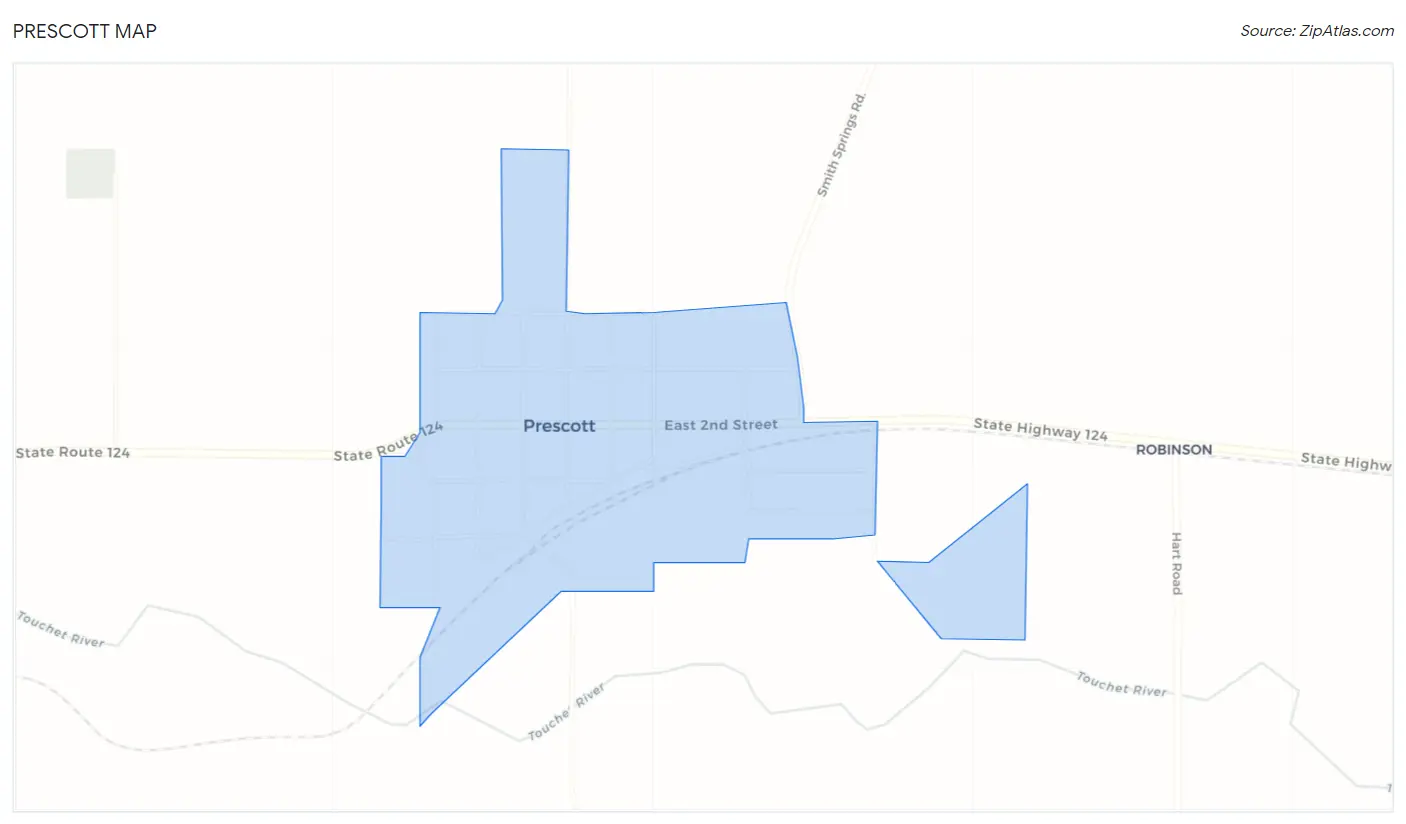
Prescott Overview
$23,309
PER CAPITA INCOME
$77,891
AVG FAMILY INCOME
$45,625
AVG HOUSEHOLD INCOME
0.44
INEQUALITY / GINI INDEX
303
TOTAL POPULATION
172
MALE POPULATION
131
FEMALE POPULATION
131.30
MALES / 100 FEMALES
76.16
FEMALES / 100 MALES
38.5
MEDIAN AGE
3.5
AVG FAMILY SIZE
2.8
AVG HOUSEHOLD SIZE
144
LABOR FORCE [ PEOPLE ]
65.2%
PERCENT IN LABOR FORCE
10.4%
UNEMPLOYMENT RATE
Prescott Zip Codes
Prescott Area Codes
Income in Prescott
Income Overview in Prescott
Per Capita Income in Prescott is $23,309, while median incomes of families and households are $77,891 and $45,625 respectively.
| Characteristic | Number | Measure |
| Per Capita Income | 303 | $23,309 |
| Median Family Income | 69 | $77,891 |
| Mean Family Income | 69 | $70,465 |
| Median Household Income | 107 | $45,625 |
| Mean Household Income | 107 | $60,407 |
| Income Deficit | 69 | $0 |
| Wage / Income Gap (%) | 303 | 0.00% |
| Wage / Income Gap ($) | 303 | 100.00¢ per $1 |
| Gini / Inequality Index | 303 | 0.44 |
Earnings by Sex in Prescott
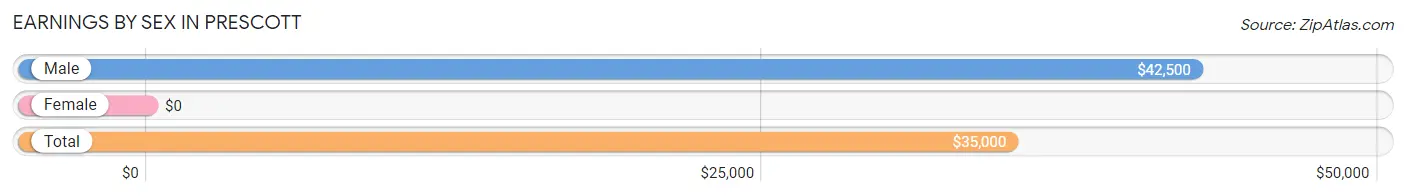
| Sex | Number | Average Earnings |
| Male | 78 (57.4%) | $42,500 |
| Female | 58 (42.6%) | $0 |
| Total | 136 (100.0%) | $35,000 |
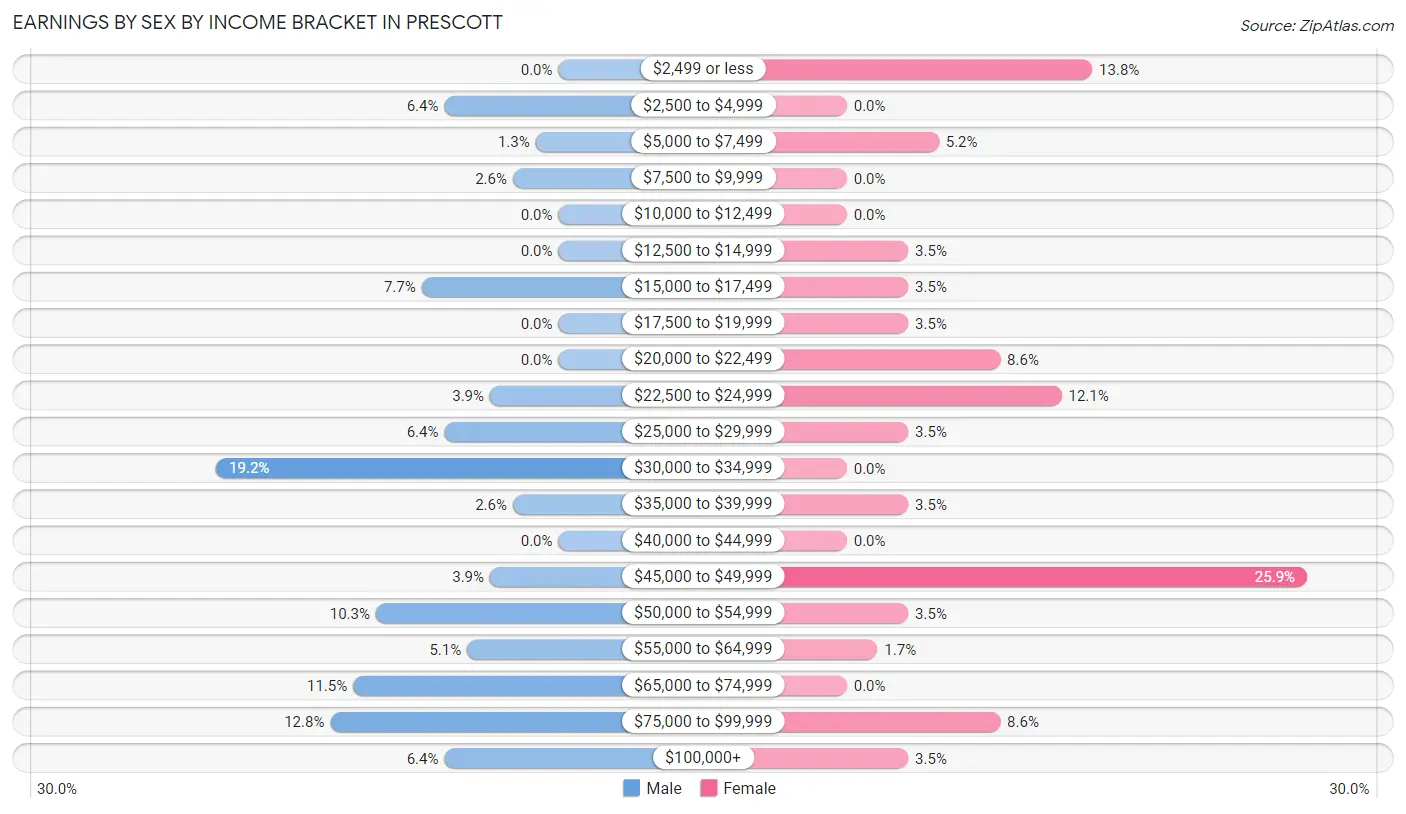
Earnings by Sex by Income Bracket in Prescott
The most common earnings brackets in Prescott are $30,000 to $34,999 for men (15 | 19.2%) and $45,000 to $49,999 for women (15 | 25.9%).
| Income | Male | Female |
| $2,499 or less | 0 (0.0%) | 8 (13.8%) |
| $2,500 to $4,999 | 5 (6.4%) | 0 (0.0%) |
| $5,000 to $7,499 | 1 (1.3%) | 3 (5.2%) |
| $7,500 to $9,999 | 2 (2.6%) | 0 (0.0%) |
| $10,000 to $12,499 | 0 (0.0%) | 0 (0.0%) |
| $12,500 to $14,999 | 0 (0.0%) | 2 (3.5%) |
| $15,000 to $17,499 | 6 (7.7%) | 2 (3.5%) |
| $17,500 to $19,999 | 0 (0.0%) | 2 (3.5%) |
| $20,000 to $22,499 | 0 (0.0%) | 5 (8.6%) |
| $22,500 to $24,999 | 3 (3.8%) | 7 (12.1%) |
| $25,000 to $29,999 | 5 (6.4%) | 2 (3.5%) |
| $30,000 to $34,999 | 15 (19.2%) | 0 (0.0%) |
| $35,000 to $39,999 | 2 (2.6%) | 2 (3.5%) |
| $40,000 to $44,999 | 0 (0.0%) | 0 (0.0%) |
| $45,000 to $49,999 | 3 (3.8%) | 15 (25.9%) |
| $50,000 to $54,999 | 8 (10.3%) | 2 (3.5%) |
| $55,000 to $64,999 | 4 (5.1%) | 1 (1.7%) |
| $65,000 to $74,999 | 9 (11.5%) | 0 (0.0%) |
| $75,000 to $99,999 | 10 (12.8%) | 5 (8.6%) |
| $100,000+ | 5 (6.4%) | 2 (3.5%) |
| Total | 78 (100.0%) | 58 (100.0%) |
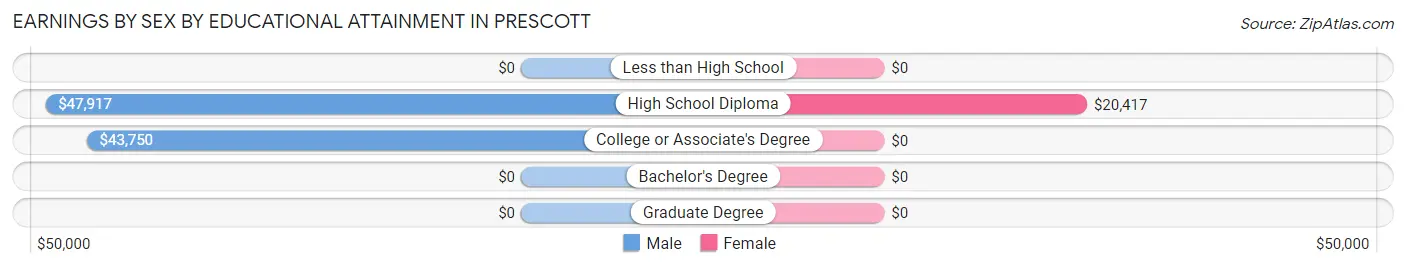
Earnings by Sex by Educational Attainment in Prescott
Average earnings in Prescott are $50,000 for men and $41,250 for women, a difference of 17.5%. Men with an educational attainment of high school diploma enjoy the highest average annual earnings of $47,917, while those with college or associate's degree education earn the least with $43,750. Women with an educational attainment of high school diploma earn the most with the average annual earnings of $20,417, while those with high school diploma education have the smallest earnings of $20,417.
| Educational Attainment | Male Income | Female Income |
| Less than High School | - | - |
| High School Diploma | $47,917 | $20,417 |
| College or Associate's Degree | $43,750 | $0 |
| Bachelor's Degree | - | - |
| Graduate Degree | - | - |
| Total | $50,000 | $41,250 |
Family Income in Prescott
Family Income Brackets in Prescott
According to the Prescott family income data, there are 23 families falling into the $75,000 to $99,999 income range, which is the most common income bracket and makes up 33.3% of all families.
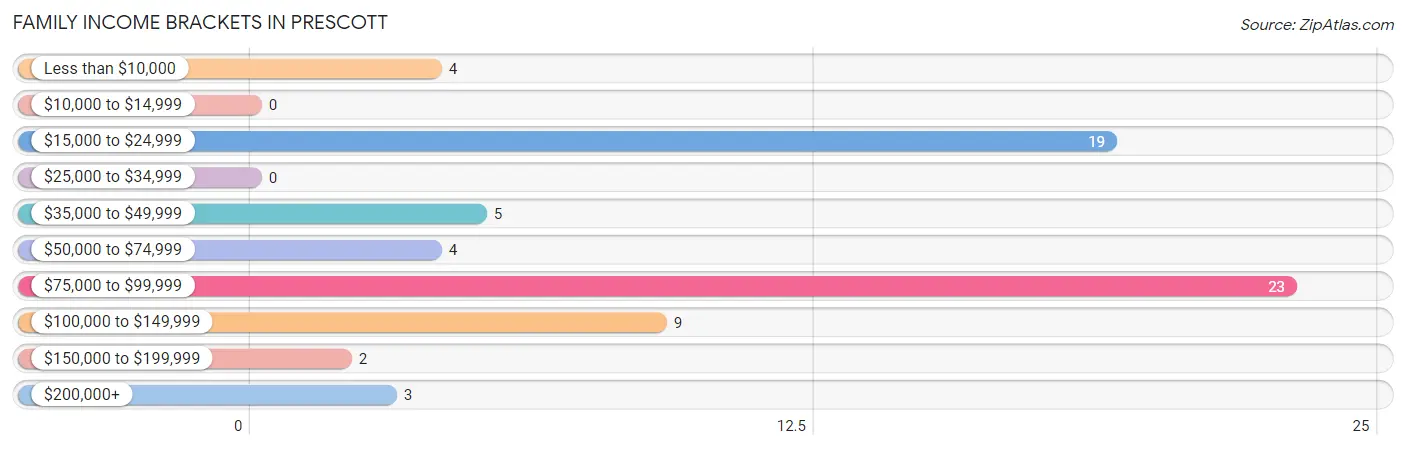
| Income Bracket | # Families | % Families |
| Less than $10,000 | 4 | 5.8% |
| $10,000 to $14,999 | 0 | 0.0% |
| $15,000 to $24,999 | 19 | 27.5% |
| $25,000 to $34,999 | 0 | 0.0% |
| $35,000 to $49,999 | 5 | 7.2% |
| $50,000 to $74,999 | 4 | 5.8% |
| $75,000 to $99,999 | 23 | 33.3% |
| $100,000 to $149,999 | 9 | 13.0% |
| $150,000 to $199,999 | 2 | 2.9% |
| $200,000+ | 3 | 4.3% |
Family Income by Famaliy Size in Prescott
6-person families (10 | 14.5%) account for the highest median family income in Prescott with $98,750 per family, while 3-person families (16 | 23.2%) have the highest median income of $26,310 per family member.
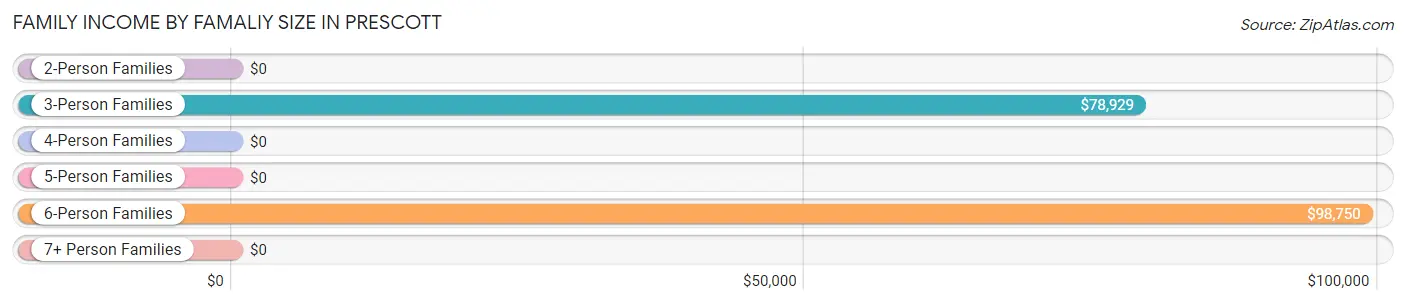
| Income Bracket | # Families | Median Income |
| 2-Person Families | 28 (40.6%) | $0 |
| 3-Person Families | 16 (23.2%) | $78,929 |
| 4-Person Families | 11 (15.9%) | $0 |
| 5-Person Families | 1 (1.5%) | $0 |
| 6-Person Families | 10 (14.5%) | $98,750 |
| 7+ Person Families | 3 (4.3%) | $0 |
| Total | 69 (100.0%) | $77,891 |
Family Income by Number of Earners in Prescott
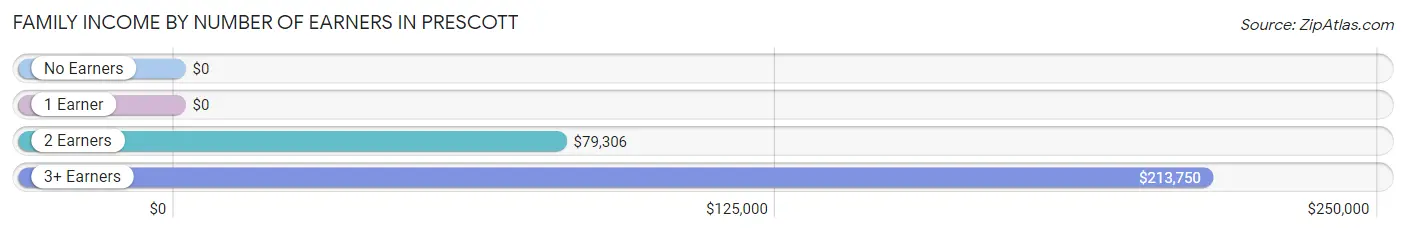
| Number of Earners | # Families | Median Income |
| No Earners | 6 (8.7%) | $0 |
| 1 Earner | 38 (55.1%) | $0 |
| 2 Earners | 21 (30.4%) | $79,306 |
| 3+ Earners | 4 (5.8%) | $213,750 |
| Total | 69 (100.0%) | $77,891 |
Household Income in Prescott
Household Income Brackets in Prescott
With 22 households falling in the category, the $15,000 to $24,999 income range is the most frequent in Prescott, accounting for 20.6% of all households. In contrast, only 2 households (1.9%) fall into the $150,000 to $199,999 income bracket, making it the least populous group.
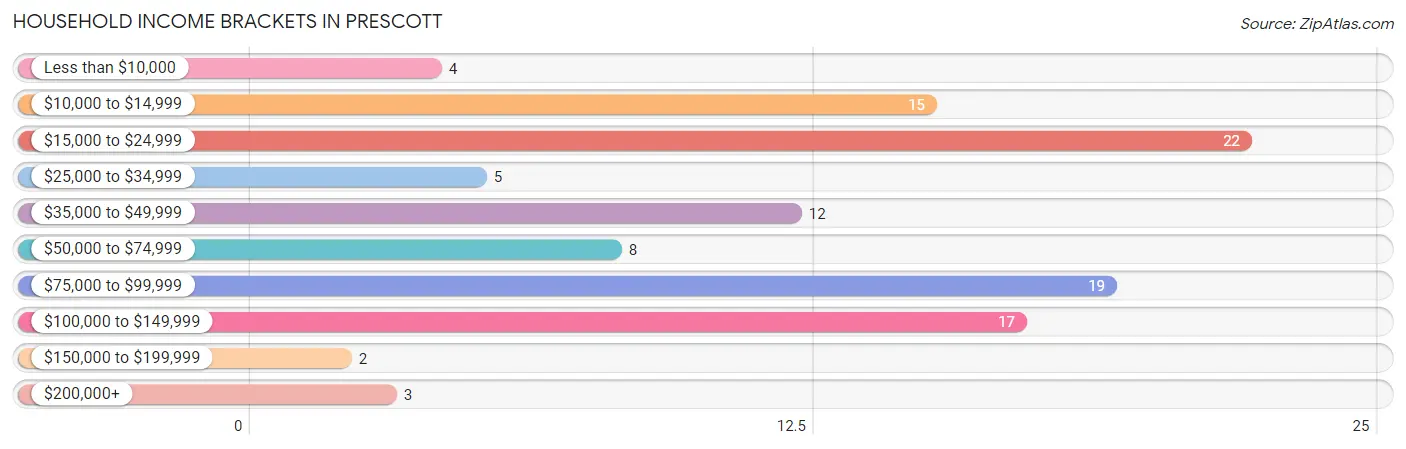
| Income Bracket | # Households | % Households |
| Less than $10,000 | 4 | 3.7% |
| $10,000 to $14,999 | 15 | 14.0% |
| $15,000 to $24,999 | 22 | 20.6% |
| $25,000 to $34,999 | 5 | 4.7% |
| $35,000 to $49,999 | 12 | 11.2% |
| $50,000 to $74,999 | 8 | 7.5% |
| $75,000 to $99,999 | 19 | 17.8% |
| $100,000 to $149,999 | 17 | 15.9% |
| $150,000 to $199,999 | 2 | 1.9% |
| $200,000+ | 3 | 2.8% |
Household Income by Householder Age in Prescott
The median household income in Prescott is $45,625, with the highest median household income of $110,625 found in the 25 to 44 years age bracket for the primary householder. A total of 27 households (25.2%) fall into this category. Meanwhile, the 15 to 24 years age bracket for the primary householder has the lowest median household income of $0, with 7 households (6.5%) in this group.
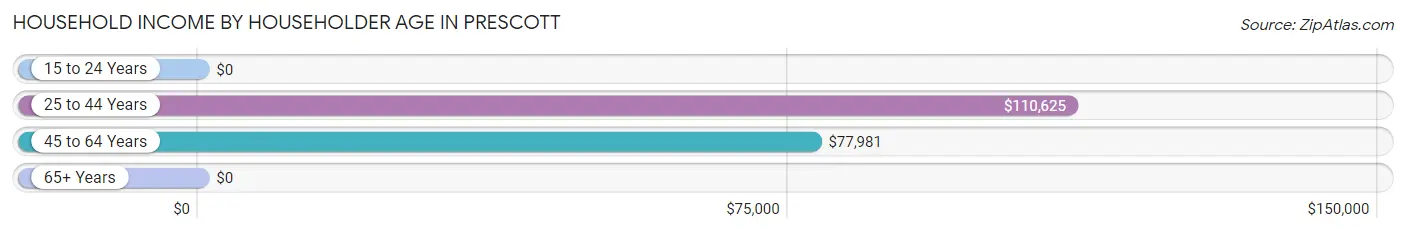
| Income Bracket | # Households | Median Income |
| 15 to 24 Years | 7 (6.5%) | $0 |
| 25 to 44 Years | 27 (25.2%) | $110,625 |
| 45 to 64 Years | 33 (30.8%) | $77,981 |
| 65+ Years | 40 (37.4%) | $0 |
| Total | 107 (100.0%) | $45,625 |
Poverty in Prescott
Income Below Poverty by Sex and Age in Prescott
With 17.5% poverty level for males and 25.2% for females among the residents of Prescott, 15 year old males and 18 to 24 year old females are the most vulnerable to poverty, with 2 males (100.0%) and 7 females (63.6%) in their respective age groups living below the poverty level.
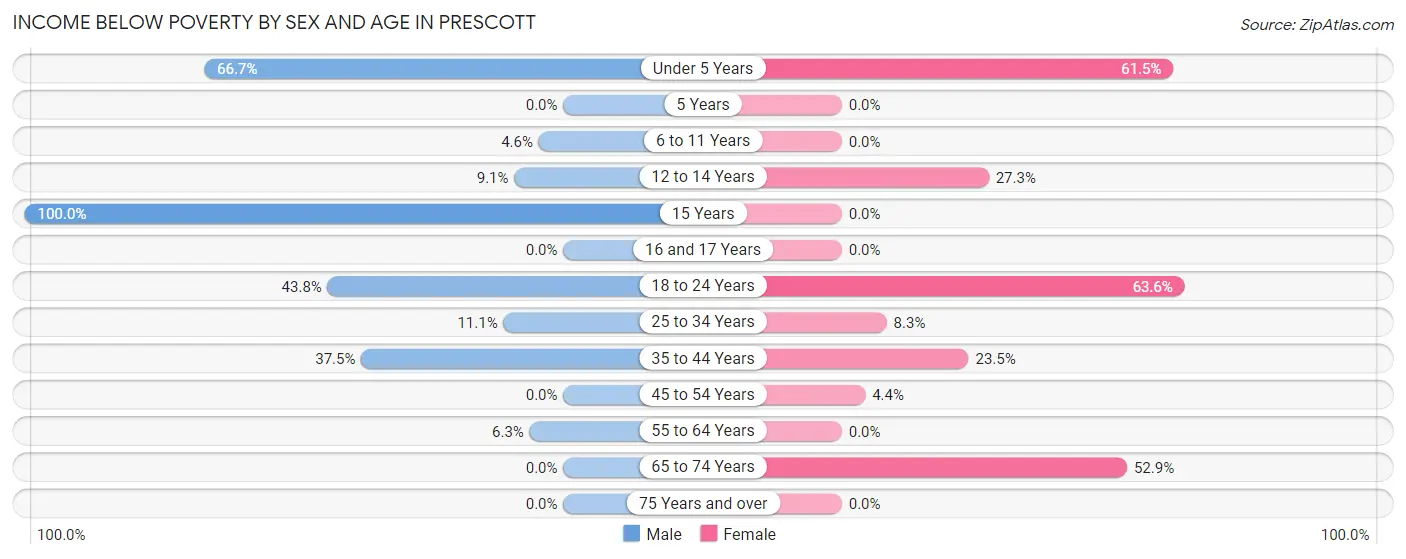
| Age Bracket | Male | Female |
| Under 5 Years | 10 (66.7%) | 8 (61.5%) |
| 5 Years | 0 (0.0%) | 0 (0.0%) |
| 6 to 11 Years | 1 (4.5%) | 0 (0.0%) |
| 12 to 14 Years | 1 (9.1%) | 3 (27.3%) |
| 15 Years | 2 (100.0%) | 0 (0.0%) |
| 16 and 17 Years | 0 (0.0%) | 0 (0.0%) |
| 18 to 24 Years | 7 (43.8%) | 7 (63.6%) |
| 25 to 34 Years | 2 (11.1%) | 1 (8.3%) |
| 35 to 44 Years | 6 (37.5%) | 4 (23.5%) |
| 45 to 54 Years | 0 (0.0%) | 1 (4.3%) |
| 55 to 64 Years | 1 (6.2%) | 0 (0.0%) |
| 65 to 74 Years | 0 (0.0%) | 9 (52.9%) |
| 75 Years and over | 0 (0.0%) | 0 (0.0%) |
| Total | 30 (17.5%) | 33 (25.2%) |
Income Above Poverty by Sex and Age in Prescott
According to the poverty statistics in Prescott, males aged 5 years and females aged 6 to 11 years are the age groups that are most secure financially, with 100.0% of males and 100.0% of females in these age groups living above the poverty line.
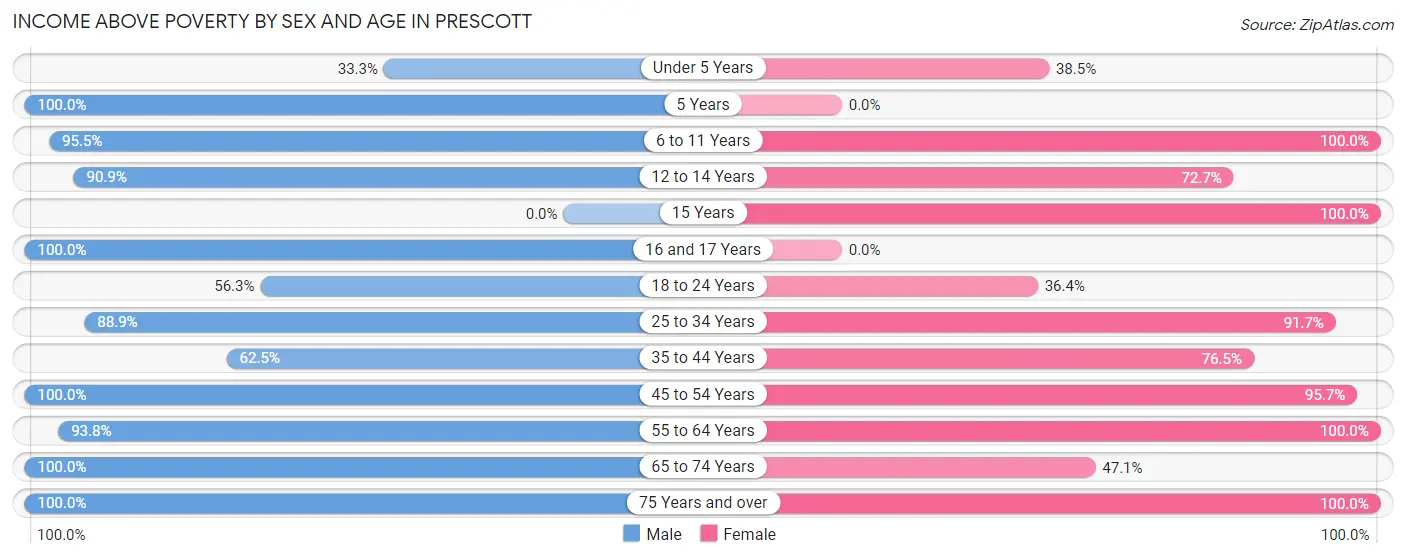
| Age Bracket | Male | Female |
| Under 5 Years | 5 (33.3%) | 5 (38.5%) |
| 5 Years | 2 (100.0%) | 0 (0.0%) |
| 6 to 11 Years | 21 (95.5%) | 3 (100.0%) |
| 12 to 14 Years | 10 (90.9%) | 8 (72.7%) |
| 15 Years | 0 (0.0%) | 2 (100.0%) |
| 16 and 17 Years | 2 (100.0%) | 0 (0.0%) |
| 18 to 24 Years | 9 (56.2%) | 4 (36.4%) |
| 25 to 34 Years | 16 (88.9%) | 11 (91.7%) |
| 35 to 44 Years | 10 (62.5%) | 13 (76.5%) |
| 45 to 54 Years | 19 (100.0%) | 22 (95.7%) |
| 55 to 64 Years | 15 (93.8%) | 13 (100.0%) |
| 65 to 74 Years | 23 (100.0%) | 8 (47.1%) |
| 75 Years and over | 9 (100.0%) | 9 (100.0%) |
| Total | 141 (82.5%) | 98 (74.8%) |
Income Below Poverty Among Married-Couple Families in Prescott
The poverty statistics for married-couple families in Prescott show that 20.0% or 11 of the total 55 families live below the poverty line. Families with 1 or 2 children have the highest poverty rate of 57.9%, comprising of 11 families. On the other hand, families with no children have the lowest poverty rate of 0.0%, which includes 0 families.
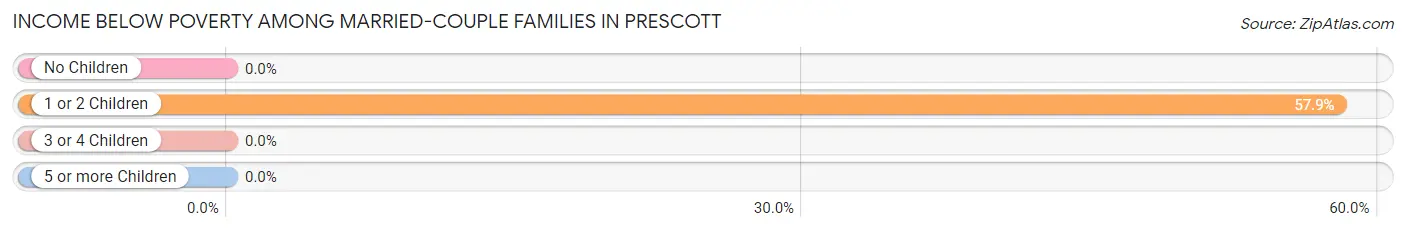
| Children | Above Poverty | Below Poverty |
| No Children | 26 (100.0%) | 0 (0.0%) |
| 1 or 2 Children | 8 (42.1%) | 11 (57.9%) |
| 3 or 4 Children | 10 (100.0%) | 0 (0.0%) |
| 5 or more Children | 0 (0.0%) | 0 (0.0%) |
| Total | 44 (80.0%) | 11 (20.0%) |
Income Below Poverty Among Single-Parent Households in Prescott
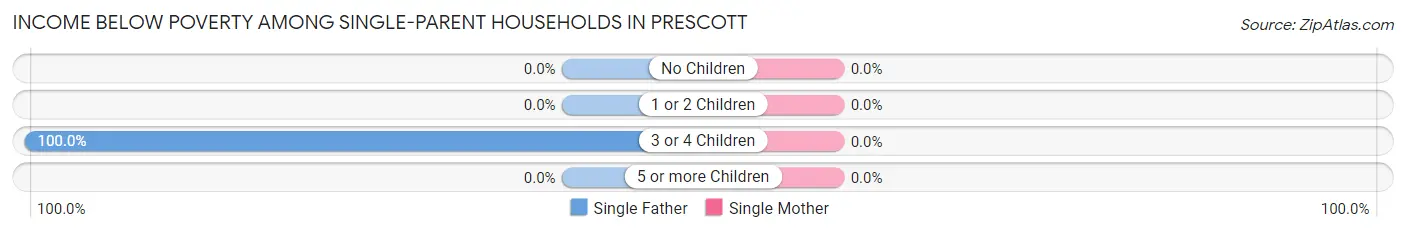
| Children | Single Father | Single Mother |
| No Children | 0 (0.0%) | 0 (0.0%) |
| 1 or 2 Children | 0 (0.0%) | 0 (0.0%) |
| 3 or 4 Children | 1 (100.0%) | 0 (0.0%) |
| 5 or more Children | 0 (0.0%) | 0 (0.0%) |
| Total | 1 (100.0%) | 0 (0.0%) |
Income Below Poverty Among Married-Couple vs Single-Parent Households in Prescott
The poverty data for Prescott shows that 11 of the married-couple family households (20.0%) and 1 of the single-parent households (7.1%) are living below the poverty level. Within the married-couple family households, those with 1 or 2 children have the highest poverty rate, with 11 households (57.9%) falling below the poverty line. Among the single-parent households, those with 3 or 4 children have the highest poverty rate, with 1 household (100.0%) living below poverty.
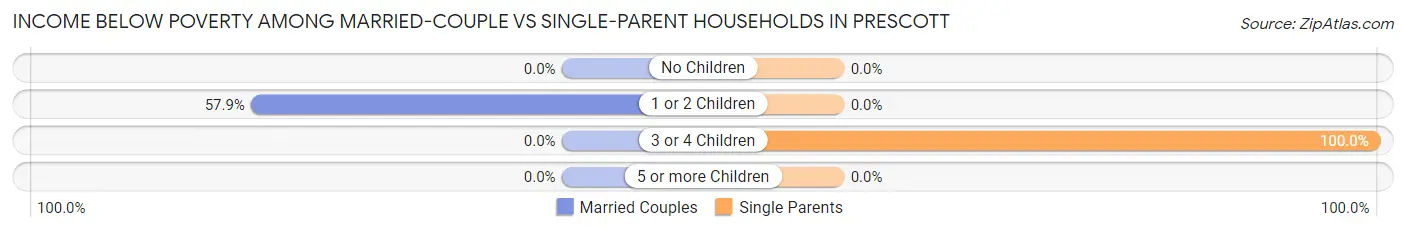
| Children | Married-Couple Families | Single-Parent Households |
| No Children | 0 (0.0%) | 0 (0.0%) |
| 1 or 2 Children | 11 (57.9%) | 0 (0.0%) |
| 3 or 4 Children | 0 (0.0%) | 1 (100.0%) |
| 5 or more Children | 0 (0.0%) | 0 (0.0%) |
| Total | 11 (20.0%) | 1 (7.1%) |
Race in Prescott
The most populous races in Prescott are White / Caucasian (251 | 82.8%), Two or more Races (28 | 9.2%), and Hispanic or Latino (24 | 7.9%).
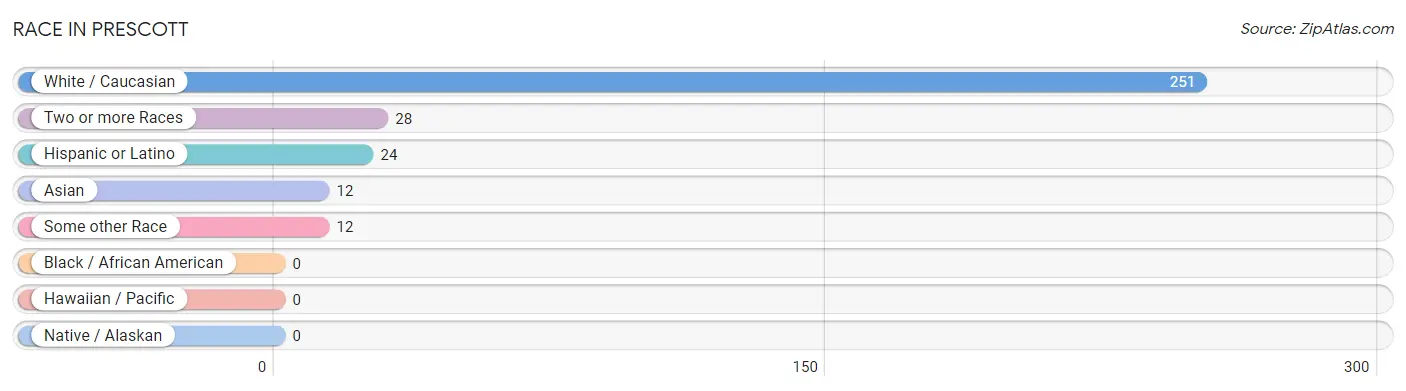
| Race | # Population | % Population |
| Asian | 12 | 4.0% |
| Black / African American | 0 | 0.0% |
| Hawaiian / Pacific | 0 | 0.0% |
| Hispanic or Latino | 24 | 7.9% |
| Native / Alaskan | 0 | 0.0% |
| White / Caucasian | 251 | 82.8% |
| Two or more Races | 28 | 9.2% |
| Some other Race | 12 | 4.0% |
| Total | 303 | 100.0% |
Ancestry in Prescott
The most populous ancestries reported in Prescott are Irish (50 | 16.5%), German (31 | 10.2%), Mexican (24 | 7.9%), Dutch (21 | 6.9%), and English (14 | 4.6%), together accounting for 46.2% of all Prescott residents.
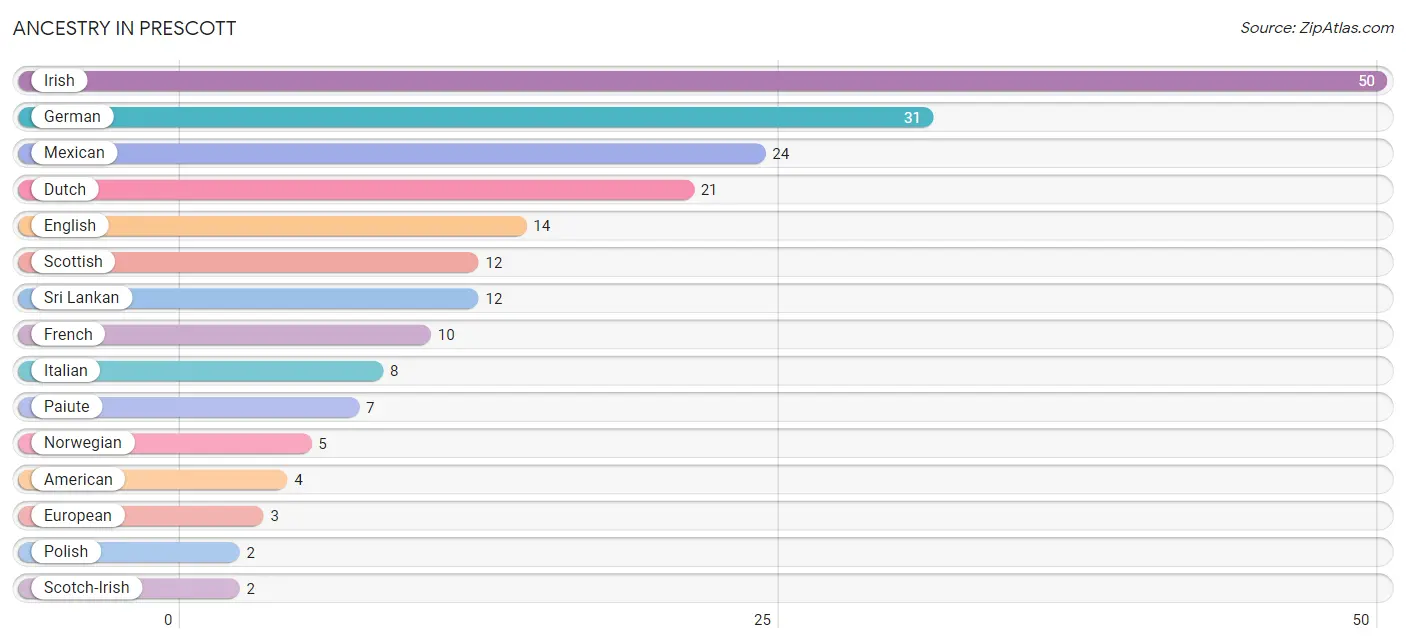
| Ancestry | # Population | % Population |
| American | 4 | 1.3% |
| Dutch | 21 | 6.9% |
| English | 14 | 4.6% |
| European | 3 | 1.0% |
| French | 10 | 3.3% |
| German | 31 | 10.2% |
| Irish | 50 | 16.5% |
| Italian | 8 | 2.6% |
| Mexican | 24 | 7.9% |
| Norwegian | 5 | 1.7% |
| Paiute | 7 | 2.3% |
| Polish | 2 | 0.7% |
| Russian | 1 | 0.3% |
| Scotch-Irish | 2 | 0.7% |
| Scottish | 12 | 4.0% |
| Sri Lankan | 12 | 4.0% |
| Swedish | 1 | 0.3% |
| Welsh | 2 | 0.7% | View All 18 Rows |
Immigrants in Prescott
The most numerous immigrant groups reported in Prescott came from Asia (8 | 2.6%), South Eastern Asia (8 | 2.6%), Vietnam (8 | 2.6%), Eastern Europe (1 | 0.3%), and Europe (1 | 0.3%), together accounting for 8.6% of all Prescott residents.
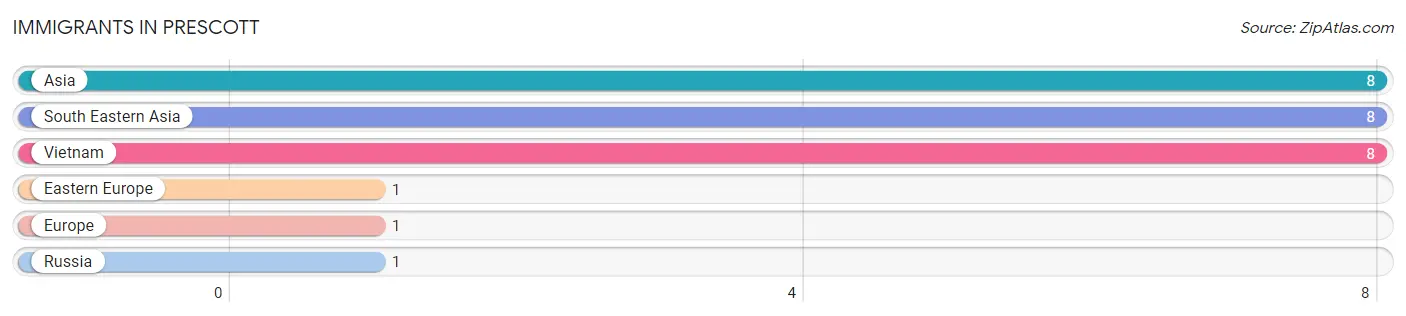
| Immigration Origin | # Population | % Population |
| Asia | 8 | 2.6% |
| Eastern Europe | 1 | 0.3% |
| Europe | 1 | 0.3% |
| Russia | 1 | 0.3% |
| South Eastern Asia | 8 | 2.6% |
| Vietnam | 8 | 2.6% | View All 6 Rows |
Sex and Age in Prescott
Sex and Age in Prescott
The most populous age groups in Prescott are 5 to 9 Years (21 | 12.2%) for men and 50 to 54 Years (17 | 13.0%) for women.
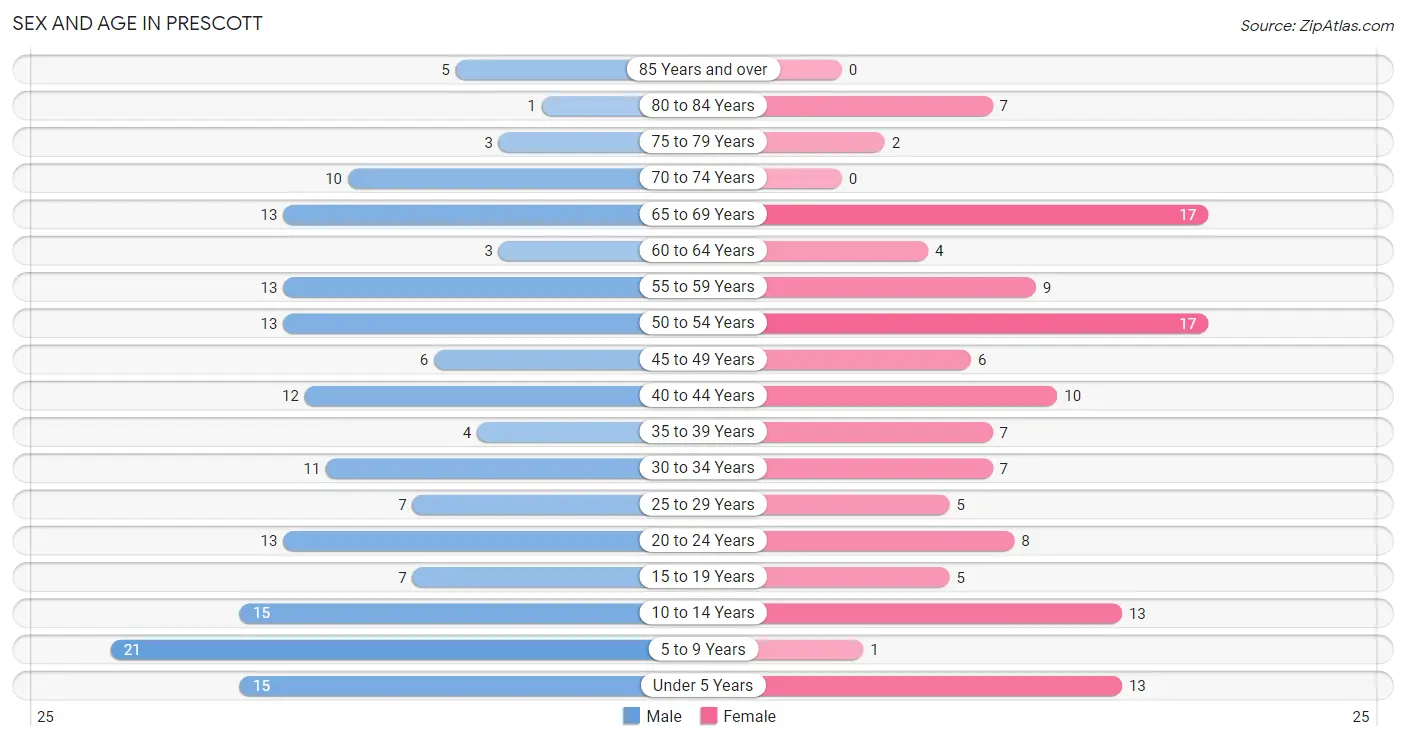
| Age Bracket | Male | Female |
| Under 5 Years | 15 (8.7%) | 13 (9.9%) |
| 5 to 9 Years | 21 (12.2%) | 1 (0.8%) |
| 10 to 14 Years | 15 (8.7%) | 13 (9.9%) |
| 15 to 19 Years | 7 (4.1%) | 5 (3.8%) |
| 20 to 24 Years | 13 (7.6%) | 8 (6.1%) |
| 25 to 29 Years | 7 (4.1%) | 5 (3.8%) |
| 30 to 34 Years | 11 (6.4%) | 7 (5.3%) |
| 35 to 39 Years | 4 (2.3%) | 7 (5.3%) |
| 40 to 44 Years | 12 (7.0%) | 10 (7.6%) |
| 45 to 49 Years | 6 (3.5%) | 6 (4.6%) |
| 50 to 54 Years | 13 (7.6%) | 17 (13.0%) |
| 55 to 59 Years | 13 (7.6%) | 9 (6.9%) |
| 60 to 64 Years | 3 (1.7%) | 4 (3.0%) |
| 65 to 69 Years | 13 (7.6%) | 17 (13.0%) |
| 70 to 74 Years | 10 (5.8%) | 0 (0.0%) |
| 75 to 79 Years | 3 (1.7%) | 2 (1.5%) |
| 80 to 84 Years | 1 (0.6%) | 7 (5.3%) |
| 85 Years and over | 5 (2.9%) | 0 (0.0%) |
| Total | 172 (100.0%) | 131 (100.0%) |
Families and Households in Prescott
Median Family Size in Prescott
The median family size in Prescott is 3.51 persons per family, with single male/father families (1 | 1.5%) accounting for the largest median family size of 7 persons per family. On the other hand, single female/mother families (13 | 18.8%) represent the smallest median family size with 2.62 persons per family.
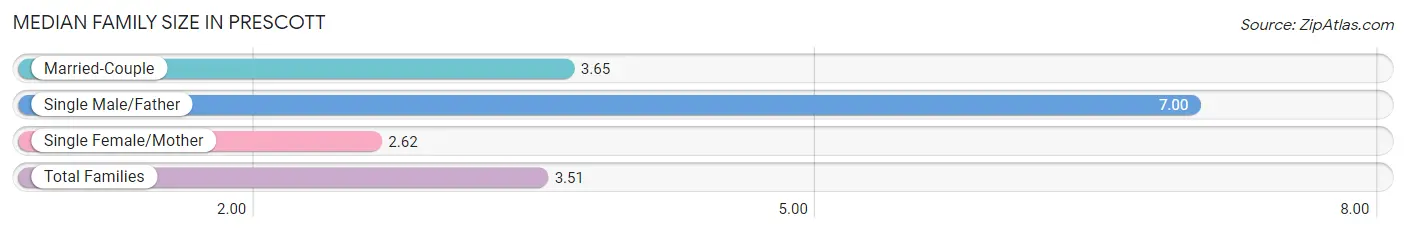
| Family Type | # Families | Family Size |
| Married-Couple | 55 (79.7%) | 3.65 |
| Single Male/Father | 1 (1.5%) | 7.00 |
| Single Female/Mother | 13 (18.8%) | 2.62 |
| Total Families | 69 (100.0%) | 3.51 |
Median Household Size in Prescott
The median household size in Prescott is 2.83 persons per household, with single male/father households (1 | 0.9%) accounting for the largest median household size of 8 persons per household. non-family households (38 | 35.5%) represent the smallest median household size with 1.37 persons per household.
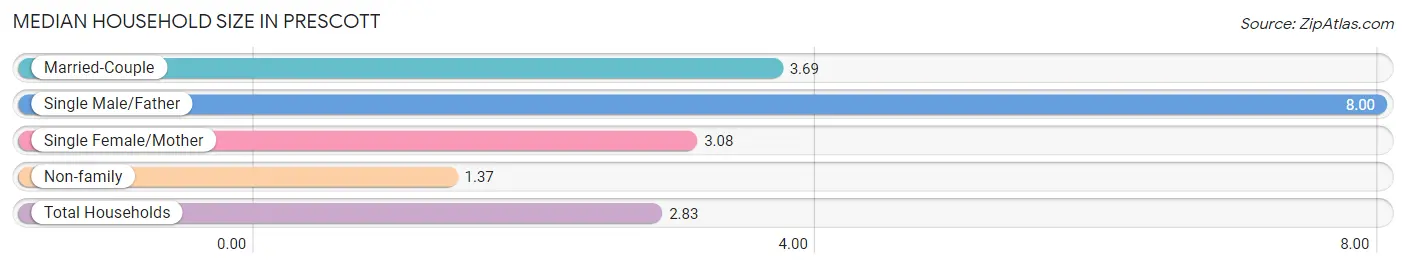
| Household Type | # Households | Household Size |
| Married-Couple | 55 (51.4%) | 3.69 |
| Single Male/Father | 1 (0.9%) | 8.00 |
| Single Female/Mother | 13 (12.1%) | 3.08 |
| Non-family | 38 (35.5%) | 1.37 |
| Total Households | 107 (100.0%) | 2.83 |
Household Size by Marriage Status in Prescott
Out of a total of 107 households in Prescott, 69 (64.5%) are family households, while 38 (35.5%) are nonfamily households. The most numerous type of family households are 2-person households, comprising 28, and the most common type of nonfamily households are 1-person households, comprising 31.
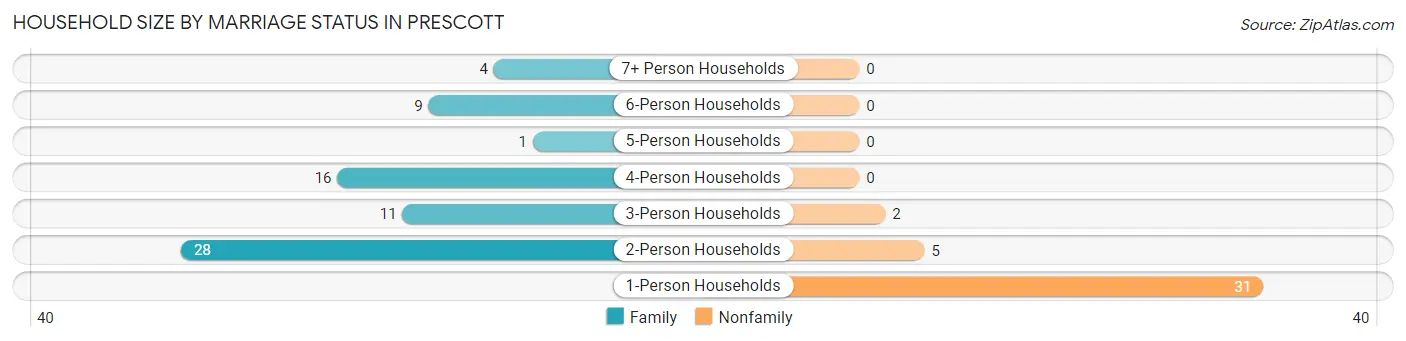
| Household Size | Family Households | Nonfamily Households |
| 1-Person Households | - | 31 (29.0%) |
| 2-Person Households | 28 (26.2%) | 5 (4.7%) |
| 3-Person Households | 11 (10.3%) | 2 (1.9%) |
| 4-Person Households | 16 (14.9%) | 0 (0.0%) |
| 5-Person Households | 1 (0.9%) | 0 (0.0%) |
| 6-Person Households | 9 (8.4%) | 0 (0.0%) |
| 7+ Person Households | 4 (3.7%) | 0 (0.0%) |
| Total | 69 (64.5%) | 38 (35.5%) |
Female Fertility in Prescott
Fertility by Age in Prescott
Average fertility rate in Prescott is 115.0 births per 1,000 women. Women in the age bracket of 20 to 34 years have the highest fertility rate with 350.0 births per 1,000 women. Women in the age bracket of 20 to 34 years acount for 100.0% of all women with births.
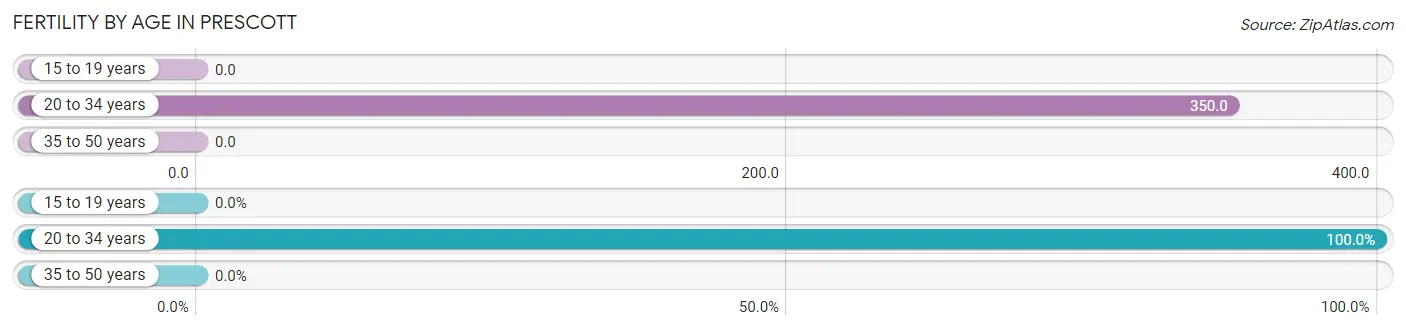
| Age Bracket | Women with Births | Births / 1,000 Women |
| 15 to 19 years | 0 (0.0%) | 0.0 |
| 20 to 34 years | 7 (100.0%) | 350.0 |
| 35 to 50 years | 0 (0.0%) | 0.0 |
| Total | 7 (100.0%) | 115.0 |
Fertility by Age by Marriage Status in Prescott
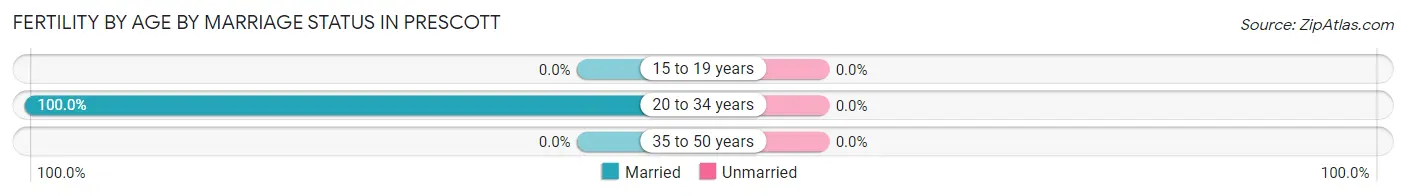
| Age Bracket | Married | Unmarried |
| 15 to 19 years | 0 (0.0%) | 0 (0.0%) |
| 20 to 34 years | 7 (100.0%) | 0 (0.0%) |
| 35 to 50 years | 0 (0.0%) | 0 (0.0%) |
| Total | 7 (100.0%) | 0 (0.0%) |
Fertility by Education in Prescott
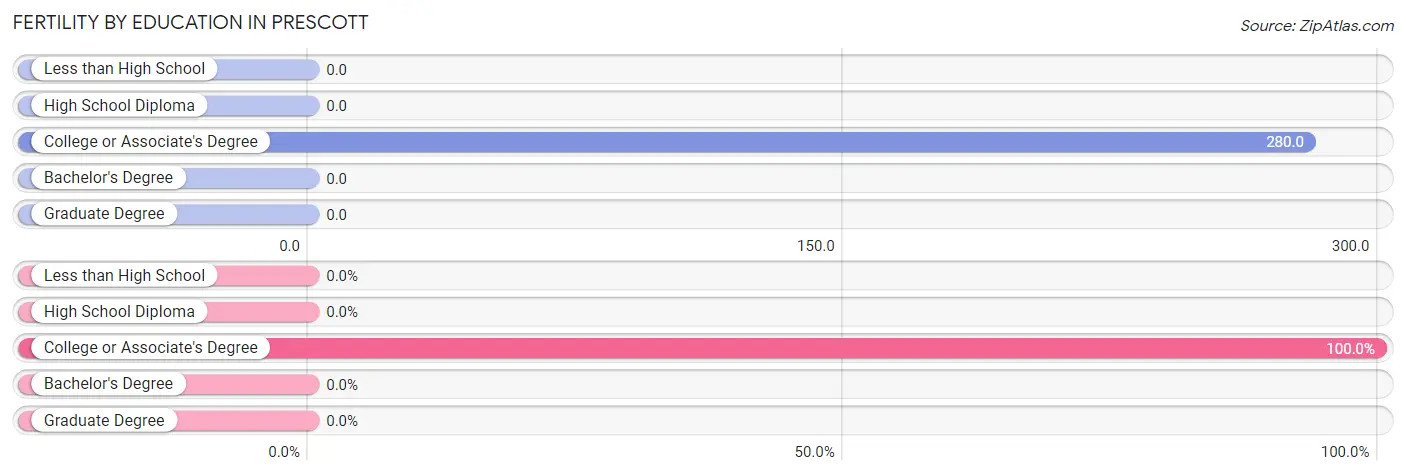
| Educational Attainment | Women with Births | Births / 1,000 Women |
| Less than High School | 0 (0.0%) | 0.0 |
| High School Diploma | 0 (0.0%) | 0.0 |
| College or Associate's Degree | 7 (100.0%) | 280.0 |
| Bachelor's Degree | 0 (0.0%) | 0.0 |
| Graduate Degree | 0 (0.0%) | 0.0 |
| Total | 7 (100.0%) | 115.0 |
Fertility by Education by Marriage Status in Prescott
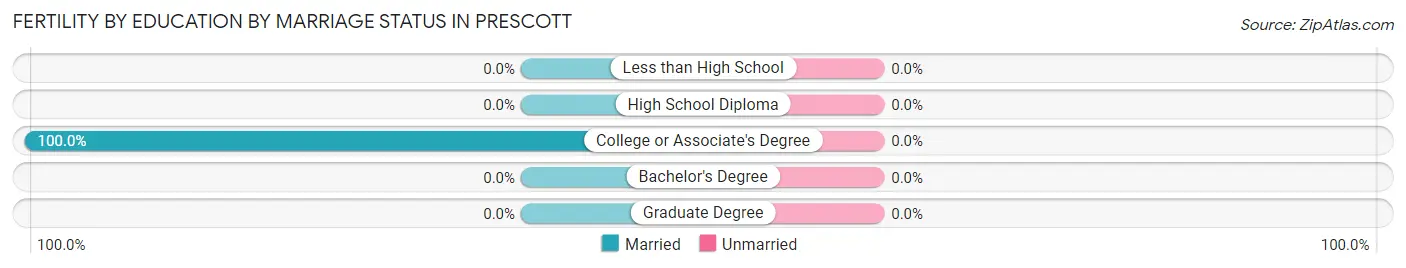
| Educational Attainment | Married | Unmarried |
| Less than High School | 0 (0.0%) | 0 (0.0%) |
| High School Diploma | 0 (0.0%) | 0 (0.0%) |
| College or Associate's Degree | 7 (100.0%) | 0 (0.0%) |
| Bachelor's Degree | 0 (0.0%) | 0 (0.0%) |
| Graduate Degree | 0 (0.0%) | 0 (0.0%) |
| Total | 7 (100.0%) | 0 (0.0%) |
Employment Characteristics in Prescott
Employment by Class of Employer in Prescott
Among the 129 employed individuals in Prescott, private company employees (75 | 58.1%), self-employed (not incorporated) (19 | 14.7%), and not-for-profit organizations (16 | 12.4%) make up the most common classes of employment.
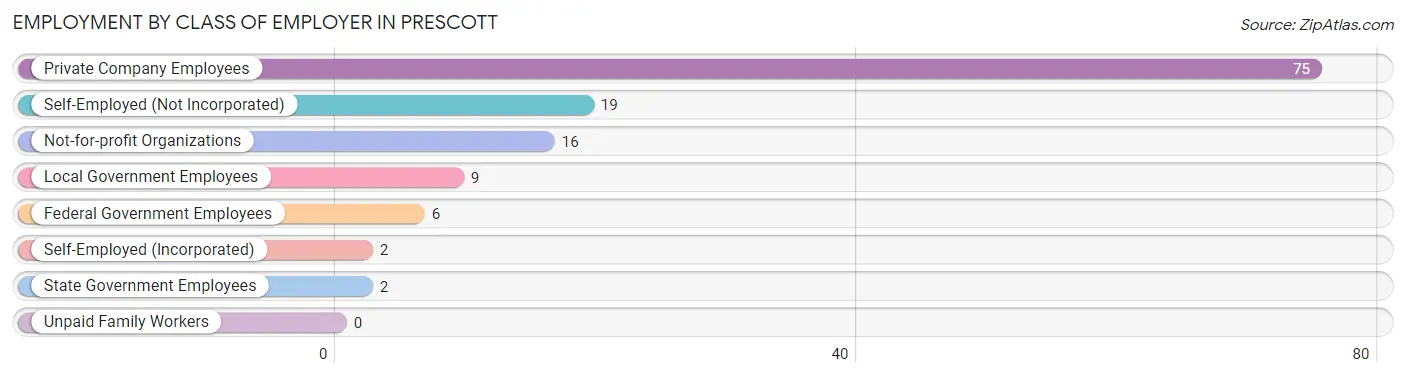
| Employer Class | # Employees | % Employees |
| Private Company Employees | 75 | 58.1% |
| Self-Employed (Incorporated) | 2 | 1.5% |
| Self-Employed (Not Incorporated) | 19 | 14.7% |
| Not-for-profit Organizations | 16 | 12.4% |
| Local Government Employees | 9 | 7.0% |
| State Government Employees | 2 | 1.5% |
| Federal Government Employees | 6 | 4.6% |
| Unpaid Family Workers | 0 | 0.0% |
| Total | 129 | 100.0% |
Employment Status by Age in Prescott
According to the labor force statistics for Prescott, out of the total population over 16 years of age (221), 65.2% or 144 individuals are in the labor force, with 10.4% or 15 of them unemployed. The age group with the highest labor force participation rate is 20 to 24 years, with 100.0% or 21 individuals in the labor force. Within the labor force, the 20 to 24 years age range has the highest percentage of unemployed individuals, with 33.3% or 7 of them being unemployed.
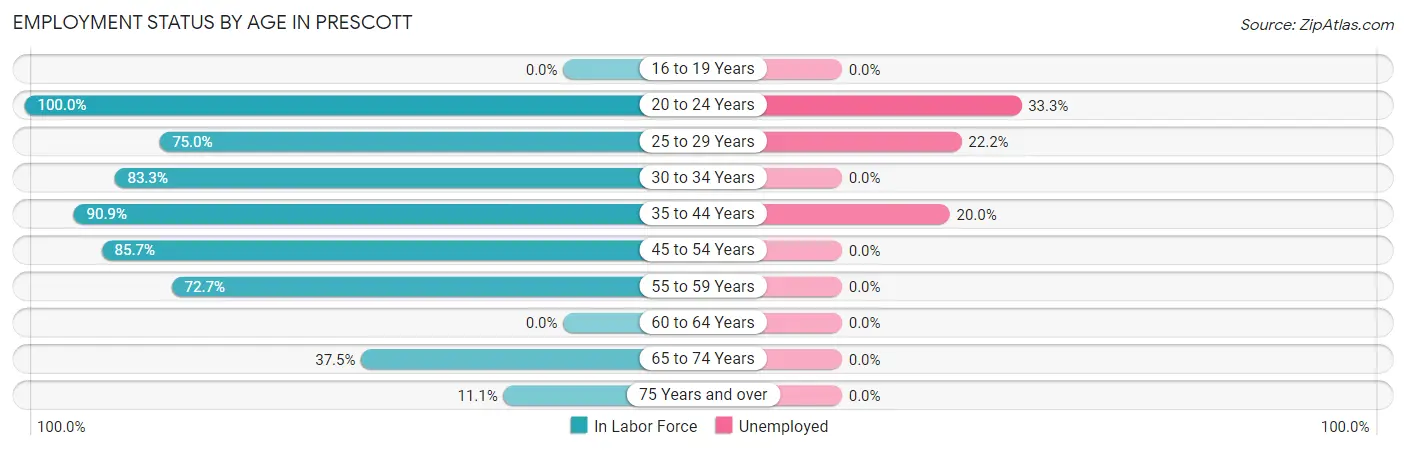
| Age Bracket | In Labor Force | Unemployed |
| 16 to 19 Years | 0 (0.0%) | 0 (0.0%) |
| 20 to 24 Years | 21 (100.0%) | 7 (33.3%) |
| 25 to 29 Years | 9 (75.0%) | 2 (22.2%) |
| 30 to 34 Years | 15 (83.3%) | 0 (0.0%) |
| 35 to 44 Years | 30 (90.9%) | 6 (20.0%) |
| 45 to 54 Years | 36 (85.7%) | 0 (0.0%) |
| 55 to 59 Years | 16 (72.7%) | 0 (0.0%) |
| 60 to 64 Years | 0 (0.0%) | 0 (0.0%) |
| 65 to 74 Years | 15 (37.5%) | 0 (0.0%) |
| 75 Years and over | 2 (11.1%) | 0 (0.0%) |
| Total | 144 (65.2%) | 15 (10.4%) |
Employment Status by Educational Attainment in Prescott
According to labor force statistics for Prescott, 79.1% of individuals (106) out of the total population between 25 and 64 years of age (134) are in the labor force, with 7.5% or 8 of them being unemployed. The group with the highest labor force participation rate are those with the educational attainment of bachelor's degree or higher, with 100.0% or 24 individuals in the labor force. Within the labor force, individuals with less than high school education have the highest percentage of unemployment, with 77.8% or 7 of them being unemployed.
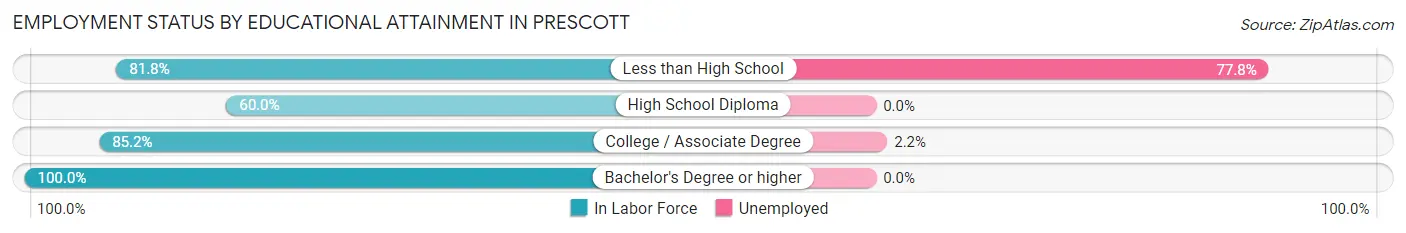
| Educational Attainment | In Labor Force | Unemployed |
| Less than High School | 9 (81.8%) | 9 (77.8%) |
| High School Diploma | 27 (60.0%) | 0 (0.0%) |
| College / Associate Degree | 46 (85.2%) | 1 (2.2%) |
| Bachelor's Degree or higher | 24 (100.0%) | 0 (0.0%) |
| Total | 106 (79.1%) | 10 (7.5%) |
Employment Occupations by Sex in Prescott
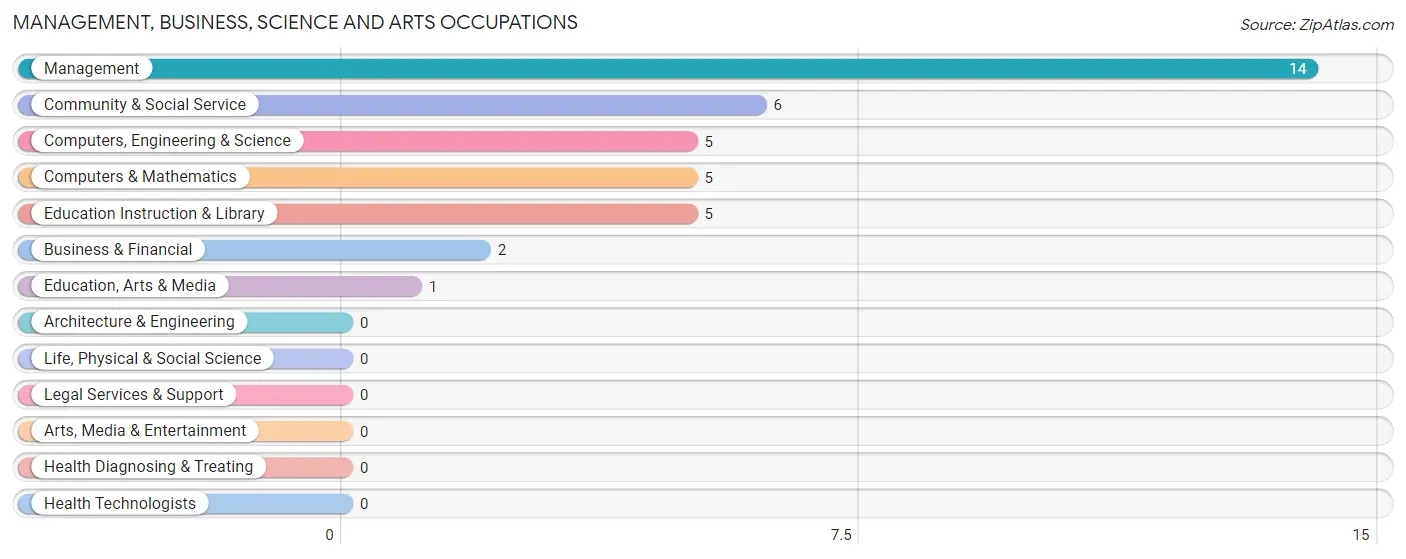
Management, Business, Science and Arts Occupations
The most common Management, Business, Science and Arts occupations in Prescott are Management (14 | 10.8%), Community & Social Service (6 | 4.6%), Computers, Engineering & Science (5 | 3.9%), Computers & Mathematics (5 | 3.9%), and Education Instruction & Library (5 | 3.9%).
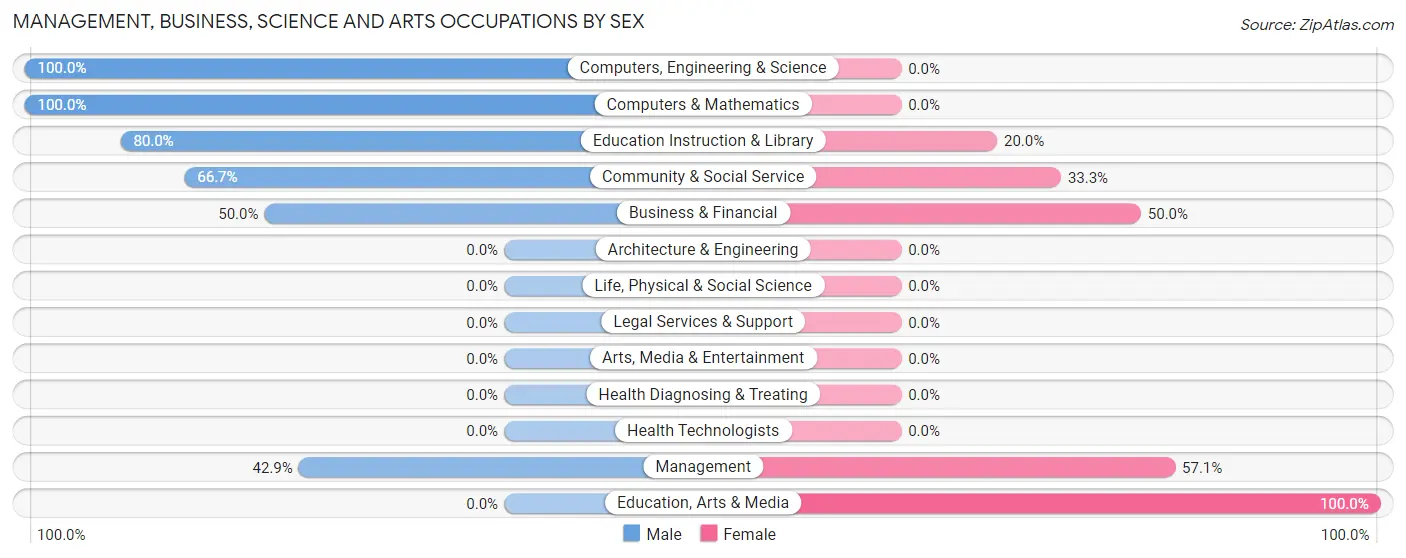
Management, Business, Science and Arts Occupations by Sex
Within the Management, Business, Science and Arts occupations in Prescott, the most male-oriented occupations are Computers, Engineering & Science (100.0%), Computers & Mathematics (100.0%), and Education Instruction & Library (80.0%), while the most female-oriented occupations are Education, Arts & Media (100.0%), Management (57.1%), and Business & Financial (50.0%).
| Occupation | Male | Female |
| Management | 6 (42.9%) | 8 (57.1%) |
| Business & Financial | 1 (50.0%) | 1 (50.0%) |
| Computers, Engineering & Science | 5 (100.0%) | 0 (0.0%) |
| Computers & Mathematics | 5 (100.0%) | 0 (0.0%) |
| Architecture & Engineering | 0 (0.0%) | 0 (0.0%) |
| Life, Physical & Social Science | 0 (0.0%) | 0 (0.0%) |
| Community & Social Service | 4 (66.7%) | 2 (33.3%) |
| Education, Arts & Media | 0 (0.0%) | 1 (100.0%) |
| Legal Services & Support | 0 (0.0%) | 0 (0.0%) |
| Education Instruction & Library | 4 (80.0%) | 1 (20.0%) |
| Arts, Media & Entertainment | 0 (0.0%) | 0 (0.0%) |
| Health Diagnosing & Treating | 0 (0.0%) | 0 (0.0%) |
| Health Technologists | 0 (0.0%) | 0 (0.0%) |
| Total (Category) | 16 (59.3%) | 11 (40.7%) |
| Total (Overall) | 73 (56.6%) | 56 (43.4%) |
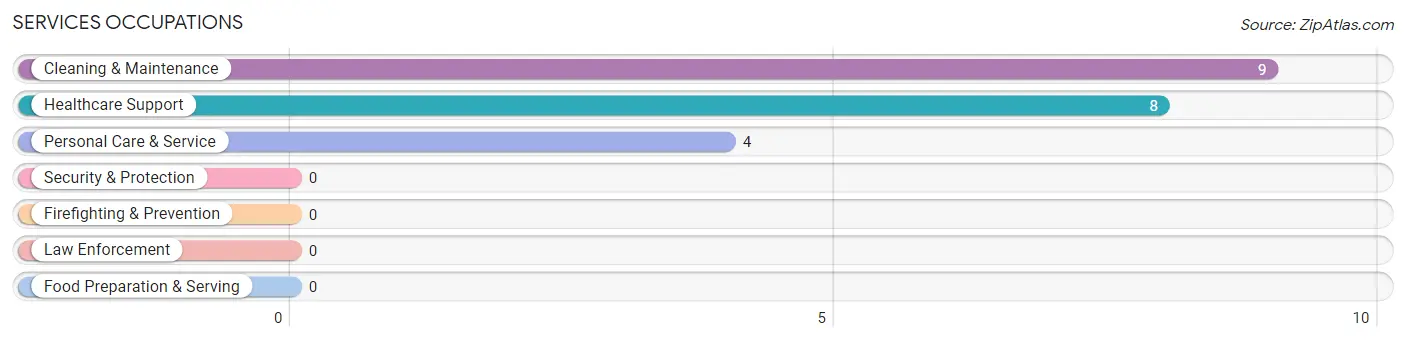
Services Occupations
The most common Services occupations in Prescott are Cleaning & Maintenance (9 | 7.0%), Healthcare Support (8 | 6.2%), and Personal Care & Service (4 | 3.1%).
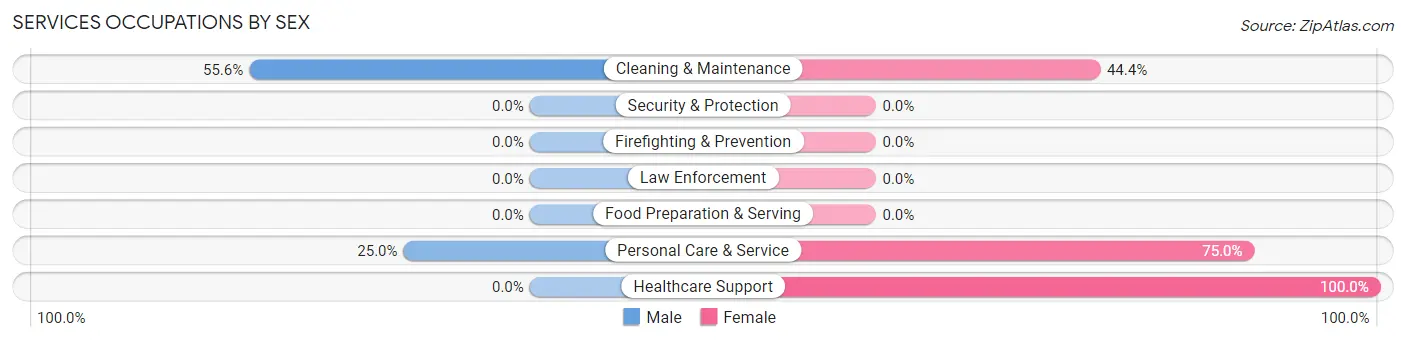
Services Occupations by Sex
Within the Services occupations in Prescott, the most male-oriented occupations are Cleaning & Maintenance (55.6%), and Personal Care & Service (25.0%), while the most female-oriented occupations are Healthcare Support (100.0%), Personal Care & Service (75.0%), and Cleaning & Maintenance (44.4%).
| Occupation | Male | Female |
| Healthcare Support | 0 (0.0%) | 8 (100.0%) |
| Security & Protection | 0 (0.0%) | 0 (0.0%) |
| Firefighting & Prevention | 0 (0.0%) | 0 (0.0%) |
| Law Enforcement | 0 (0.0%) | 0 (0.0%) |
| Food Preparation & Serving | 0 (0.0%) | 0 (0.0%) |
| Cleaning & Maintenance | 5 (55.6%) | 4 (44.4%) |
| Personal Care & Service | 1 (25.0%) | 3 (75.0%) |
| Total (Category) | 6 (28.6%) | 15 (71.4%) |
| Total (Overall) | 73 (56.6%) | 56 (43.4%) |
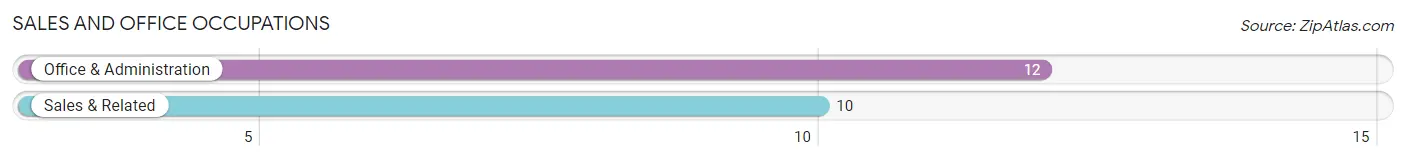
Sales and Office Occupations
The most common Sales and Office occupations in Prescott are Office & Administration (12 | 9.3%), and Sales & Related (10 | 7.7%).
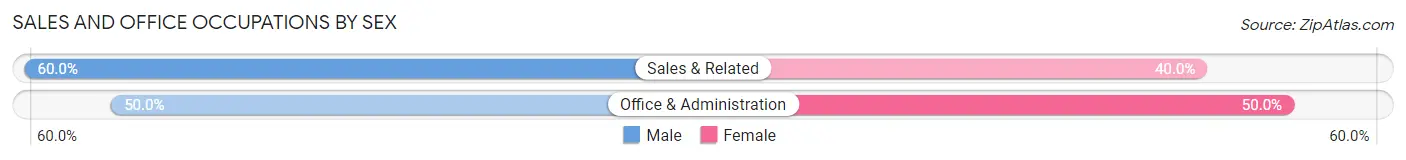
Sales and Office Occupations by Sex
| Occupation | Male | Female |
| Sales & Related | 6 (60.0%) | 4 (40.0%) |
| Office & Administration | 6 (50.0%) | 6 (50.0%) |
| Total (Category) | 12 (54.5%) | 10 (45.5%) |
| Total (Overall) | 73 (56.6%) | 56 (43.4%) |
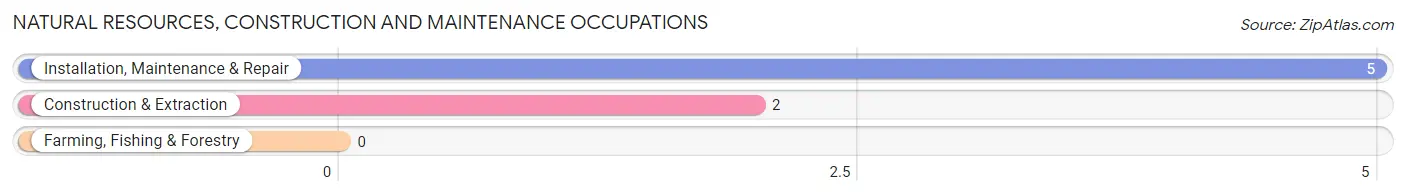
Natural Resources, Construction and Maintenance Occupations
The most common Natural Resources, Construction and Maintenance occupations in Prescott are Installation, Maintenance & Repair (5 | 3.9%), and Construction & Extraction (2 | 1.5%).
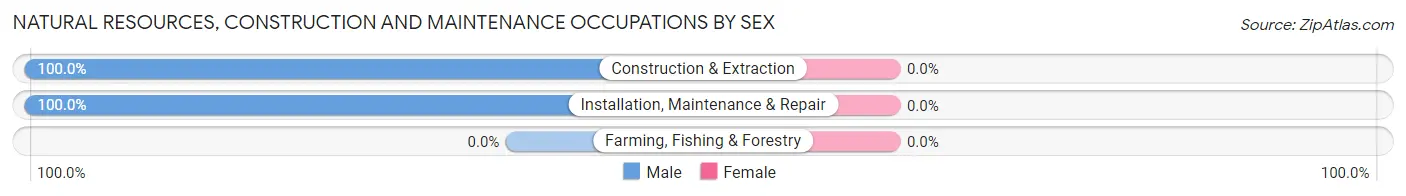
Natural Resources, Construction and Maintenance Occupations by Sex
| Occupation | Male | Female |
| Farming, Fishing & Forestry | 0 (0.0%) | 0 (0.0%) |
| Construction & Extraction | 2 (100.0%) | 0 (0.0%) |
| Installation, Maintenance & Repair | 5 (100.0%) | 0 (0.0%) |
| Total (Category) | 7 (100.0%) | 0 (0.0%) |
| Total (Overall) | 73 (56.6%) | 56 (43.4%) |
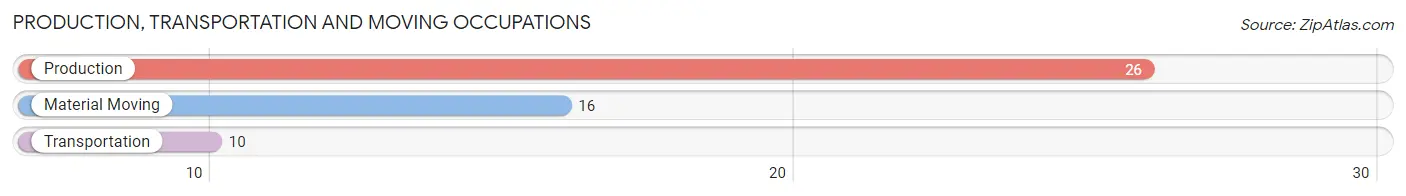
Production, Transportation and Moving Occupations
The most common Production, Transportation and Moving occupations in Prescott are Production (26 | 20.2%), Material Moving (16 | 12.4%), and Transportation (10 | 7.7%).
Production, Transportation and Moving Occupations by Sex
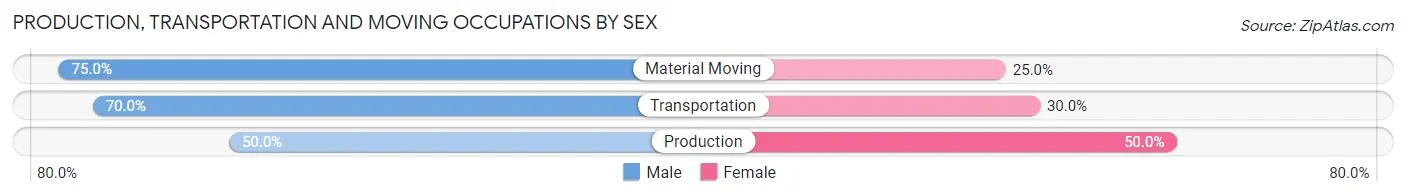
| Occupation | Male | Female |
| Production | 13 (50.0%) | 13 (50.0%) |
| Transportation | 7 (70.0%) | 3 (30.0%) |
| Material Moving | 12 (75.0%) | 4 (25.0%) |
| Total (Category) | 32 (61.5%) | 20 (38.5%) |
| Total (Overall) | 73 (56.6%) | 56 (43.4%) |
Employment Industries by Sex in Prescott
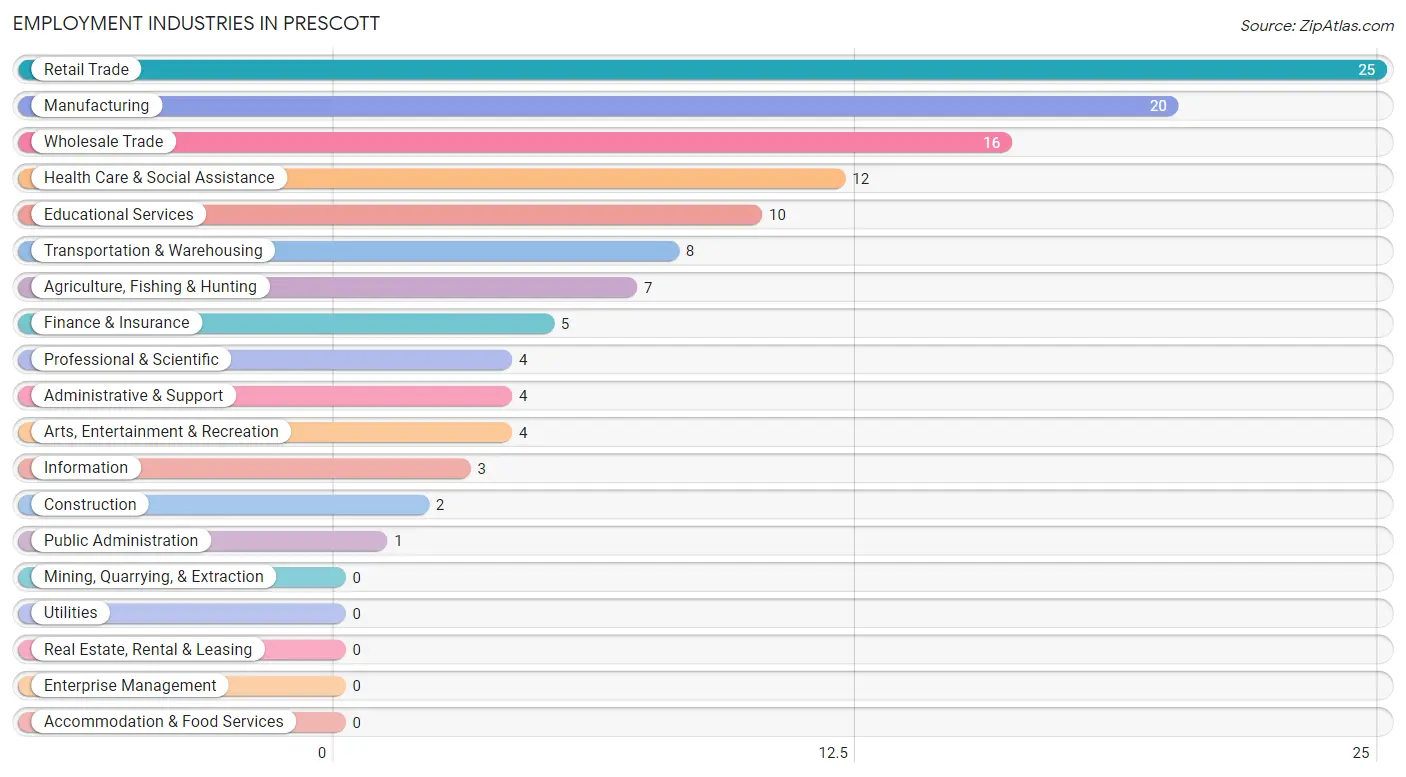
Employment Industries in Prescott
The major employment industries in Prescott include Retail Trade (25 | 19.4%), Manufacturing (20 | 15.5%), Wholesale Trade (16 | 12.4%), Health Care & Social Assistance (12 | 9.3%), and Educational Services (10 | 7.7%).
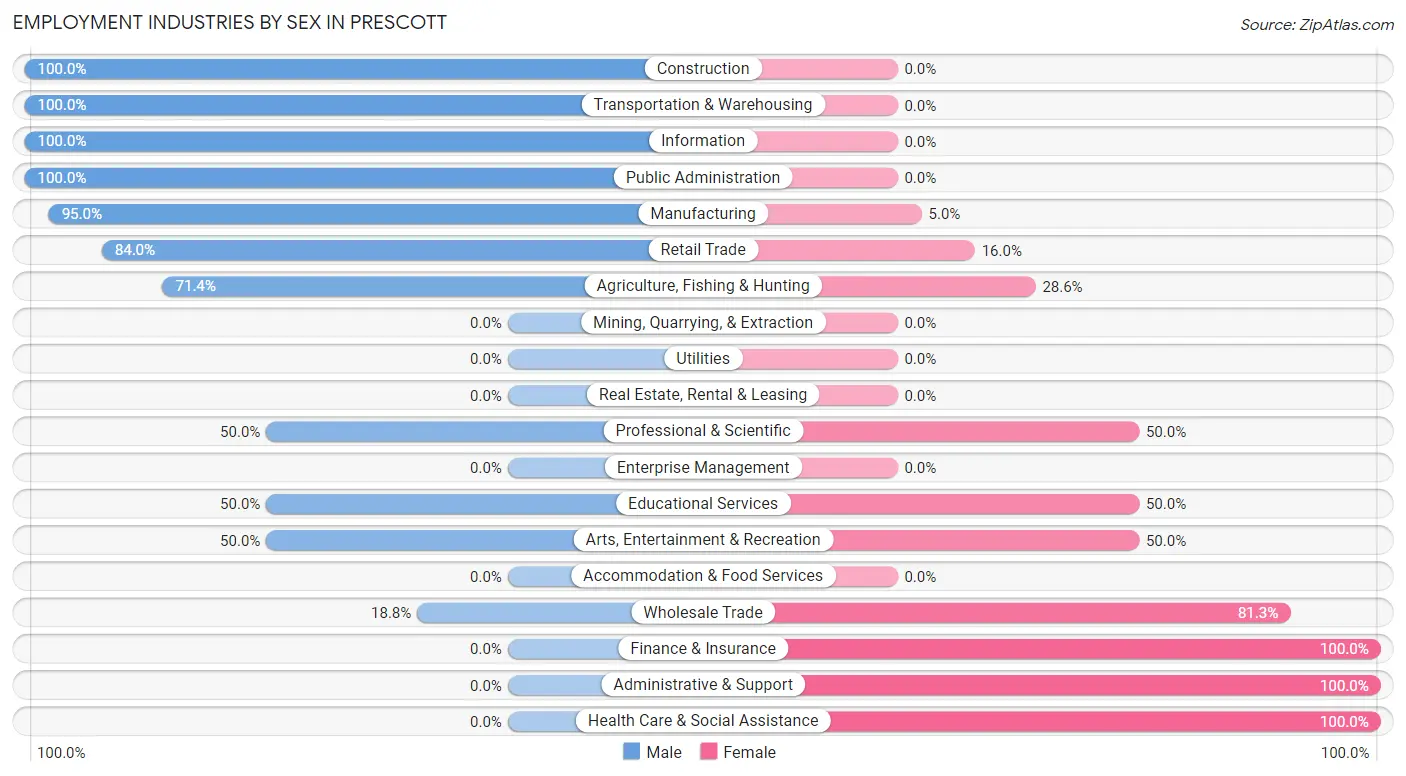
Employment Industries by Sex in Prescott
The Prescott industries that see more men than women are Construction (100.0%), Transportation & Warehousing (100.0%), and Information (100.0%), whereas the industries that tend to have a higher number of women are Finance & Insurance (100.0%), Administrative & Support (100.0%), and Health Care & Social Assistance (100.0%).
| Industry | Male | Female |
| Agriculture, Fishing & Hunting | 5 (71.4%) | 2 (28.6%) |
| Mining, Quarrying, & Extraction | 0 (0.0%) | 0 (0.0%) |
| Construction | 2 (100.0%) | 0 (0.0%) |
| Manufacturing | 19 (95.0%) | 1 (5.0%) |
| Wholesale Trade | 3 (18.8%) | 13 (81.2%) |
| Retail Trade | 21 (84.0%) | 4 (16.0%) |
| Transportation & Warehousing | 8 (100.0%) | 0 (0.0%) |
| Utilities | 0 (0.0%) | 0 (0.0%) |
| Information | 3 (100.0%) | 0 (0.0%) |
| Finance & Insurance | 0 (0.0%) | 5 (100.0%) |
| Real Estate, Rental & Leasing | 0 (0.0%) | 0 (0.0%) |
| Professional & Scientific | 2 (50.0%) | 2 (50.0%) |
| Enterprise Management | 0 (0.0%) | 0 (0.0%) |
| Administrative & Support | 0 (0.0%) | 4 (100.0%) |
| Educational Services | 5 (50.0%) | 5 (50.0%) |
| Health Care & Social Assistance | 0 (0.0%) | 12 (100.0%) |
| Arts, Entertainment & Recreation | 2 (50.0%) | 2 (50.0%) |
| Accommodation & Food Services | 0 (0.0%) | 0 (0.0%) |
| Public Administration | 1 (100.0%) | 0 (0.0%) |
| Total | 73 (56.6%) | 56 (43.4%) |
Education in Prescott
School Enrollment in Prescott
The most common levels of schooling among the 66 students in Prescott are middle school (22 | 33.3%), elementary school (18 | 27.3%), and high school (12 | 18.2%).
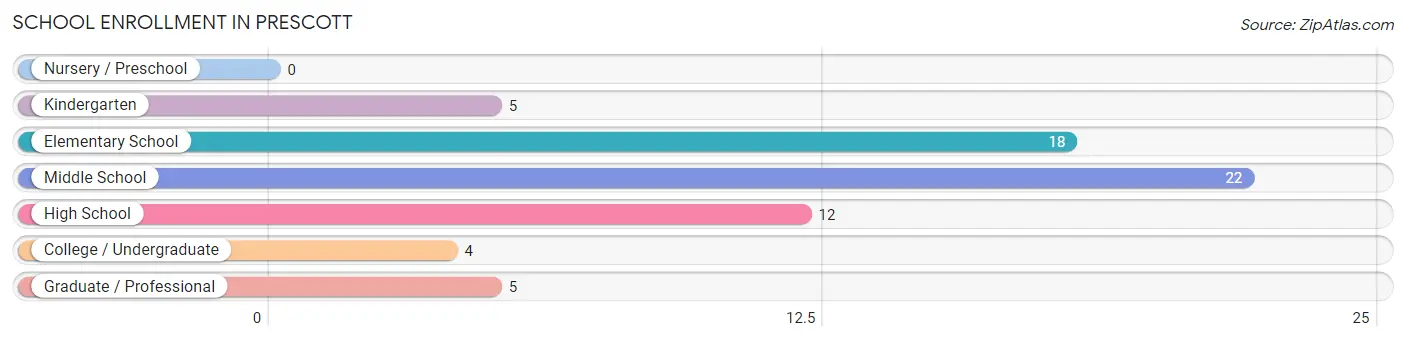
| School Level | # Students | % Students |
| Nursery / Preschool | 0 | 0.0% |
| Kindergarten | 5 | 7.6% |
| Elementary School | 18 | 27.3% |
| Middle School | 22 | 33.3% |
| High School | 12 | 18.2% |
| College / Undergraduate | 4 | 6.1% |
| Graduate / Professional | 5 | 7.6% |
| Total | 66 | 100.0% |
School Enrollment by Age by Funding Source in Prescott
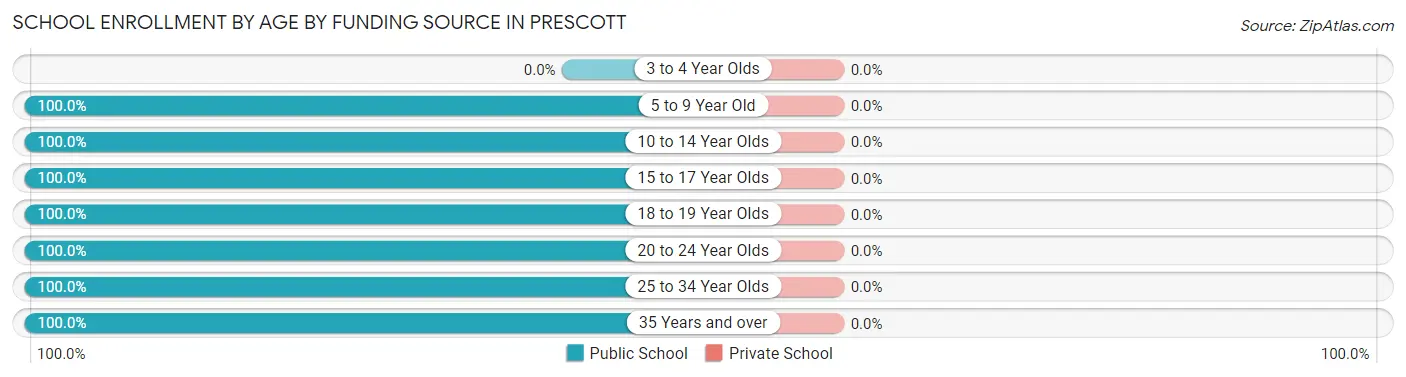
| Age Bracket | Public School | Private School |
| 3 to 4 Year Olds | 0 (0.0%) | 0 (0.0%) |
| 5 to 9 Year Old | 20 (100.0%) | 0 (0.0%) |
| 10 to 14 Year Olds | 28 (100.0%) | 0 (0.0%) |
| 15 to 17 Year Olds | 6 (100.0%) | 0 (0.0%) |
| 18 to 19 Year Olds | 3 (100.0%) | 0 (0.0%) |
| 20 to 24 Year Olds | 1 (100.0%) | 0 (0.0%) |
| 25 to 34 Year Olds | 3 (100.0%) | 0 (0.0%) |
| 35 Years and over | 5 (100.0%) | 0 (0.0%) |
| Total | 66 (100.0%) | 0 (0.0%) |
Educational Attainment by Field of Study in Prescott
Education (13 | 48.1%), business (6 | 22.2%), science & technology (3 | 11.1%), bio, nature & agricultural (2 | 7.4%), and psychology (1 | 3.7%) are the most common fields of study among 27 individuals in Prescott who have obtained a bachelor's degree or higher.
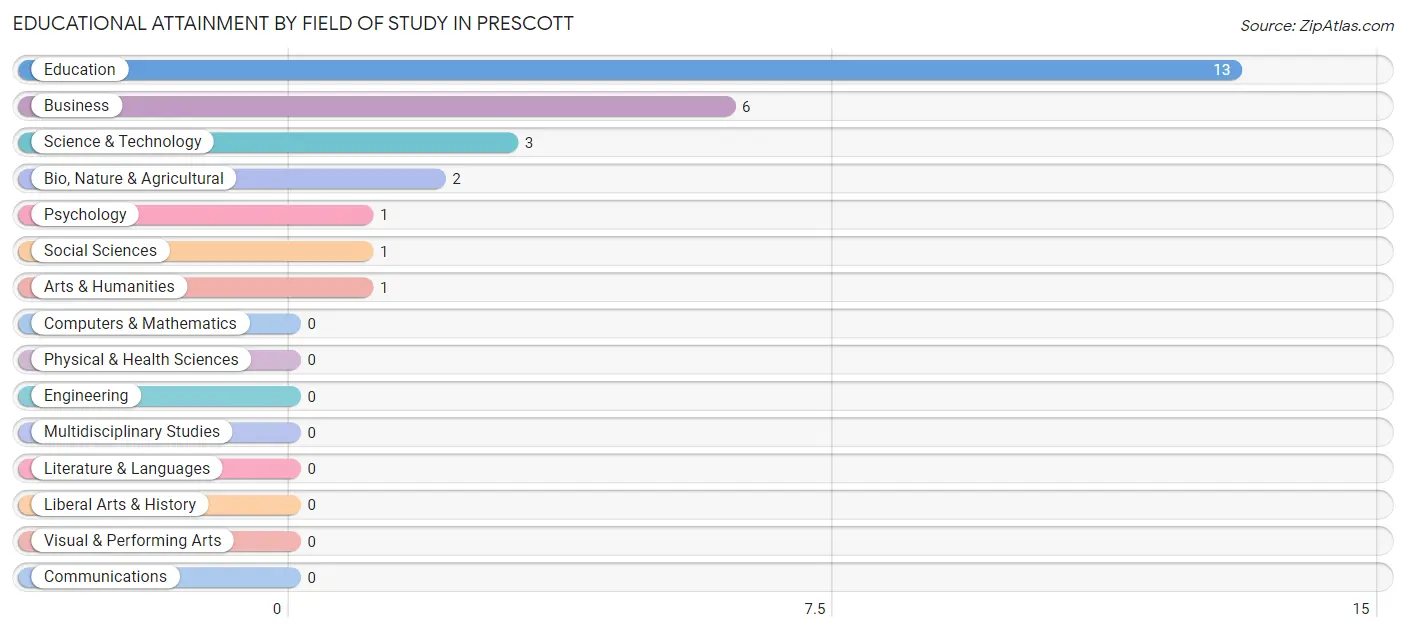
| Field of Study | # Graduates | % Graduates |
| Computers & Mathematics | 0 | 0.0% |
| Bio, Nature & Agricultural | 2 | 7.4% |
| Physical & Health Sciences | 0 | 0.0% |
| Psychology | 1 | 3.7% |
| Social Sciences | 1 | 3.7% |
| Engineering | 0 | 0.0% |
| Multidisciplinary Studies | 0 | 0.0% |
| Science & Technology | 3 | 11.1% |
| Business | 6 | 22.2% |
| Education | 13 | 48.1% |
| Literature & Languages | 0 | 0.0% |
| Liberal Arts & History | 0 | 0.0% |
| Visual & Performing Arts | 0 | 0.0% |
| Communications | 0 | 0.0% |
| Arts & Humanities | 1 | 3.7% |
| Total | 27 | 100.0% |
Transportation & Commute in Prescott
Vehicle Availability by Sex in Prescott
The most prevalent vehicle ownership categories in Prescott are males with 2 vehicles (28, accounting for 38.4%) and females with 2 vehicles (21, making up 50.0%).
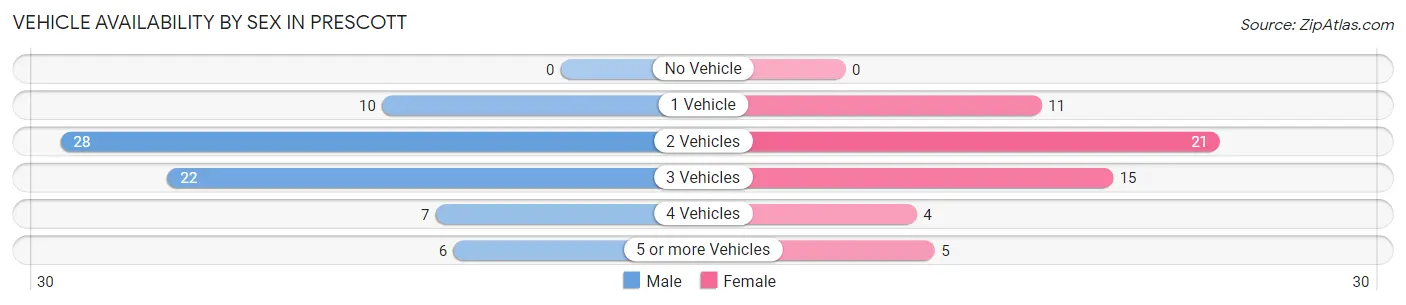
| Vehicles Available | Male | Female |
| No Vehicle | 0 (0.0%) | 0 (0.0%) |
| 1 Vehicle | 10 (13.7%) | 11 (19.6%) |
| 2 Vehicles | 28 (38.4%) | 21 (37.5%) |
| 3 Vehicles | 22 (30.1%) | 15 (26.8%) |
| 4 Vehicles | 7 (9.6%) | 4 (7.1%) |
| 5 or more Vehicles | 6 (8.2%) | 5 (8.9%) |
| Total | 73 (100.0%) | 56 (100.0%) |
Commute Time in Prescott
The most frequently occuring commute durations in Prescott are 25 to 29 minutes (26 commuters, 20.5%), 45 to 59 minutes (25 commuters, 19.7%), and 30 to 34 minutes (18 commuters, 14.2%).
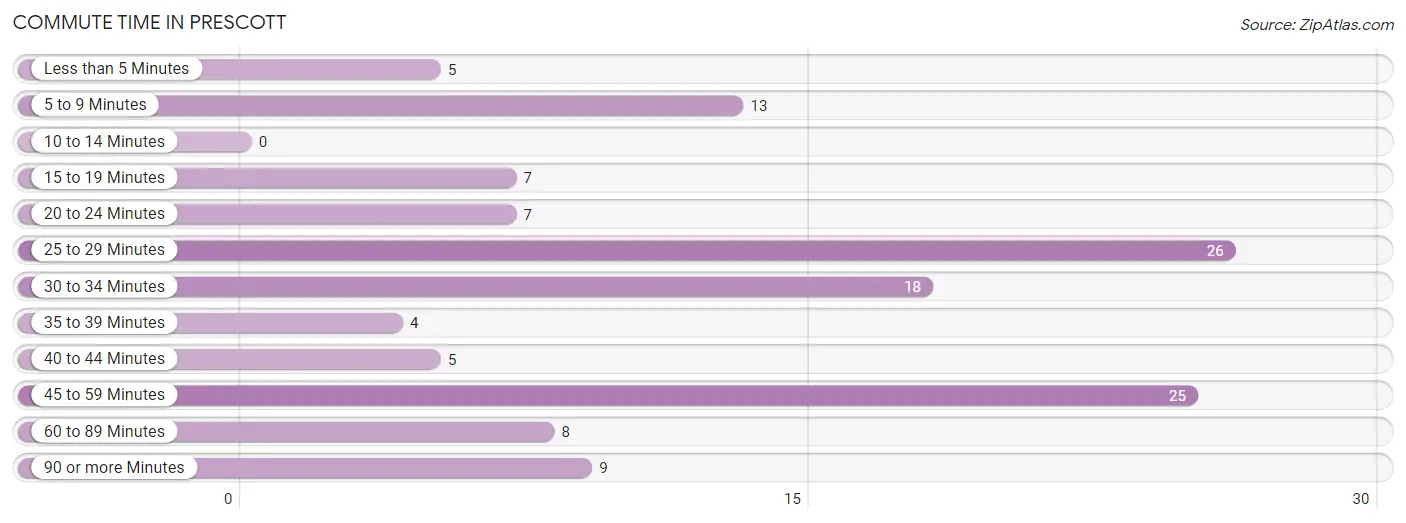
| Commute Time | # Commuters | % Commuters |
| Less than 5 Minutes | 5 | 3.9% |
| 5 to 9 Minutes | 13 | 10.2% |
| 10 to 14 Minutes | 0 | 0.0% |
| 15 to 19 Minutes | 7 | 5.5% |
| 20 to 24 Minutes | 7 | 5.5% |
| 25 to 29 Minutes | 26 | 20.5% |
| 30 to 34 Minutes | 18 | 14.2% |
| 35 to 39 Minutes | 4 | 3.2% |
| 40 to 44 Minutes | 5 | 3.9% |
| 45 to 59 Minutes | 25 | 19.7% |
| 60 to 89 Minutes | 8 | 6.3% |
| 90 or more Minutes | 9 | 7.1% |
Commute Time by Sex in Prescott
The most common commute times in Prescott are 25 to 29 minutes (17 commuters, 23.6%) for males and 45 to 59 minutes (14 commuters, 25.5%) for females.
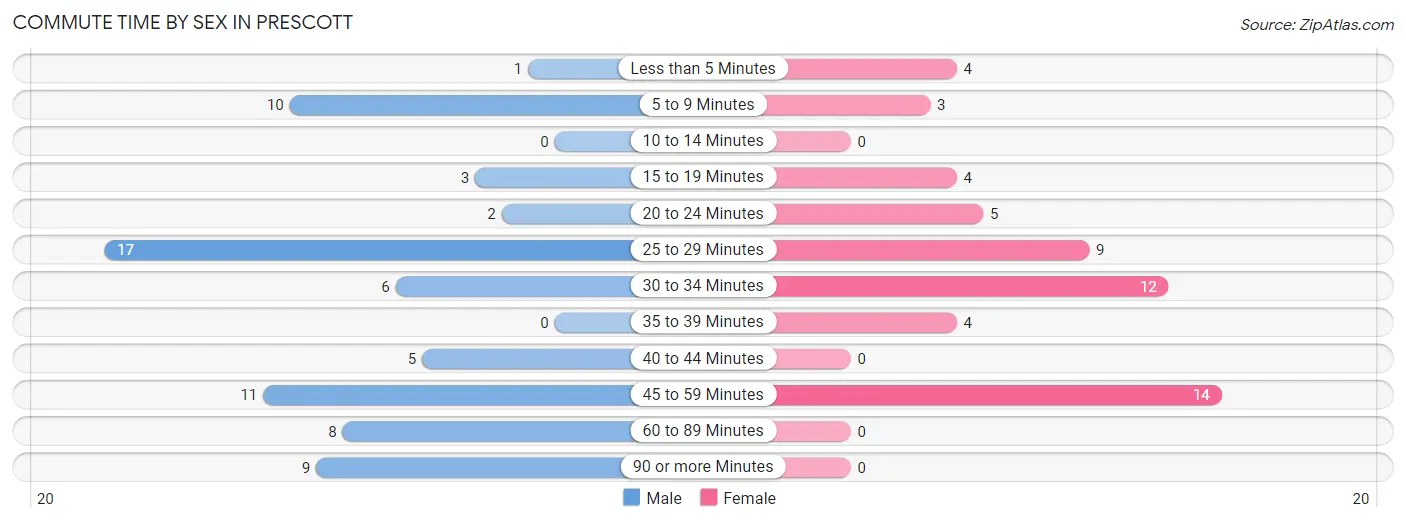
| Commute Time | Male | Female |
| Less than 5 Minutes | 1 (1.4%) | 4 (7.3%) |
| 5 to 9 Minutes | 10 (13.9%) | 3 (5.4%) |
| 10 to 14 Minutes | 0 (0.0%) | 0 (0.0%) |
| 15 to 19 Minutes | 3 (4.2%) | 4 (7.3%) |
| 20 to 24 Minutes | 2 (2.8%) | 5 (9.1%) |
| 25 to 29 Minutes | 17 (23.6%) | 9 (16.4%) |
| 30 to 34 Minutes | 6 (8.3%) | 12 (21.8%) |
| 35 to 39 Minutes | 0 (0.0%) | 4 (7.3%) |
| 40 to 44 Minutes | 5 (6.9%) | 0 (0.0%) |
| 45 to 59 Minutes | 11 (15.3%) | 14 (25.5%) |
| 60 to 89 Minutes | 8 (11.1%) | 0 (0.0%) |
| 90 or more Minutes | 9 (12.5%) | 0 (0.0%) |
Time of Departure to Work by Sex in Prescott
The most frequent times of departure to work in Prescott are 5:00 AM to 5:29 AM (23, 31.9%) for males and 6:00 AM to 6:29 AM (17, 30.9%) for females.
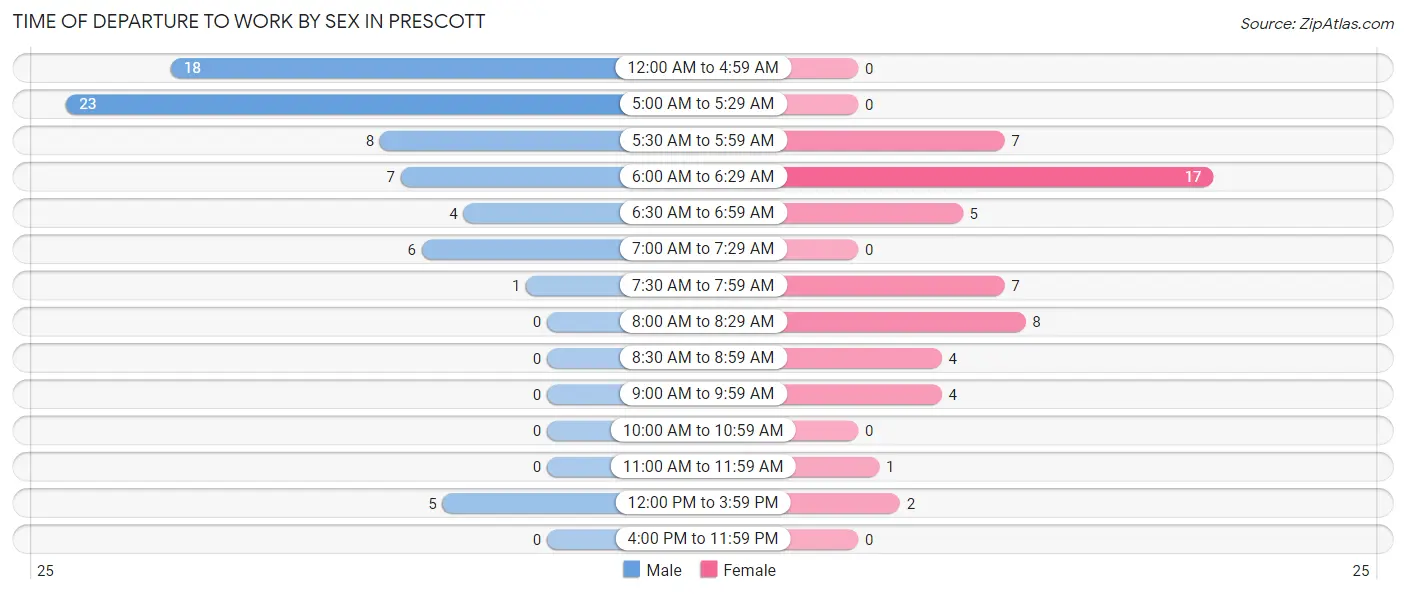
| Time of Departure | Male | Female |
| 12:00 AM to 4:59 AM | 18 (25.0%) | 0 (0.0%) |
| 5:00 AM to 5:29 AM | 23 (31.9%) | 0 (0.0%) |
| 5:30 AM to 5:59 AM | 8 (11.1%) | 7 (12.7%) |
| 6:00 AM to 6:29 AM | 7 (9.7%) | 17 (30.9%) |
| 6:30 AM to 6:59 AM | 4 (5.6%) | 5 (9.1%) |
| 7:00 AM to 7:29 AM | 6 (8.3%) | 0 (0.0%) |
| 7:30 AM to 7:59 AM | 1 (1.4%) | 7 (12.7%) |
| 8:00 AM to 8:29 AM | 0 (0.0%) | 8 (14.5%) |
| 8:30 AM to 8:59 AM | 0 (0.0%) | 4 (7.3%) |
| 9:00 AM to 9:59 AM | 0 (0.0%) | 4 (7.3%) |
| 10:00 AM to 10:59 AM | 0 (0.0%) | 0 (0.0%) |
| 11:00 AM to 11:59 AM | 0 (0.0%) | 1 (1.8%) |
| 12:00 PM to 3:59 PM | 5 (6.9%) | 2 (3.6%) |
| 4:00 PM to 11:59 PM | 0 (0.0%) | 0 (0.0%) |
| Total | 72 (100.0%) | 55 (100.0%) |
Housing Occupancy in Prescott
Occupancy by Ownership in Prescott
Of the total 107 dwellings in Prescott, owner-occupied units account for 85 (79.4%), while renter-occupied units make up 22 (20.6%).
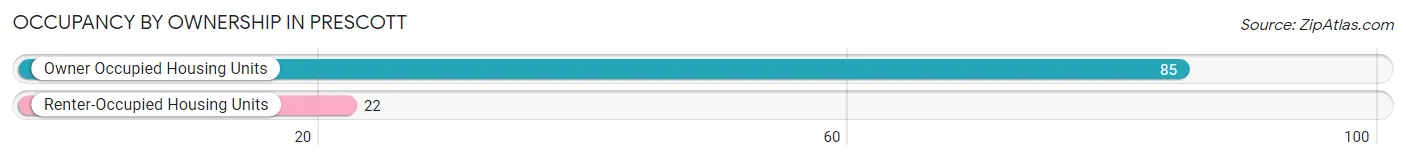
| Occupancy | # Housing Units | % Housing Units |
| Owner Occupied Housing Units | 85 | 79.4% |
| Renter-Occupied Housing Units | 22 | 20.6% |
| Total Occupied Housing Units | 107 | 100.0% |
Occupancy by Household Size in Prescott
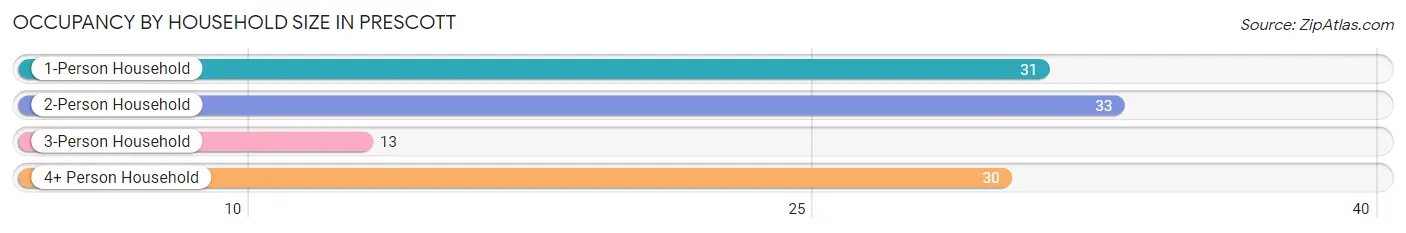
| Household Size | # Housing Units | % Housing Units |
| 1-Person Household | 31 | 29.0% |
| 2-Person Household | 33 | 30.8% |
| 3-Person Household | 13 | 12.1% |
| 4+ Person Household | 30 | 28.0% |
| Total Housing Units | 107 | 100.0% |
Occupancy by Ownership by Household Size in Prescott
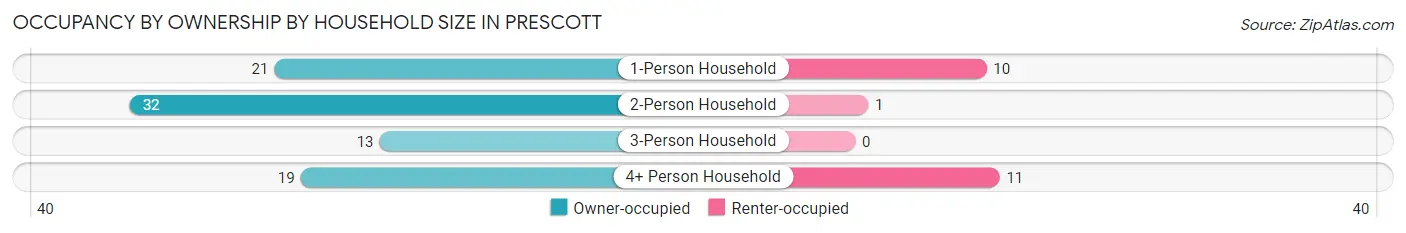
| Household Size | Owner-occupied | Renter-occupied |
| 1-Person Household | 21 (67.7%) | 10 (32.3%) |
| 2-Person Household | 32 (97.0%) | 1 (3.0%) |
| 3-Person Household | 13 (100.0%) | 0 (0.0%) |
| 4+ Person Household | 19 (63.3%) | 11 (36.7%) |
| Total Housing Units | 85 (79.4%) | 22 (20.6%) |
Occupancy by Educational Attainment in Prescott
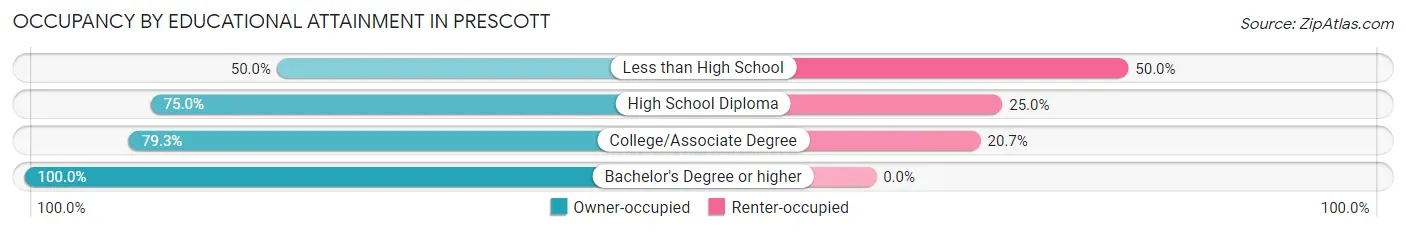
| Household Size | Owner-occupied | Renter-occupied |
| Less than High School | 1 (50.0%) | 1 (50.0%) |
| High School Diploma | 27 (75.0%) | 9 (25.0%) |
| College/Associate Degree | 46 (79.3%) | 12 (20.7%) |
| Bachelor's Degree or higher | 11 (100.0%) | 0 (0.0%) |
Occupancy by Age of Householder in Prescott
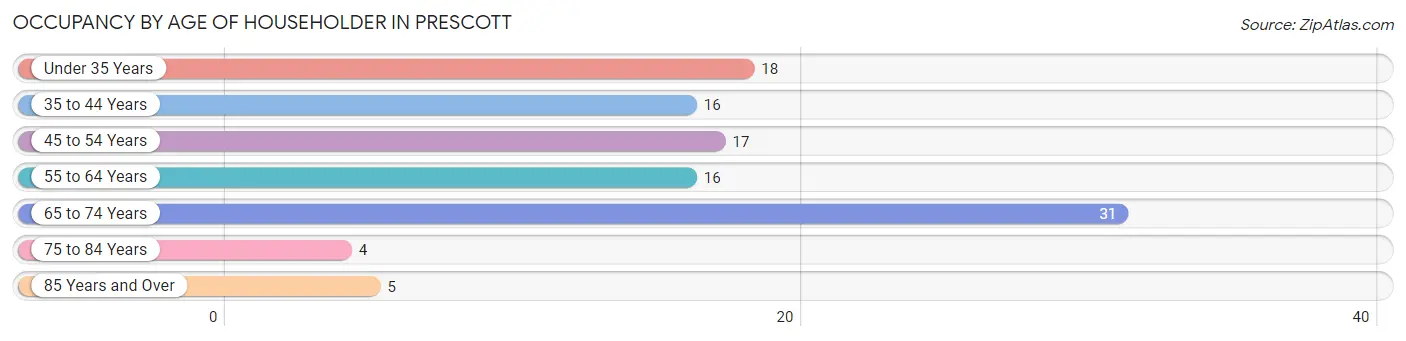
| Age Bracket | # Households | % Households |
| Under 35 Years | 18 | 16.8% |
| 35 to 44 Years | 16 | 14.9% |
| 45 to 54 Years | 17 | 15.9% |
| 55 to 64 Years | 16 | 14.9% |
| 65 to 74 Years | 31 | 29.0% |
| 75 to 84 Years | 4 | 3.7% |
| 85 Years and Over | 5 | 4.7% |
| Total | 107 | 100.0% |
Housing Finances in Prescott
Median Income by Occupancy in Prescott
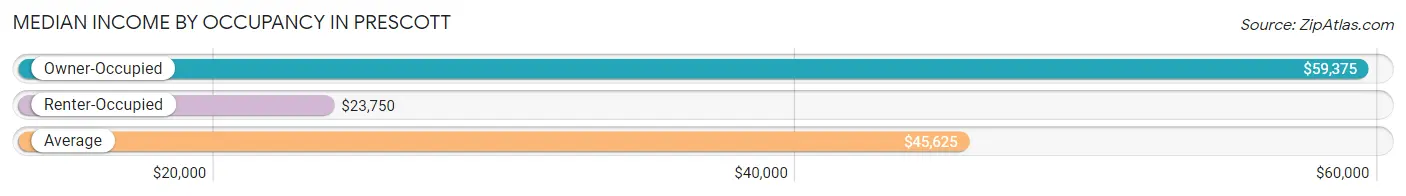
| Occupancy Type | # Households | Median Income |
| Owner-Occupied | 85 (79.4%) | $59,375 |
| Renter-Occupied | 22 (20.6%) | $23,750 |
| Average | 107 (100.0%) | $45,625 |
Occupancy by Householder Income Bracket in Prescott
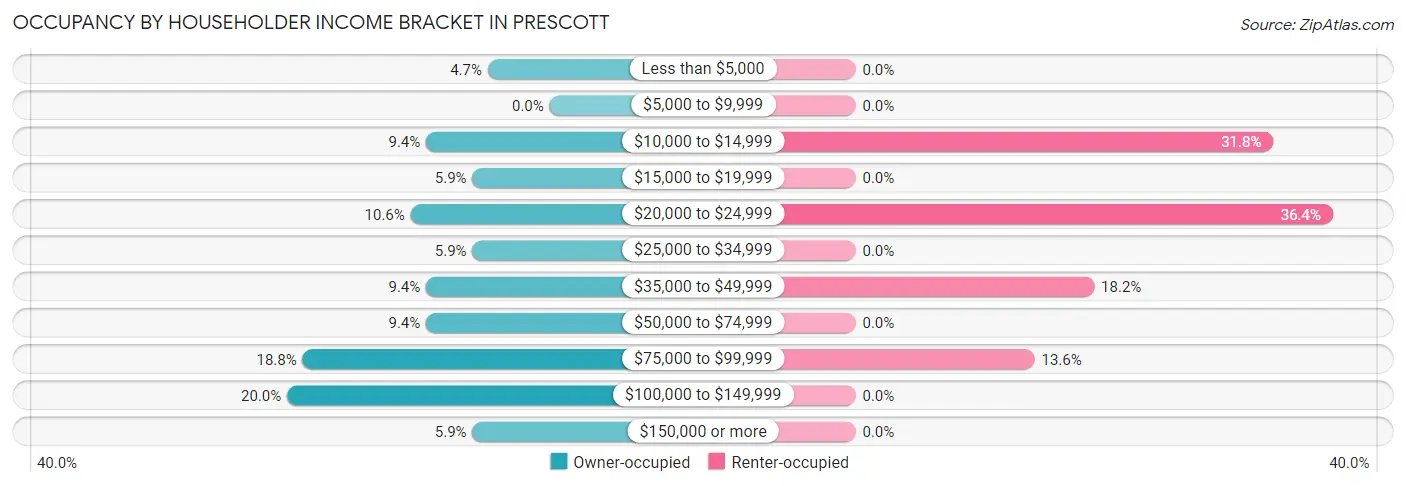
| Income Bracket | Owner-occupied | Renter-occupied |
| Less than $5,000 | 4 (4.7%) | 0 (0.0%) |
| $5,000 to $9,999 | 0 (0.0%) | 0 (0.0%) |
| $10,000 to $14,999 | 8 (9.4%) | 7 (31.8%) |
| $15,000 to $19,999 | 5 (5.9%) | 0 (0.0%) |
| $20,000 to $24,999 | 9 (10.6%) | 8 (36.4%) |
| $25,000 to $34,999 | 5 (5.9%) | 0 (0.0%) |
| $35,000 to $49,999 | 8 (9.4%) | 4 (18.2%) |
| $50,000 to $74,999 | 8 (9.4%) | 0 (0.0%) |
| $75,000 to $99,999 | 16 (18.8%) | 3 (13.6%) |
| $100,000 to $149,999 | 17 (20.0%) | 0 (0.0%) |
| $150,000 or more | 5 (5.9%) | 0 (0.0%) |
| Total | 85 (100.0%) | 22 (100.0%) |
Monthly Housing Cost Tiers in Prescott
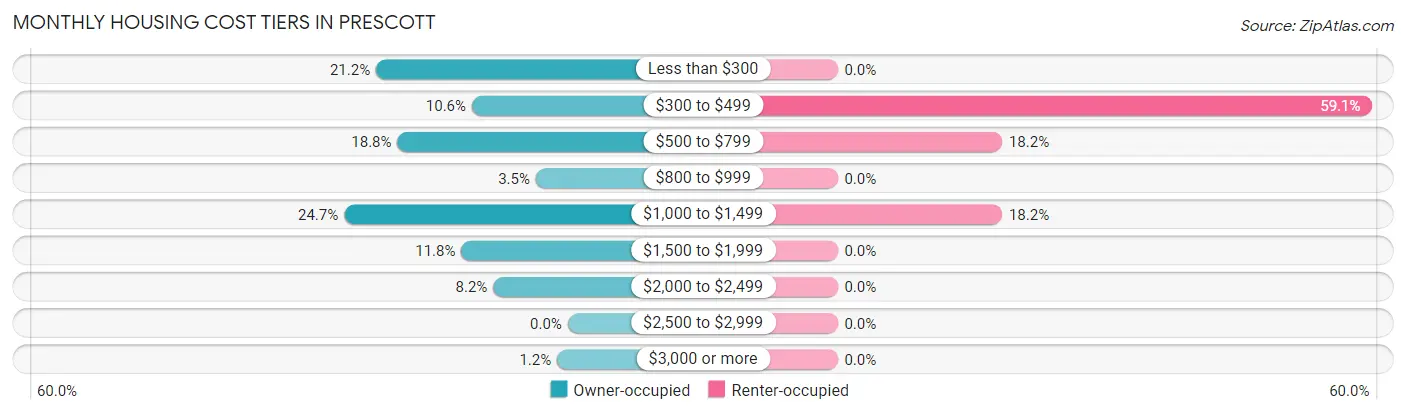
| Monthly Cost | Owner-occupied | Renter-occupied |
| Less than $300 | 18 (21.2%) | 0 (0.0%) |
| $300 to $499 | 9 (10.6%) | 13 (59.1%) |
| $500 to $799 | 16 (18.8%) | 4 (18.2%) |
| $800 to $999 | 3 (3.5%) | 0 (0.0%) |
| $1,000 to $1,499 | 21 (24.7%) | 4 (18.2%) |
| $1,500 to $1,999 | 10 (11.8%) | 0 (0.0%) |
| $2,000 to $2,499 | 7 (8.2%) | 0 (0.0%) |
| $2,500 to $2,999 | 0 (0.0%) | 0 (0.0%) |
| $3,000 or more | 1 (1.2%) | 0 (0.0%) |
| Total | 85 (100.0%) | 22 (100.0%) |
Physical Housing Characteristics in Prescott
Housing Structures in Prescott
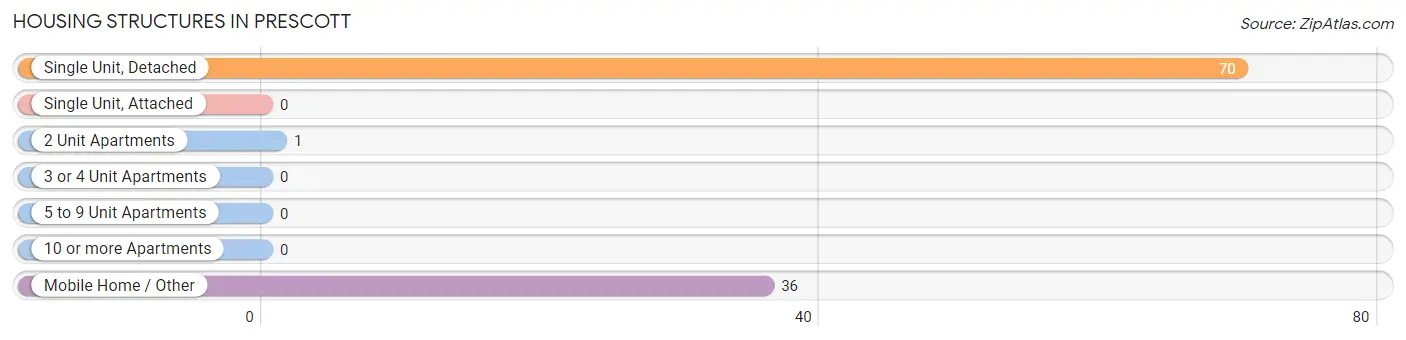
| Structure Type | # Housing Units | % Housing Units |
| Single Unit, Detached | 70 | 65.4% |
| Single Unit, Attached | 0 | 0.0% |
| 2 Unit Apartments | 1 | 0.9% |
| 3 or 4 Unit Apartments | 0 | 0.0% |
| 5 to 9 Unit Apartments | 0 | 0.0% |
| 10 or more Apartments | 0 | 0.0% |
| Mobile Home / Other | 36 | 33.6% |
| Total | 107 | 100.0% |
Housing Structures by Occupancy in Prescott
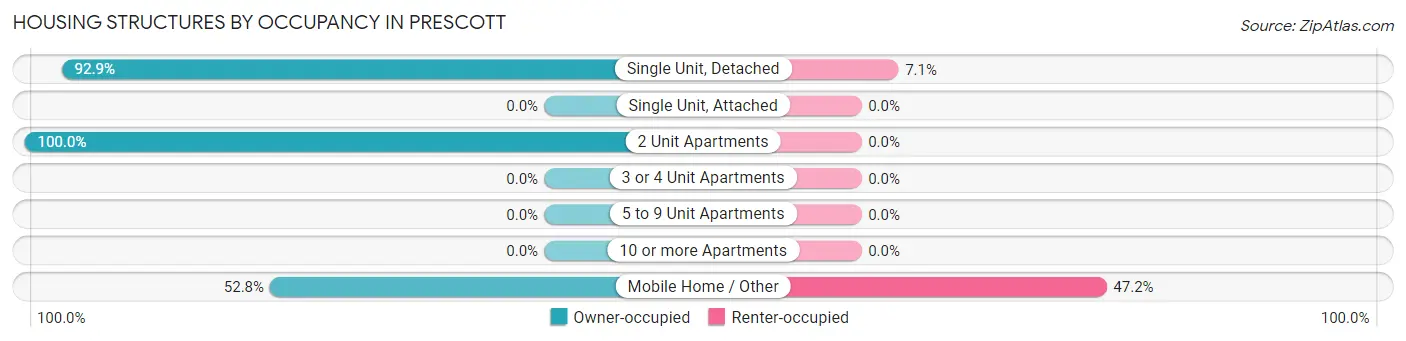
| Structure Type | Owner-occupied | Renter-occupied |
| Single Unit, Detached | 65 (92.9%) | 5 (7.1%) |
| Single Unit, Attached | 0 (0.0%) | 0 (0.0%) |
| 2 Unit Apartments | 1 (100.0%) | 0 (0.0%) |
| 3 or 4 Unit Apartments | 0 (0.0%) | 0 (0.0%) |
| 5 to 9 Unit Apartments | 0 (0.0%) | 0 (0.0%) |
| 10 or more Apartments | 0 (0.0%) | 0 (0.0%) |
| Mobile Home / Other | 19 (52.8%) | 17 (47.2%) |
| Total | 85 (79.4%) | 22 (20.6%) |
Housing Structures by Number of Rooms in Prescott
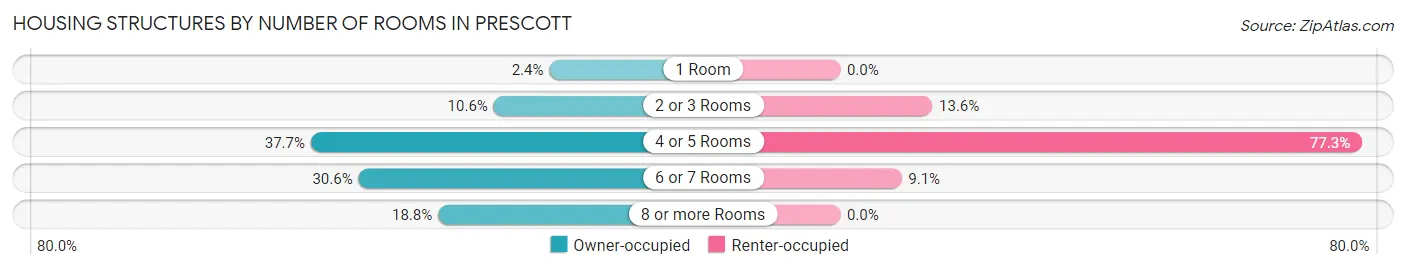
| Number of Rooms | Owner-occupied | Renter-occupied |
| 1 Room | 2 (2.4%) | 0 (0.0%) |
| 2 or 3 Rooms | 9 (10.6%) | 3 (13.6%) |
| 4 or 5 Rooms | 32 (37.7%) | 17 (77.3%) |
| 6 or 7 Rooms | 26 (30.6%) | 2 (9.1%) |
| 8 or more Rooms | 16 (18.8%) | 0 (0.0%) |
| Total | 85 (100.0%) | 22 (100.0%) |
Housing Structure by Heating Type in Prescott
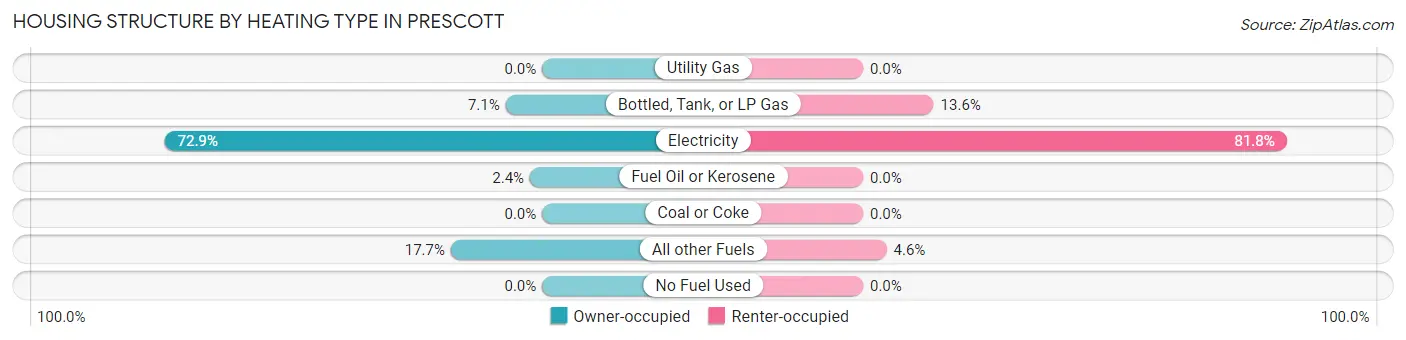
| Heating Type | Owner-occupied | Renter-occupied |
| Utility Gas | 0 (0.0%) | 0 (0.0%) |
| Bottled, Tank, or LP Gas | 6 (7.1%) | 3 (13.6%) |
| Electricity | 62 (72.9%) | 18 (81.8%) |
| Fuel Oil or Kerosene | 2 (2.4%) | 0 (0.0%) |
| Coal or Coke | 0 (0.0%) | 0 (0.0%) |
| All other Fuels | 15 (17.6%) | 1 (4.5%) |
| No Fuel Used | 0 (0.0%) | 0 (0.0%) |
| Total | 85 (100.0%) | 22 (100.0%) |
Household Vehicle Usage in Prescott
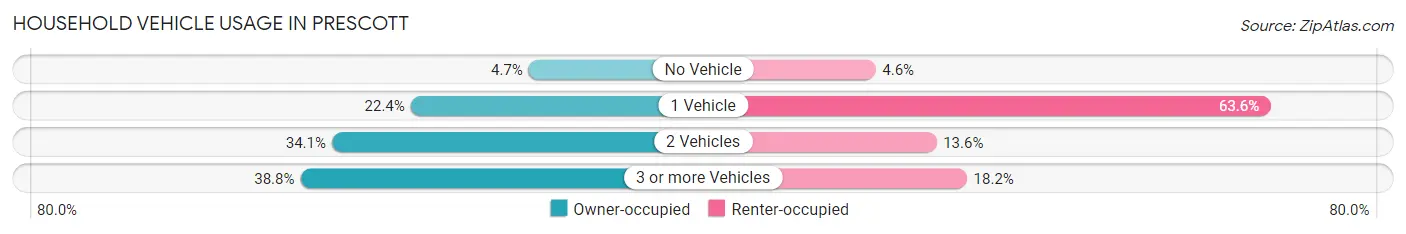
| Vehicles per Household | Owner-occupied | Renter-occupied |
| No Vehicle | 4 (4.7%) | 1 (4.5%) |
| 1 Vehicle | 19 (22.4%) | 14 (63.6%) |
| 2 Vehicles | 29 (34.1%) | 3 (13.6%) |
| 3 or more Vehicles | 33 (38.8%) | 4 (18.2%) |
| Total | 85 (100.0%) | 22 (100.0%) |
Real Estate & Mortgages in Prescott
Real Estate and Mortgage Overview in Prescott
| Characteristic | Without Mortgage | With Mortgage |
| Housing Units | 32 | 53 |
| Median Property Value | - | - |
| Median Household Income | $29,000 | $4 |
| Monthly Housing Costs | $280 | $0 |
| Real Estate Taxes | $1,750 | $0 |
Property Value by Mortgage Status in Prescott
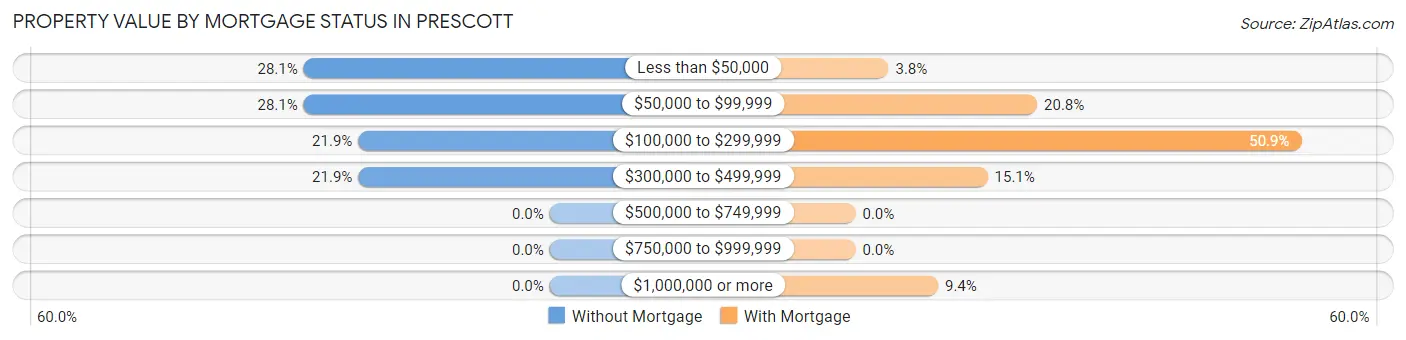
| Property Value | Without Mortgage | With Mortgage |
| Less than $50,000 | 9 (28.1%) | 2 (3.8%) |
| $50,000 to $99,999 | 9 (28.1%) | 11 (20.7%) |
| $100,000 to $299,999 | 7 (21.9%) | 27 (50.9%) |
| $300,000 to $499,999 | 7 (21.9%) | 8 (15.1%) |
| $500,000 to $749,999 | 0 (0.0%) | 0 (0.0%) |
| $750,000 to $999,999 | 0 (0.0%) | 0 (0.0%) |
| $1,000,000 or more | 0 (0.0%) | 5 (9.4%) |
| Total | 32 (100.0%) | 53 (100.0%) |
Household Income by Mortgage Status in Prescott
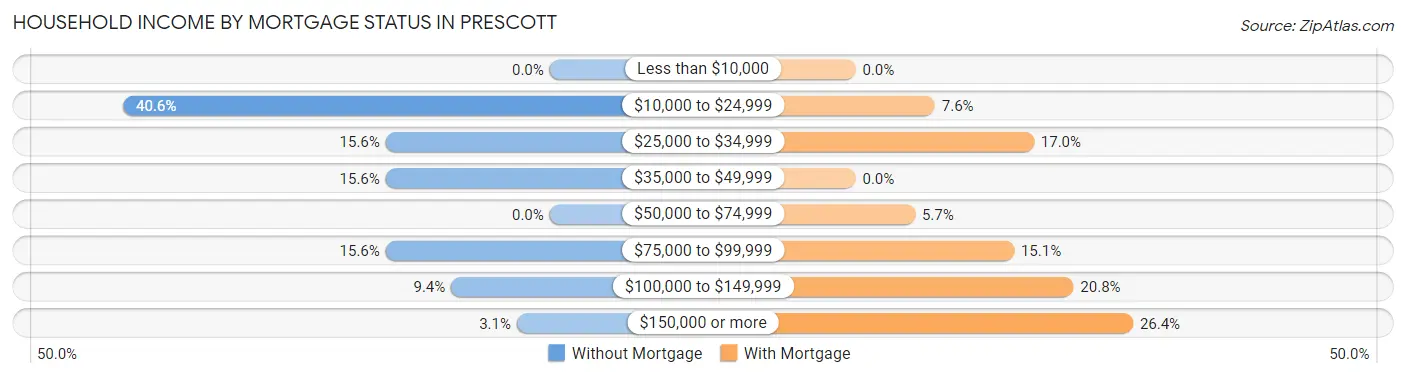
| Household Income | Without Mortgage | With Mortgage |
| Less than $10,000 | 0 (0.0%) | 0 (0.0%) |
| $10,000 to $24,999 | 13 (40.6%) | 4 (7.5%) |
| $25,000 to $34,999 | 5 (15.6%) | 9 (17.0%) |
| $35,000 to $49,999 | 5 (15.6%) | 0 (0.0%) |
| $50,000 to $74,999 | 0 (0.0%) | 3 (5.7%) |
| $75,000 to $99,999 | 5 (15.6%) | 8 (15.1%) |
| $100,000 to $149,999 | 3 (9.4%) | 11 (20.7%) |
| $150,000 or more | 1 (3.1%) | 14 (26.4%) |
| Total | 32 (100.0%) | 53 (100.0%) |
Property Value to Household Income Ratio in Prescott
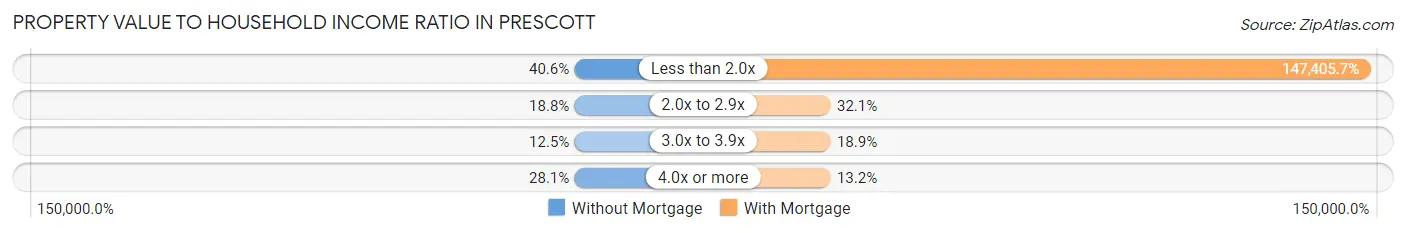
| Value-to-Income Ratio | Without Mortgage | With Mortgage |
| Less than 2.0x | 13 (40.6%) | 78,125 (147,405.7%) |
| 2.0x to 2.9x | 6 (18.8%) | 17 (32.1%) |
| 3.0x to 3.9x | 4 (12.5%) | 10 (18.9%) |
| 4.0x or more | 9 (28.1%) | 7 (13.2%) |
| Total | 32 (100.0%) | 53 (100.0%) |
Real Estate Taxes by Mortgage Status in Prescott
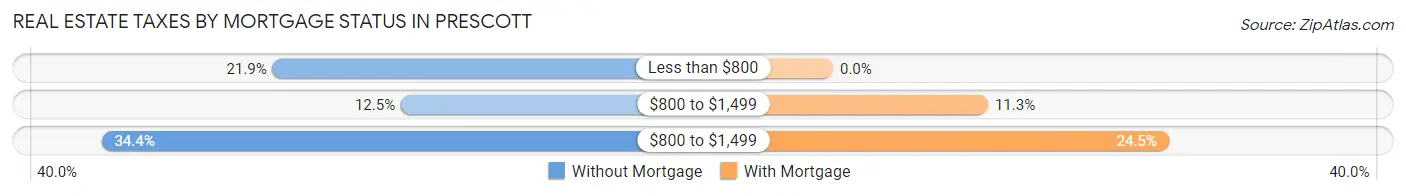
| Property Taxes | Without Mortgage | With Mortgage |
| Less than $800 | 7 (21.9%) | 0 (0.0%) |
| $800 to $1,499 | 4 (12.5%) | 6 (11.3%) |
| $800 to $1,499 | 11 (34.4%) | 13 (24.5%) |
| Total | 32 (100.0%) | 53 (100.0%) |
Health & Disability in Prescott
Health Insurance Coverage by Age in Prescott
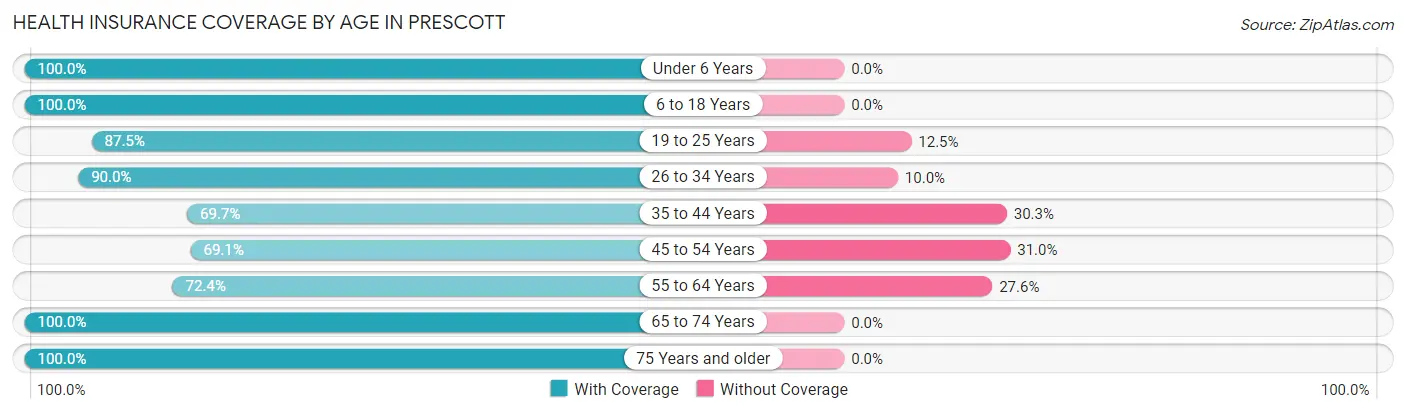
| Age Bracket | With Coverage | Without Coverage |
| Under 6 Years | 30 (100.0%) | 0 (0.0%) |
| 6 to 18 Years | 57 (100.0%) | 0 (0.0%) |
| 19 to 25 Years | 21 (87.5%) | 3 (12.5%) |
| 26 to 34 Years | 27 (90.0%) | 3 (10.0%) |
| 35 to 44 Years | 23 (69.7%) | 10 (30.3%) |
| 45 to 54 Years | 29 (69.1%) | 13 (30.9%) |
| 55 to 64 Years | 21 (72.4%) | 8 (27.6%) |
| 65 to 74 Years | 40 (100.0%) | 0 (0.0%) |
| 75 Years and older | 18 (100.0%) | 0 (0.0%) |
| Total | 266 (87.8%) | 37 (12.2%) |
Health Insurance Coverage by Citizenship Status in Prescott
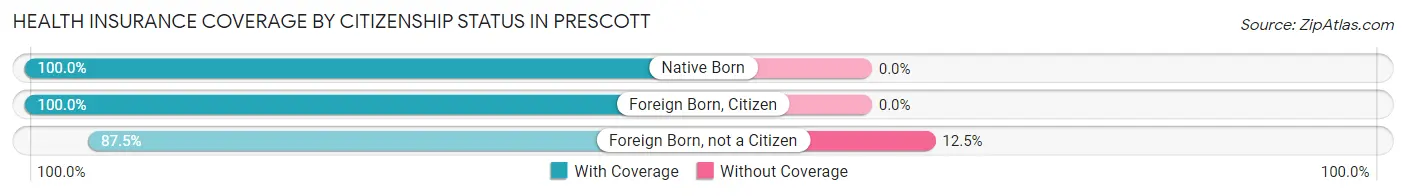
| Citizenship Status | With Coverage | Without Coverage |
| Native Born | 30 (100.0%) | 0 (0.0%) |
| Foreign Born, Citizen | 57 (100.0%) | 0 (0.0%) |
| Foreign Born, not a Citizen | 21 (87.5%) | 3 (12.5%) |
Health Insurance Coverage by Household Income in Prescott
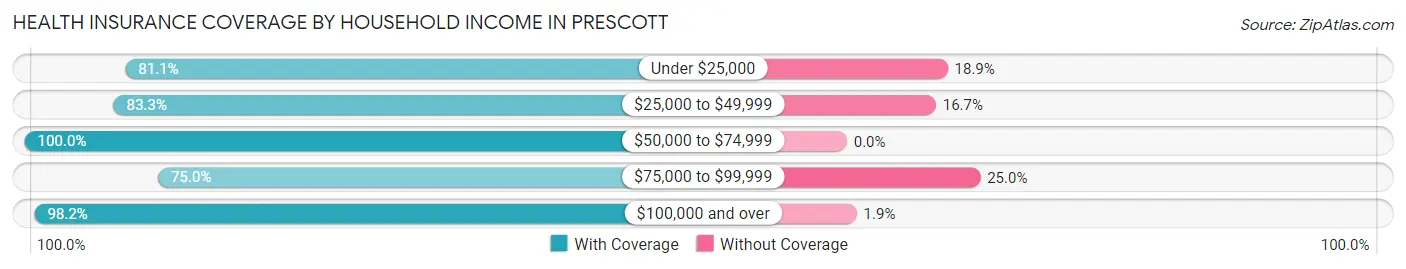
| Household Income | With Coverage | Without Coverage |
| Under $25,000 | 73 (81.1%) | 17 (18.9%) |
| $25,000 to $49,999 | 20 (83.3%) | 4 (16.7%) |
| $50,000 to $74,999 | 25 (100.0%) | 0 (0.0%) |
| $75,000 to $99,999 | 42 (75.0%) | 14 (25.0%) |
| $100,000 and over | 106 (98.2%) | 2 (1.8%) |
Public vs Private Health Insurance Coverage by Age in Prescott
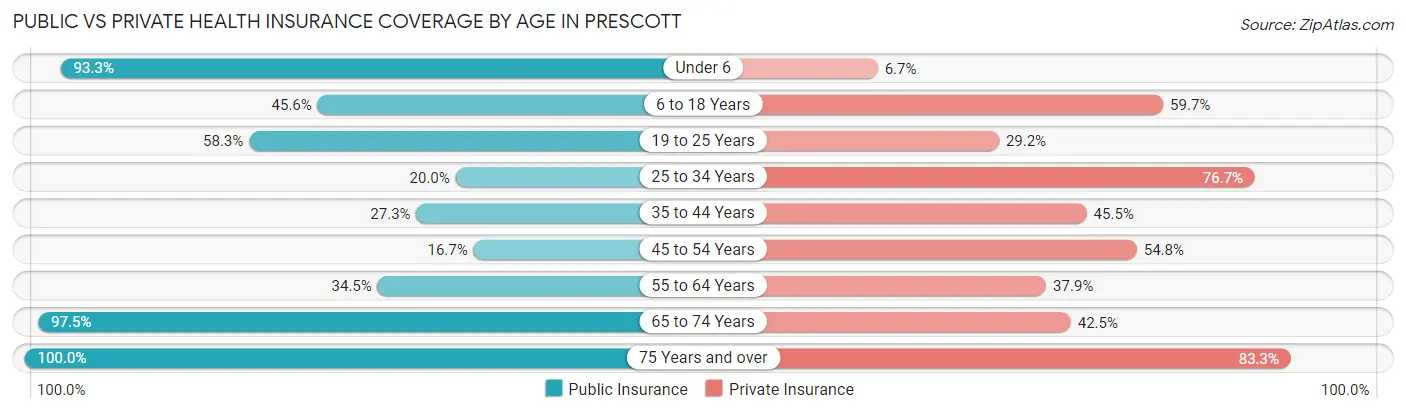
| Age Bracket | Public Insurance | Private Insurance |
| Under 6 | 28 (93.3%) | 2 (6.7%) |
| 6 to 18 Years | 26 (45.6%) | 34 (59.7%) |
| 19 to 25 Years | 14 (58.3%) | 7 (29.2%) |
| 25 to 34 Years | 6 (20.0%) | 23 (76.7%) |
| 35 to 44 Years | 9 (27.3%) | 15 (45.5%) |
| 45 to 54 Years | 7 (16.7%) | 23 (54.8%) |
| 55 to 64 Years | 10 (34.5%) | 11 (37.9%) |
| 65 to 74 Years | 39 (97.5%) | 17 (42.5%) |
| 75 Years and over | 18 (100.0%) | 15 (83.3%) |
| Total | 157 (51.8%) | 147 (48.5%) |
Disability Status by Sex by Age in Prescott
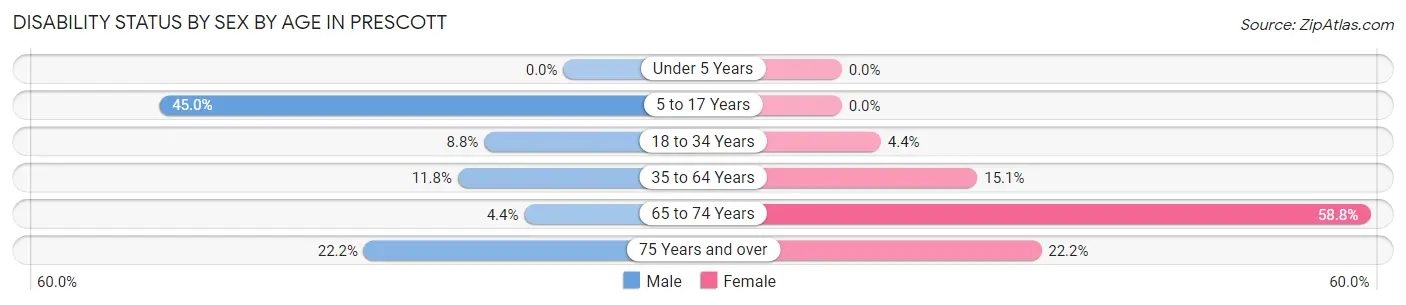
| Age Bracket | Male | Female |
| Under 5 Years | 0 (0.0%) | 0 (0.0%) |
| 5 to 17 Years | 18 (45.0%) | 0 (0.0%) |
| 18 to 34 Years | 3 (8.8%) | 1 (4.3%) |
| 35 to 64 Years | 6 (11.8%) | 8 (15.1%) |
| 65 to 74 Years | 1 (4.3%) | 10 (58.8%) |
| 75 Years and over | 2 (22.2%) | 2 (22.2%) |
Disability Class by Sex by Age in Prescott
Disability Class: Hearing Difficulty
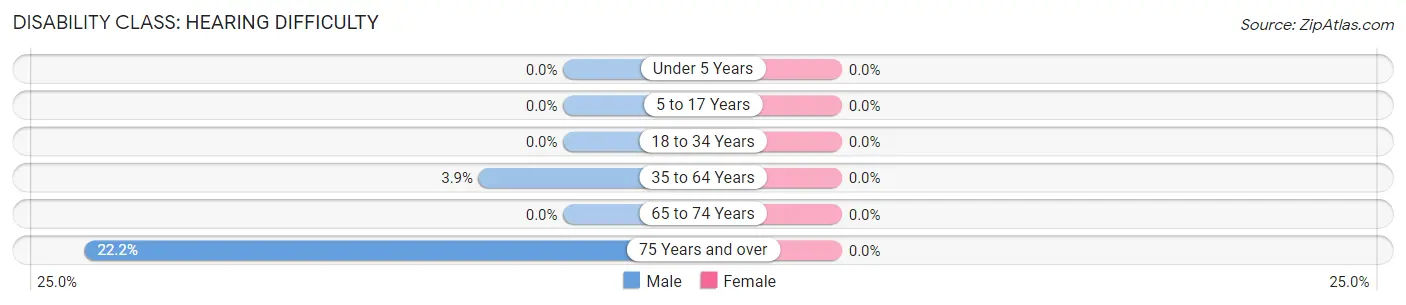
| Age Bracket | Male | Female |
| Under 5 Years | 0 (0.0%) | 0 (0.0%) |
| 5 to 17 Years | 0 (0.0%) | 0 (0.0%) |
| 18 to 34 Years | 0 (0.0%) | 0 (0.0%) |
| 35 to 64 Years | 2 (3.9%) | 0 (0.0%) |
| 65 to 74 Years | 0 (0.0%) | 0 (0.0%) |
| 75 Years and over | 2 (22.2%) | 0 (0.0%) |
Disability Class: Vision Difficulty
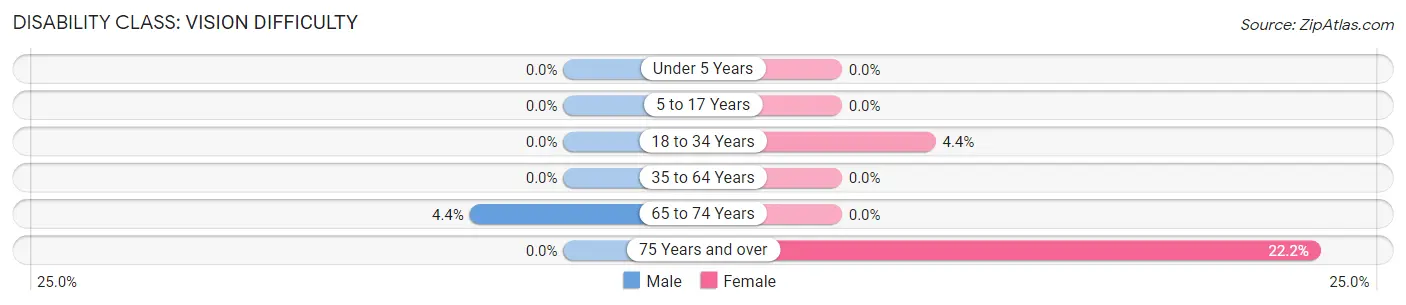
| Age Bracket | Male | Female |
| Under 5 Years | 0 (0.0%) | 0 (0.0%) |
| 5 to 17 Years | 0 (0.0%) | 0 (0.0%) |
| 18 to 34 Years | 0 (0.0%) | 1 (4.3%) |
| 35 to 64 Years | 0 (0.0%) | 0 (0.0%) |
| 65 to 74 Years | 1 (4.3%) | 0 (0.0%) |
| 75 Years and over | 0 (0.0%) | 2 (22.2%) |
Disability Class: Cognitive Difficulty
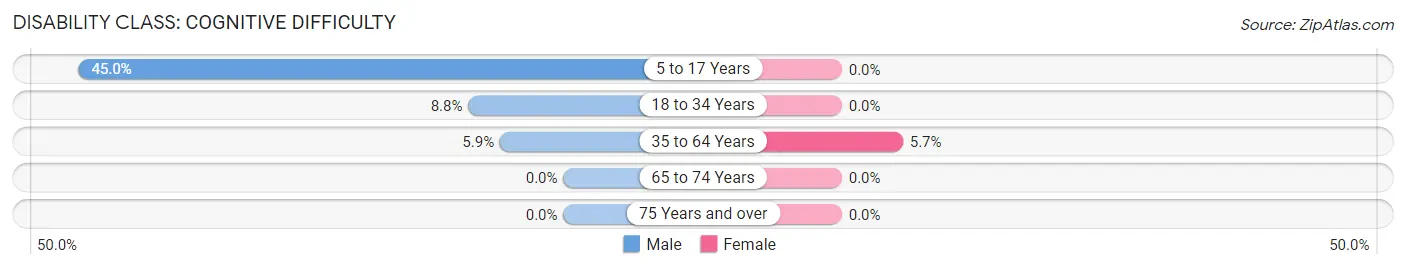
| Age Bracket | Male | Female |
| 5 to 17 Years | 18 (45.0%) | 0 (0.0%) |
| 18 to 34 Years | 3 (8.8%) | 0 (0.0%) |
| 35 to 64 Years | 3 (5.9%) | 3 (5.7%) |
| 65 to 74 Years | 0 (0.0%) | 0 (0.0%) |
| 75 Years and over | 0 (0.0%) | 0 (0.0%) |
Disability Class: Ambulatory Difficulty
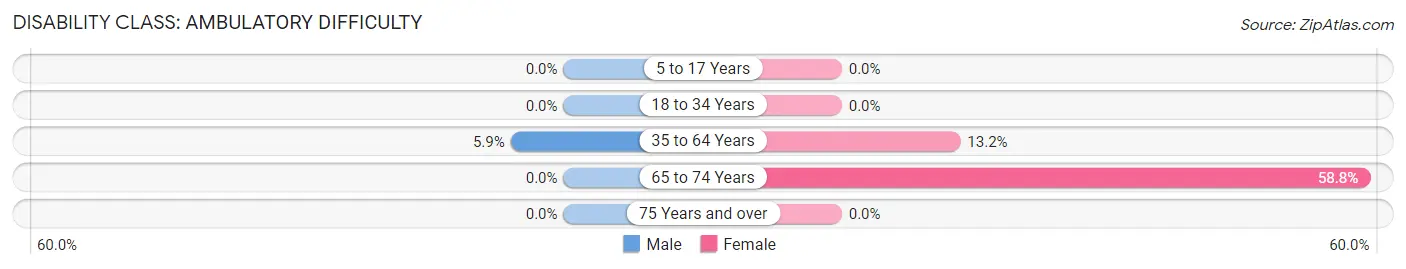
| Age Bracket | Male | Female |
| 5 to 17 Years | 0 (0.0%) | 0 (0.0%) |
| 18 to 34 Years | 0 (0.0%) | 0 (0.0%) |
| 35 to 64 Years | 3 (5.9%) | 7 (13.2%) |
| 65 to 74 Years | 0 (0.0%) | 10 (58.8%) |
| 75 Years and over | 0 (0.0%) | 0 (0.0%) |
Disability Class: Self-Care Difficulty
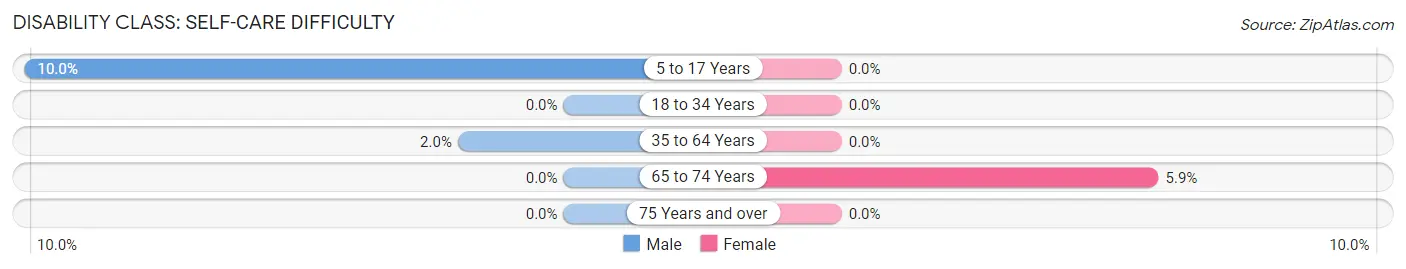
| Age Bracket | Male | Female |
| 5 to 17 Years | 4 (10.0%) | 0 (0.0%) |
| 18 to 34 Years | 0 (0.0%) | 0 (0.0%) |
| 35 to 64 Years | 1 (2.0%) | 0 (0.0%) |
| 65 to 74 Years | 0 (0.0%) | 1 (5.9%) |
| 75 Years and over | 0 (0.0%) | 0 (0.0%) |
Technology Access in Prescott
Computing Device Access in Prescott
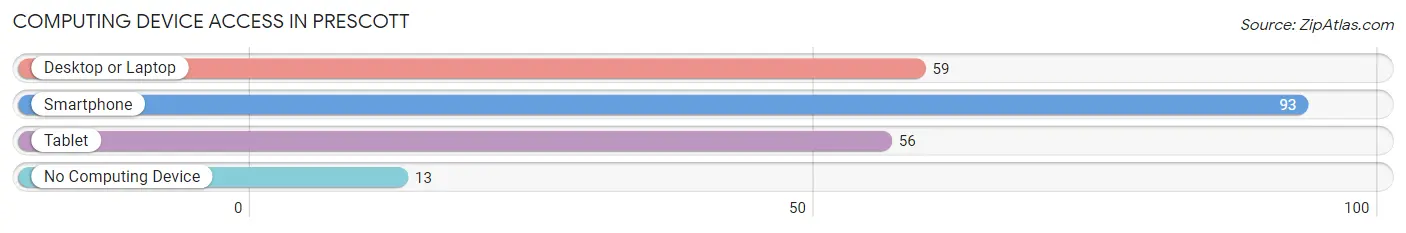
| Device Type | # Households | % Households |
| Desktop or Laptop | 59 | 55.1% |
| Smartphone | 93 | 86.9% |
| Tablet | 56 | 52.3% |
| No Computing Device | 13 | 12.1% |
| Total | 107 | 100.0% |
Internet Access in Prescott
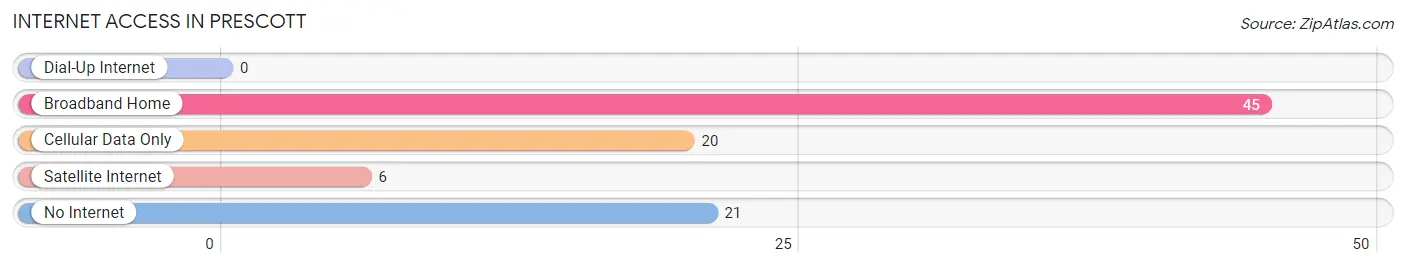
| Internet Type | # Households | % Households |
| Dial-Up Internet | 0 | 0.0% |
| Broadband Home | 45 | 42.1% |
| Cellular Data Only | 20 | 18.7% |
| Satellite Internet | 6 | 5.6% |
| No Internet | 21 | 19.6% |
| Total | 107 | 100.0% |
Prescott Summary
Prescott, Washington is a small town located in the southeastern corner of the state, near the border of Idaho. It is situated in the Columbia River Gorge, a region of the Pacific Northwest known for its stunning natural beauty. The town is home to a population of just over 1,000 people, and is the county seat of Walla Walla County.
History
Prescott was founded in 1871 by a group of settlers from the Oregon Trail. The town was named after a local Native American chief, Chief Prescott. The settlers were attracted to the area due to its fertile soil and abundant natural resources. The town quickly grew and became a hub for the surrounding agricultural communities.
In the late 19th century, Prescott was a major stop on the Oregon Trail. The town was also a major stop on the Northern Pacific Railroad, which connected the Pacific Northwest to the rest of the country.
In the early 20th century, Prescott was a major center for the timber industry. The town was home to several sawmills and lumber yards, and was a major supplier of lumber to the rest of the country.
Geography
Prescott is located in the southeastern corner of Washington, near the border of Idaho. The town is situated in the Columbia River Gorge, a region of the Pacific Northwest known for its stunning natural beauty. The town is surrounded by rolling hills and lush forests, and is home to several rivers and streams.
The climate in Prescott is mild and temperate, with warm summers and cool winters. The average annual temperature is around 50 degrees Fahrenheit. The town receives an average of 20 inches of precipitation per year, mostly in the form of rain.
Economy
Prescott’s economy is largely based on agriculture and tourism. The town is home to several farms and ranches, and is a major supplier of agricultural products to the rest of the state. The town is also a popular tourist destination, and is home to several wineries, breweries, and other attractions.
The town is also home to several small businesses, including restaurants, shops, and other services. The town is home to a small airport, and is a popular destination for outdoor recreation.
Demographics
As of the 2010 census, Prescott had a population of 1,072 people. The town is predominantly white, with a small Hispanic population. The median household income is around $45,000, and the median home value is around $150,000. The town has a low unemployment rate, and a high rate of homeownership.
Prescott is a small town with a rich history and a vibrant economy. The town is home to a diverse population, and is a popular destination for tourists and outdoor enthusiasts. The town is surrounded by stunning natural beauty, and is a great place to live and work.
Common Questions
What is Per Capita Income in Prescott?
Per Capita income in Prescott is $23,309.
What is the Median Family Income in Prescott?
Median Family Income in Prescott is $77,891.
What is the Median Household income in Prescott?
Median Household Income in Prescott is $45,625.
What is Inequality or Gini Index in Prescott?
Inequality or Gini Index in Prescott is 0.44.
What is the Total Population of Prescott?
Total Population of Prescott is 303.
What is the Total Male Population of Prescott?
Total Male Population of Prescott is 172.
What is the Total Female Population of Prescott?
Total Female Population of Prescott is 131.
What is the Ratio of Males per 100 Females in Prescott?
There are 131.30 Males per 100 Females in Prescott.
What is the Ratio of Females per 100 Males in Prescott?
There are 76.16 Females per 100 Males in Prescott.
What is the Median Population Age in Prescott?
Median Population Age in Prescott is 38.5 Years.
What is the Average Family Size in Prescott
Average Family Size in Prescott is 3.5 People.
What is the Average Household Size in Prescott
Average Household Size in Prescott is 2.8 People.
How Large is the Labor Force in Prescott?
There are 144 People in the Labor Forcein in Prescott.
What is the Percentage of People in the Labor Force in Prescott?
65.2% of People are in the Labor Force in Prescott.
What is the Unemployment Rate in Prescott?
Unemployment Rate in Prescott is 10.4%.