North Puyallup, WA Map & Demographics
North Puyallup Map
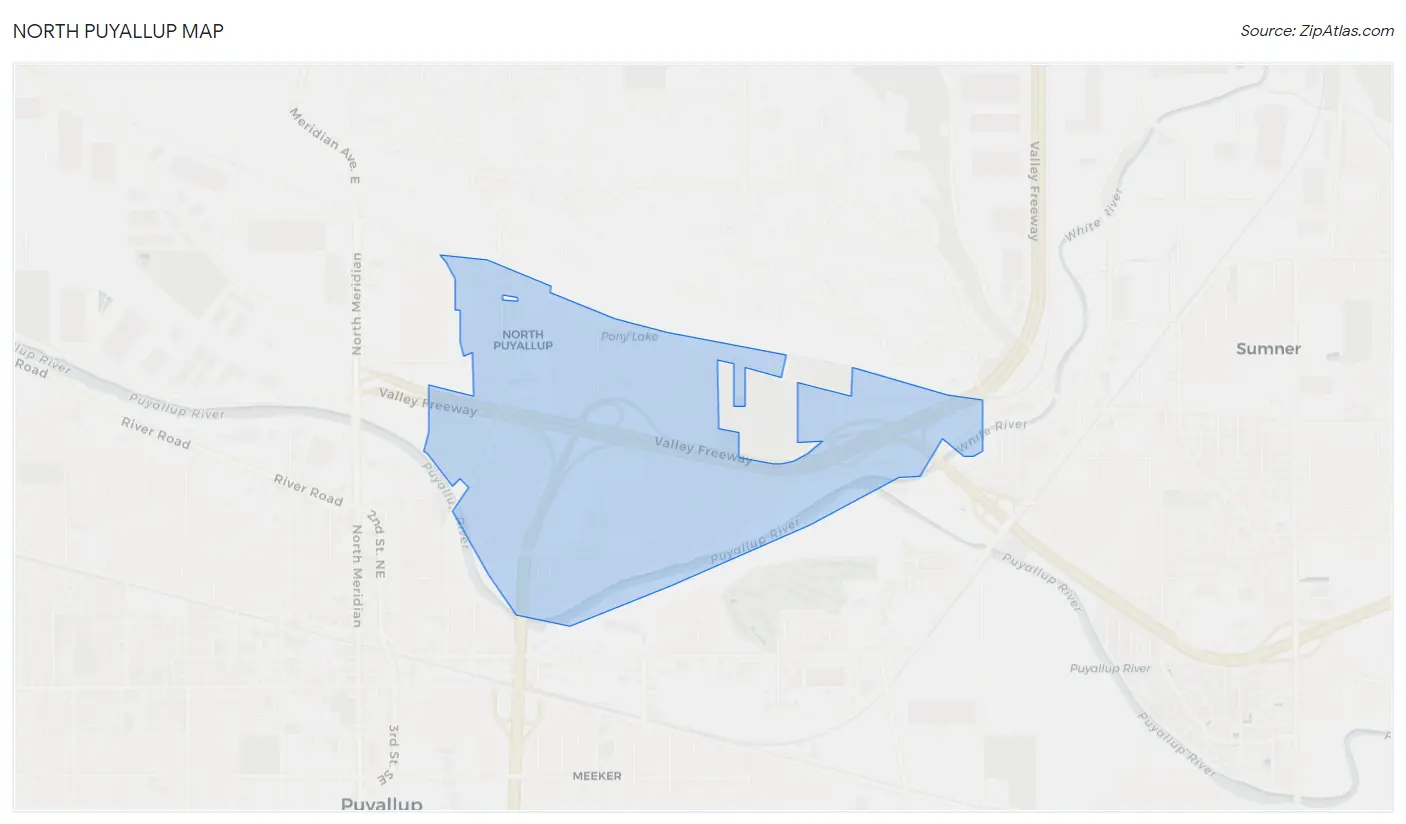
North Puyallup Overview
$40,583
PER CAPITA INCOME
$85,781
AVG FAMILY INCOME
$78,091
AVG HOUSEHOLD INCOME
17.8%
WAGE / INCOME GAP [ % ]
82.2¢/ $1
WAGE / INCOME GAP [ $ ]
0.28
INEQUALITY / GINI INDEX
1,544
TOTAL POPULATION
819
MALE POPULATION
725
FEMALE POPULATION
112.97
MALES / 100 FEMALES
88.52
FEMALES / 100 MALES
60.2
MEDIAN AGE
2.2
AVG FAMILY SIZE
1.8
AVG HOUSEHOLD SIZE
859
LABOR FORCE [ PEOPLE ]
60.0%
PERCENT IN LABOR FORCE
4.1%
UNEMPLOYMENT RATE
Income in North Puyallup
Income Overview in North Puyallup
Per Capita Income in North Puyallup is $40,583, while median incomes of families and households are $85,781 and $78,091 respectively.
| Characteristic | Number | Measure |
| Per Capita Income | 1,544 | $40,583 |
| Median Family Income | 509 | $85,781 |
| Mean Family Income | 509 | $91,419 |
| Median Household Income | 839 | $78,091 |
| Mean Household Income | 839 | $80,604 |
| Income Deficit | 509 | $0 |
| Wage / Income Gap (%) | 1,544 | 17.82% |
| Wage / Income Gap ($) | 1,544 | 82.18¢ per $1 |
| Gini / Inequality Index | 1,544 | 0.28 |
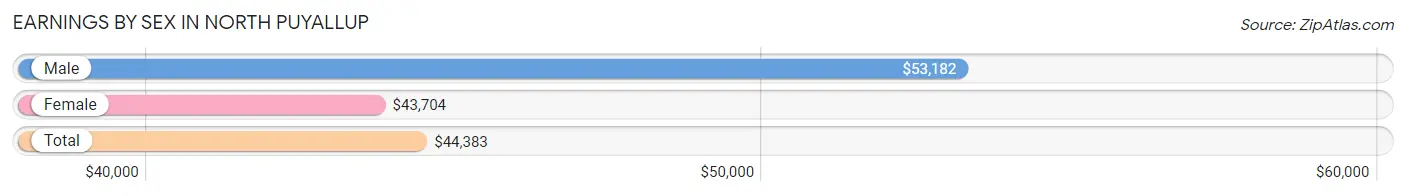
Earnings by Sex in North Puyallup
Average Earnings in North Puyallup are $44,383, $53,182 for men and $43,704 for women, a difference of 17.8%.
| Sex | Number | Average Earnings |
| Male | 502 (58.4%) | $53,182 |
| Female | 358 (41.6%) | $43,704 |
| Total | 860 (100.0%) | $44,383 |
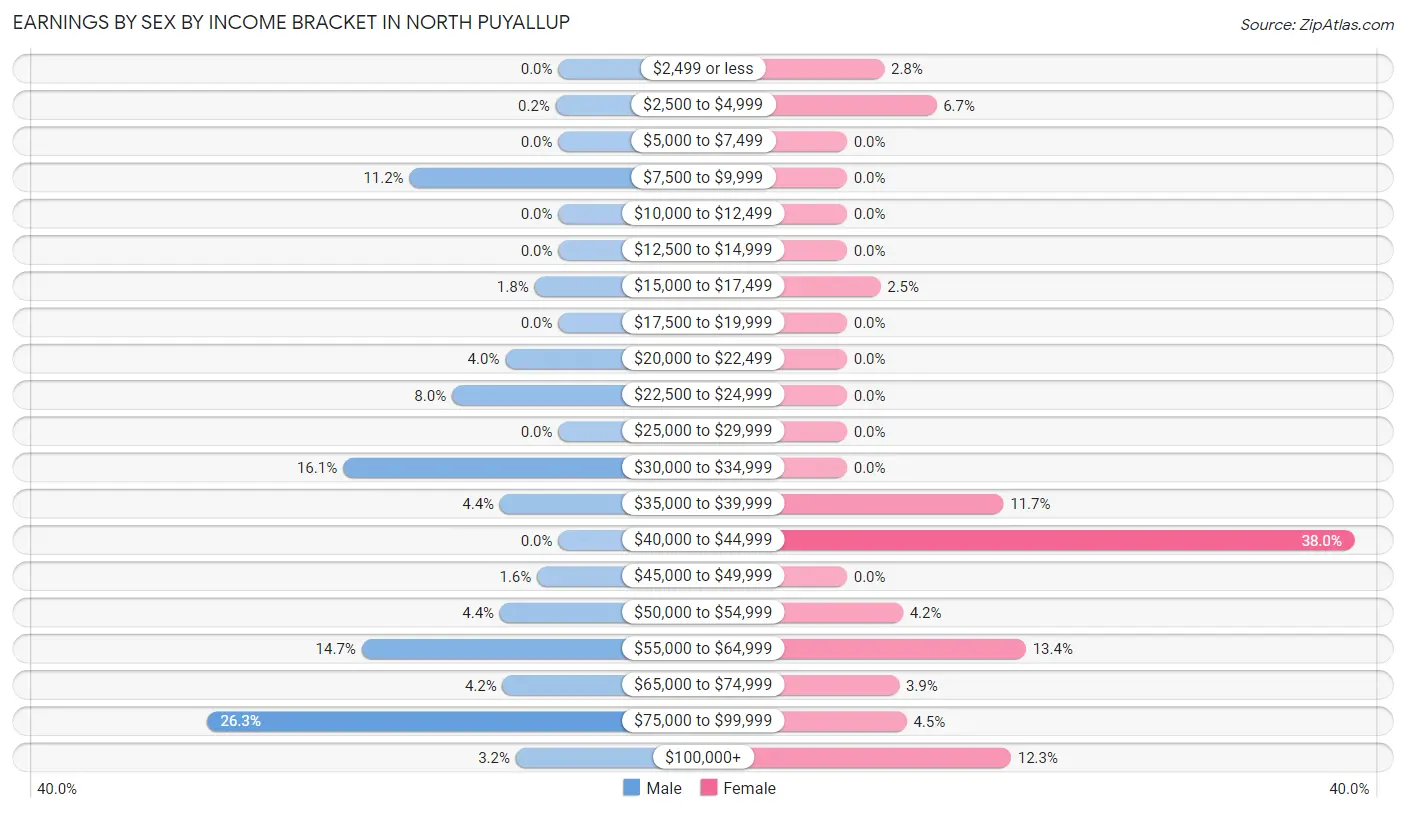
Earnings by Sex by Income Bracket in North Puyallup
The most common earnings brackets in North Puyallup are $75,000 to $99,999 for men (132 | 26.3%) and $40,000 to $44,999 for women (136 | 38.0%).
| Income | Male | Female |
| $2,499 or less | 0 (0.0%) | 10 (2.8%) |
| $2,500 to $4,999 | 1 (0.2%) | 24 (6.7%) |
| $5,000 to $7,499 | 0 (0.0%) | 0 (0.0%) |
| $7,500 to $9,999 | 56 (11.2%) | 0 (0.0%) |
| $10,000 to $12,499 | 0 (0.0%) | 0 (0.0%) |
| $12,500 to $14,999 | 0 (0.0%) | 0 (0.0%) |
| $15,000 to $17,499 | 9 (1.8%) | 9 (2.5%) |
| $17,500 to $19,999 | 0 (0.0%) | 0 (0.0%) |
| $20,000 to $22,499 | 20 (4.0%) | 0 (0.0%) |
| $22,500 to $24,999 | 40 (8.0%) | 0 (0.0%) |
| $25,000 to $29,999 | 0 (0.0%) | 0 (0.0%) |
| $30,000 to $34,999 | 81 (16.1%) | 0 (0.0%) |
| $35,000 to $39,999 | 22 (4.4%) | 42 (11.7%) |
| $40,000 to $44,999 | 0 (0.0%) | 136 (38.0%) |
| $45,000 to $49,999 | 8 (1.6%) | 0 (0.0%) |
| $50,000 to $54,999 | 22 (4.4%) | 15 (4.2%) |
| $55,000 to $64,999 | 74 (14.7%) | 48 (13.4%) |
| $65,000 to $74,999 | 21 (4.2%) | 14 (3.9%) |
| $75,000 to $99,999 | 132 (26.3%) | 16 (4.5%) |
| $100,000+ | 16 (3.2%) | 44 (12.3%) |
| Total | 502 (100.0%) | 358 (100.0%) |
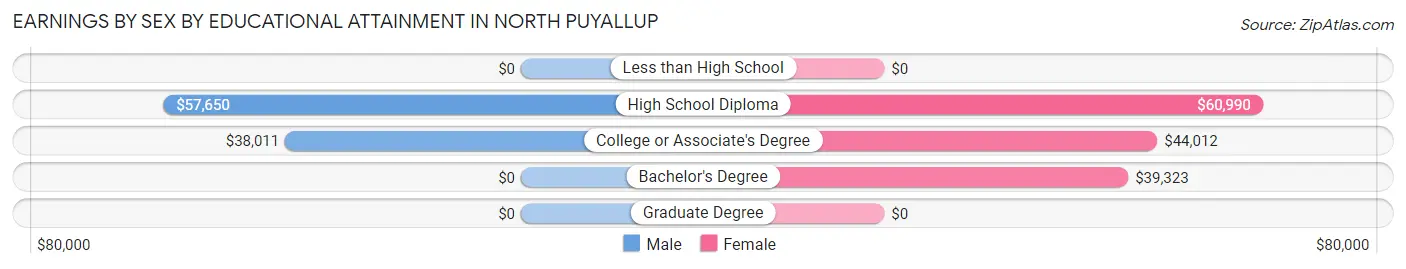
Earnings by Sex by Educational Attainment in North Puyallup
Average earnings in North Puyallup are $53,182 for men and $44,228 for women, a difference of 16.8%. Men with an educational attainment of high school diploma enjoy the highest average annual earnings of $57,650, while those with college or associate's degree education earn the least with $38,011. Women with an educational attainment of high school diploma earn the most with the average annual earnings of $60,990, while those with bachelor's degree education have the smallest earnings of $39,323.
| Educational Attainment | Male Income | Female Income |
| Less than High School | - | - |
| High School Diploma | $57,650 | $60,990 |
| College or Associate's Degree | $38,011 | $44,012 |
| Bachelor's Degree | - | - |
| Graduate Degree | - | - |
| Total | $53,182 | $44,228 |
Family Income in North Puyallup
Family Income Brackets in North Puyallup
According to the North Puyallup family income data, there are 218 families falling into the $100,000 to $149,999 income range, which is the most common income bracket and makes up 42.8% of all families.
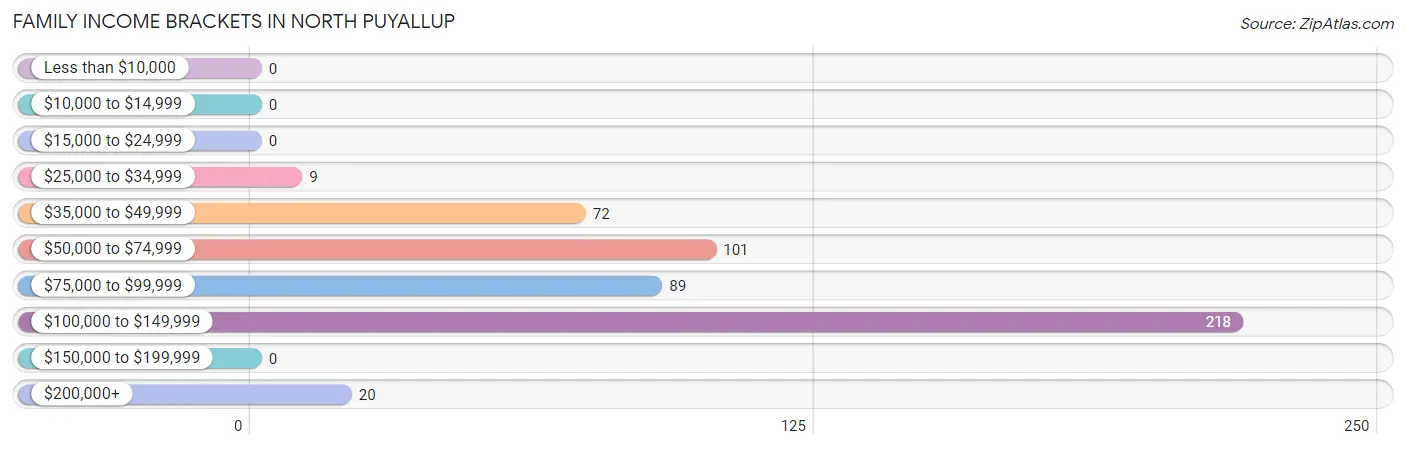
| Income Bracket | # Families | % Families |
| Less than $10,000 | 0 | 0.0% |
| $10,000 to $14,999 | 0 | 0.0% |
| $15,000 to $24,999 | 0 | 0.0% |
| $25,000 to $34,999 | 9 | 1.8% |
| $35,000 to $49,999 | 72 | 14.1% |
| $50,000 to $74,999 | 101 | 19.8% |
| $75,000 to $99,999 | 89 | 17.5% |
| $100,000 to $149,999 | 218 | 42.8% |
| $150,000 to $199,999 | 0 | 0.0% |
| $200,000+ | 20 | 3.9% |
Family Income by Famaliy Size in North Puyallup
2-person families (352 | 69.2%) account for the highest median family income in North Puyallup with $108,500 per family, while 2-person families (352 | 69.2%) have the highest median income of $54,250 per family member.
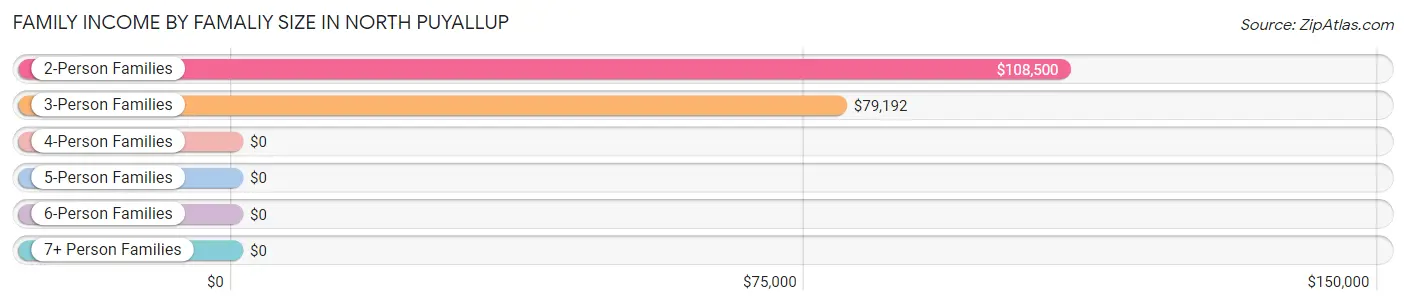
| Income Bracket | # Families | Median Income |
| 2-Person Families | 352 (69.2%) | $108,500 |
| 3-Person Families | 136 (26.7%) | $79,192 |
| 4-Person Families | 21 (4.1%) | $0 |
| 5-Person Families | 0 (0.0%) | $0 |
| 6-Person Families | 0 (0.0%) | $0 |
| 7+ Person Families | 0 (0.0%) | $0 |
| Total | 509 (100.0%) | $85,781 |
Family Income by Number of Earners in North Puyallup
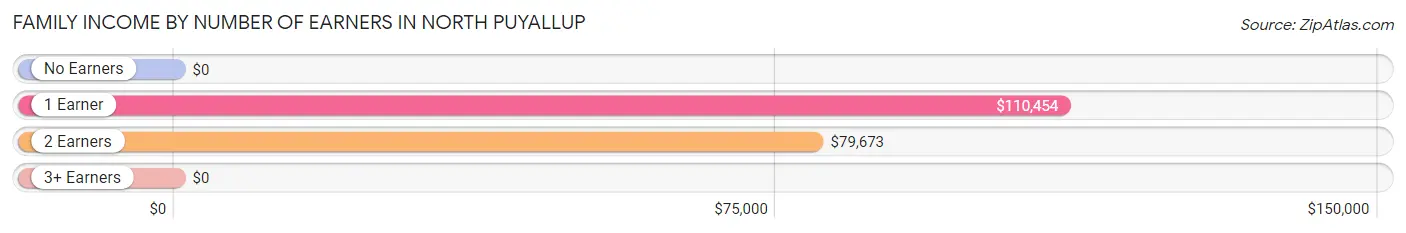
| Number of Earners | # Families | Median Income |
| No Earners | 41 (8.1%) | $0 |
| 1 Earner | 259 (50.9%) | $110,454 |
| 2 Earners | 209 (41.1%) | $79,673 |
| 3+ Earners | 0 (0.0%) | $0 |
| Total | 509 (100.0%) | $85,781 |
Household Income in North Puyallup
Household Income Brackets in North Puyallup
With 297 households falling in the category, the $100,000 to $149,999 income range is the most frequent in North Puyallup, accounting for 35.4% of all households.
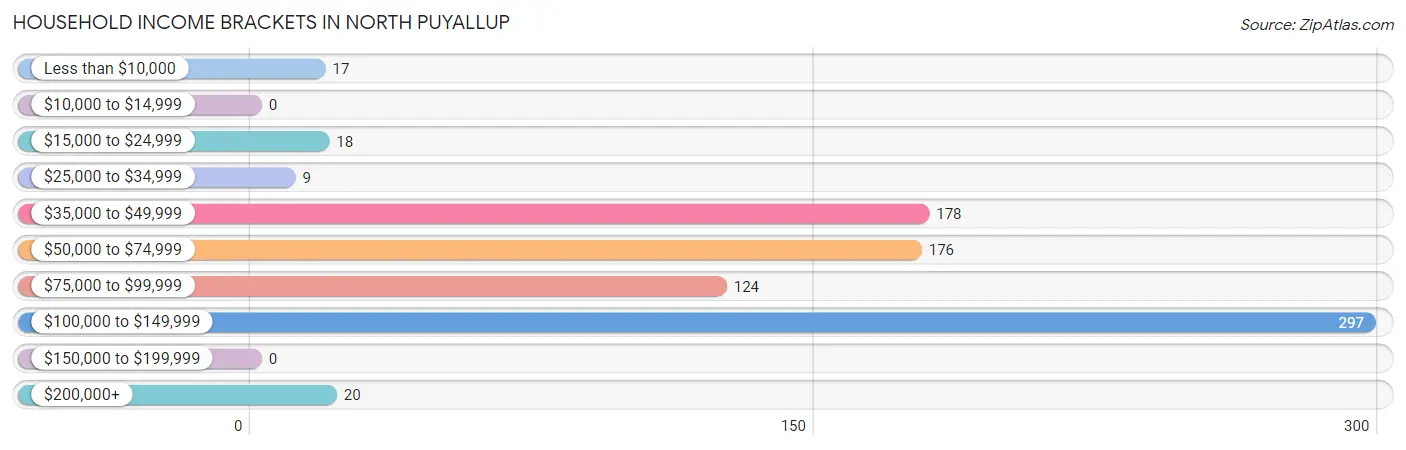
| Income Bracket | # Households | % Households |
| Less than $10,000 | 17 | 2.0% |
| $10,000 to $14,999 | 0 | 0.0% |
| $15,000 to $24,999 | 18 | 2.1% |
| $25,000 to $34,999 | 9 | 1.1% |
| $35,000 to $49,999 | 178 | 21.2% |
| $50,000 to $74,999 | 176 | 21.0% |
| $75,000 to $99,999 | 124 | 14.8% |
| $100,000 to $149,999 | 297 | 35.4% |
| $150,000 to $199,999 | 0 | 0.0% |
| $200,000+ | 20 | 2.4% |
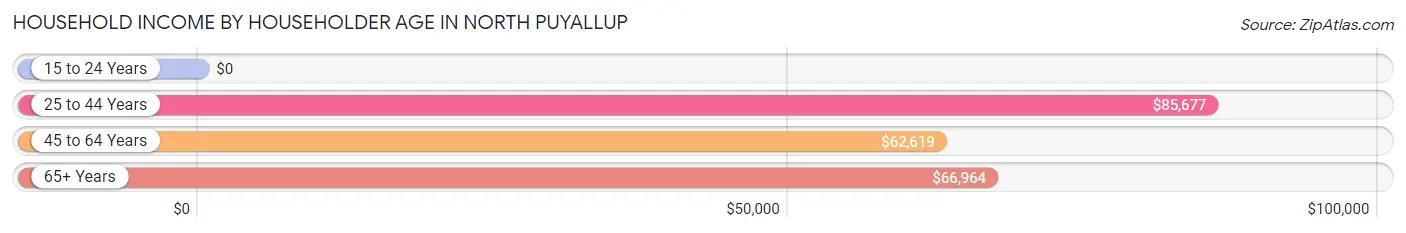
Household Income by Householder Age in North Puyallup
The median household income in North Puyallup is $78,091, with the highest median household income of $85,677 found in the 25 to 44 years age bracket for the primary householder. A total of 235 households (28.0%) fall into this category. Meanwhile, the 15 to 24 years age bracket for the primary householder has the lowest median household income of $0, with 34 households (4.1%) in this group.
| Income Bracket | # Households | Median Income |
| 15 to 24 Years | 34 (4.1%) | $0 |
| 25 to 44 Years | 235 (28.0%) | $85,677 |
| 45 to 64 Years | 144 (17.2%) | $62,619 |
| 65+ Years | 426 (50.8%) | $66,964 |
| Total | 839 (100.0%) | $78,091 |
Poverty in North Puyallup
Income Below Poverty by Sex and Age in North Puyallup
With 0.6% poverty level for males and 5.0% for females among the residents of North Puyallup, 65 to 74 year old males and 55 to 64 year old females are the most vulnerable to poverty, with 2 males (1.4%) and 9 females (11.7%) in their respective age groups living below the poverty level.
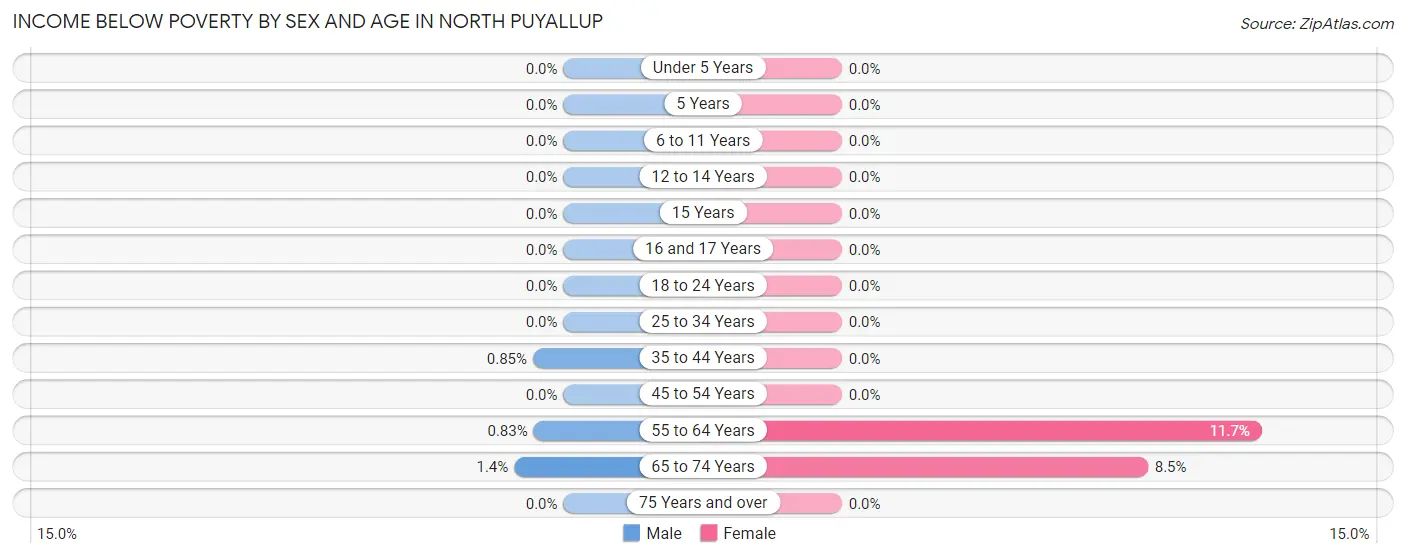
| Age Bracket | Male | Female |
| Under 5 Years | 0 (0.0%) | 0 (0.0%) |
| 5 Years | 0 (0.0%) | 0 (0.0%) |
| 6 to 11 Years | 0 (0.0%) | 0 (0.0%) |
| 12 to 14 Years | 0 (0.0%) | 0 (0.0%) |
| 15 Years | 0 (0.0%) | 0 (0.0%) |
| 16 and 17 Years | 0 (0.0%) | 0 (0.0%) |
| 18 to 24 Years | 0 (0.0%) | 0 (0.0%) |
| 25 to 34 Years | 0 (0.0%) | 0 (0.0%) |
| 35 to 44 Years | 1 (0.9%) | 0 (0.0%) |
| 45 to 54 Years | 0 (0.0%) | 0 (0.0%) |
| 55 to 64 Years | 2 (0.8%) | 9 (11.7%) |
| 65 to 74 Years | 2 (1.4%) | 27 (8.5%) |
| 75 Years and over | 0 (0.0%) | 0 (0.0%) |
| Total | 5 (0.6%) | 36 (5.0%) |
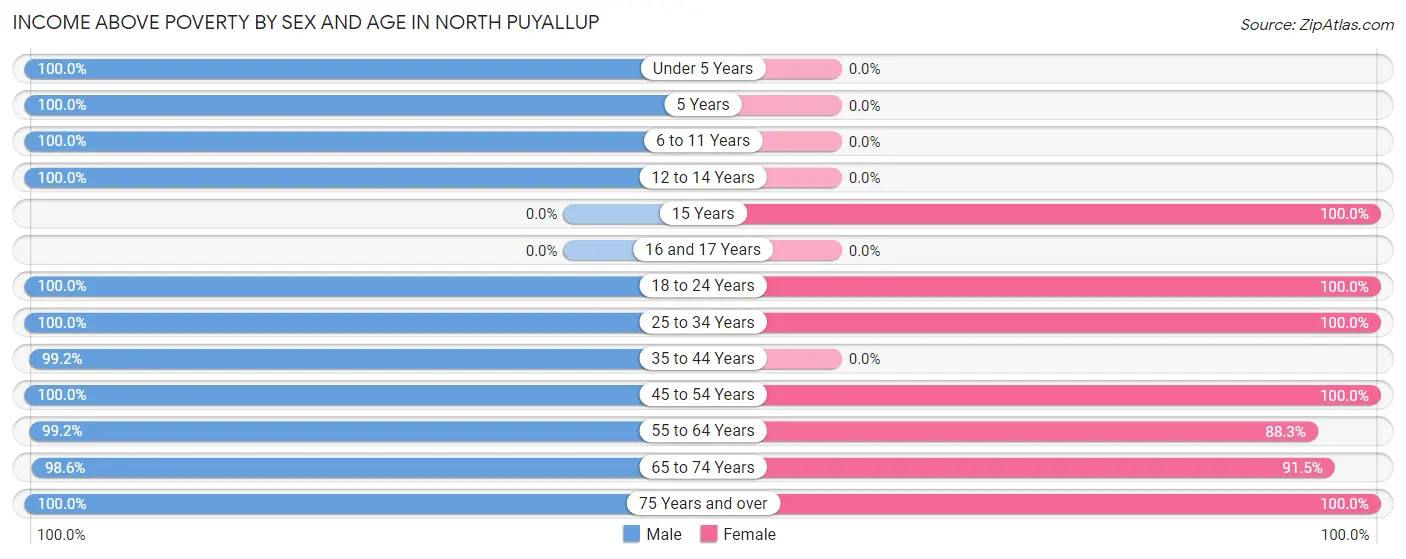
Income Above Poverty by Sex and Age in North Puyallup
According to the poverty statistics in North Puyallup, males aged under 5 years and females aged 15 years are the age groups that are most secure financially, with 100.0% of males and 100.0% of females in these age groups living above the poverty line.
| Age Bracket | Male | Female |
| Under 5 Years | 42 (100.0%) | 0 (0.0%) |
| 5 Years | 23 (100.0%) | 0 (0.0%) |
| 6 to 11 Years | 17 (100.0%) | 0 (0.0%) |
| 12 to 14 Years | 17 (100.0%) | 0 (0.0%) |
| 15 Years | 0 (0.0%) | 14 (100.0%) |
| 16 and 17 Years | 0 (0.0%) | 0 (0.0%) |
| 18 to 24 Years | 35 (100.0%) | 34 (100.0%) |
| 25 to 34 Years | 125 (100.0%) | 158 (100.0%) |
| 35 to 44 Years | 117 (99.2%) | 0 (0.0%) |
| 45 to 54 Years | 22 (100.0%) | 91 (100.0%) |
| 55 to 64 Years | 239 (99.2%) | 68 (88.3%) |
| 65 to 74 Years | 144 (98.6%) | 290 (91.5%) |
| 75 Years and over | 33 (100.0%) | 34 (100.0%) |
| Total | 814 (99.4%) | 689 (95.0%) |
Income Below Poverty Among Married-Couple Families in North Puyallup
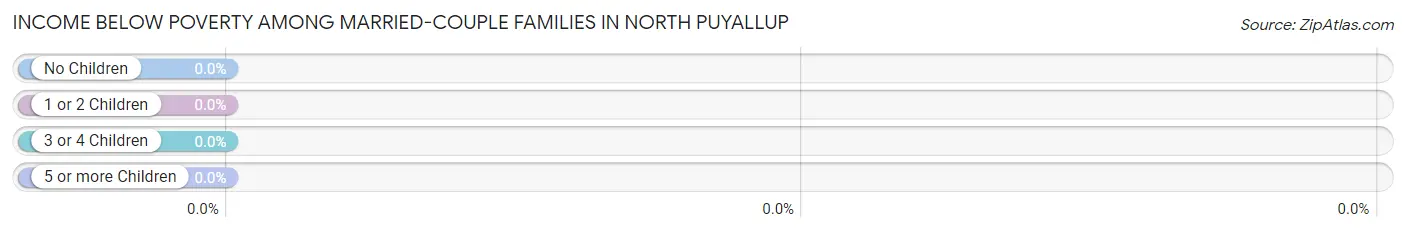
| Children | Above Poverty | Below Poverty |
| No Children | 269 (100.0%) | 0 (0.0%) |
| 1 or 2 Children | 142 (100.0%) | 0 (0.0%) |
| 3 or 4 Children | 0 (0.0%) | 0 (0.0%) |
| 5 or more Children | 0 (0.0%) | 0 (0.0%) |
| Total | 411 (100.0%) | 0 (0.0%) |
Income Below Poverty Among Single-Parent Households in North Puyallup
| Children | Single Father | Single Mother |
| No Children | 0 (0.0%) | 0 (0.0%) |
| 1 or 2 Children | 0 (0.0%) | 0 (0.0%) |
| 3 or 4 Children | 0 (0.0%) | 0 (0.0%) |
| 5 or more Children | 0 (0.0%) | 0 (0.0%) |
| Total | 0 (0.0%) | 0 (0.0%) |
Income Below Poverty Among Married-Couple vs Single-Parent Households in North Puyallup
| Children | Married-Couple Families | Single-Parent Households |
| No Children | 0 (0.0%) | 0 (0.0%) |
| 1 or 2 Children | 0 (0.0%) | 0 (0.0%) |
| 3 or 4 Children | 0 (0.0%) | 0 (0.0%) |
| 5 or more Children | 0 (0.0%) | 0 (0.0%) |
| Total | 0 (0.0%) | 0 (0.0%) |
Race in North Puyallup
The most populous races in North Puyallup are White / Caucasian (1,066 | 69.0%), Some other Race (254 | 16.5%), and Hispanic or Latino (124 | 8.0%).
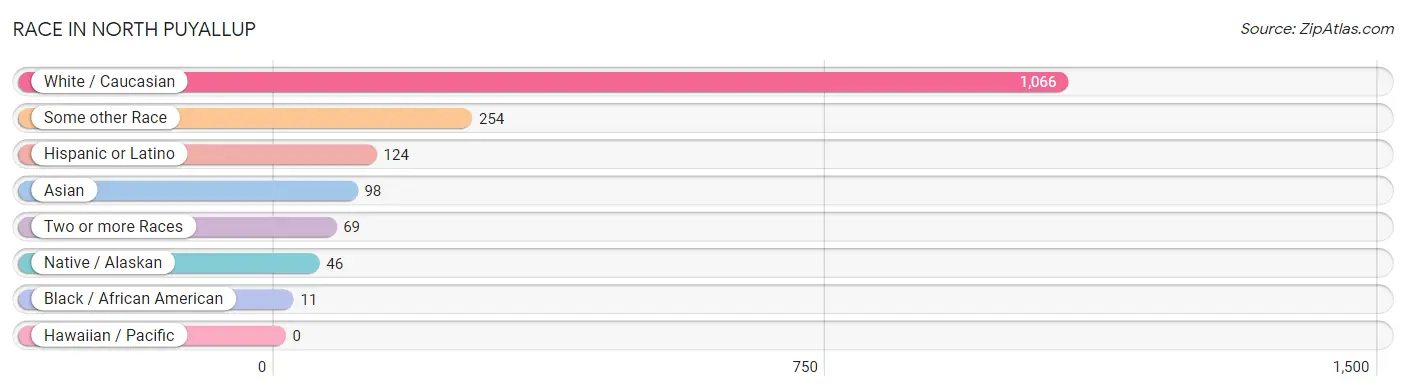
| Race | # Population | % Population |
| Asian | 98 | 6.4% |
| Black / African American | 11 | 0.7% |
| Hawaiian / Pacific | 0 | 0.0% |
| Hispanic or Latino | 124 | 8.0% |
| Native / Alaskan | 46 | 3.0% |
| White / Caucasian | 1,066 | 69.0% |
| Two or more Races | 69 | 4.5% |
| Some other Race | 254 | 16.5% |
| Total | 1,544 | 100.0% |
Ancestry in North Puyallup
The most populous ancestries reported in North Puyallup are American (308 | 20.0%), German (235 | 15.2%), Irish (153 | 9.9%), Italian (116 | 7.5%), and English (104 | 6.7%), together accounting for 59.3% of all North Puyallup residents.
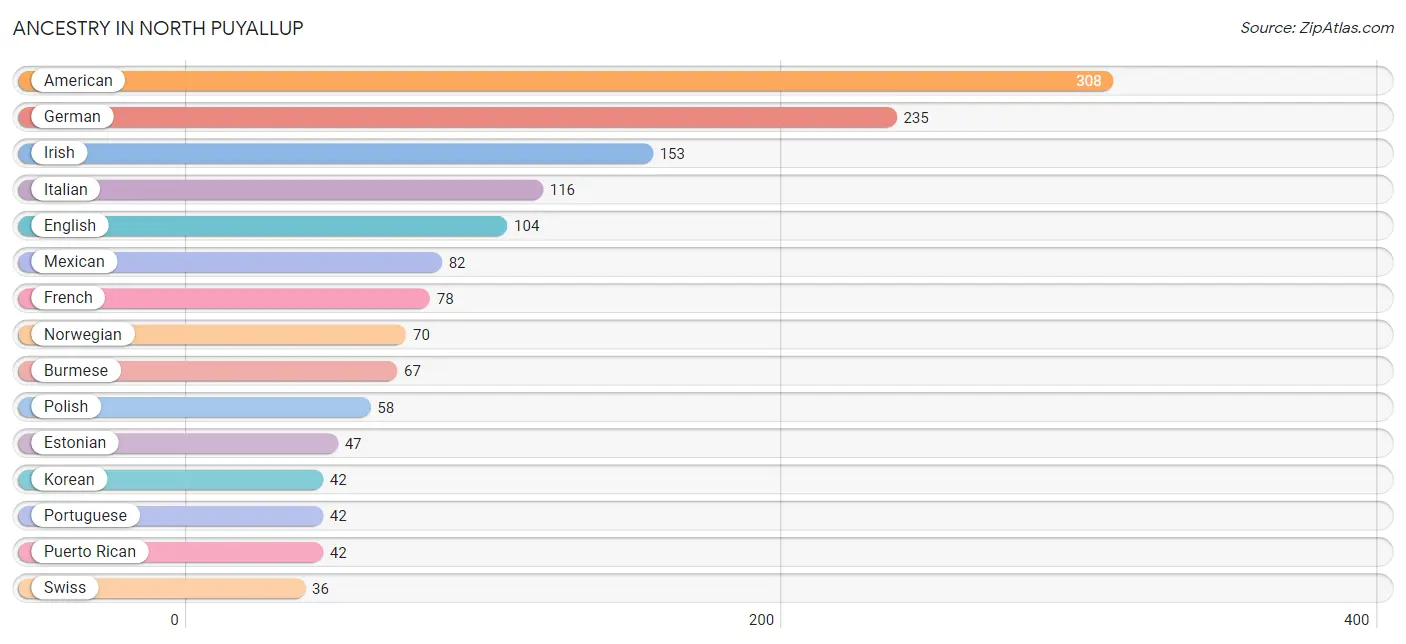
| Ancestry | # Population | % Population |
| American | 308 | 20.0% |
| Bhutanese | 2 | 0.1% |
| British | 10 | 0.6% |
| Burmese | 67 | 4.3% |
| Chickasaw | 10 | 0.6% |
| Danish | 10 | 0.6% |
| Dutch | 9 | 0.6% |
| English | 104 | 6.7% |
| Estonian | 47 | 3.0% |
| European | 26 | 1.7% |
| French | 78 | 5.1% |
| German | 235 | 15.2% |
| Irish | 153 | 9.9% |
| Italian | 116 | 7.5% |
| Korean | 42 | 2.7% |
| Latvian | 10 | 0.6% |
| Lithuanian | 11 | 0.7% |
| Mexican | 82 | 5.3% |
| Norwegian | 70 | 4.5% |
| Polish | 58 | 3.8% |
| Portuguese | 42 | 2.7% |
| Puerto Rican | 42 | 2.7% |
| Scotch-Irish | 10 | 0.6% |
| Swiss | 36 | 2.3% |
| Thai | 1 | 0.1% |
| Welsh | 8 | 0.5% | View All 26 Rows |
Immigrants in North Puyallup
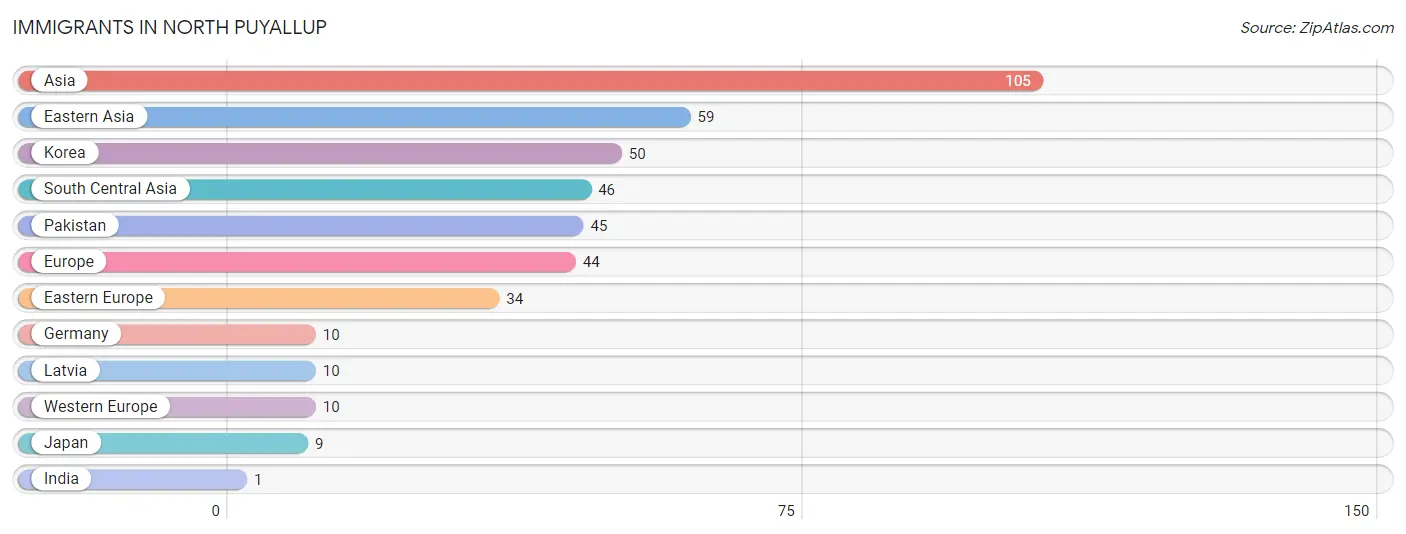
The most numerous immigrant groups reported in North Puyallup came from Asia (105 | 6.8%), Eastern Asia (59 | 3.8%), Korea (50 | 3.2%), South Central Asia (46 | 3.0%), and Pakistan (45 | 2.9%), together accounting for 19.8% of all North Puyallup residents.
| Immigration Origin | # Population | % Population |
| Asia | 105 | 6.8% |
| Eastern Asia | 59 | 3.8% |
| Eastern Europe | 34 | 2.2% |
| Europe | 44 | 2.9% |
| Germany | 10 | 0.6% |
| India | 1 | 0.1% |
| Japan | 9 | 0.6% |
| Korea | 50 | 3.2% |
| Latvia | 10 | 0.6% |
| Pakistan | 45 | 2.9% |
| South Central Asia | 46 | 3.0% |
| Western Europe | 10 | 0.6% | View All 12 Rows |
Sex and Age in North Puyallup
Sex and Age in North Puyallup
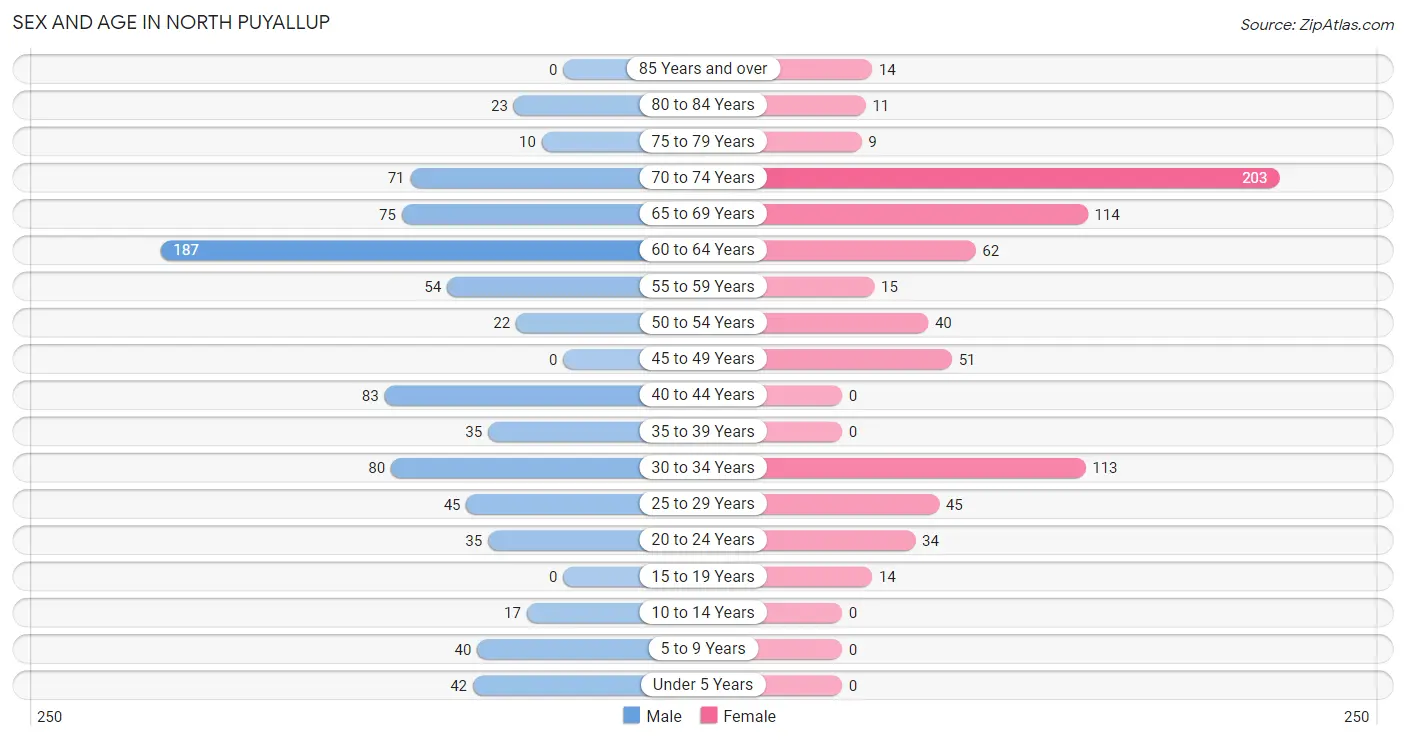
The most populous age groups in North Puyallup are 60 to 64 Years (187 | 22.8%) for men and 70 to 74 Years (203 | 28.0%) for women.
| Age Bracket | Male | Female |
| Under 5 Years | 42 (5.1%) | 0 (0.0%) |
| 5 to 9 Years | 40 (4.9%) | 0 (0.0%) |
| 10 to 14 Years | 17 (2.1%) | 0 (0.0%) |
| 15 to 19 Years | 0 (0.0%) | 14 (1.9%) |
| 20 to 24 Years | 35 (4.3%) | 34 (4.7%) |
| 25 to 29 Years | 45 (5.5%) | 45 (6.2%) |
| 30 to 34 Years | 80 (9.8%) | 113 (15.6%) |
| 35 to 39 Years | 35 (4.3%) | 0 (0.0%) |
| 40 to 44 Years | 83 (10.1%) | 0 (0.0%) |
| 45 to 49 Years | 0 (0.0%) | 51 (7.0%) |
| 50 to 54 Years | 22 (2.7%) | 40 (5.5%) |
| 55 to 59 Years | 54 (6.6%) | 15 (2.1%) |
| 60 to 64 Years | 187 (22.8%) | 62 (8.6%) |
| 65 to 69 Years | 75 (9.2%) | 114 (15.7%) |
| 70 to 74 Years | 71 (8.7%) | 203 (28.0%) |
| 75 to 79 Years | 10 (1.2%) | 9 (1.2%) |
| 80 to 84 Years | 23 (2.8%) | 11 (1.5%) |
| 85 Years and over | 0 (0.0%) | 14 (1.9%) |
| Total | 819 (100.0%) | 725 (100.0%) |
Families and Households in North Puyallup
Median Family Size in North Puyallup
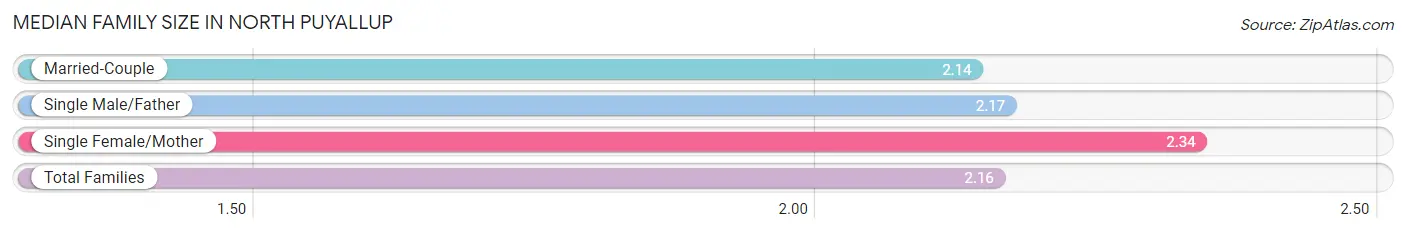
The median family size in North Puyallup is 2.16 persons per family, with single female/mother families (50 | 9.8%) accounting for the largest median family size of 2.34 persons per family. On the other hand, married-couple families (411 | 80.7%) represent the smallest median family size with 2.14 persons per family.
| Family Type | # Families | Family Size |
| Married-Couple | 411 (80.7%) | 2.14 |
| Single Male/Father | 48 (9.4%) | 2.17 |
| Single Female/Mother | 50 (9.8%) | 2.34 |
| Total Families | 509 (100.0%) | 2.16 |
Median Household Size in North Puyallup
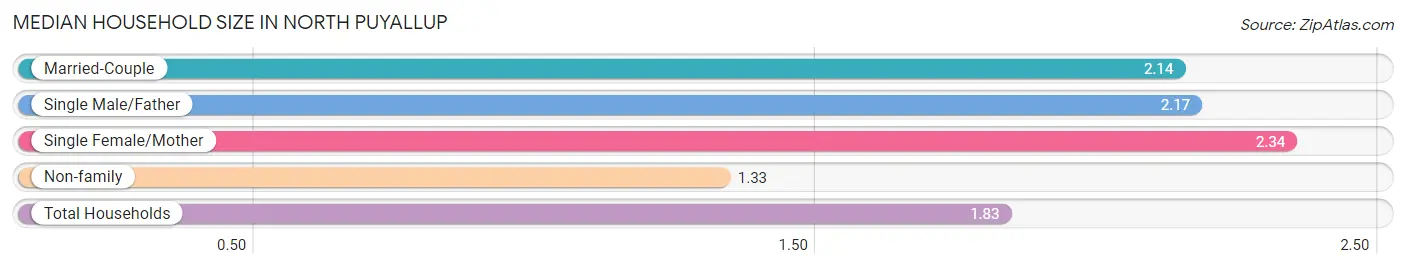
The median household size in North Puyallup is 1.83 persons per household, with single female/mother households (50 | 6.0%) accounting for the largest median household size of 2.34 persons per household. non-family households (330 | 39.3%) represent the smallest median household size with 1.33 persons per household.
| Household Type | # Households | Household Size |
| Married-Couple | 411 (49.0%) | 2.14 |
| Single Male/Father | 48 (5.7%) | 2.17 |
| Single Female/Mother | 50 (6.0%) | 2.34 |
| Non-family | 330 (39.3%) | 1.33 |
| Total Households | 839 (100.0%) | 1.83 |
Household Size by Marriage Status in North Puyallup
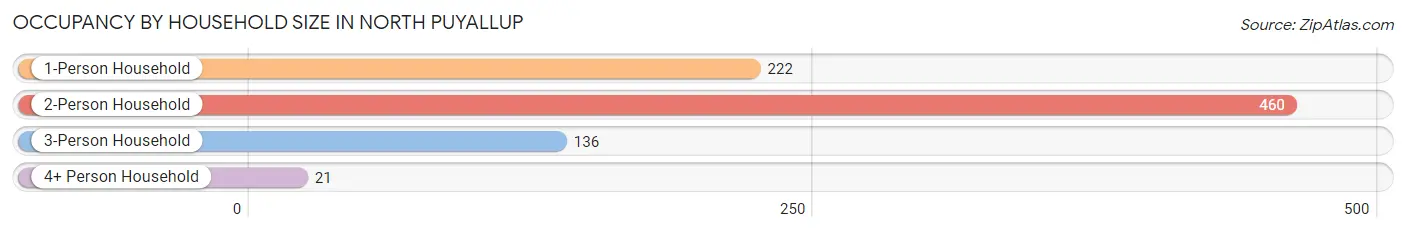
Out of a total of 839 households in North Puyallup, 509 (60.7%) are family households, while 330 (39.3%) are nonfamily households. The most numerous type of family households are 2-person households, comprising 352, and the most common type of nonfamily households are 1-person households, comprising 222.
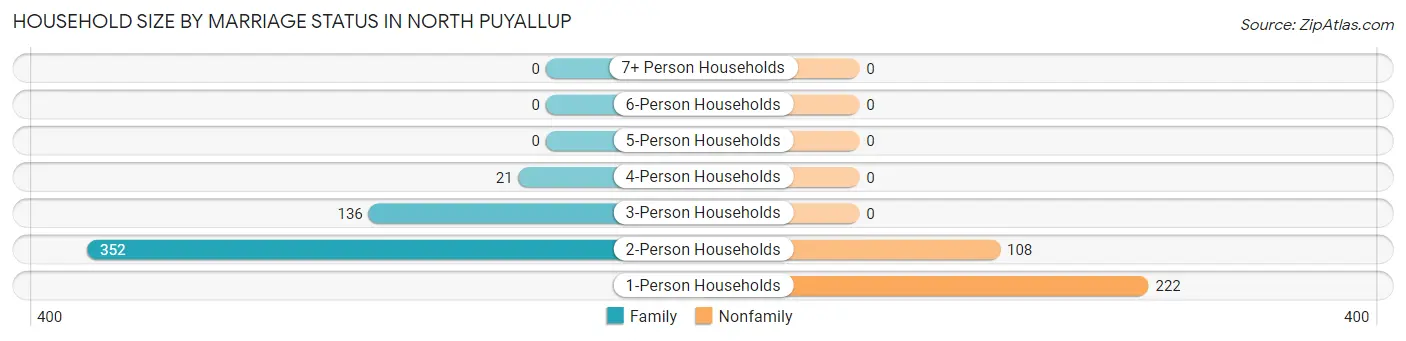
| Household Size | Family Households | Nonfamily Households |
| 1-Person Households | - | 222 (26.5%) |
| 2-Person Households | 352 (41.9%) | 108 (12.9%) |
| 3-Person Households | 136 (16.2%) | 0 (0.0%) |
| 4-Person Households | 21 (2.5%) | 0 (0.0%) |
| 5-Person Households | 0 (0.0%) | 0 (0.0%) |
| 6-Person Households | 0 (0.0%) | 0 (0.0%) |
| 7+ Person Households | 0 (0.0%) | 0 (0.0%) |
| Total | 509 (60.7%) | 330 (39.3%) |
Female Fertility in North Puyallup
Fertility by Age in North Puyallup
Average fertility rate in North Puyallup is 82.0 births per 1,000 women. Women in the age bracket of 20 to 34 years have the highest fertility rate with 109.0 births per 1,000 women. Women in the age bracket of 20 to 34 years acount for 100.0% of all women with births.
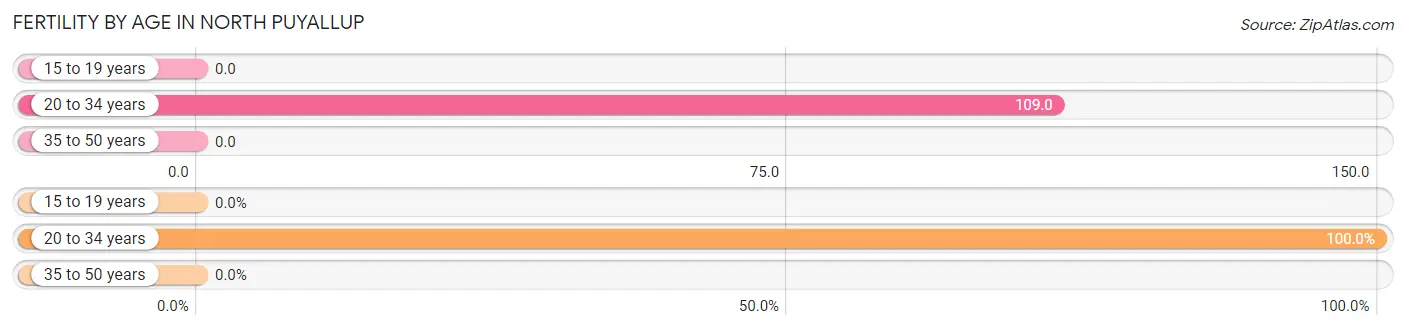
| Age Bracket | Women with Births | Births / 1,000 Women |
| 15 to 19 years | 0 (0.0%) | 0.0 |
| 20 to 34 years | 21 (100.0%) | 109.0 |
| 35 to 50 years | 0 (0.0%) | 0.0 |
| Total | 21 (100.0%) | 82.0 |
Fertility by Age by Marriage Status in North Puyallup
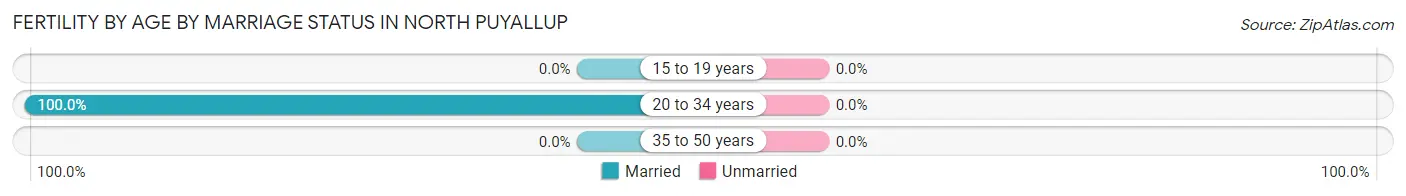
| Age Bracket | Married | Unmarried |
| 15 to 19 years | 0 (0.0%) | 0 (0.0%) |
| 20 to 34 years | 21 (100.0%) | 0 (0.0%) |
| 35 to 50 years | 0 (0.0%) | 0 (0.0%) |
| Total | 21 (100.0%) | 0 (0.0%) |
Fertility by Education in North Puyallup
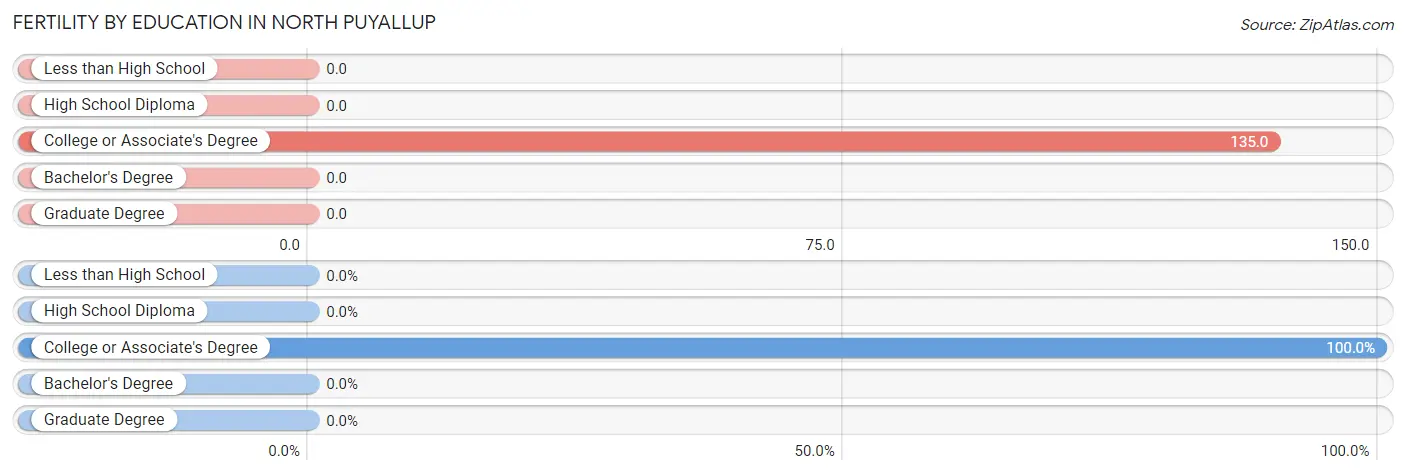
| Educational Attainment | Women with Births | Births / 1,000 Women |
| Less than High School | 0 (0.0%) | 0.0 |
| High School Diploma | 0 (0.0%) | 0.0 |
| College or Associate's Degree | 21 (100.0%) | 135.0 |
| Bachelor's Degree | 0 (0.0%) | 0.0 |
| Graduate Degree | 0 (0.0%) | 0.0 |
| Total | 21 (100.0%) | 82.0 |
Fertility by Education by Marriage Status in North Puyallup
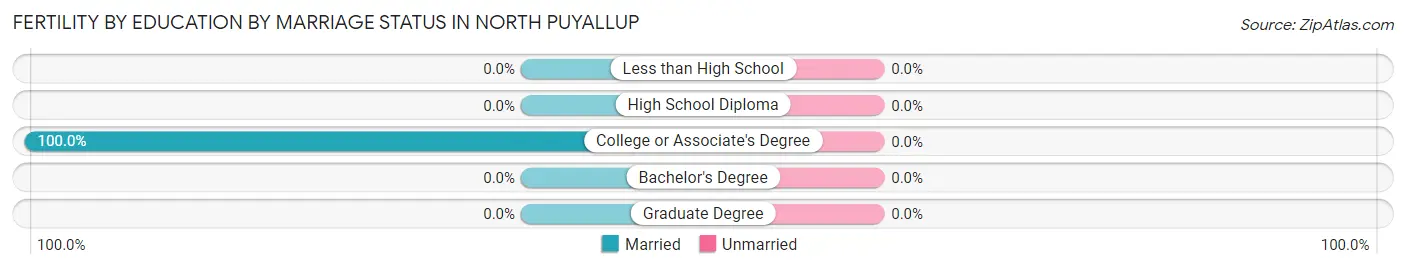
| Educational Attainment | Married | Unmarried |
| Less than High School | 0 (0.0%) | 0 (0.0%) |
| High School Diploma | 0 (0.0%) | 0 (0.0%) |
| College or Associate's Degree | 21 (100.0%) | 0 (0.0%) |
| Bachelor's Degree | 0 (0.0%) | 0 (0.0%) |
| Graduate Degree | 0 (0.0%) | 0 (0.0%) |
| Total | 21 (100.0%) | 0 (0.0%) |
Employment Characteristics in North Puyallup
Employment by Class of Employer in North Puyallup
Among the 824 employed individuals in North Puyallup, private company employees (632 | 76.7%), not-for-profit organizations (137 | 16.6%), and local government employees (24 | 2.9%) make up the most common classes of employment.
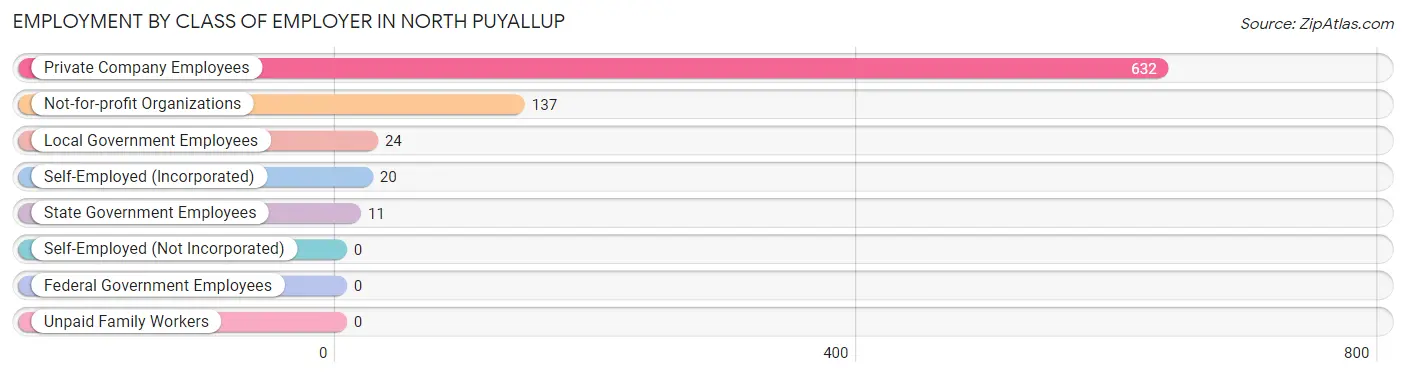
| Employer Class | # Employees | % Employees |
| Private Company Employees | 632 | 76.7% |
| Self-Employed (Incorporated) | 20 | 2.4% |
| Self-Employed (Not Incorporated) | 0 | 0.0% |
| Not-for-profit Organizations | 137 | 16.6% |
| Local Government Employees | 24 | 2.9% |
| State Government Employees | 11 | 1.3% |
| Federal Government Employees | 0 | 0.0% |
| Unpaid Family Workers | 0 | 0.0% |
| Total | 824 | 100.0% |
Employment Status by Age in North Puyallup
According to the labor force statistics for North Puyallup, out of the total population over 16 years of age (1,431), 60.0% or 859 individuals are in the labor force, with 4.1% or 35 of them unemployed. The age group with the highest labor force participation rate is 20 to 24 years, with 100.0% or 69 individuals in the labor force. Within the labor force, the 20 to 24 years age range has the highest percentage of unemployed individuals, with 50.7% or 35 of them being unemployed.
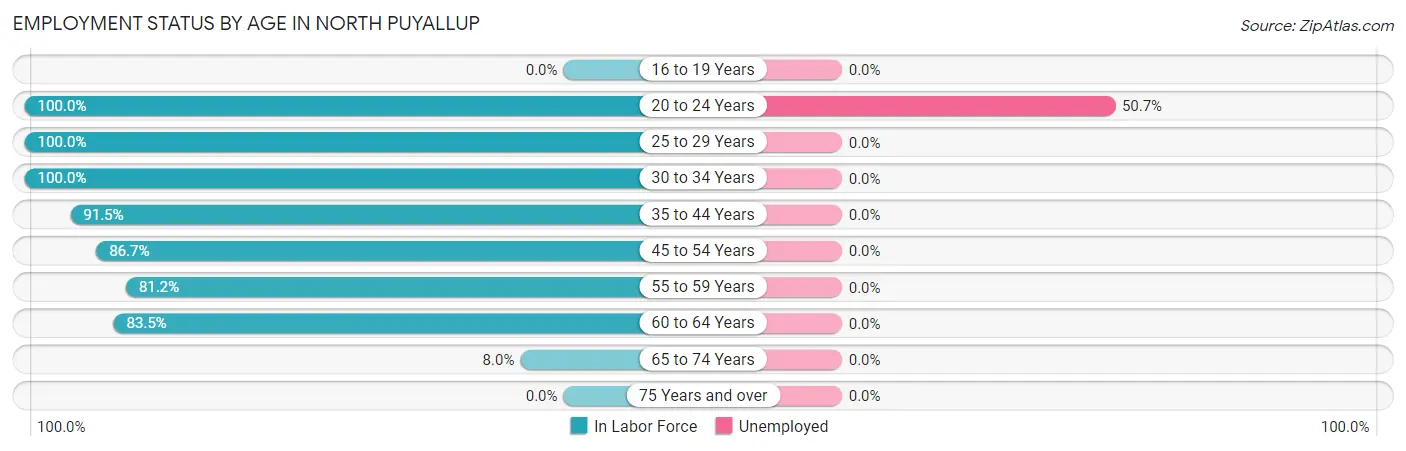
| Age Bracket | In Labor Force | Unemployed |
| 16 to 19 Years | 0 (0.0%) | 0 (0.0%) |
| 20 to 24 Years | 69 (100.0%) | 35 (50.7%) |
| 25 to 29 Years | 90 (100.0%) | 0 (0.0%) |
| 30 to 34 Years | 193 (100.0%) | 0 (0.0%) |
| 35 to 44 Years | 108 (91.5%) | 0 (0.0%) |
| 45 to 54 Years | 98 (86.7%) | 0 (0.0%) |
| 55 to 59 Years | 56 (81.2%) | 0 (0.0%) |
| 60 to 64 Years | 208 (83.5%) | 0 (0.0%) |
| 65 to 74 Years | 37 (8.0%) | 0 (0.0%) |
| 75 Years and over | 0 (0.0%) | 0 (0.0%) |
| Total | 859 (60.0%) | 35 (4.1%) |
Employment Status by Educational Attainment in North Puyallup
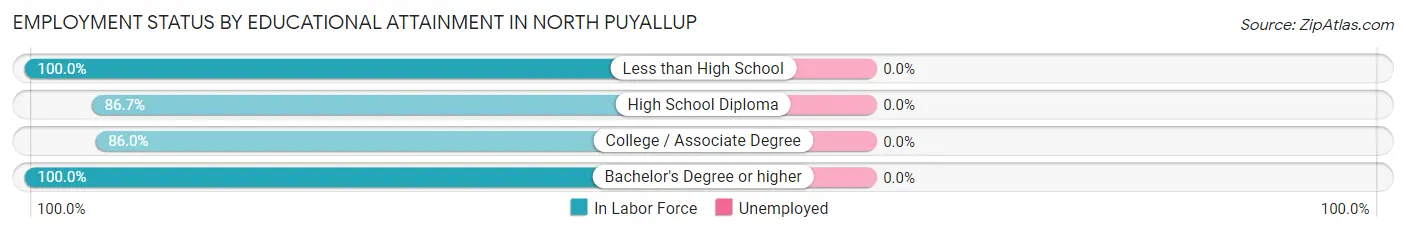
| Educational Attainment | In Labor Force | Unemployed |
| Less than High School | 29 (100.0%) | 0 (0.0%) |
| High School Diploma | 215 (86.7%) | 0 (0.0%) |
| College / Associate Degree | 283 (86.0%) | 0 (0.0%) |
| Bachelor's Degree or higher | 226 (100.0%) | 0 (0.0%) |
| Total | 753 (90.5%) | 0 (0.0%) |
Employment Occupations by Sex in North Puyallup
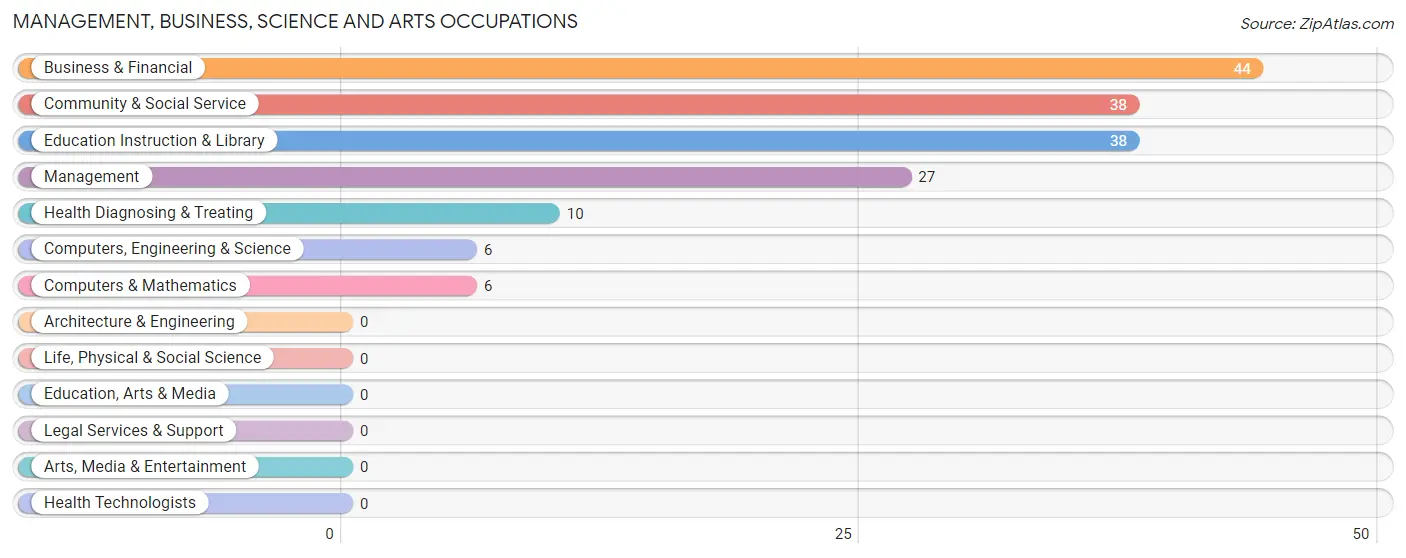
Management, Business, Science and Arts Occupations
The most common Management, Business, Science and Arts occupations in North Puyallup are Business & Financial (44 | 5.3%), Community & Social Service (38 | 4.6%), Education Instruction & Library (38 | 4.6%), Management (27 | 3.3%), and Health Diagnosing & Treating (10 | 1.2%).
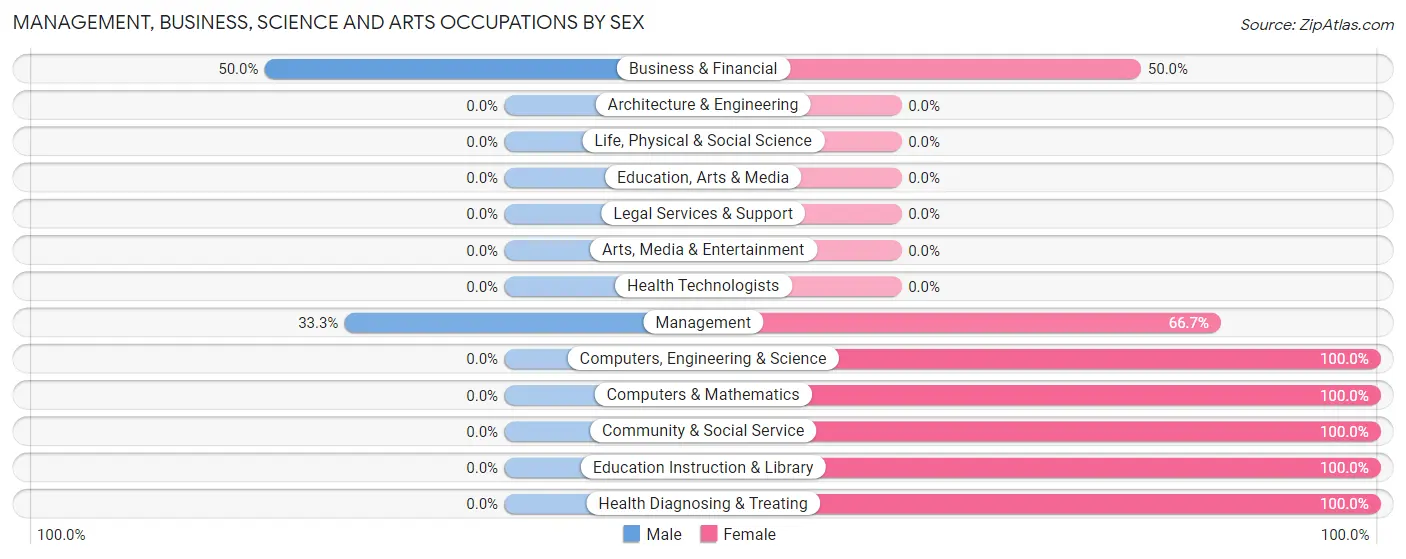
Management, Business, Science and Arts Occupations by Sex
Within the Management, Business, Science and Arts occupations in North Puyallup, the most male-oriented occupations are Business & Financial (50.0%), and Management (33.3%), while the most female-oriented occupations are Computers, Engineering & Science (100.0%), Computers & Mathematics (100.0%), and Community & Social Service (100.0%).
| Occupation | Male | Female |
| Management | 9 (33.3%) | 18 (66.7%) |
| Business & Financial | 22 (50.0%) | 22 (50.0%) |
| Computers, Engineering & Science | 0 (0.0%) | 6 (100.0%) |
| Computers & Mathematics | 0 (0.0%) | 6 (100.0%) |
| Architecture & Engineering | 0 (0.0%) | 0 (0.0%) |
| Life, Physical & Social Science | 0 (0.0%) | 0 (0.0%) |
| Community & Social Service | 0 (0.0%) | 38 (100.0%) |
| Education, Arts & Media | 0 (0.0%) | 0 (0.0%) |
| Legal Services & Support | 0 (0.0%) | 0 (0.0%) |
| Education Instruction & Library | 0 (0.0%) | 38 (100.0%) |
| Arts, Media & Entertainment | 0 (0.0%) | 0 (0.0%) |
| Health Diagnosing & Treating | 0 (0.0%) | 10 (100.0%) |
| Health Technologists | 0 (0.0%) | 0 (0.0%) |
| Total (Category) | 31 (24.8%) | 94 (75.2%) |
| Total (Overall) | 484 (58.7%) | 340 (41.3%) |
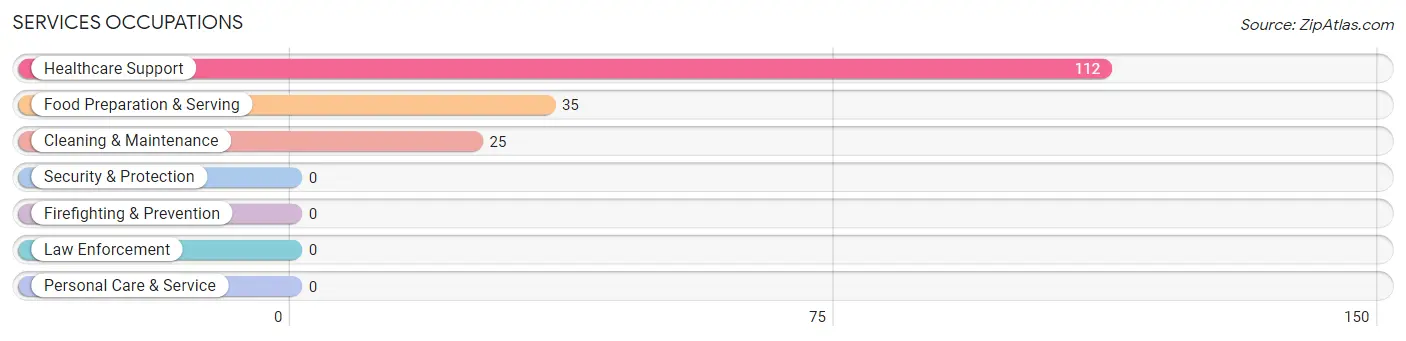
Services Occupations
The most common Services occupations in North Puyallup are Healthcare Support (112 | 13.6%), Food Preparation & Serving (35 | 4.3%), and Cleaning & Maintenance (25 | 3.0%).
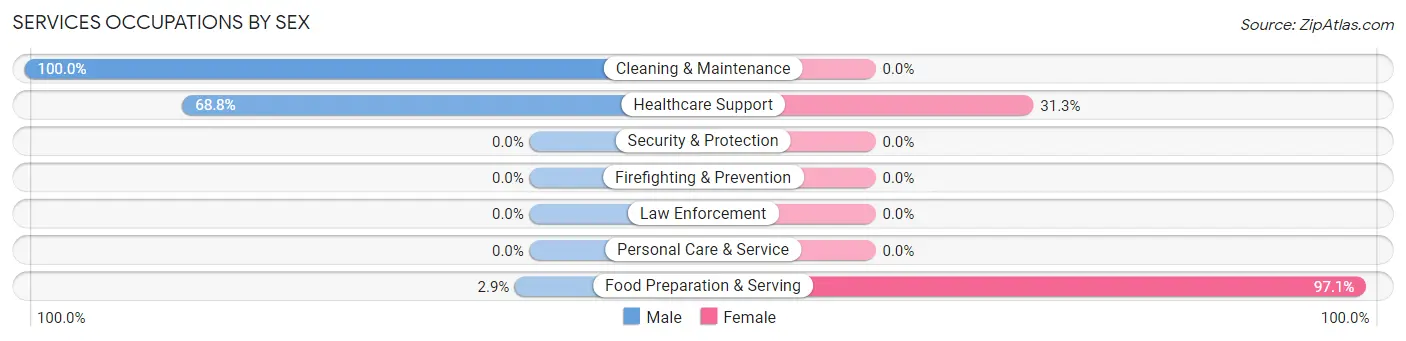
Services Occupations by Sex
Within the Services occupations in North Puyallup, the most male-oriented occupations are Cleaning & Maintenance (100.0%), Healthcare Support (68.8%), and Food Preparation & Serving (2.9%), while the most female-oriented occupations are Food Preparation & Serving (97.1%), and Healthcare Support (31.2%).
| Occupation | Male | Female |
| Healthcare Support | 77 (68.8%) | 35 (31.2%) |
| Security & Protection | 0 (0.0%) | 0 (0.0%) |
| Firefighting & Prevention | 0 (0.0%) | 0 (0.0%) |
| Law Enforcement | 0 (0.0%) | 0 (0.0%) |
| Food Preparation & Serving | 1 (2.9%) | 34 (97.1%) |
| Cleaning & Maintenance | 25 (100.0%) | 0 (0.0%) |
| Personal Care & Service | 0 (0.0%) | 0 (0.0%) |
| Total (Category) | 103 (59.9%) | 69 (40.1%) |
| Total (Overall) | 484 (58.7%) | 340 (41.3%) |
Sales and Office Occupations
The most common Sales and Office occupations in North Puyallup are Sales & Related (236 | 28.6%), and Office & Administration (81 | 9.8%).
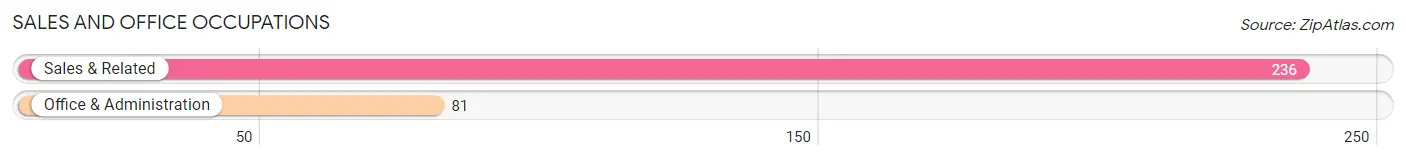
Sales and Office Occupations by Sex
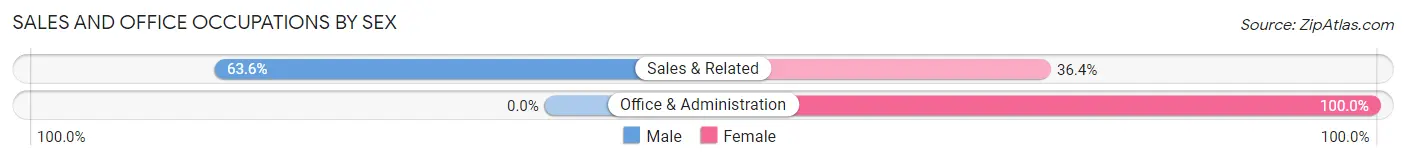
| Occupation | Male | Female |
| Sales & Related | 150 (63.6%) | 86 (36.4%) |
| Office & Administration | 0 (0.0%) | 81 (100.0%) |
| Total (Category) | 150 (47.3%) | 167 (52.7%) |
| Total (Overall) | 484 (58.7%) | 340 (41.3%) |
Natural Resources, Construction and Maintenance Occupations
The most common Natural Resources, Construction and Maintenance occupations in North Puyallup are Construction & Extraction (36 | 4.4%), and Installation, Maintenance & Repair (24 | 2.9%).
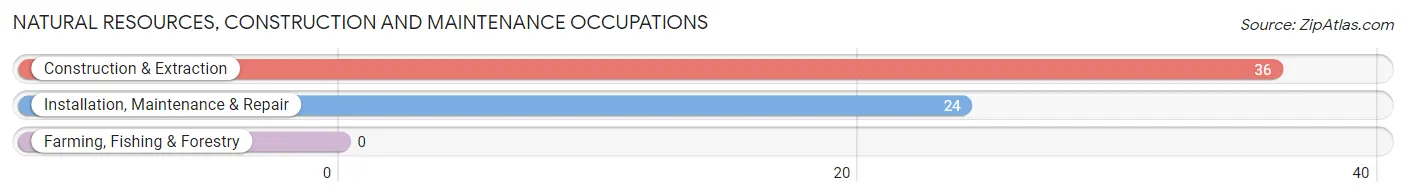
Natural Resources, Construction and Maintenance Occupations by Sex
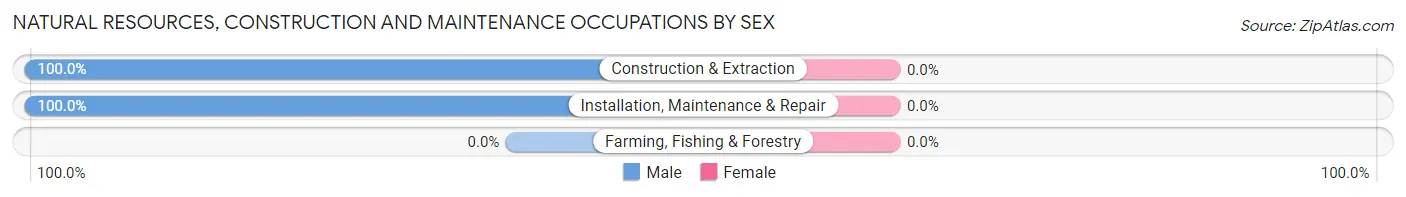
| Occupation | Male | Female |
| Farming, Fishing & Forestry | 0 (0.0%) | 0 (0.0%) |
| Construction & Extraction | 36 (100.0%) | 0 (0.0%) |
| Installation, Maintenance & Repair | 24 (100.0%) | 0 (0.0%) |
| Total (Category) | 60 (100.0%) | 0 (0.0%) |
| Total (Overall) | 484 (58.7%) | 340 (41.3%) |
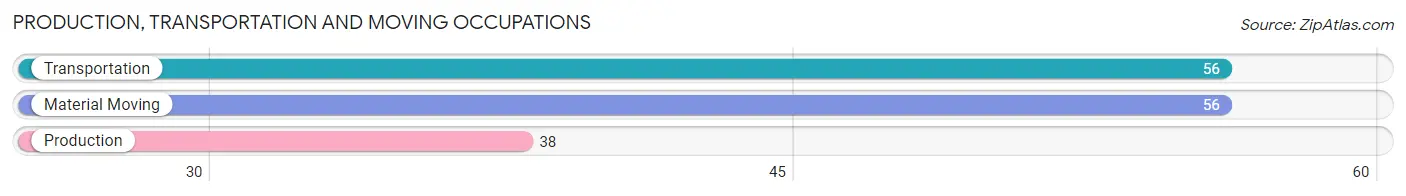
Production, Transportation and Moving Occupations
The most common Production, Transportation and Moving occupations in North Puyallup are Transportation (56 | 6.8%), Material Moving (56 | 6.8%), and Production (38 | 4.6%).
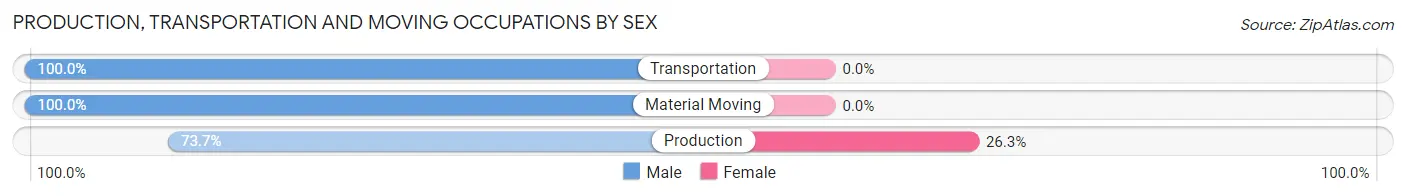
Production, Transportation and Moving Occupations by Sex
| Occupation | Male | Female |
| Production | 28 (73.7%) | 10 (26.3%) |
| Transportation | 56 (100.0%) | 0 (0.0%) |
| Material Moving | 56 (100.0%) | 0 (0.0%) |
| Total (Category) | 140 (93.3%) | 10 (6.7%) |
| Total (Overall) | 484 (58.7%) | 340 (41.3%) |
Employment Industries by Sex in North Puyallup
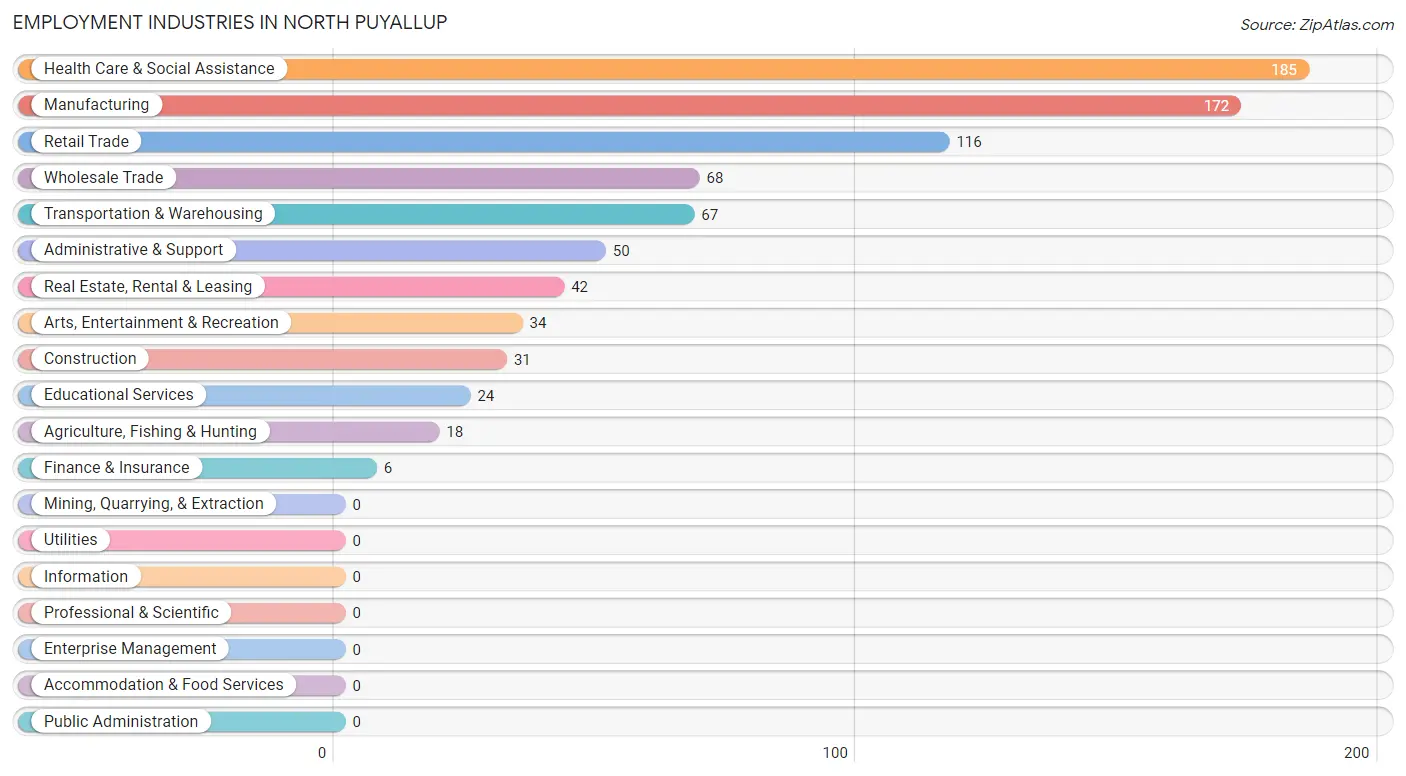
Employment Industries in North Puyallup
The major employment industries in North Puyallup include Health Care & Social Assistance (185 | 22.5%), Manufacturing (172 | 20.9%), Retail Trade (116 | 14.1%), Wholesale Trade (68 | 8.3%), and Transportation & Warehousing (67 | 8.1%).
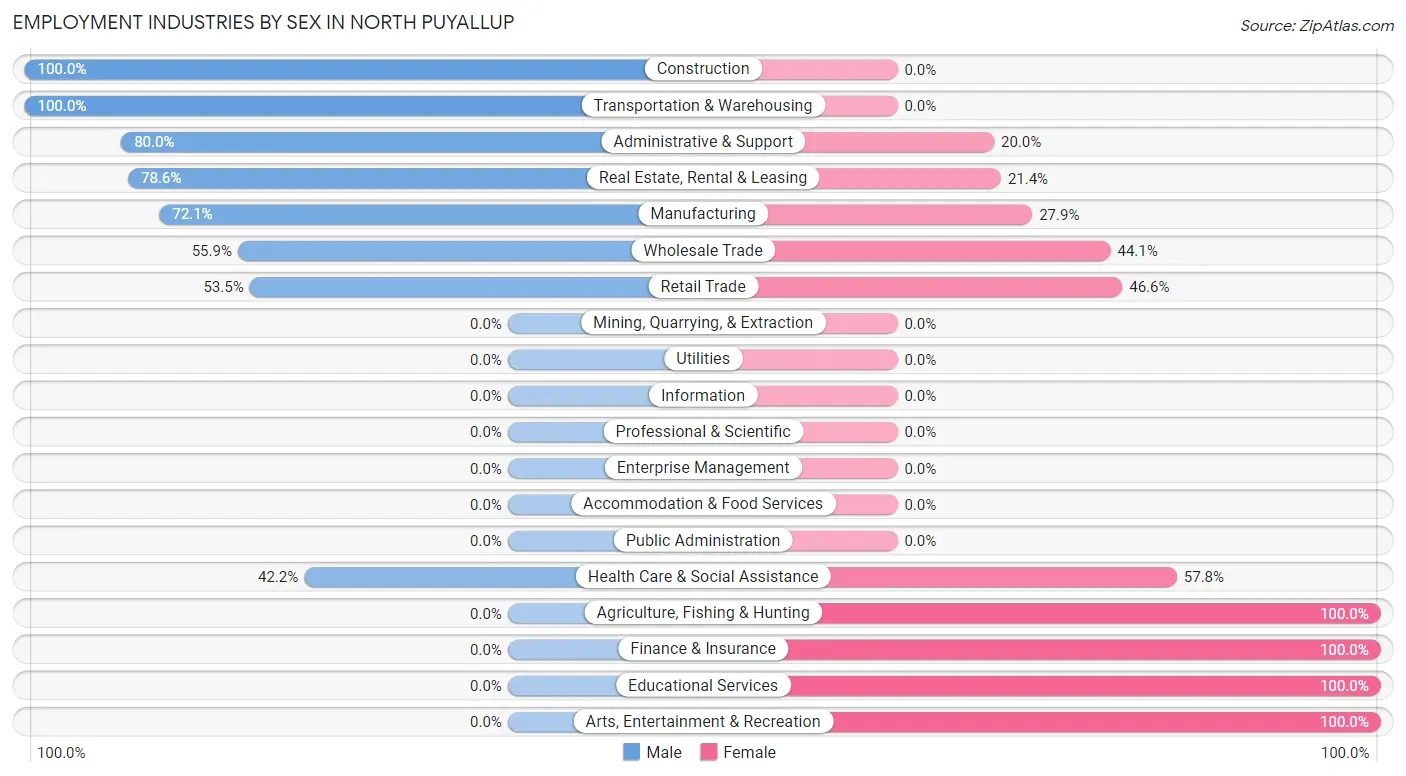
Employment Industries by Sex in North Puyallup
The North Puyallup industries that see more men than women are Construction (100.0%), Transportation & Warehousing (100.0%), and Administrative & Support (80.0%), whereas the industries that tend to have a higher number of women are Agriculture, Fishing & Hunting (100.0%), Finance & Insurance (100.0%), and Educational Services (100.0%).
| Industry | Male | Female |
| Agriculture, Fishing & Hunting | 0 (0.0%) | 18 (100.0%) |
| Mining, Quarrying, & Extraction | 0 (0.0%) | 0 (0.0%) |
| Construction | 31 (100.0%) | 0 (0.0%) |
| Manufacturing | 124 (72.1%) | 48 (27.9%) |
| Wholesale Trade | 38 (55.9%) | 30 (44.1%) |
| Retail Trade | 62 (53.4%) | 54 (46.6%) |
| Transportation & Warehousing | 67 (100.0%) | 0 (0.0%) |
| Utilities | 0 (0.0%) | 0 (0.0%) |
| Information | 0 (0.0%) | 0 (0.0%) |
| Finance & Insurance | 0 (0.0%) | 6 (100.0%) |
| Real Estate, Rental & Leasing | 33 (78.6%) | 9 (21.4%) |
| Professional & Scientific | 0 (0.0%) | 0 (0.0%) |
| Enterprise Management | 0 (0.0%) | 0 (0.0%) |
| Administrative & Support | 40 (80.0%) | 10 (20.0%) |
| Educational Services | 0 (0.0%) | 24 (100.0%) |
| Health Care & Social Assistance | 78 (42.2%) | 107 (57.8%) |
| Arts, Entertainment & Recreation | 0 (0.0%) | 34 (100.0%) |
| Accommodation & Food Services | 0 (0.0%) | 0 (0.0%) |
| Public Administration | 0 (0.0%) | 0 (0.0%) |
| Total | 484 (58.7%) | 340 (41.3%) |
Education in North Puyallup
School Enrollment in North Puyallup
The most common levels of schooling among the 155 students in North Puyallup are graduate / professional (45 | 29.0%), college / undergraduate (39 | 25.2%), and nursery / preschool (23 | 14.8%).
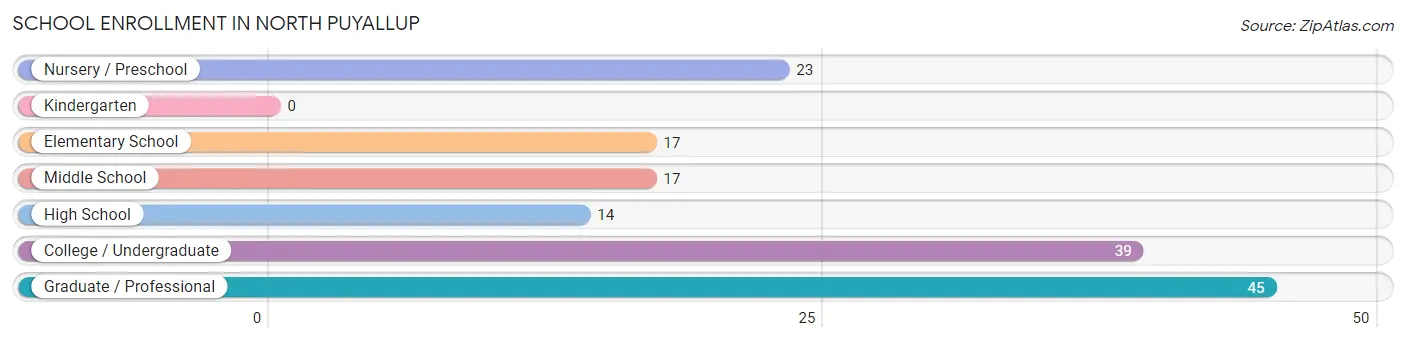
| School Level | # Students | % Students |
| Nursery / Preschool | 23 | 14.8% |
| Kindergarten | 0 | 0.0% |
| Elementary School | 17 | 11.0% |
| Middle School | 17 | 11.0% |
| High School | 14 | 9.0% |
| College / Undergraduate | 39 | 25.2% |
| Graduate / Professional | 45 | 29.0% |
| Total | 155 | 100.0% |
School Enrollment by Age by Funding Source in North Puyallup
Out of a total of 155 students who are enrolled in schools in North Puyallup, 34 (21.9%) attend a private institution, while the remaining 121 (78.1%) are enrolled in public schools. The age group of 20 to 24 year olds has the highest likelihood of being enrolled in private schools, with 34 (100.0% in the age bracket) enrolled. Conversely, the age group of 5 to 9 year old has the lowest likelihood of being enrolled in a private school, with 40 (100.0% in the age bracket) attending a public institution.
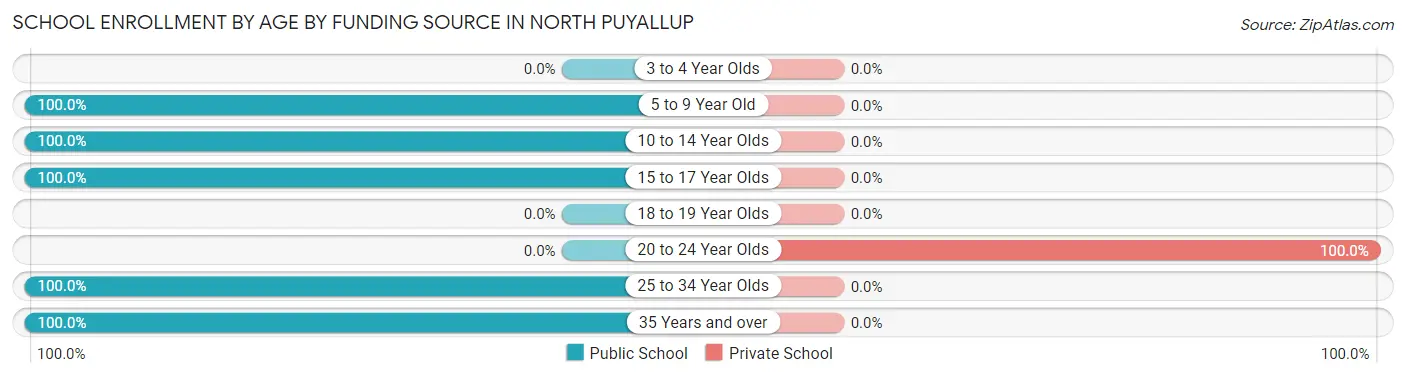
| Age Bracket | Public School | Private School |
| 3 to 4 Year Olds | 0 (0.0%) | 0 (0.0%) |
| 5 to 9 Year Old | 40 (100.0%) | 0 (0.0%) |
| 10 to 14 Year Olds | 17 (100.0%) | 0 (0.0%) |
| 15 to 17 Year Olds | 14 (100.0%) | 0 (0.0%) |
| 18 to 19 Year Olds | 0 (0.0%) | 0 (0.0%) |
| 20 to 24 Year Olds | 0 (0.0%) | 34 (100.0%) |
| 25 to 34 Year Olds | 5 (100.0%) | 0 (0.0%) |
| 35 Years and over | 45 (100.0%) | 0 (0.0%) |
| Total | 121 (78.1%) | 34 (21.9%) |
Educational Attainment by Field of Study in North Puyallup
Education (105 | 36.6%), science & technology (65 | 22.7%), business (33 | 11.5%), engineering (26 | 9.1%), and psychology (24 | 8.4%) are the most common fields of study among 287 individuals in North Puyallup who have obtained a bachelor's degree or higher.
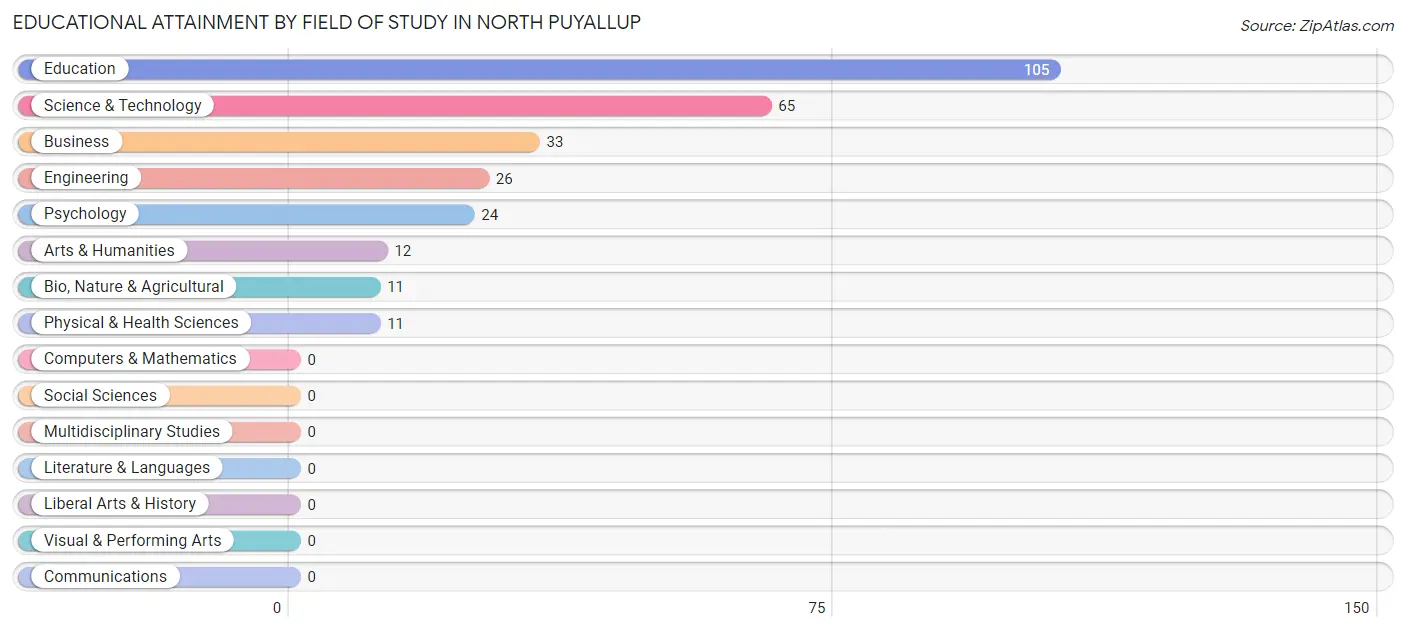
| Field of Study | # Graduates | % Graduates |
| Computers & Mathematics | 0 | 0.0% |
| Bio, Nature & Agricultural | 11 | 3.8% |
| Physical & Health Sciences | 11 | 3.8% |
| Psychology | 24 | 8.4% |
| Social Sciences | 0 | 0.0% |
| Engineering | 26 | 9.1% |
| Multidisciplinary Studies | 0 | 0.0% |
| Science & Technology | 65 | 22.7% |
| Business | 33 | 11.5% |
| Education | 105 | 36.6% |
| Literature & Languages | 0 | 0.0% |
| Liberal Arts & History | 0 | 0.0% |
| Visual & Performing Arts | 0 | 0.0% |
| Communications | 0 | 0.0% |
| Arts & Humanities | 12 | 4.2% |
| Total | 287 | 100.0% |
Transportation & Commute in North Puyallup
Vehicle Availability by Sex in North Puyallup
The most prevalent vehicle ownership categories in North Puyallup are males with 2 vehicles (315, accounting for 65.3%) and females with 2 vehicles (190, making up 92.6%).
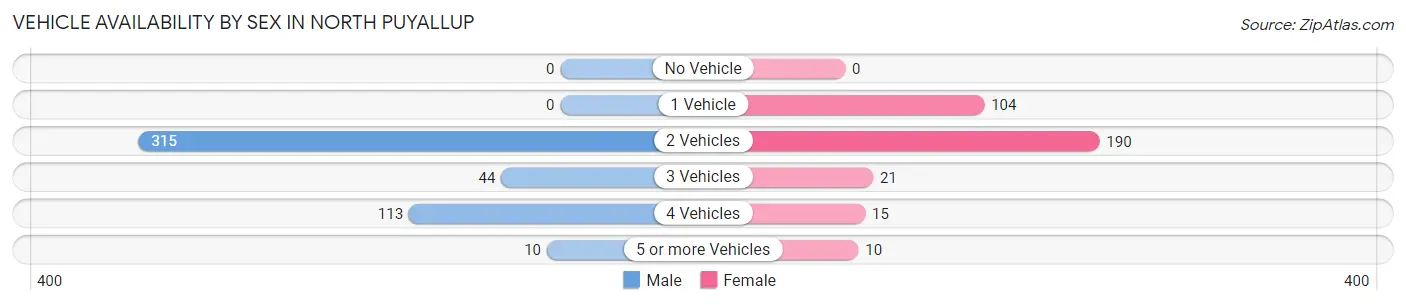
| Vehicles Available | Male | Female |
| No Vehicle | 0 (0.0%) | 0 (0.0%) |
| 1 Vehicle | 0 (0.0%) | 104 (30.6%) |
| 2 Vehicles | 315 (65.3%) | 190 (55.9%) |
| 3 Vehicles | 44 (9.1%) | 21 (6.2%) |
| 4 Vehicles | 113 (23.4%) | 15 (4.4%) |
| 5 or more Vehicles | 10 (2.1%) | 10 (2.9%) |
| Total | 482 (100.0%) | 340 (100.0%) |
Commute Time in North Puyallup
The most frequently occuring commute durations in North Puyallup are 25 to 29 minutes (133 commuters, 20.5%), 30 to 34 minutes (106 commuters, 16.3%), and 20 to 24 minutes (89 commuters, 13.7%).
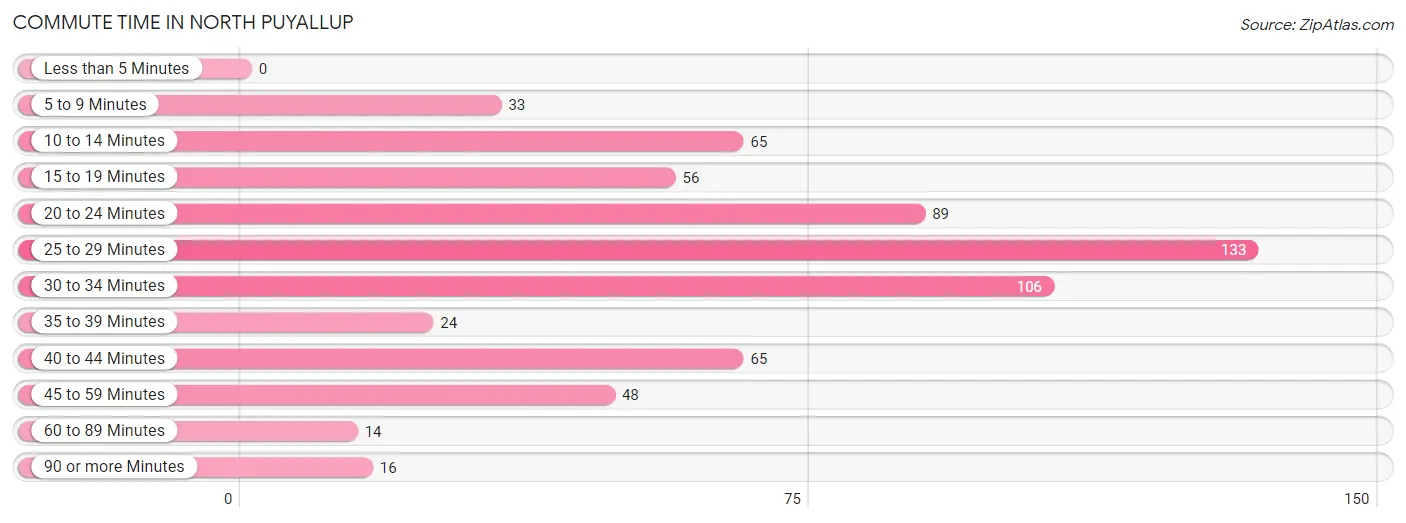
| Commute Time | # Commuters | % Commuters |
| Less than 5 Minutes | 0 | 0.0% |
| 5 to 9 Minutes | 33 | 5.1% |
| 10 to 14 Minutes | 65 | 10.0% |
| 15 to 19 Minutes | 56 | 8.6% |
| 20 to 24 Minutes | 89 | 13.7% |
| 25 to 29 Minutes | 133 | 20.5% |
| 30 to 34 Minutes | 106 | 16.3% |
| 35 to 39 Minutes | 24 | 3.7% |
| 40 to 44 Minutes | 65 | 10.0% |
| 45 to 59 Minutes | 48 | 7.4% |
| 60 to 89 Minutes | 14 | 2.2% |
| 90 or more Minutes | 16 | 2.5% |
Commute Time by Sex in North Puyallup
The most common commute times in North Puyallup are 25 to 29 minutes (103 commuters, 28.3%) for males and 30 to 34 minutes (81 commuters, 28.4%) for females.
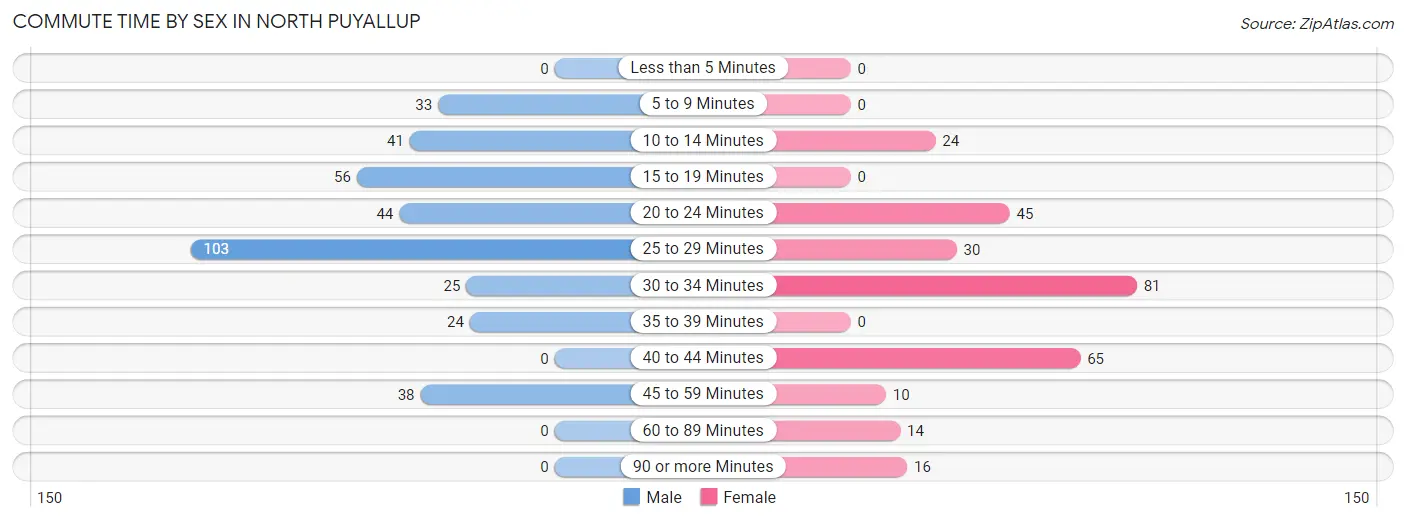
| Commute Time | Male | Female |
| Less than 5 Minutes | 0 (0.0%) | 0 (0.0%) |
| 5 to 9 Minutes | 33 (9.1%) | 0 (0.0%) |
| 10 to 14 Minutes | 41 (11.3%) | 24 (8.4%) |
| 15 to 19 Minutes | 56 (15.4%) | 0 (0.0%) |
| 20 to 24 Minutes | 44 (12.1%) | 45 (15.8%) |
| 25 to 29 Minutes | 103 (28.3%) | 30 (10.5%) |
| 30 to 34 Minutes | 25 (6.9%) | 81 (28.4%) |
| 35 to 39 Minutes | 24 (6.6%) | 0 (0.0%) |
| 40 to 44 Minutes | 0 (0.0%) | 65 (22.8%) |
| 45 to 59 Minutes | 38 (10.4%) | 10 (3.5%) |
| 60 to 89 Minutes | 0 (0.0%) | 14 (4.9%) |
| 90 or more Minutes | 0 (0.0%) | 16 (5.6%) |
Time of Departure to Work by Sex in North Puyallup
The most frequent times of departure to work in North Puyallup are 4:00 PM to 11:59 PM (85, 23.4%) for males and 7:00 AM to 7:29 AM (90, 31.6%) for females.
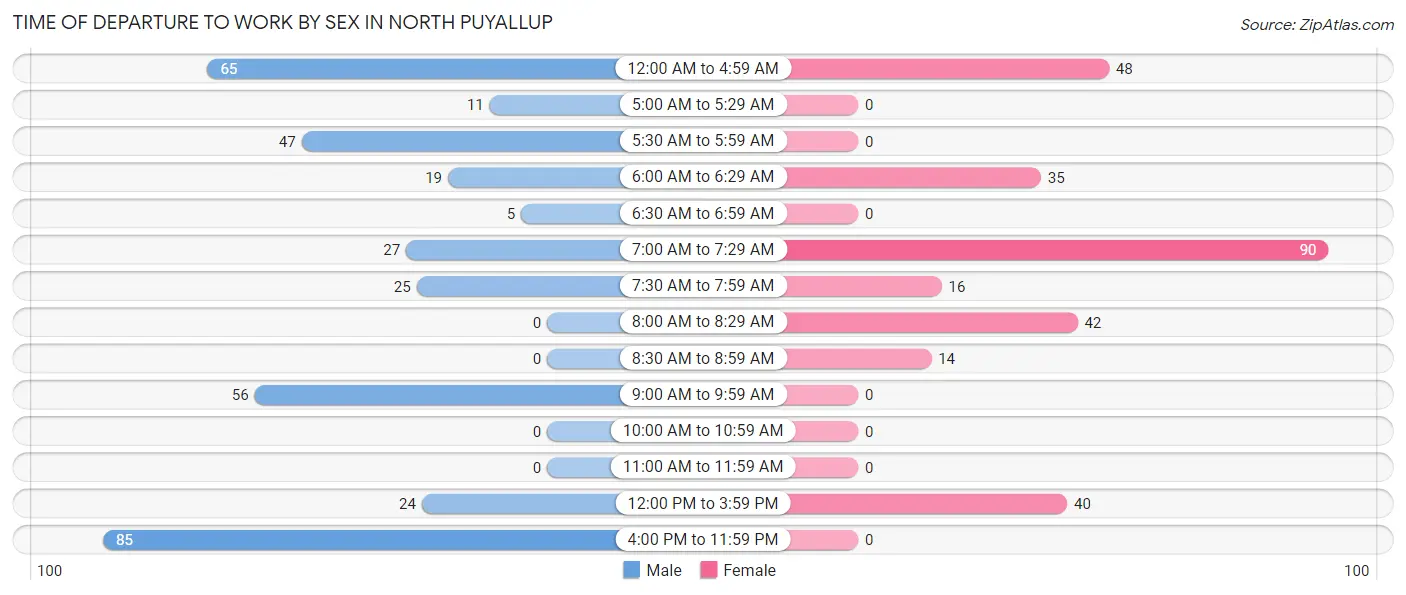
| Time of Departure | Male | Female |
| 12:00 AM to 4:59 AM | 65 (17.9%) | 48 (16.8%) |
| 5:00 AM to 5:29 AM | 11 (3.0%) | 0 (0.0%) |
| 5:30 AM to 5:59 AM | 47 (12.9%) | 0 (0.0%) |
| 6:00 AM to 6:29 AM | 19 (5.2%) | 35 (12.3%) |
| 6:30 AM to 6:59 AM | 5 (1.4%) | 0 (0.0%) |
| 7:00 AM to 7:29 AM | 27 (7.4%) | 90 (31.6%) |
| 7:30 AM to 7:59 AM | 25 (6.9%) | 16 (5.6%) |
| 8:00 AM to 8:29 AM | 0 (0.0%) | 42 (14.7%) |
| 8:30 AM to 8:59 AM | 0 (0.0%) | 14 (4.9%) |
| 9:00 AM to 9:59 AM | 56 (15.4%) | 0 (0.0%) |
| 10:00 AM to 10:59 AM | 0 (0.0%) | 0 (0.0%) |
| 11:00 AM to 11:59 AM | 0 (0.0%) | 0 (0.0%) |
| 12:00 PM to 3:59 PM | 24 (6.6%) | 40 (14.0%) |
| 4:00 PM to 11:59 PM | 85 (23.4%) | 0 (0.0%) |
| Total | 364 (100.0%) | 285 (100.0%) |
Housing Occupancy in North Puyallup
Occupancy by Ownership in North Puyallup
Of the total 839 dwellings in North Puyallup, owner-occupied units account for 668 (79.6%), while renter-occupied units make up 171 (20.4%).
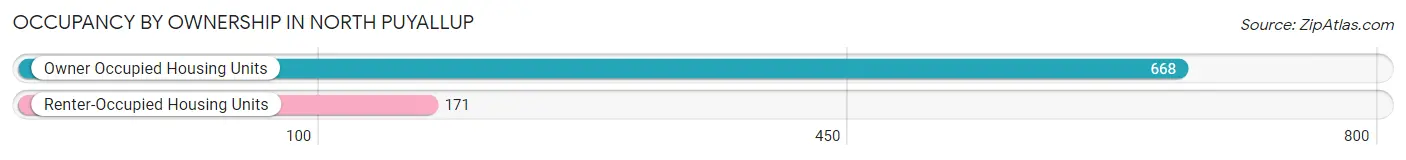
| Occupancy | # Housing Units | % Housing Units |
| Owner Occupied Housing Units | 668 | 79.6% |
| Renter-Occupied Housing Units | 171 | 20.4% |
| Total Occupied Housing Units | 839 | 100.0% |
Occupancy by Household Size in North Puyallup
| Household Size | # Housing Units | % Housing Units |
| 1-Person Household | 222 | 26.5% |
| 2-Person Household | 460 | 54.8% |
| 3-Person Household | 136 | 16.2% |
| 4+ Person Household | 21 | 2.5% |
| Total Housing Units | 839 | 100.0% |
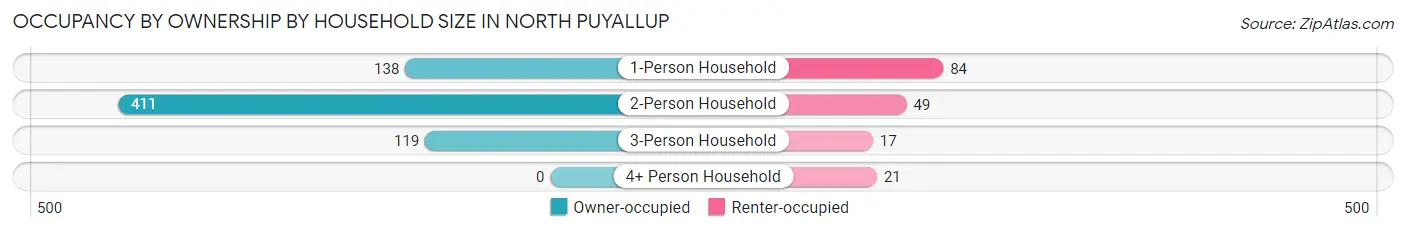
Occupancy by Ownership by Household Size in North Puyallup
| Household Size | Owner-occupied | Renter-occupied |
| 1-Person Household | 138 (62.2%) | 84 (37.8%) |
| 2-Person Household | 411 (89.3%) | 49 (10.6%) |
| 3-Person Household | 119 (87.5%) | 17 (12.5%) |
| 4+ Person Household | 0 (0.0%) | 21 (100.0%) |
| Total Housing Units | 668 (79.6%) | 171 (20.4%) |
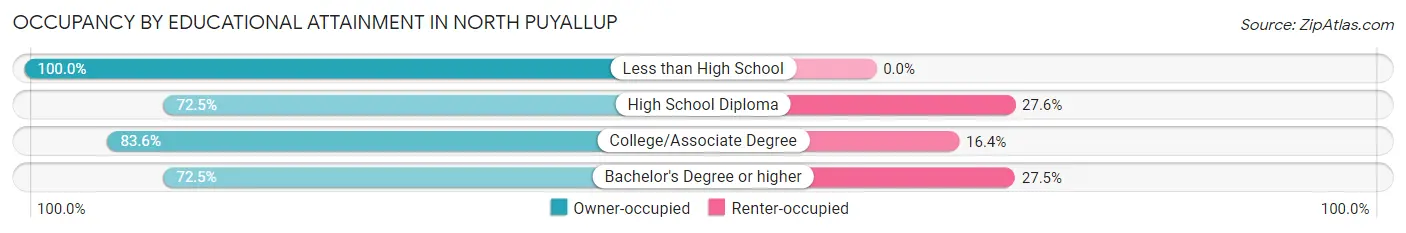
Occupancy by Educational Attainment in North Puyallup
| Household Size | Owner-occupied | Renter-occupied |
| Less than High School | 39 (100.0%) | 0 (0.0%) |
| High School Diploma | 142 (72.5%) | 54 (27.6%) |
| College/Associate Degree | 371 (83.6%) | 73 (16.4%) |
| Bachelor's Degree or higher | 116 (72.5%) | 44 (27.5%) |
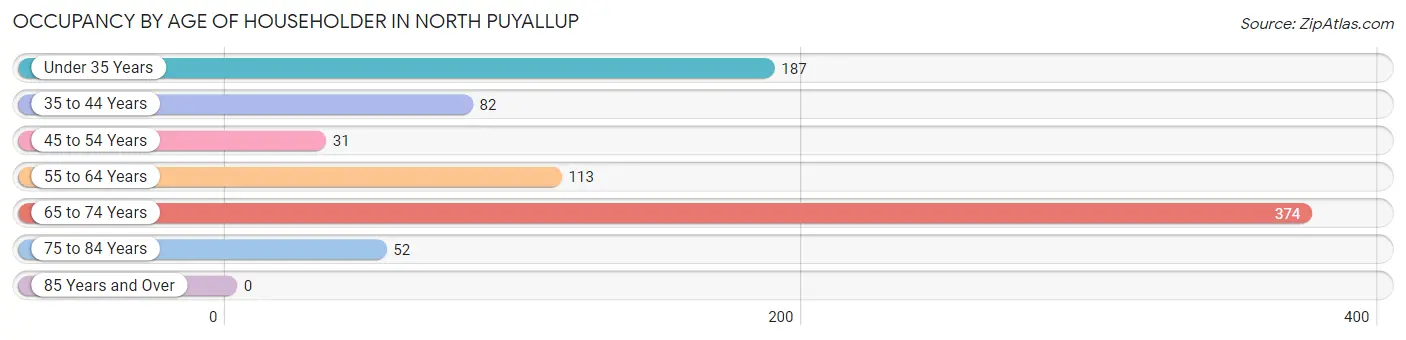
Occupancy by Age of Householder in North Puyallup
| Age Bracket | # Households | % Households |
| Under 35 Years | 187 | 22.3% |
| 35 to 44 Years | 82 | 9.8% |
| 45 to 54 Years | 31 | 3.7% |
| 55 to 64 Years | 113 | 13.5% |
| 65 to 74 Years | 374 | 44.6% |
| 75 to 84 Years | 52 | 6.2% |
| 85 Years and Over | 0 | 0.0% |
| Total | 839 | 100.0% |
Housing Finances in North Puyallup
Median Income by Occupancy in North Puyallup
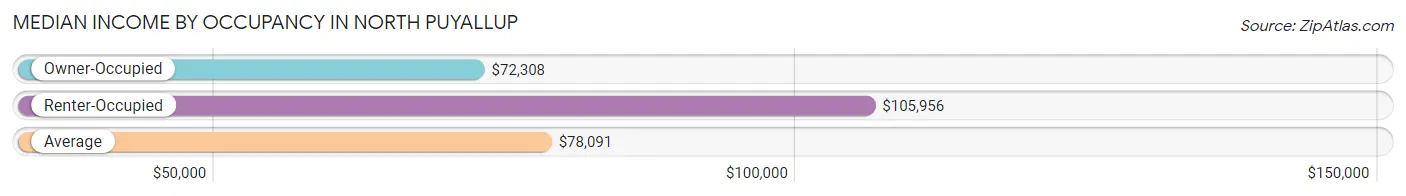
| Occupancy Type | # Households | Median Income |
| Owner-Occupied | 668 (79.6%) | $72,308 |
| Renter-Occupied | 171 (20.4%) | $105,956 |
| Average | 839 (100.0%) | $78,091 |
Occupancy by Householder Income Bracket in North Puyallup
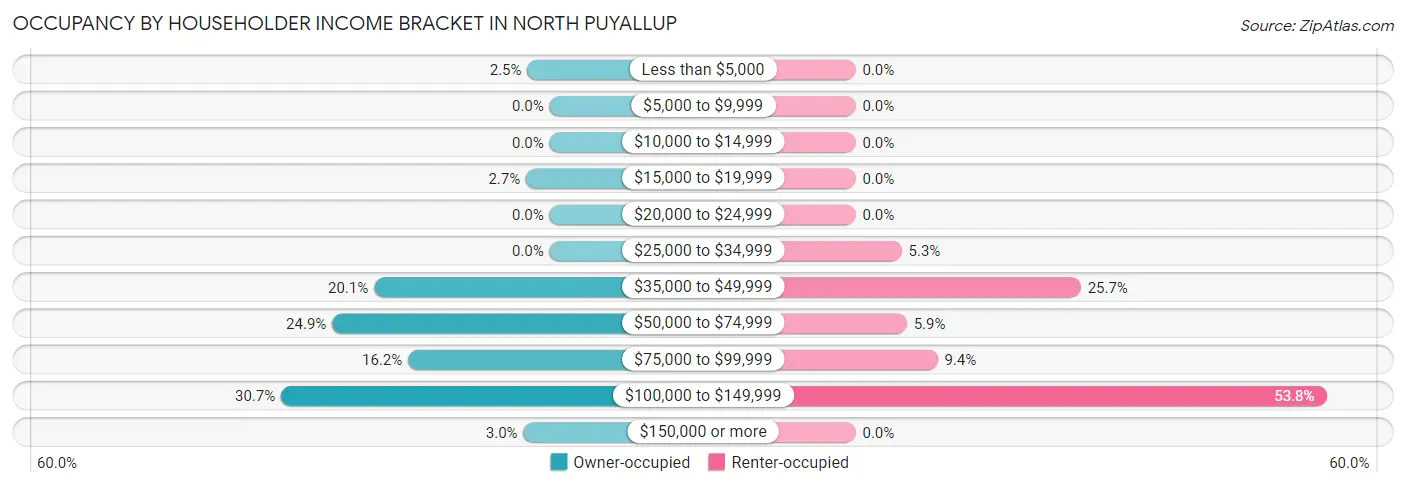
| Income Bracket | Owner-occupied | Renter-occupied |
| Less than $5,000 | 17 (2.5%) | 0 (0.0%) |
| $5,000 to $9,999 | 0 (0.0%) | 0 (0.0%) |
| $10,000 to $14,999 | 0 (0.0%) | 0 (0.0%) |
| $15,000 to $19,999 | 18 (2.7%) | 0 (0.0%) |
| $20,000 to $24,999 | 0 (0.0%) | 0 (0.0%) |
| $25,000 to $34,999 | 0 (0.0%) | 9 (5.3%) |
| $35,000 to $49,999 | 134 (20.1%) | 44 (25.7%) |
| $50,000 to $74,999 | 166 (24.8%) | 10 (5.9%) |
| $75,000 to $99,999 | 108 (16.2%) | 16 (9.4%) |
| $100,000 to $149,999 | 205 (30.7%) | 92 (53.8%) |
| $150,000 or more | 20 (3.0%) | 0 (0.0%) |
| Total | 668 (100.0%) | 171 (100.0%) |
Monthly Housing Cost Tiers in North Puyallup
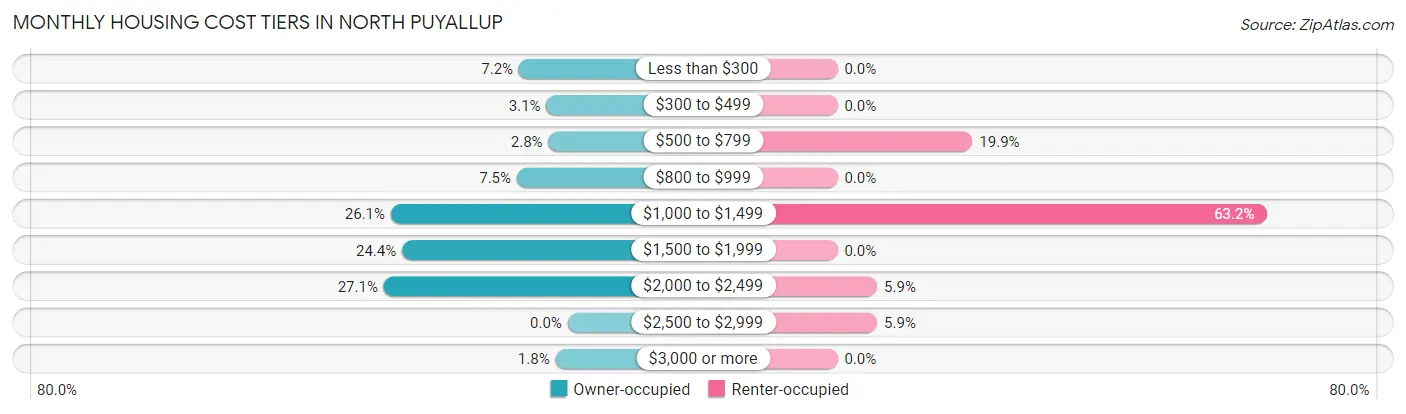
| Monthly Cost | Owner-occupied | Renter-occupied |
| Less than $300 | 48 (7.2%) | 0 (0.0%) |
| $300 to $499 | 21 (3.1%) | 0 (0.0%) |
| $500 to $799 | 19 (2.8%) | 34 (19.9%) |
| $800 to $999 | 50 (7.5%) | 0 (0.0%) |
| $1,000 to $1,499 | 174 (26.1%) | 108 (63.2%) |
| $1,500 to $1,999 | 163 (24.4%) | 0 (0.0%) |
| $2,000 to $2,499 | 181 (27.1%) | 10 (5.9%) |
| $2,500 to $2,999 | 0 (0.0%) | 10 (5.9%) |
| $3,000 or more | 12 (1.8%) | 0 (0.0%) |
| Total | 668 (100.0%) | 171 (100.0%) |
Physical Housing Characteristics in North Puyallup
Housing Structures in North Puyallup
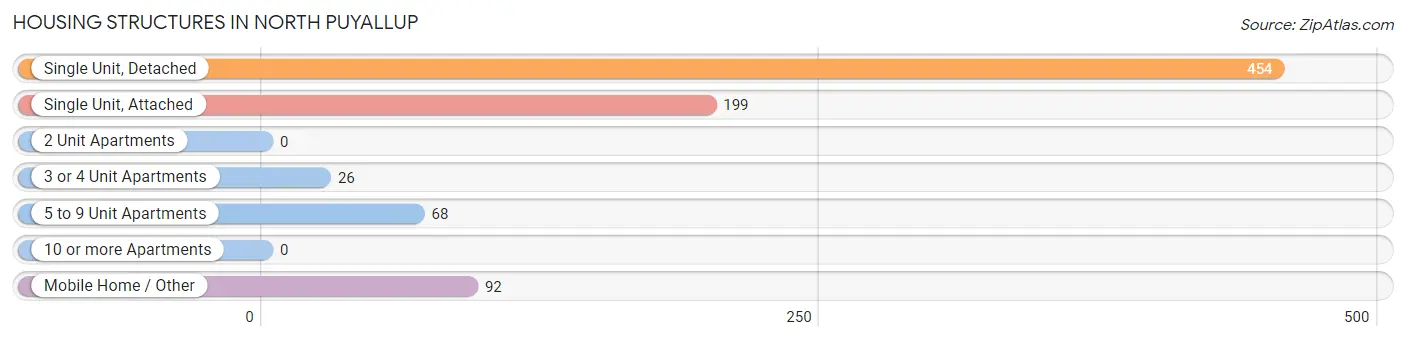
| Structure Type | # Housing Units | % Housing Units |
| Single Unit, Detached | 454 | 54.1% |
| Single Unit, Attached | 199 | 23.7% |
| 2 Unit Apartments | 0 | 0.0% |
| 3 or 4 Unit Apartments | 26 | 3.1% |
| 5 to 9 Unit Apartments | 68 | 8.1% |
| 10 or more Apartments | 0 | 0.0% |
| Mobile Home / Other | 92 | 11.0% |
| Total | 839 | 100.0% |
Housing Structures by Occupancy in North Puyallup
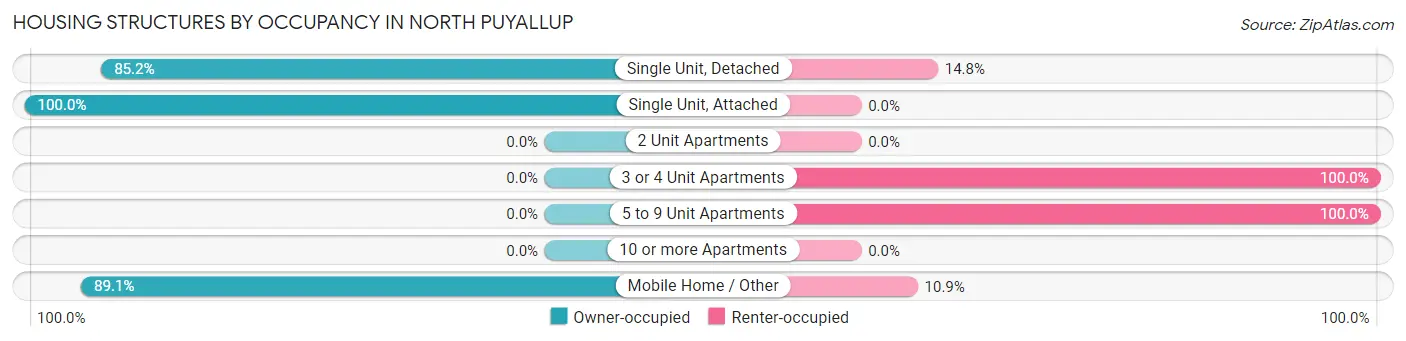
| Structure Type | Owner-occupied | Renter-occupied |
| Single Unit, Detached | 387 (85.2%) | 67 (14.8%) |
| Single Unit, Attached | 199 (100.0%) | 0 (0.0%) |
| 2 Unit Apartments | 0 (0.0%) | 0 (0.0%) |
| 3 or 4 Unit Apartments | 0 (0.0%) | 26 (100.0%) |
| 5 to 9 Unit Apartments | 0 (0.0%) | 68 (100.0%) |
| 10 or more Apartments | 0 (0.0%) | 0 (0.0%) |
| Mobile Home / Other | 82 (89.1%) | 10 (10.9%) |
| Total | 668 (79.6%) | 171 (20.4%) |
Housing Structures by Number of Rooms in North Puyallup
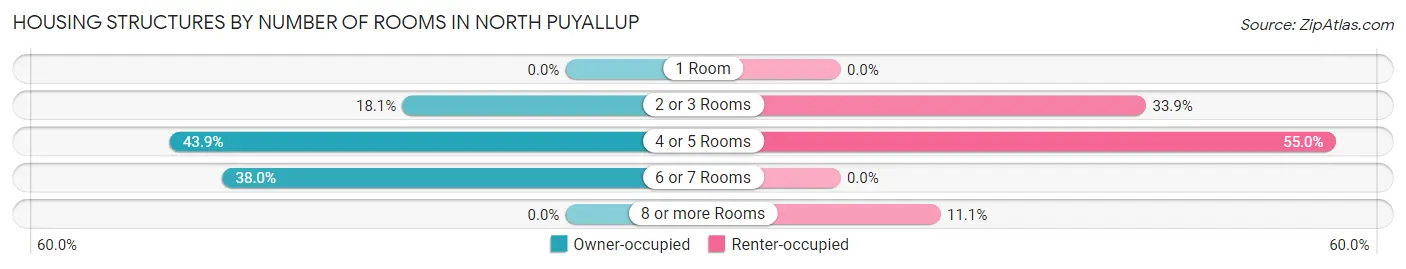
| Number of Rooms | Owner-occupied | Renter-occupied |
| 1 Room | 0 (0.0%) | 0 (0.0%) |
| 2 or 3 Rooms | 121 (18.1%) | 58 (33.9%) |
| 4 or 5 Rooms | 293 (43.9%) | 94 (55.0%) |
| 6 or 7 Rooms | 254 (38.0%) | 0 (0.0%) |
| 8 or more Rooms | 0 (0.0%) | 19 (11.1%) |
| Total | 668 (100.0%) | 171 (100.0%) |
Housing Structure by Heating Type in North Puyallup
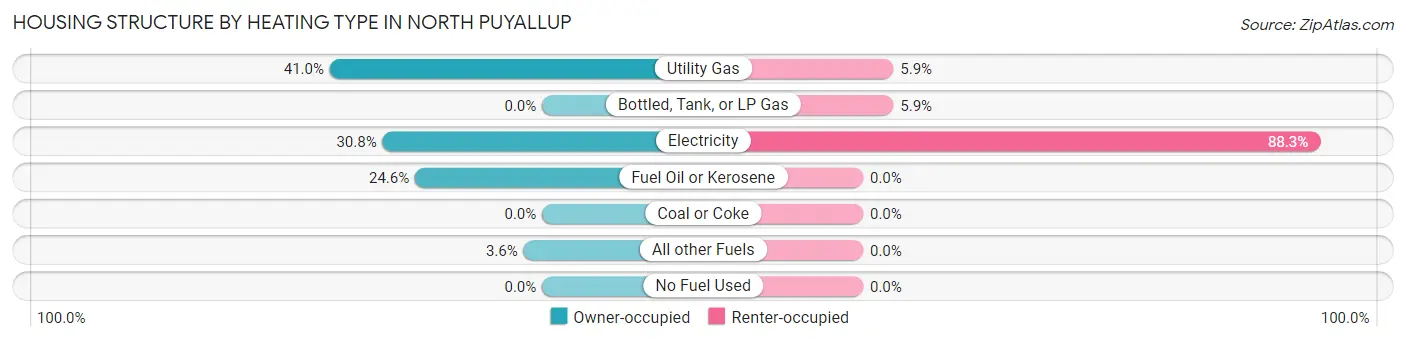
| Heating Type | Owner-occupied | Renter-occupied |
| Utility Gas | 274 (41.0%) | 10 (5.9%) |
| Bottled, Tank, or LP Gas | 0 (0.0%) | 10 (5.9%) |
| Electricity | 206 (30.8%) | 151 (88.3%) |
| Fuel Oil or Kerosene | 164 (24.5%) | 0 (0.0%) |
| Coal or Coke | 0 (0.0%) | 0 (0.0%) |
| All other Fuels | 24 (3.6%) | 0 (0.0%) |
| No Fuel Used | 0 (0.0%) | 0 (0.0%) |
| Total | 668 (100.0%) | 171 (100.0%) |
Household Vehicle Usage in North Puyallup
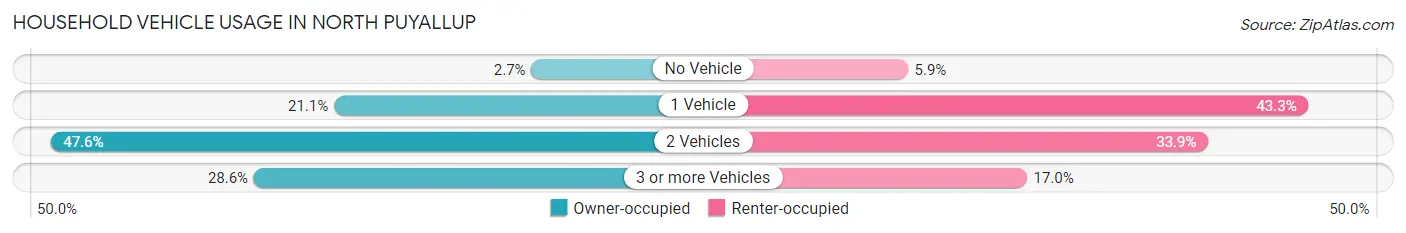
| Vehicles per Household | Owner-occupied | Renter-occupied |
| No Vehicle | 18 (2.7%) | 10 (5.9%) |
| 1 Vehicle | 141 (21.1%) | 74 (43.3%) |
| 2 Vehicles | 318 (47.6%) | 58 (33.9%) |
| 3 or more Vehicles | 191 (28.6%) | 29 (17.0%) |
| Total | 668 (100.0%) | 171 (100.0%) |
Real Estate & Mortgages in North Puyallup
Real Estate and Mortgage Overview in North Puyallup
| Characteristic | Without Mortgage | With Mortgage |
| Housing Units | 189 | 479 |
| Median Property Value | $100,700 | $343,200 |
| Median Household Income | $58,875 | $20 |
| Monthly Housing Costs | $865 | $12 |
| Real Estate Taxes | $2,260 | $48 |
Property Value by Mortgage Status in North Puyallup
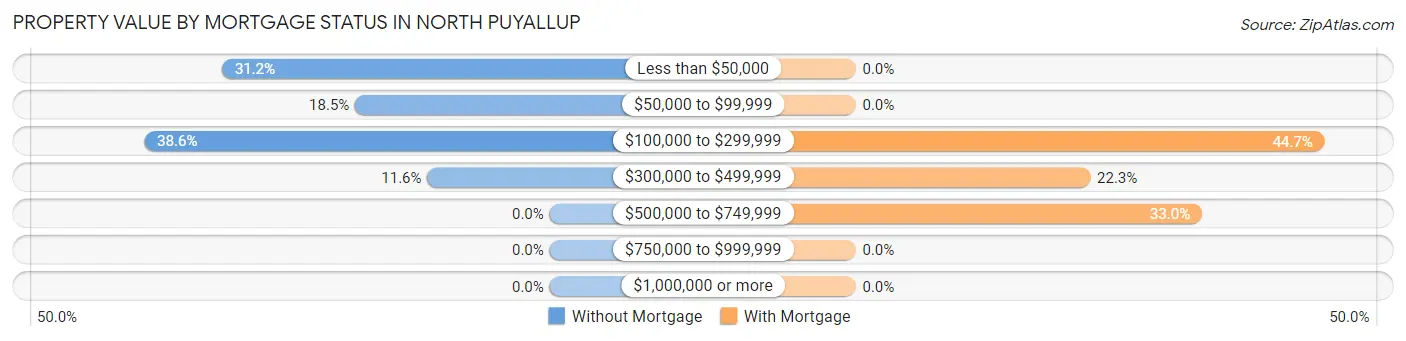
| Property Value | Without Mortgage | With Mortgage |
| Less than $50,000 | 59 (31.2%) | 0 (0.0%) |
| $50,000 to $99,999 | 35 (18.5%) | 0 (0.0%) |
| $100,000 to $299,999 | 73 (38.6%) | 214 (44.7%) |
| $300,000 to $499,999 | 22 (11.6%) | 107 (22.3%) |
| $500,000 to $749,999 | 0 (0.0%) | 158 (33.0%) |
| $750,000 to $999,999 | 0 (0.0%) | 0 (0.0%) |
| $1,000,000 or more | 0 (0.0%) | 0 (0.0%) |
| Total | 189 (100.0%) | 479 (100.0%) |
Household Income by Mortgage Status in North Puyallup
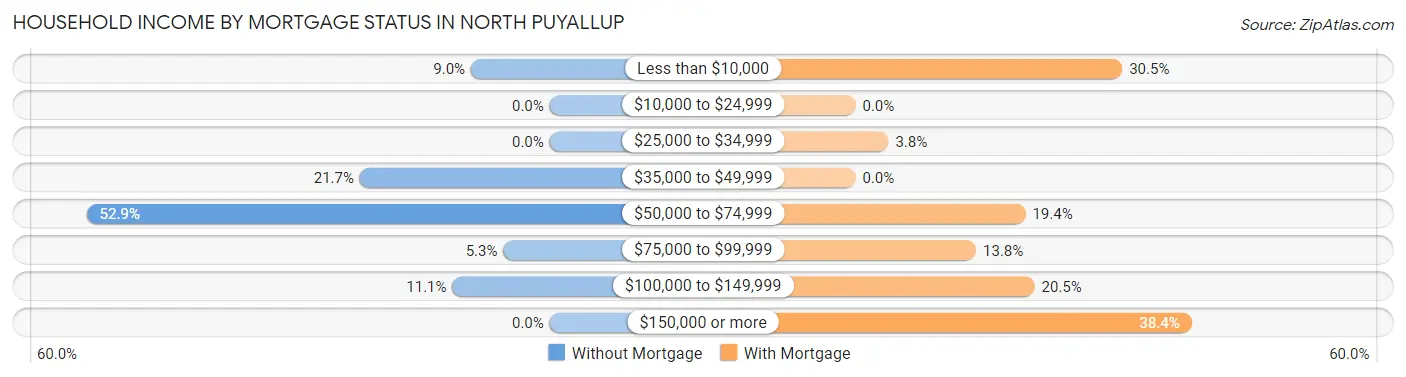
| Household Income | Without Mortgage | With Mortgage |
| Less than $10,000 | 17 (9.0%) | 146 (30.5%) |
| $10,000 to $24,999 | 0 (0.0%) | 0 (0.0%) |
| $25,000 to $34,999 | 0 (0.0%) | 18 (3.8%) |
| $35,000 to $49,999 | 41 (21.7%) | 0 (0.0%) |
| $50,000 to $74,999 | 100 (52.9%) | 93 (19.4%) |
| $75,000 to $99,999 | 10 (5.3%) | 66 (13.8%) |
| $100,000 to $149,999 | 21 (11.1%) | 98 (20.5%) |
| $150,000 or more | 0 (0.0%) | 184 (38.4%) |
| Total | 189 (100.0%) | 479 (100.0%) |
Property Value to Household Income Ratio in North Puyallup
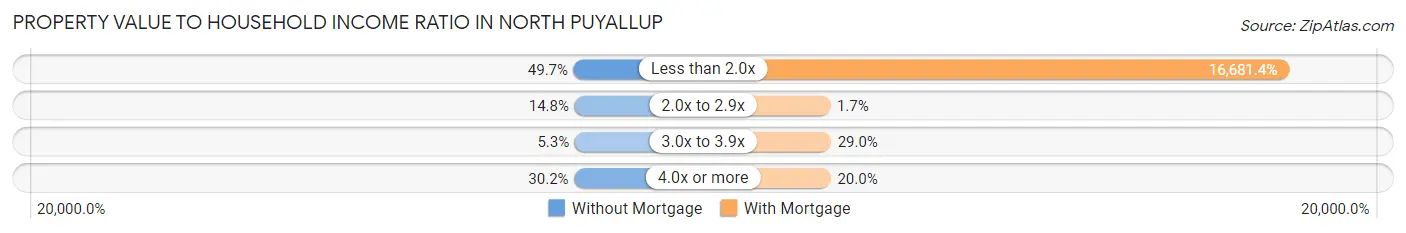
| Value-to-Income Ratio | Without Mortgage | With Mortgage |
| Less than 2.0x | 94 (49.7%) | 79,904 (16,681.4%) |
| 2.0x to 2.9x | 28 (14.8%) | 8 (1.7%) |
| 3.0x to 3.9x | 10 (5.3%) | 139 (29.0%) |
| 4.0x or more | 57 (30.2%) | 96 (20.0%) |
| Total | 189 (100.0%) | 479 (100.0%) |
Real Estate Taxes by Mortgage Status in North Puyallup
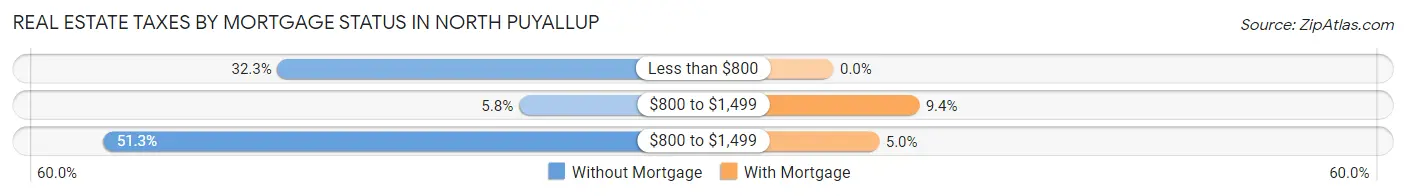
| Property Taxes | Without Mortgage | With Mortgage |
| Less than $800 | 61 (32.3%) | 0 (0.0%) |
| $800 to $1,499 | 11 (5.8%) | 45 (9.4%) |
| $800 to $1,499 | 97 (51.3%) | 24 (5.0%) |
| Total | 189 (100.0%) | 479 (100.0%) |
Health & Disability in North Puyallup
Health Insurance Coverage by Age in North Puyallup
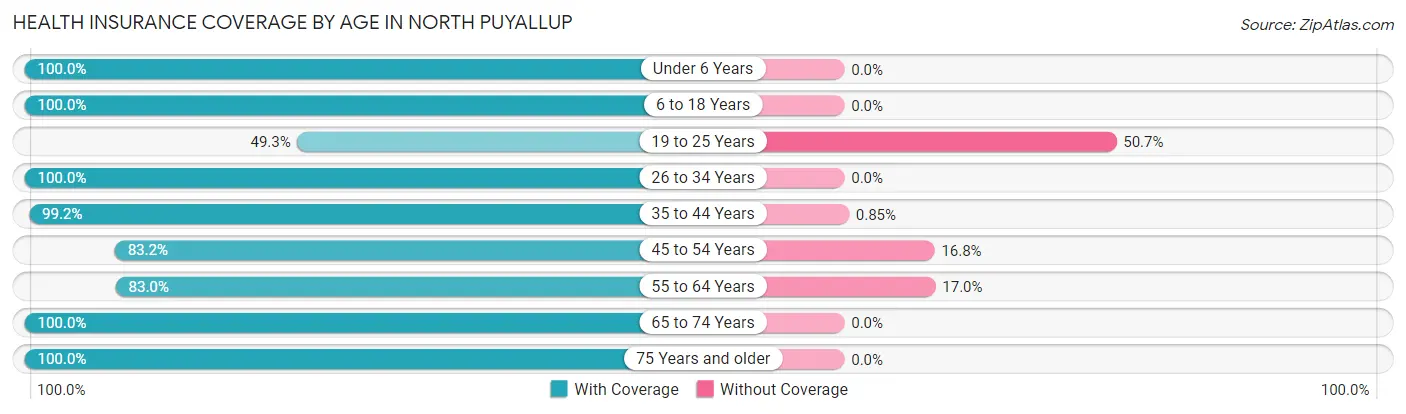
| Age Bracket | With Coverage | Without Coverage |
| Under 6 Years | 65 (100.0%) | 0 (0.0%) |
| 6 to 18 Years | 48 (100.0%) | 0 (0.0%) |
| 19 to 25 Years | 34 (49.3%) | 35 (50.7%) |
| 26 to 34 Years | 283 (100.0%) | 0 (0.0%) |
| 35 to 44 Years | 117 (99.2%) | 1 (0.9%) |
| 45 to 54 Years | 94 (83.2%) | 19 (16.8%) |
| 55 to 64 Years | 264 (83.0%) | 54 (17.0%) |
| 65 to 74 Years | 463 (100.0%) | 0 (0.0%) |
| 75 Years and older | 67 (100.0%) | 0 (0.0%) |
| Total | 1,435 (92.9%) | 109 (7.1%) |
Health Insurance Coverage by Citizenship Status in North Puyallup
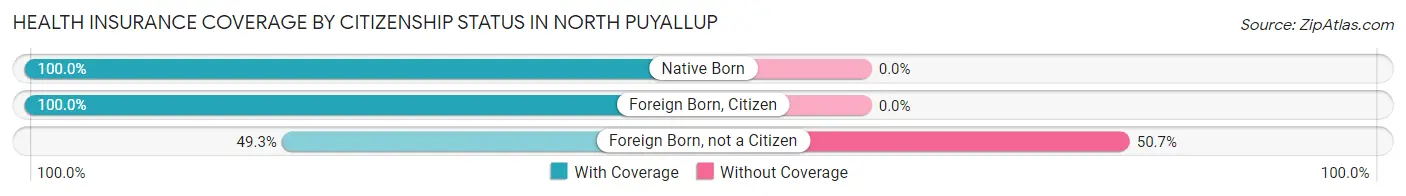
| Citizenship Status | With Coverage | Without Coverage |
| Native Born | 65 (100.0%) | 0 (0.0%) |
| Foreign Born, Citizen | 48 (100.0%) | 0 (0.0%) |
| Foreign Born, not a Citizen | 34 (49.3%) | 35 (50.7%) |
Health Insurance Coverage by Household Income in North Puyallup
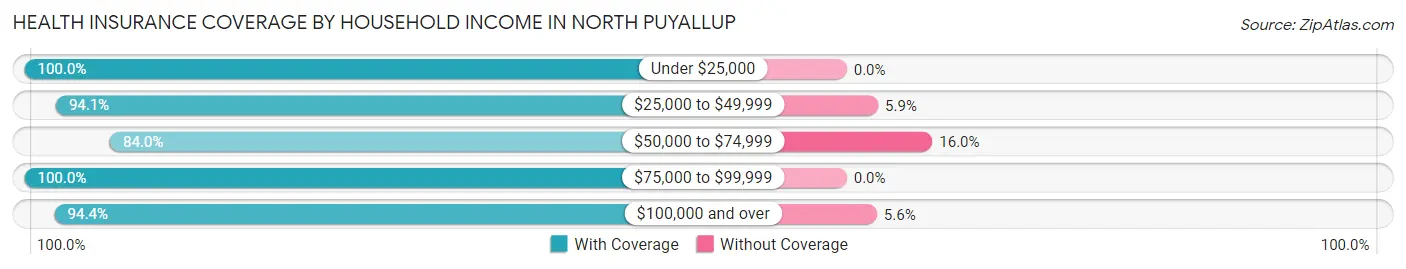
| Household Income | With Coverage | Without Coverage |
| Under $25,000 | 35 (100.0%) | 0 (0.0%) |
| $25,000 to $49,999 | 288 (94.1%) | 18 (5.9%) |
| $50,000 to $74,999 | 288 (84.0%) | 55 (16.0%) |
| $75,000 to $99,999 | 232 (100.0%) | 0 (0.0%) |
| $100,000 and over | 586 (94.4%) | 35 (5.6%) |
Public vs Private Health Insurance Coverage by Age in North Puyallup
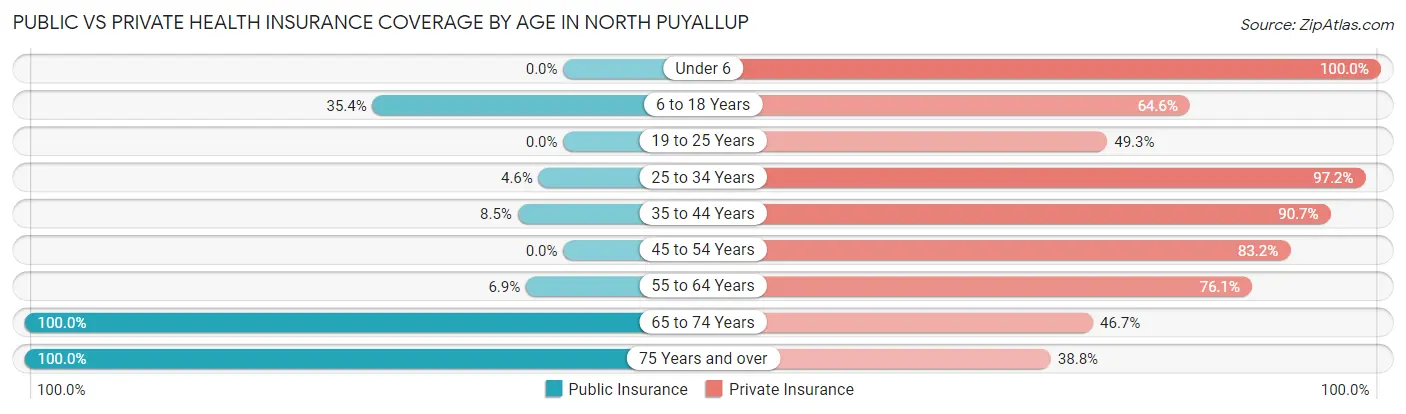
| Age Bracket | Public Insurance | Private Insurance |
| Under 6 | 0 (0.0%) | 65 (100.0%) |
| 6 to 18 Years | 17 (35.4%) | 31 (64.6%) |
| 19 to 25 Years | 0 (0.0%) | 34 (49.3%) |
| 25 to 34 Years | 13 (4.6%) | 275 (97.2%) |
| 35 to 44 Years | 10 (8.5%) | 107 (90.7%) |
| 45 to 54 Years | 0 (0.0%) | 94 (83.2%) |
| 55 to 64 Years | 22 (6.9%) | 242 (76.1%) |
| 65 to 74 Years | 463 (100.0%) | 216 (46.7%) |
| 75 Years and over | 67 (100.0%) | 26 (38.8%) |
| Total | 592 (38.3%) | 1,090 (70.6%) |
Disability Status by Sex by Age in North Puyallup
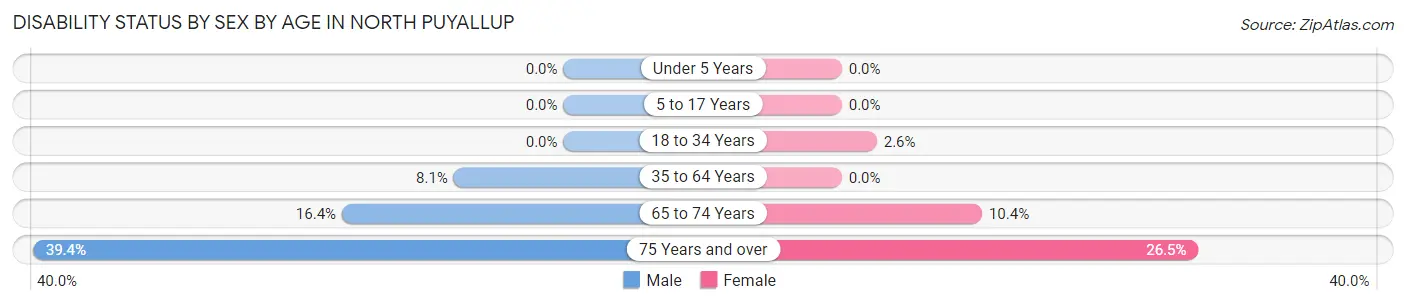
| Age Bracket | Male | Female |
| Under 5 Years | 0 (0.0%) | 0 (0.0%) |
| 5 to 17 Years | 0 (0.0%) | 0 (0.0%) |
| 18 to 34 Years | 0 (0.0%) | 5 (2.6%) |
| 35 to 64 Years | 31 (8.1%) | 0 (0.0%) |
| 65 to 74 Years | 24 (16.4%) | 33 (10.4%) |
| 75 Years and over | 13 (39.4%) | 9 (26.5%) |
Disability Class by Sex by Age in North Puyallup
Disability Class: Hearing Difficulty
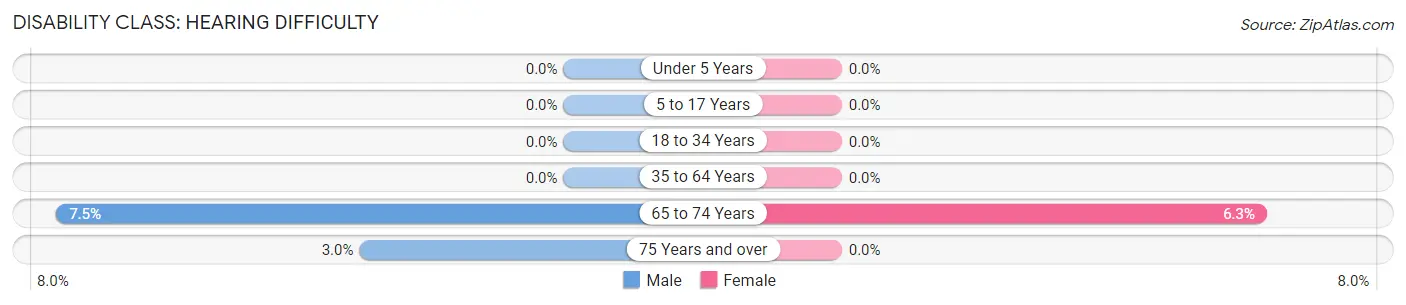
| Age Bracket | Male | Female |
| Under 5 Years | 0 (0.0%) | 0 (0.0%) |
| 5 to 17 Years | 0 (0.0%) | 0 (0.0%) |
| 18 to 34 Years | 0 (0.0%) | 0 (0.0%) |
| 35 to 64 Years | 0 (0.0%) | 0 (0.0%) |
| 65 to 74 Years | 11 (7.5%) | 20 (6.3%) |
| 75 Years and over | 1 (3.0%) | 0 (0.0%) |
Disability Class: Vision Difficulty
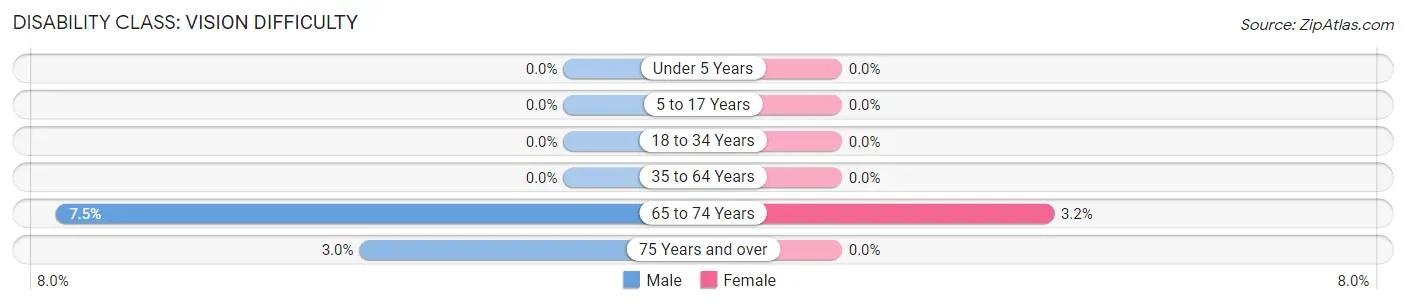
| Age Bracket | Male | Female |
| Under 5 Years | 0 (0.0%) | 0 (0.0%) |
| 5 to 17 Years | 0 (0.0%) | 0 (0.0%) |
| 18 to 34 Years | 0 (0.0%) | 0 (0.0%) |
| 35 to 64 Years | 0 (0.0%) | 0 (0.0%) |
| 65 to 74 Years | 11 (7.5%) | 10 (3.2%) |
| 75 Years and over | 1 (3.0%) | 0 (0.0%) |
Disability Class: Cognitive Difficulty
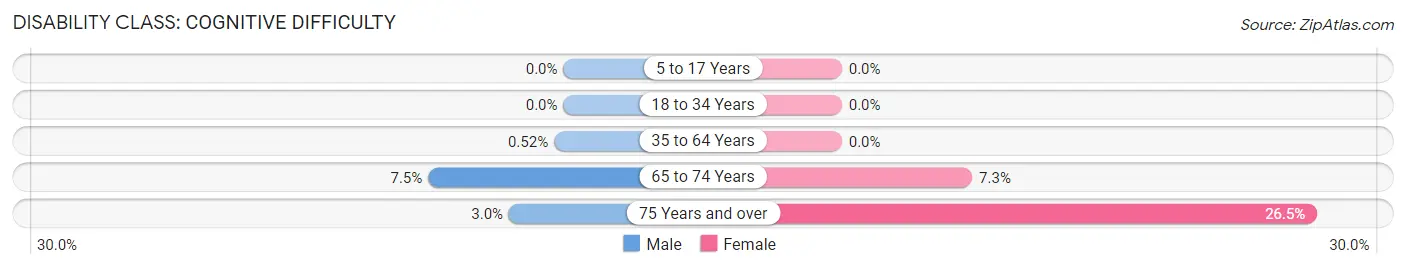
| Age Bracket | Male | Female |
| 5 to 17 Years | 0 (0.0%) | 0 (0.0%) |
| 18 to 34 Years | 0 (0.0%) | 0 (0.0%) |
| 35 to 64 Years | 2 (0.5%) | 0 (0.0%) |
| 65 to 74 Years | 11 (7.5%) | 23 (7.3%) |
| 75 Years and over | 1 (3.0%) | 9 (26.5%) |
Disability Class: Ambulatory Difficulty
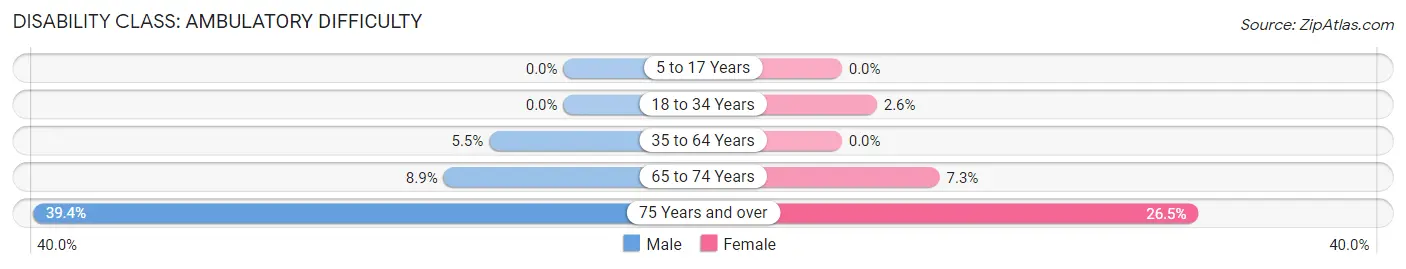
| Age Bracket | Male | Female |
| 5 to 17 Years | 0 (0.0%) | 0 (0.0%) |
| 18 to 34 Years | 0 (0.0%) | 5 (2.6%) |
| 35 to 64 Years | 21 (5.5%) | 0 (0.0%) |
| 65 to 74 Years | 13 (8.9%) | 23 (7.3%) |
| 75 Years and over | 13 (39.4%) | 9 (26.5%) |
Disability Class: Self-Care Difficulty
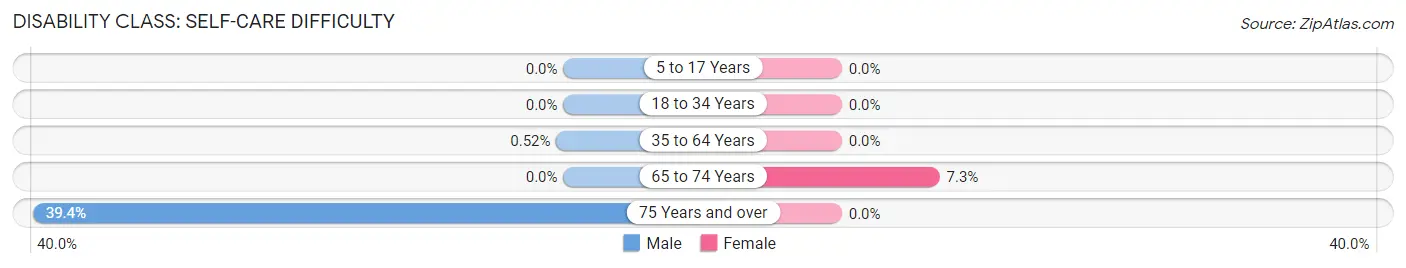
| Age Bracket | Male | Female |
| 5 to 17 Years | 0 (0.0%) | 0 (0.0%) |
| 18 to 34 Years | 0 (0.0%) | 0 (0.0%) |
| 35 to 64 Years | 2 (0.5%) | 0 (0.0%) |
| 65 to 74 Years | 0 (0.0%) | 23 (7.3%) |
| 75 Years and over | 13 (39.4%) | 0 (0.0%) |
Technology Access in North Puyallup
Computing Device Access in North Puyallup
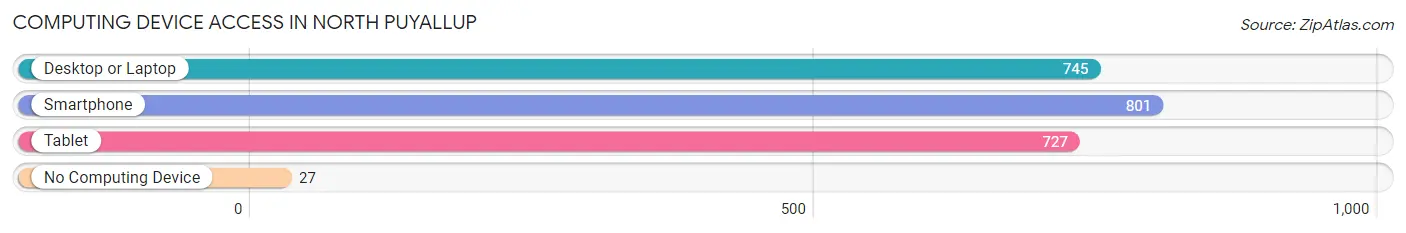
| Device Type | # Households | % Households |
| Desktop or Laptop | 745 | 88.8% |
| Smartphone | 801 | 95.5% |
| Tablet | 727 | 86.7% |
| No Computing Device | 27 | 3.2% |
| Total | 839 | 100.0% |
Internet Access in North Puyallup
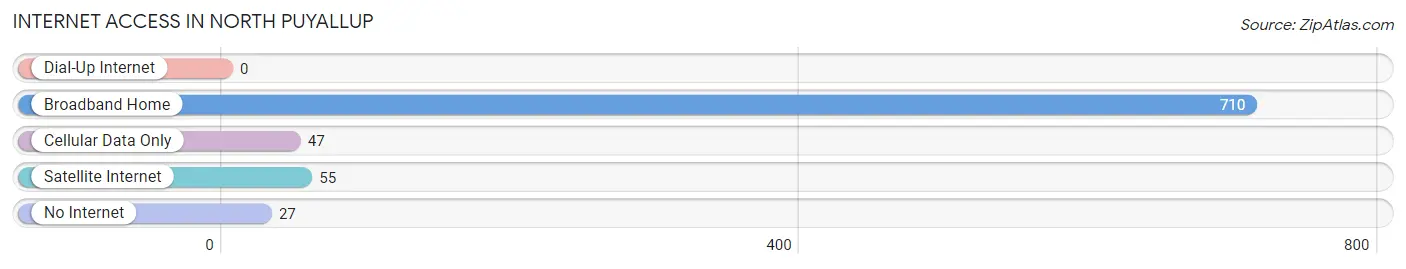
| Internet Type | # Households | % Households |
| Dial-Up Internet | 0 | 0.0% |
| Broadband Home | 710 | 84.6% |
| Cellular Data Only | 47 | 5.6% |
| Satellite Internet | 55 | 6.6% |
| No Internet | 27 | 3.2% |
| Total | 839 | 100.0% |
North Puyallup Summary
North Puyallup, WA is a city located in Pierce County, Washington, United States. It is part of the Seattle metropolitan area and is located approximately 10 miles south of Tacoma. The population was estimated to be 37,022 in 2019.
History
The area that is now North Puyallup was originally inhabited by the Puyallup Tribe of Native Americans. The first European settlers arrived in the area in the mid-1800s, and the city was officially incorporated in 1890. The city was named after the Puyallup Tribe, which means “generous and welcoming people” in the language of the tribe.
The city grew rapidly in the early 1900s, and by the 1920s, it was a thriving agricultural and logging community. The city was also home to several military bases during World War II, which helped to further spur its growth.
In the 1950s, the city began to experience a population boom, as many people moved to the area to take advantage of the booming economy. This growth continued into the 1960s and 1970s, and the city was officially designated as a city in 1975.
Geography
North Puyallup is located in the western part of Pierce County, Washington, approximately 10 miles south of Tacoma. The city is situated on the Puyallup River, which flows through the city and into the Puget Sound. The city is bordered by the cities of Tacoma, Sumner, and Fife.
The city has a total area of 8.7 square miles, of which 8.3 square miles is land and 0.4 square miles is water. The city is located at an elevation of approximately 200 feet above sea level.
Economy
North Puyallup is a major economic center in the region, with a variety of businesses and industries located in the city. The city is home to several large employers, including the Puyallup School District, MultiCare Health System, and the Puyallup Tribe of Indians.
The city is also home to several shopping centers, including the South Hill Mall and the Puyallup Town Center. The city is also home to several parks and recreational areas, including the Puyallup Riverwalk and the Puyallup Fairgrounds.
Demographics
As of the 2019 census, the population of North Puyallup was estimated to be 37,022. The racial makeup of the city was 73.3% White, 8.2% Hispanic or Latino, 6.7% Asian, 5.2% African American, and 4.6% other.
The median household income in the city was $63,945, and the median home value was $323,400. The city has a poverty rate of 11.2%, and the unemployment rate was 4.2%.
Conclusion
North Puyallup, WA is a city located in Pierce County, Washington, United States. It is part of the Seattle metropolitan area and is located approximately 10 miles south of Tacoma. The city has a long history, dating back to the mid-1800s, and has experienced significant growth in recent decades. The city is home to a variety of businesses and industries, and has a population of 37,022 as of 2019. The city has a median household income of $63,945 and a median home value of $323,400.
Common Questions
What is Per Capita Income in North Puyallup?
Per Capita income in North Puyallup is $40,583.
What is the Median Family Income in North Puyallup?
Median Family Income in North Puyallup is $85,781.
What is the Median Household income in North Puyallup?
Median Household Income in North Puyallup is $78,091.
What is Income or Wage Gap in North Puyallup?
Income or Wage Gap in North Puyallup is 17.8%.
Women in North Puyallup earn 82.2 cents for every dollar earned by a man.
What is Inequality or Gini Index in North Puyallup?
Inequality or Gini Index in North Puyallup is 0.28.
What is the Total Population of North Puyallup?
Total Population of North Puyallup is 1,544.
What is the Total Male Population of North Puyallup?
Total Male Population of North Puyallup is 819.
What is the Total Female Population of North Puyallup?
Total Female Population of North Puyallup is 725.
What is the Ratio of Males per 100 Females in North Puyallup?
There are 112.97 Males per 100 Females in North Puyallup.
What is the Ratio of Females per 100 Males in North Puyallup?
There are 88.52 Females per 100 Males in North Puyallup.
What is the Median Population Age in North Puyallup?
Median Population Age in North Puyallup is 60.2 Years.
What is the Average Family Size in North Puyallup
Average Family Size in North Puyallup is 2.2 People.
What is the Average Household Size in North Puyallup
Average Household Size in North Puyallup is 1.8 People.
How Large is the Labor Force in North Puyallup?
There are 859 People in the Labor Forcein in North Puyallup.
What is the Percentage of People in the Labor Force in North Puyallup?
60.0% of People are in the Labor Force in North Puyallup.
What is the Unemployment Rate in North Puyallup?
Unemployment Rate in North Puyallup is 4.1%.