Westwood borough, NJ Map & Demographics
Westwood borough Overview
$62,659
PER CAPITA INCOME
$169,688
AVG FAMILY INCOME
$160,466
AVG HOUSEHOLD INCOME
24.7%
WAGE / INCOME GAP [ % ]
75.3¢/ $1
WAGE / INCOME GAP [ $ ]
0.38
INEQUALITY / GINI INDEX
11,241
TOTAL POPULATION
5,328
MALE POPULATION
5,913
FEMALE POPULATION
90.11
MALES / 100 FEMALES
110.98
FEMALES / 100 MALES
41.8
MEDIAN AGE
3.0
AVG FAMILY SIZE
2.6
AVG HOUSEHOLD SIZE
6,961
LABOR FORCE [ PEOPLE ]
75.7%
PERCENT IN LABOR FORCE
2.6%
UNEMPLOYMENT RATE
Income in Westwood borough
Income Overview in Westwood borough
Per Capita Income in Westwood borough is $62,659, while median incomes of families and households are $169,688 and $160,466 respectively.
| Characteristic | Number | Measure |
| Per Capita Income | 11,241 | $62,659 |
| Median Family Income | 3,159 | $169,688 |
| Mean Family Income | 3,159 | $187,495 |
| Median Household Income | 4,239 | $160,466 |
| Mean Household Income | 4,239 | $168,532 |
| Income Deficit | 3,159 | $0 |
| Wage / Income Gap (%) | 11,241 | 24.72% |
| Wage / Income Gap ($) | 11,241 | 75.28¢ per $1 |
| Gini / Inequality Index | 11,241 | 0.38 |
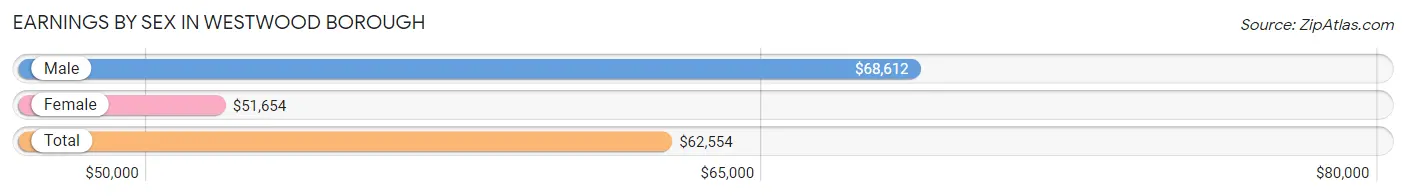
Earnings by Sex in Westwood borough
Average Earnings in Westwood borough are $62,554, $68,612 for men and $51,654 for women, a difference of 24.7%.
| Sex | Number | Average Earnings |
| Male | 3,572 (49.0%) | $68,612 |
| Female | 3,718 (51.0%) | $51,654 |
| Total | 7,290 (100.0%) | $62,554 |
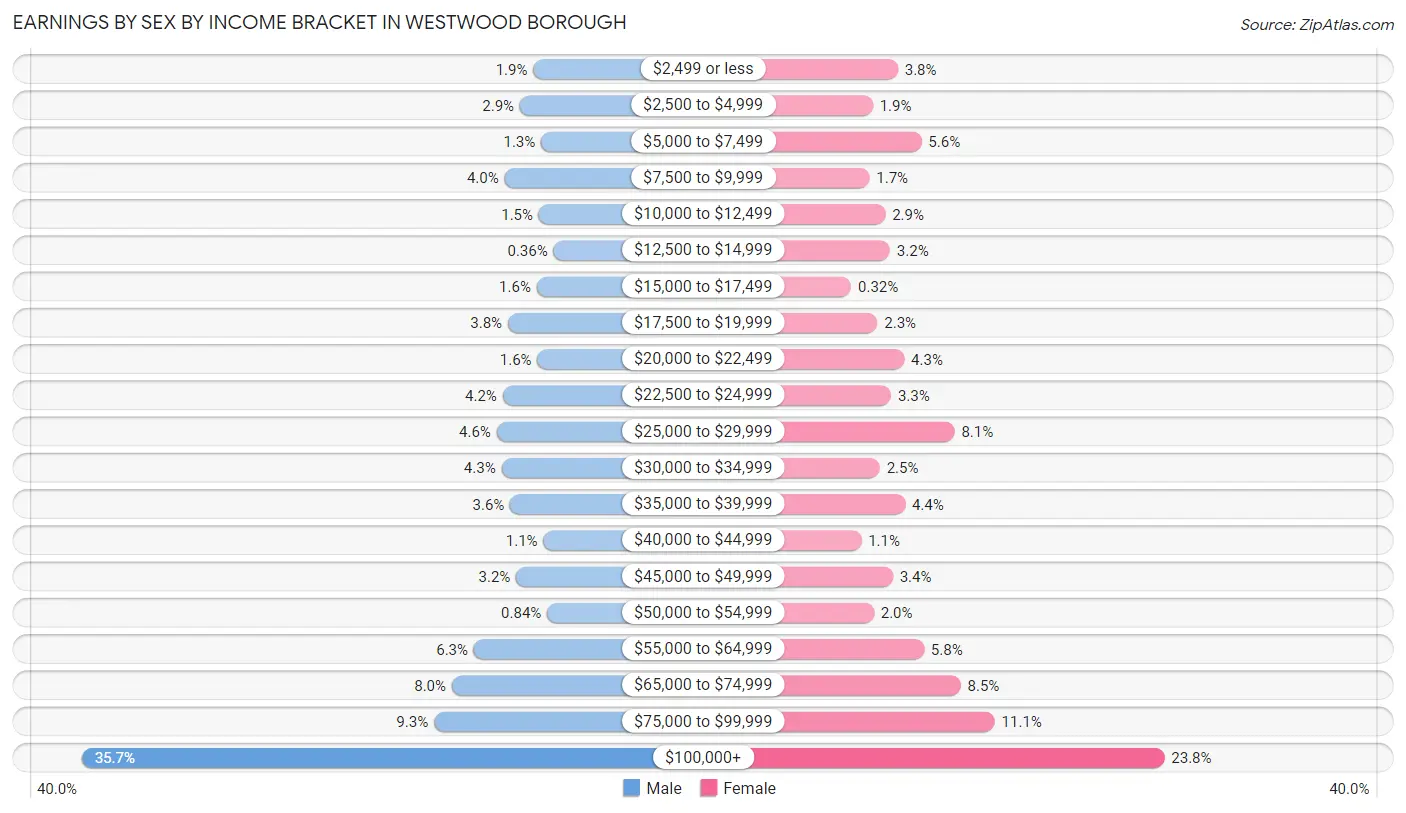
Earnings by Sex by Income Bracket in Westwood borough
The most common earnings brackets in Westwood borough are $100,000+ for men (1,276 | 35.7%) and $100,000+ for women (885 | 23.8%).
| Income | Male | Female |
| $2,499 or less | 67 (1.9%) | 142 (3.8%) |
| $2,500 to $4,999 | 103 (2.9%) | 72 (1.9%) |
| $5,000 to $7,499 | 46 (1.3%) | 208 (5.6%) |
| $7,500 to $9,999 | 144 (4.0%) | 63 (1.7%) |
| $10,000 to $12,499 | 52 (1.5%) | 107 (2.9%) |
| $12,500 to $14,999 | 13 (0.4%) | 120 (3.2%) |
| $15,000 to $17,499 | 58 (1.6%) | 12 (0.3%) |
| $17,500 to $19,999 | 135 (3.8%) | 85 (2.3%) |
| $20,000 to $22,499 | 56 (1.6%) | 160 (4.3%) |
| $22,500 to $24,999 | 149 (4.2%) | 123 (3.3%) |
| $25,000 to $29,999 | 165 (4.6%) | 300 (8.1%) |
| $30,000 to $34,999 | 152 (4.3%) | 92 (2.5%) |
| $35,000 to $39,999 | 129 (3.6%) | 162 (4.4%) |
| $40,000 to $44,999 | 40 (1.1%) | 40 (1.1%) |
| $45,000 to $49,999 | 113 (3.2%) | 128 (3.4%) |
| $50,000 to $54,999 | 30 (0.8%) | 75 (2.0%) |
| $55,000 to $64,999 | 226 (6.3%) | 215 (5.8%) |
| $65,000 to $74,999 | 285 (8.0%) | 317 (8.5%) |
| $75,000 to $99,999 | 333 (9.3%) | 412 (11.1%) |
| $100,000+ | 1,276 (35.7%) | 885 (23.8%) |
| Total | 3,572 (100.0%) | 3,718 (100.0%) |
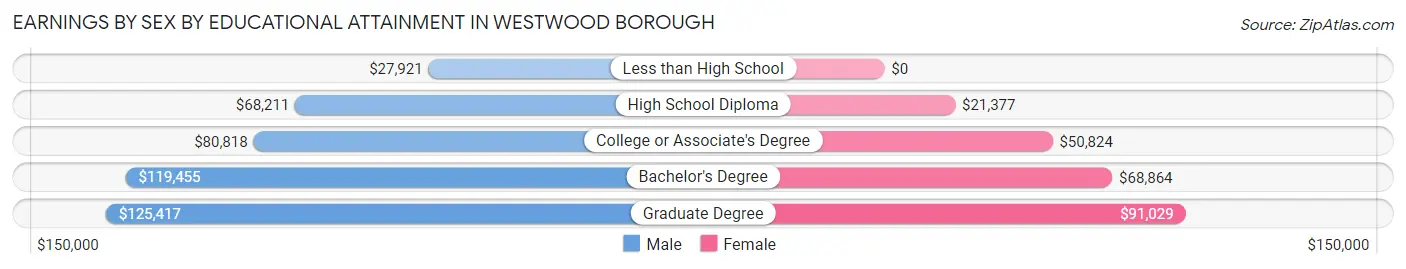
Earnings by Sex by Educational Attainment in Westwood borough
Average earnings in Westwood borough are $81,281 for men and $65,260 for women, a difference of 19.7%. Men with an educational attainment of graduate degree enjoy the highest average annual earnings of $125,417, while those with less than high school education earn the least with $27,921. Women with an educational attainment of graduate degree earn the most with the average annual earnings of $91,029, while those with high school diploma education have the smallest earnings of $21,377.
| Educational Attainment | Male Income | Female Income |
| Less than High School | $27,921 | $0 |
| High School Diploma | $68,211 | $21,377 |
| College or Associate's Degree | $80,818 | $50,824 |
| Bachelor's Degree | $119,455 | $68,864 |
| Graduate Degree | $125,417 | $91,029 |
| Total | $81,281 | $65,260 |
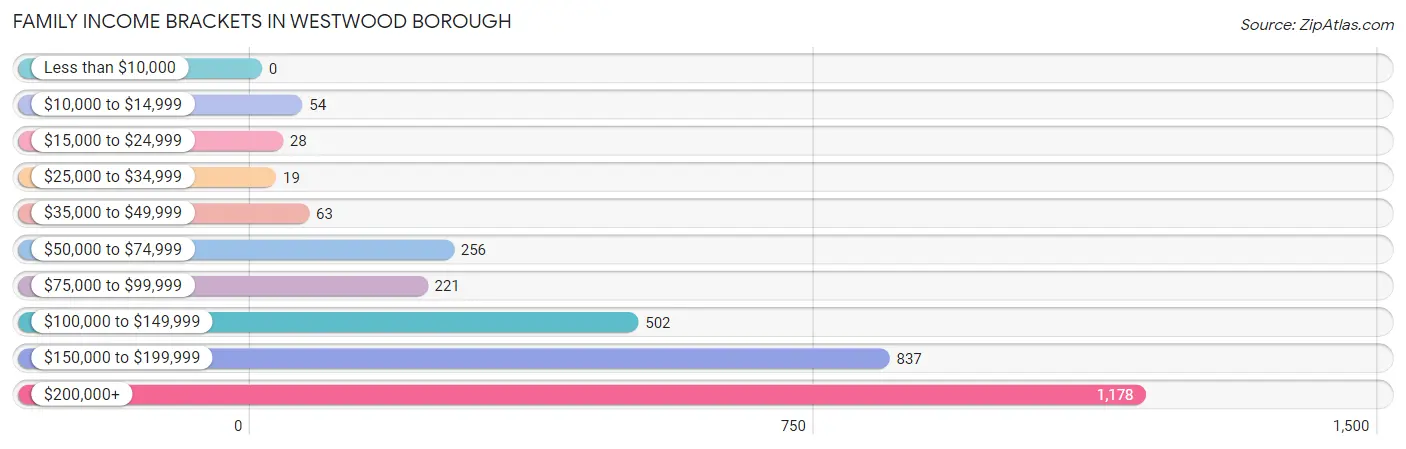
Family Income in Westwood borough
Family Income Brackets in Westwood borough
According to the Westwood borough family income data, there are 1,178 families falling into the $200,000+ income range, which is the most common income bracket and makes up 37.3% of all families.
| Income Bracket | # Families | % Families |
| Less than $10,000 | 0 | 0.0% |
| $10,000 to $14,999 | 54 | 1.7% |
| $15,000 to $24,999 | 28 | 0.9% |
| $25,000 to $34,999 | 19 | 0.6% |
| $35,000 to $49,999 | 63 | 2.0% |
| $50,000 to $74,999 | 256 | 8.1% |
| $75,000 to $99,999 | 221 | 7.0% |
| $100,000 to $149,999 | 502 | 15.9% |
| $150,000 to $199,999 | 837 | 26.5% |
| $200,000+ | 1,178 | 37.3% |
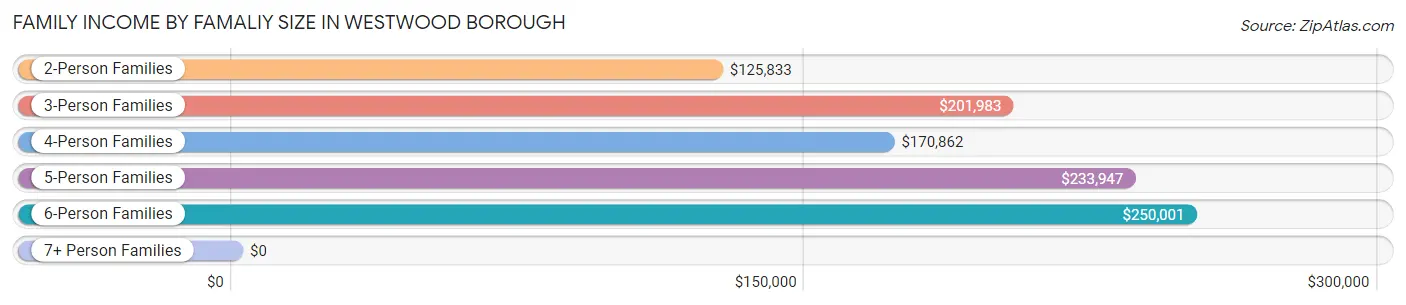
Family Income by Famaliy Size in Westwood borough
6-person families (41 | 1.3%) account for the highest median family income in Westwood borough with $250,001 per family, while 3-person families (798 | 25.3%) have the highest median income of $67,328 per family member.
| Income Bracket | # Families | Median Income |
| 2-Person Families | 1,316 (41.7%) | $125,833 |
| 3-Person Families | 798 (25.3%) | $201,983 |
| 4-Person Families | 760 (24.1%) | $170,862 |
| 5-Person Families | 226 (7.1%) | $233,947 |
| 6-Person Families | 41 (1.3%) | $250,001 |
| 7+ Person Families | 18 (0.6%) | $0 |
| Total | 3,159 (100.0%) | $169,688 |
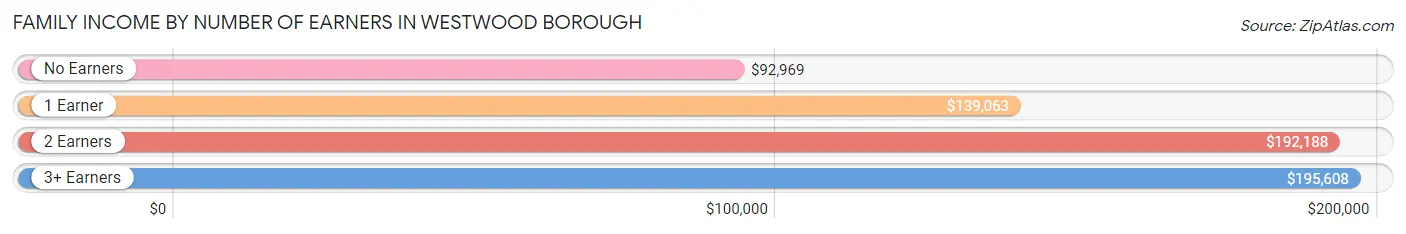
Family Income by Number of Earners in Westwood borough
The median family income in Westwood borough is $169,688, with families comprising 3+ earners (704) having the highest median family income of $195,608, while families with no earners (182) have the lowest median family income of $92,969, accounting for 22.3% and 5.8% of families, respectively.
| Number of Earners | # Families | Median Income |
| No Earners | 182 (5.8%) | $92,969 |
| 1 Earner | 1,027 (32.5%) | $139,063 |
| 2 Earners | 1,246 (39.4%) | $192,188 |
| 3+ Earners | 704 (22.3%) | $195,608 |
| Total | 3,159 (100.0%) | $169,688 |
Household Income in Westwood borough
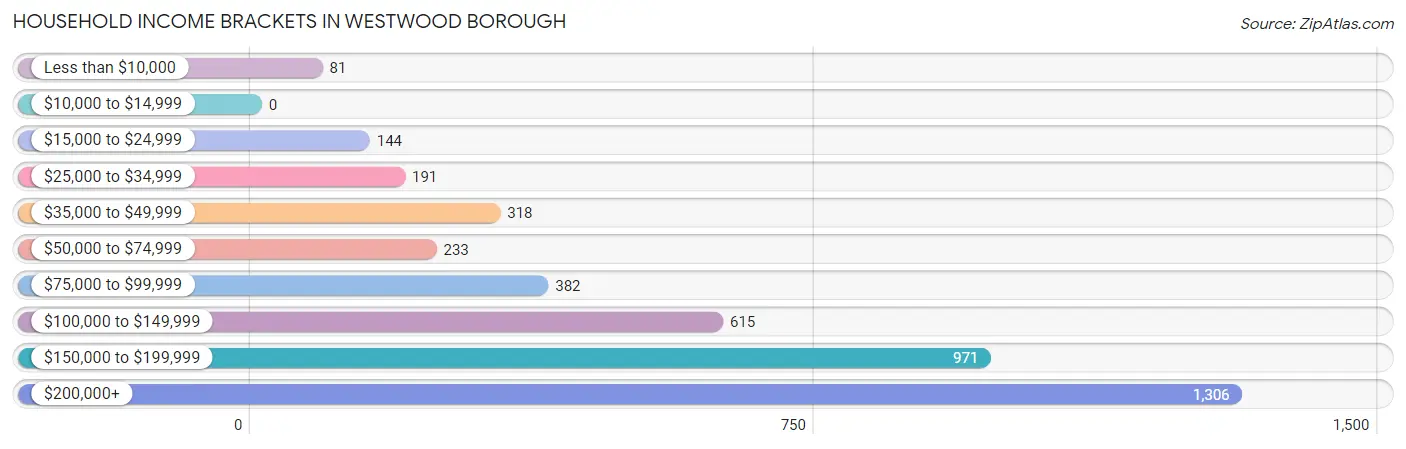
Household Income Brackets in Westwood borough
With 1,306 households falling in the category, the $200,000+ income range is the most frequent in Westwood borough, accounting for 30.8% of all households.
| Income Bracket | # Households | % Households |
| Less than $10,000 | 81 | 1.9% |
| $10,000 to $14,999 | 0 | 0.0% |
| $15,000 to $24,999 | 144 | 3.4% |
| $25,000 to $34,999 | 191 | 4.5% |
| $35,000 to $49,999 | 318 | 7.5% |
| $50,000 to $74,999 | 233 | 5.5% |
| $75,000 to $99,999 | 382 | 9.0% |
| $100,000 to $149,999 | 615 | 14.5% |
| $150,000 to $199,999 | 971 | 22.9% |
| $200,000+ | 1,306 | 30.8% |
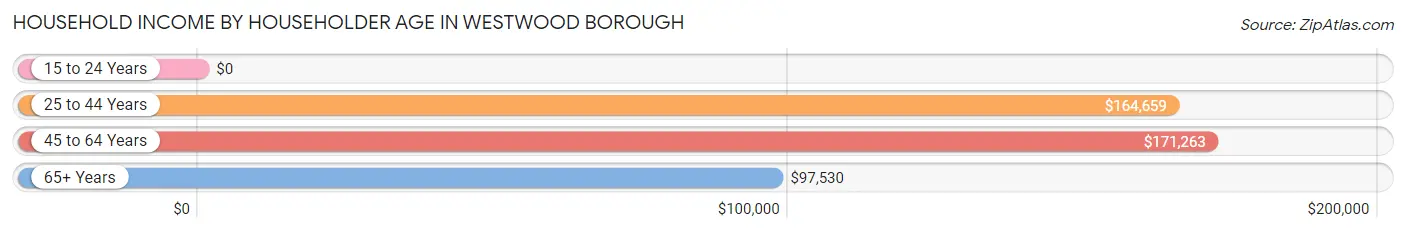
Household Income by Householder Age in Westwood borough
The median household income in Westwood borough is $160,466, with the highest median household income of $171,263 found in the 45 to 64 years age bracket for the primary householder. A total of 1,455 households (34.3%) fall into this category.
| Income Bracket | # Households | Median Income |
| 15 to 24 Years | 0 (0.0%) | $0 |
| 25 to 44 Years | 1,271 (30.0%) | $164,659 |
| 45 to 64 Years | 1,455 (34.3%) | $171,263 |
| 65+ Years | 1,513 (35.7%) | $97,530 |
| Total | 4,239 (100.0%) | $160,466 |
Poverty in Westwood borough
Income Below Poverty by Sex and Age in Westwood borough
With 3.0% poverty level for males and 3.9% for females among the residents of Westwood borough, 6 to 11 year old males and 75 year old and over females are the most vulnerable to poverty, with 53 males (9.7%) and 116 females (13.4%) in their respective age groups living below the poverty level.
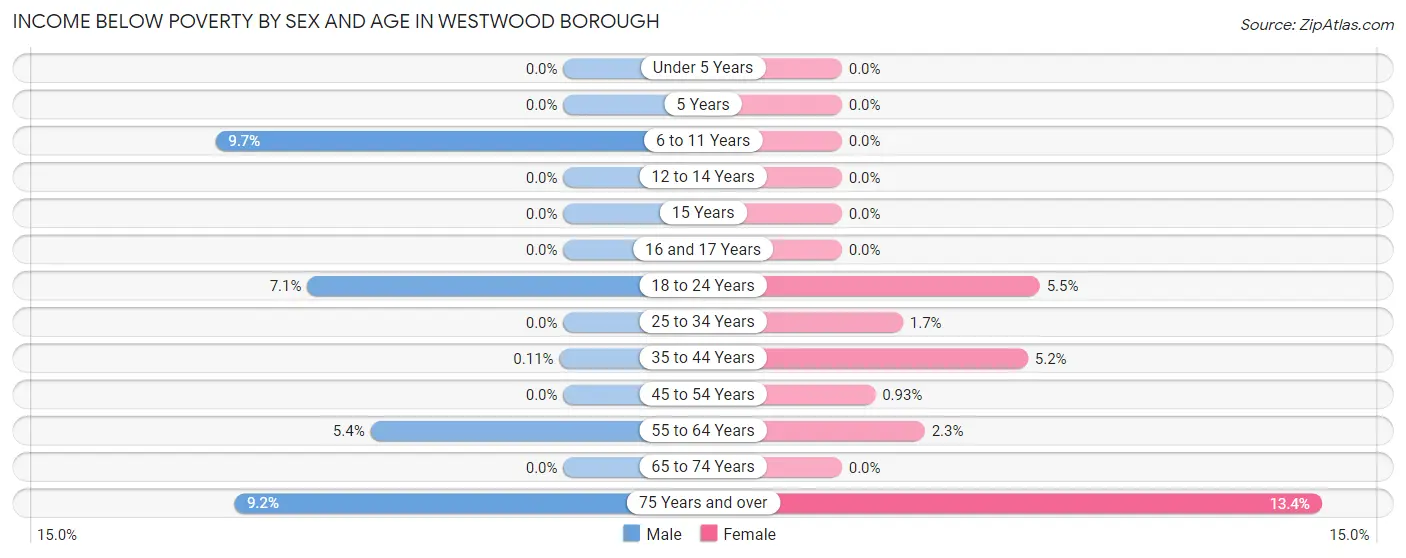
| Age Bracket | Male | Female |
| Under 5 Years | 0 (0.0%) | 0 (0.0%) |
| 5 Years | 0 (0.0%) | 0 (0.0%) |
| 6 to 11 Years | 53 (9.7%) | 0 (0.0%) |
| 12 to 14 Years | 0 (0.0%) | 0 (0.0%) |
| 15 Years | 0 (0.0%) | 0 (0.0%) |
| 16 and 17 Years | 0 (0.0%) | 0 (0.0%) |
| 18 to 24 Years | 43 (7.1%) | 27 (5.5%) |
| 25 to 34 Years | 0 (0.0%) | 8 (1.7%) |
| 35 to 44 Years | 1 (0.1%) | 55 (5.2%) |
| 45 to 54 Years | 0 (0.0%) | 7 (0.9%) |
| 55 to 64 Years | 33 (5.4%) | 15 (2.3%) |
| 65 to 74 Years | 0 (0.0%) | 0 (0.0%) |
| 75 Years and over | 30 (9.2%) | 116 (13.4%) |
| Total | 160 (3.0%) | 228 (3.9%) |
Income Above Poverty by Sex and Age in Westwood borough
According to the poverty statistics in Westwood borough, males aged under 5 years and females aged under 5 years are the age groups that are most secure financially, with 100.0% of males and 100.0% of females in these age groups living above the poverty line.
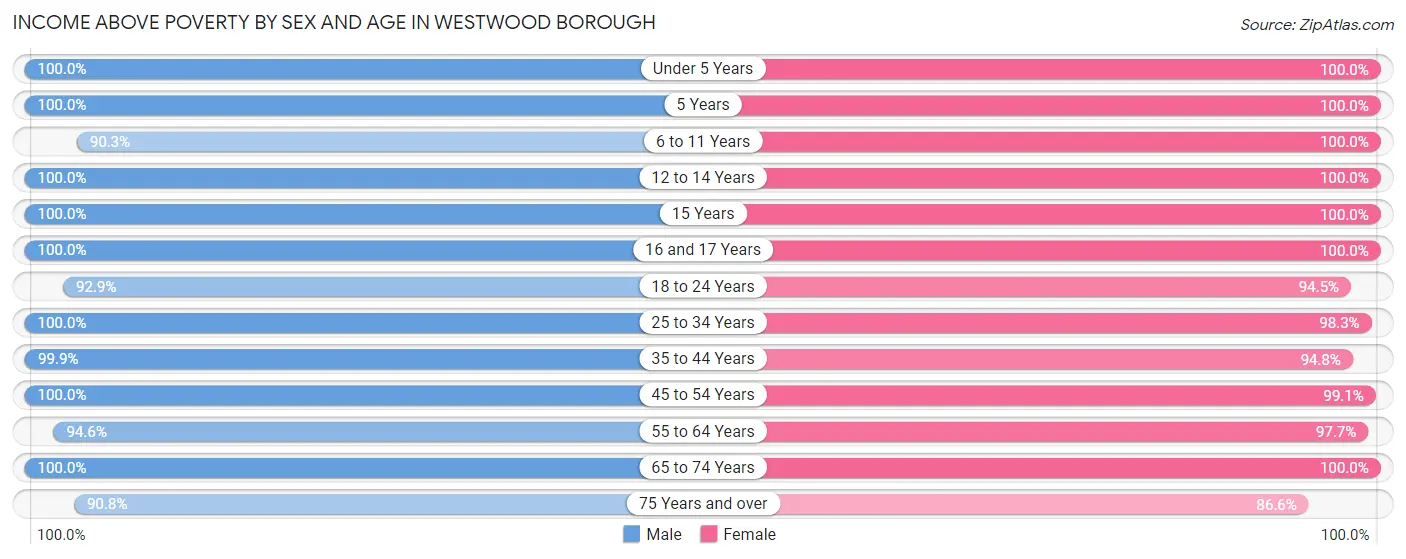
| Age Bracket | Male | Female |
| Under 5 Years | 264 (100.0%) | 178 (100.0%) |
| 5 Years | 15 (100.0%) | 68 (100.0%) |
| 6 to 11 Years | 494 (90.3%) | 417 (100.0%) |
| 12 to 14 Years | 252 (100.0%) | 151 (100.0%) |
| 15 Years | 43 (100.0%) | 110 (100.0%) |
| 16 and 17 Years | 66 (100.0%) | 92 (100.0%) |
| 18 to 24 Years | 560 (92.9%) | 463 (94.5%) |
| 25 to 34 Years | 420 (100.0%) | 463 (98.3%) |
| 35 to 44 Years | 891 (99.9%) | 1,006 (94.8%) |
| 45 to 54 Years | 653 (100.0%) | 747 (99.1%) |
| 55 to 64 Years | 582 (94.6%) | 634 (97.7%) |
| 65 to 74 Years | 624 (100.0%) | 566 (100.0%) |
| 75 Years and over | 297 (90.8%) | 752 (86.6%) |
| Total | 5,161 (97.0%) | 5,647 (96.1%) |
Income Below Poverty Among Married-Couple Families in Westwood borough
The poverty statistics for married-couple families in Westwood borough show that 1.8% or 37 of the total 2,095 families live below the poverty line. Families with no children have the highest poverty rate of 3.2%, comprising of 37 families. On the other hand, families with 1 or 2 children have the lowest poverty rate of 0.0%, which includes 0 families.
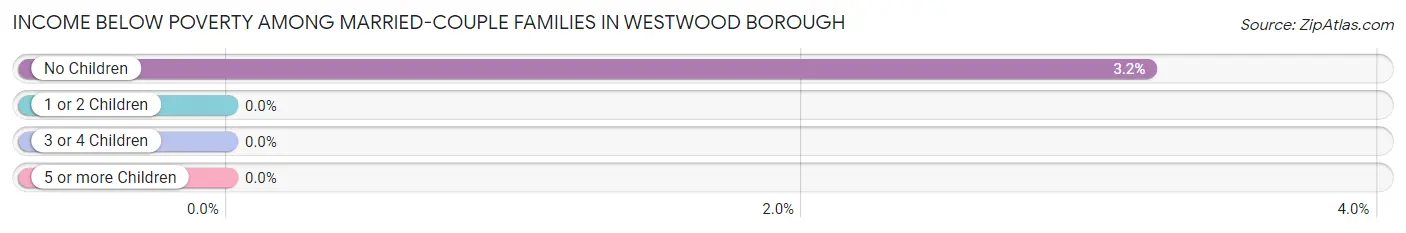
| Children | Above Poverty | Below Poverty |
| No Children | 1,121 (96.8%) | 37 (3.2%) |
| 1 or 2 Children | 796 (100.0%) | 0 (0.0%) |
| 3 or 4 Children | 141 (100.0%) | 0 (0.0%) |
| 5 or more Children | 0 (0.0%) | 0 (0.0%) |
| Total | 2,058 (98.2%) | 37 (1.8%) |
Income Below Poverty Among Single-Parent Households in Westwood borough
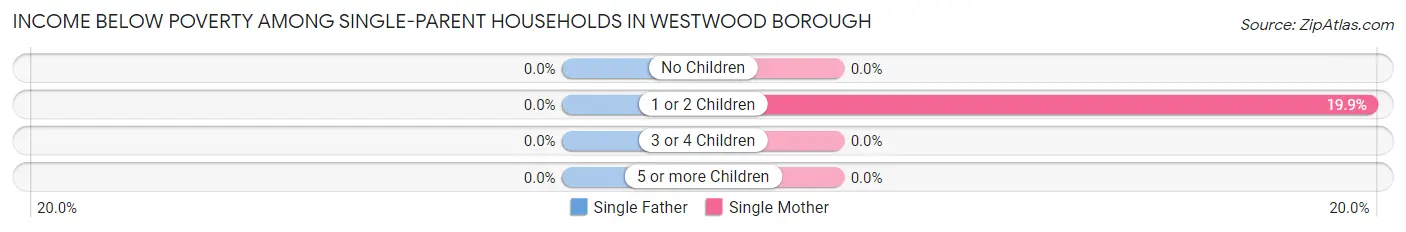
| Children | Single Father | Single Mother |
| No Children | 0 (0.0%) | 0 (0.0%) |
| 1 or 2 Children | 0 (0.0%) | 55 (19.9%) |
| 3 or 4 Children | 0 (0.0%) | 0 (0.0%) |
| 5 or more Children | 0 (0.0%) | 0 (0.0%) |
| Total | 0 (0.0%) | 55 (6.3%) |
Income Below Poverty Among Married-Couple vs Single-Parent Households in Westwood borough
The poverty data for Westwood borough shows that 37 of the married-couple family households (1.8%) and 55 of the single-parent households (5.2%) are living below the poverty level. Within the married-couple family households, those with no children have the highest poverty rate, with 37 households (3.2%) falling below the poverty line. Among the single-parent households, those with 1 or 2 children have the highest poverty rate, with 55 household (13.6%) living below poverty.
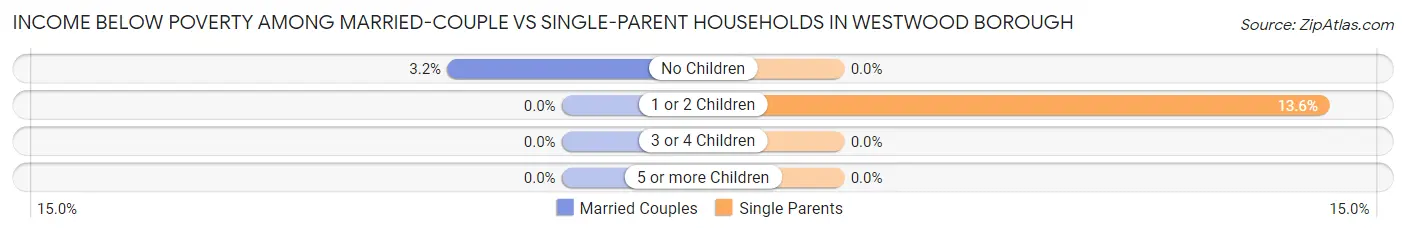
| Children | Married-Couple Families | Single-Parent Households |
| No Children | 37 (3.2%) | 0 (0.0%) |
| 1 or 2 Children | 0 (0.0%) | 55 (13.6%) |
| 3 or 4 Children | 0 (0.0%) | 0 (0.0%) |
| 5 or more Children | 0 (0.0%) | 0 (0.0%) |
| Total | 37 (1.8%) | 55 (5.2%) |
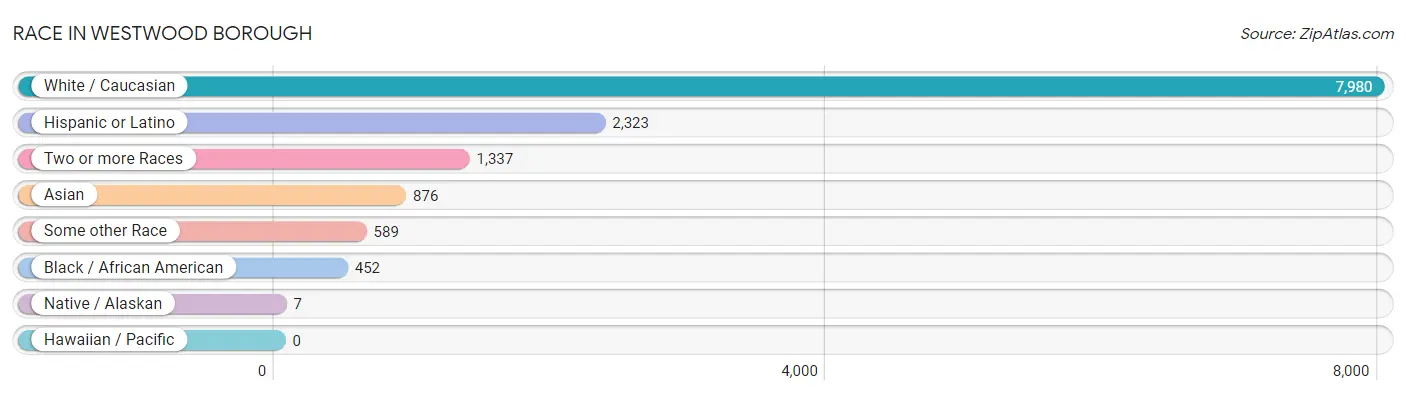
Race in Westwood borough
The most populous races in Westwood borough are White / Caucasian (7,980 | 71.0%), Hispanic or Latino (2,323 | 20.7%), and Two or more Races (1,337 | 11.9%).
| Race | # Population | % Population |
| Asian | 876 | 7.8% |
| Black / African American | 452 | 4.0% |
| Hawaiian / Pacific | 0 | 0.0% |
| Hispanic or Latino | 2,323 | 20.7% |
| Native / Alaskan | 7 | 0.1% |
| White / Caucasian | 7,980 | 71.0% |
| Two or more Races | 1,337 | 11.9% |
| Some other Race | 589 | 5.2% |
| Total | 11,241 | 100.0% |
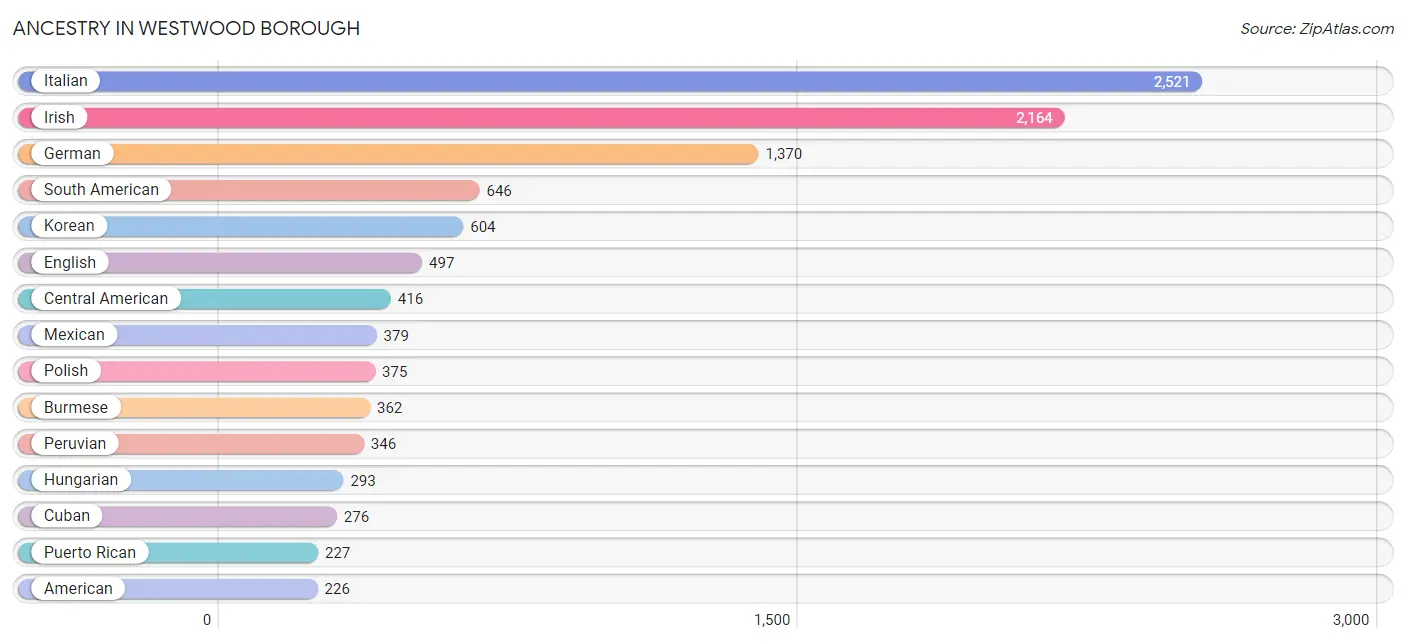
Ancestry in Westwood borough
The most populous ancestries reported in Westwood borough are Italian (2,521 | 22.4%), Irish (2,164 | 19.3%), German (1,370 | 12.2%), South American (646 | 5.8%), and Korean (604 | 5.4%), together accounting for 65.0% of all Westwood borough residents.
| Ancestry | # Population | % Population |
| American | 226 | 2.0% |
| Arab | 126 | 1.1% |
| Armenian | 129 | 1.1% |
| Austrian | 76 | 0.7% |
| Bhutanese | 2 | 0.0% |
| British | 139 | 1.2% |
| British West Indian | 82 | 0.7% |
| Burmese | 362 | 3.2% |
| Central American | 416 | 3.7% |
| Colombian | 77 | 0.7% |
| Costa Rican | 98 | 0.9% |
| Croatian | 147 | 1.3% |
| Cuban | 276 | 2.5% |
| Czech | 78 | 0.7% |
| Delaware | 7 | 0.1% |
| Dominican | 215 | 1.9% |
| Dutch | 194 | 1.7% |
| Ecuadorian | 223 | 2.0% |
| Egyptian | 5 | 0.0% |
| English | 497 | 4.4% |
| European | 149 | 1.3% |
| Finnish | 15 | 0.1% |
| French | 226 | 2.0% |
| French Canadian | 22 | 0.2% |
| German | 1,370 | 12.2% |
| Greek | 66 | 0.6% |
| Guyanese | 17 | 0.2% |
| Haitian | 117 | 1.0% |
| Hungarian | 293 | 2.6% |
| Iranian | 15 | 0.1% |
| Irish | 2,164 | 19.3% |
| Israeli | 146 | 1.3% |
| Italian | 2,521 | 22.4% |
| Jamaican | 21 | 0.2% |
| Kenyan | 128 | 1.1% |
| Korean | 604 | 5.4% |
| Lebanese | 73 | 0.6% |
| Lithuanian | 67 | 0.6% |
| Maltese | 20 | 0.2% |
| Mexican | 379 | 3.4% |
| Moroccan | 18 | 0.2% |
| Nicaraguan | 128 | 1.1% |
| Norwegian | 41 | 0.4% |
| Palestinian | 19 | 0.2% |
| Panamanian | 67 | 0.6% |
| Peruvian | 346 | 3.1% |
| Polish | 375 | 3.3% |
| Portuguese | 139 | 1.2% |
| Puerto Rican | 227 | 2.0% |
| Romanian | 29 | 0.3% |
| Russian | 69 | 0.6% |
| Salvadoran | 123 | 1.1% |
| Scotch-Irish | 41 | 0.4% |
| Scottish | 135 | 1.2% |
| Slovak | 17 | 0.2% |
| South American | 646 | 5.8% |
| Spaniard | 130 | 1.2% |
| Spanish | 25 | 0.2% |
| Subsaharan African | 128 | 1.1% |
| Swedish | 98 | 0.9% |
| Swiss | 17 | 0.2% |
| Syrian | 11 | 0.1% |
| Thai | 207 | 1.8% |
| Trinidadian and Tobagonian | 33 | 0.3% |
| Ukrainian | 58 | 0.5% |
| Welsh | 32 | 0.3% |
| Yugoslavian | 16 | 0.1% | View All 67 Rows |
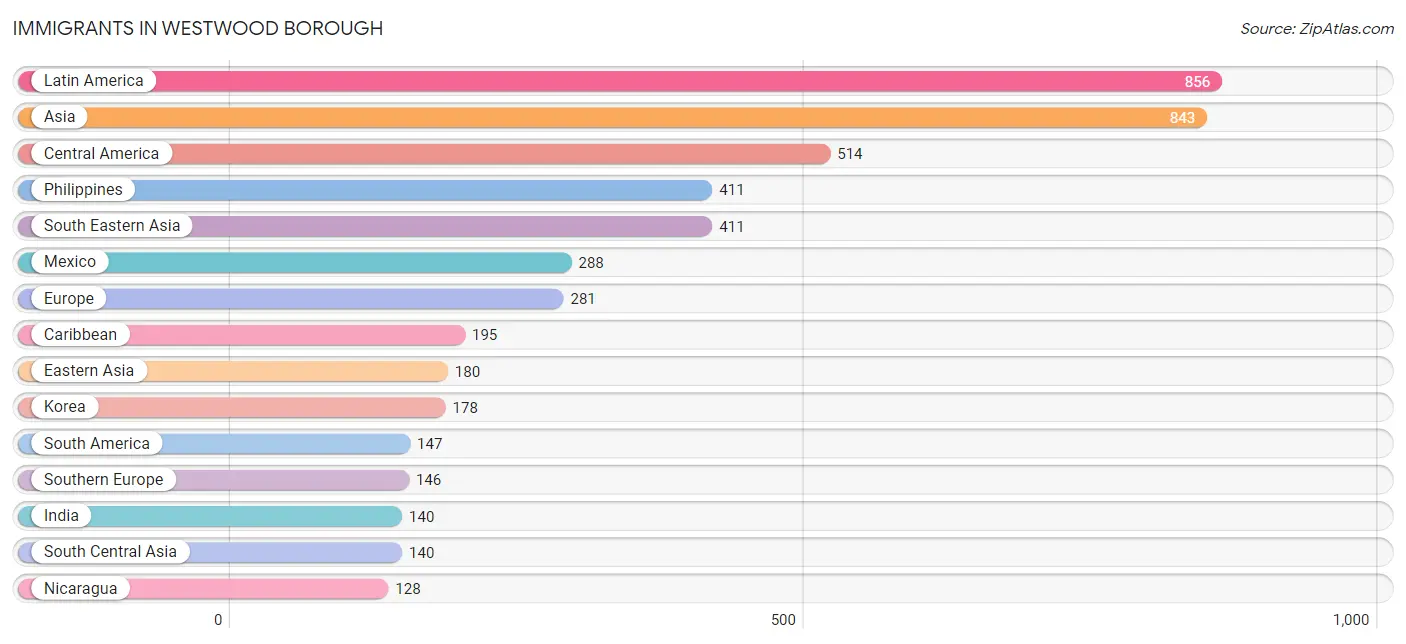
Immigrants in Westwood borough
The most numerous immigrant groups reported in Westwood borough came from Latin America (856 | 7.6%), Asia (843 | 7.5%), Central America (514 | 4.6%), Philippines (411 | 3.7%), and South Eastern Asia (411 | 3.7%), together accounting for 27.0% of all Westwood borough residents.
| Immigration Origin | # Population | % Population |
| Africa | 74 | 0.7% |
| Asia | 843 | 7.5% |
| Brazil | 29 | 0.3% |
| Canada | 16 | 0.1% |
| Caribbean | 195 | 1.7% |
| Central America | 514 | 4.6% |
| Colombia | 29 | 0.3% |
| Costa Rica | 32 | 0.3% |
| Cuba | 26 | 0.2% |
| Czechoslovakia | 12 | 0.1% |
| Dominican Republic | 88 | 0.8% |
| Eastern Africa | 56 | 0.5% |
| Eastern Asia | 180 | 1.6% |
| Eastern Europe | 89 | 0.8% |
| Europe | 281 | 2.5% |
| Germany | 29 | 0.3% |
| Greece | 19 | 0.2% |
| Guyana | 17 | 0.2% |
| India | 140 | 1.3% |
| Ireland | 17 | 0.2% |
| Italy | 84 | 0.7% |
| Japan | 2 | 0.0% |
| Kenya | 56 | 0.5% |
| Korea | 178 | 1.6% |
| Latin America | 856 | 7.6% |
| Lebanon | 39 | 0.4% |
| Lithuania | 9 | 0.1% |
| Mexico | 288 | 2.6% |
| Morocco | 18 | 0.2% |
| Nicaragua | 128 | 1.1% |
| Northern Africa | 18 | 0.2% |
| Northern Europe | 17 | 0.2% |
| Panama | 66 | 0.6% |
| Peru | 72 | 0.6% |
| Philippines | 411 | 3.7% |
| Poland | 25 | 0.2% |
| Portugal | 43 | 0.4% |
| Russia | 14 | 0.1% |
| South America | 147 | 1.3% |
| South Central Asia | 140 | 1.3% |
| South Eastern Asia | 411 | 3.7% |
| Southern Europe | 146 | 1.3% |
| Syria | 73 | 0.6% |
| Trinidad and Tobago | 33 | 0.3% |
| Western Asia | 112 | 1.0% |
| Western Europe | 29 | 0.3% | View All 46 Rows |
Sex and Age in Westwood borough
Sex and Age in Westwood borough
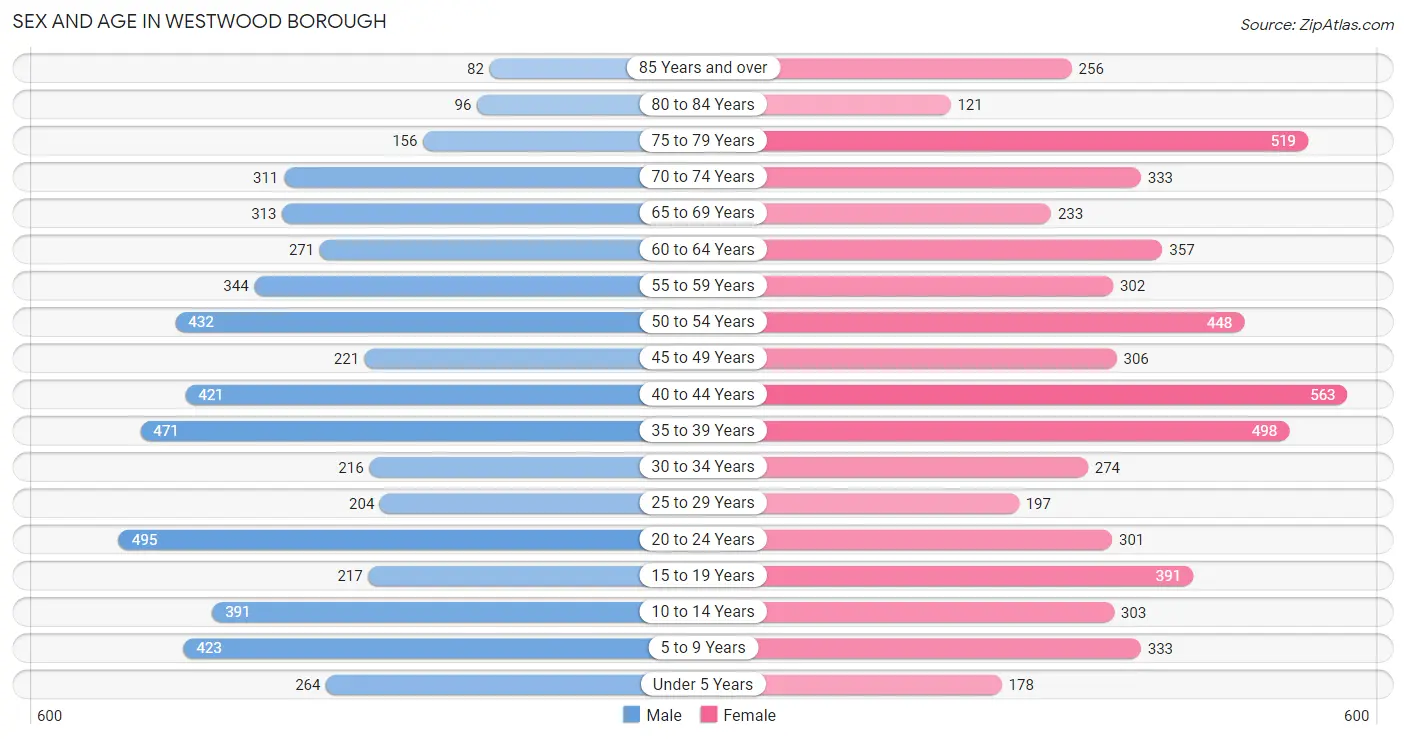
The most populous age groups in Westwood borough are 20 to 24 Years (495 | 9.3%) for men and 40 to 44 Years (563 | 9.5%) for women.
| Age Bracket | Male | Female |
| Under 5 Years | 264 (5.0%) | 178 (3.0%) |
| 5 to 9 Years | 423 (7.9%) | 333 (5.6%) |
| 10 to 14 Years | 391 (7.3%) | 303 (5.1%) |
| 15 to 19 Years | 217 (4.1%) | 391 (6.6%) |
| 20 to 24 Years | 495 (9.3%) | 301 (5.1%) |
| 25 to 29 Years | 204 (3.8%) | 197 (3.3%) |
| 30 to 34 Years | 216 (4.1%) | 274 (4.6%) |
| 35 to 39 Years | 471 (8.8%) | 498 (8.4%) |
| 40 to 44 Years | 421 (7.9%) | 563 (9.5%) |
| 45 to 49 Years | 221 (4.2%) | 306 (5.2%) |
| 50 to 54 Years | 432 (8.1%) | 448 (7.6%) |
| 55 to 59 Years | 344 (6.5%) | 302 (5.1%) |
| 60 to 64 Years | 271 (5.1%) | 357 (6.0%) |
| 65 to 69 Years | 313 (5.9%) | 233 (3.9%) |
| 70 to 74 Years | 311 (5.8%) | 333 (5.6%) |
| 75 to 79 Years | 156 (2.9%) | 519 (8.8%) |
| 80 to 84 Years | 96 (1.8%) | 121 (2.1%) |
| 85 Years and over | 82 (1.5%) | 256 (4.3%) |
| Total | 5,328 (100.0%) | 5,913 (100.0%) |
Families and Households in Westwood borough
Median Family Size in Westwood borough
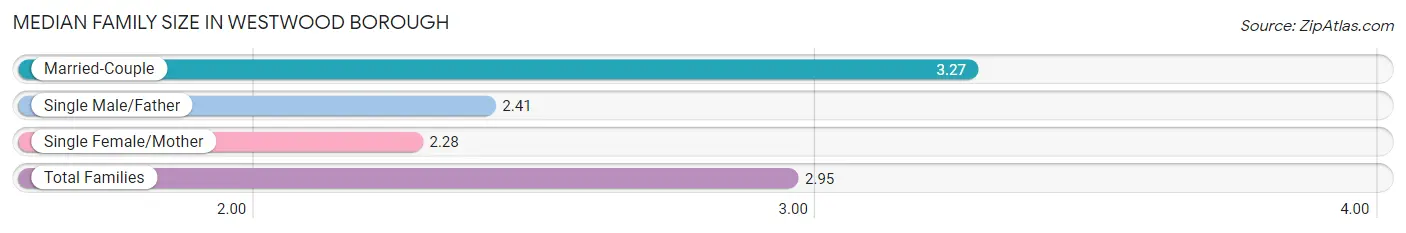
The median family size in Westwood borough is 2.95 persons per family, with married-couple families (2,095 | 66.3%) accounting for the largest median family size of 3.27 persons per family. On the other hand, single female/mother families (875 | 27.7%) represent the smallest median family size with 2.28 persons per family.
| Family Type | # Families | Family Size |
| Married-Couple | 2,095 (66.3%) | 3.27 |
| Single Male/Father | 189 (6.0%) | 2.41 |
| Single Female/Mother | 875 (27.7%) | 2.28 |
| Total Families | 3,159 (100.0%) | 2.95 |
Median Household Size in Westwood borough
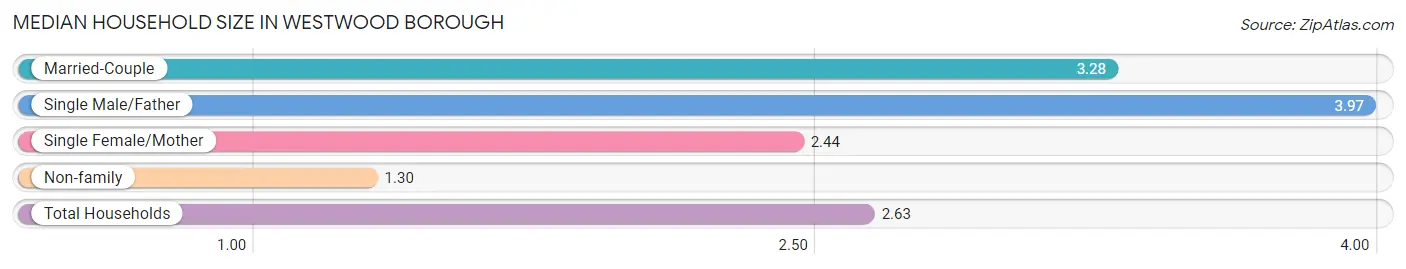
The median household size in Westwood borough is 2.63 persons per household, with single male/father households (189 | 4.5%) accounting for the largest median household size of 3.97 persons per household. non-family households (1,080 | 25.5%) represent the smallest median household size with 1.30 persons per household.
| Household Type | # Households | Household Size |
| Married-Couple | 2,095 (49.4%) | 3.28 |
| Single Male/Father | 189 (4.5%) | 3.97 |
| Single Female/Mother | 875 (20.6%) | 2.44 |
| Non-family | 1,080 (25.5%) | 1.30 |
| Total Households | 4,239 (100.0%) | 2.63 |
Household Size by Marriage Status in Westwood borough
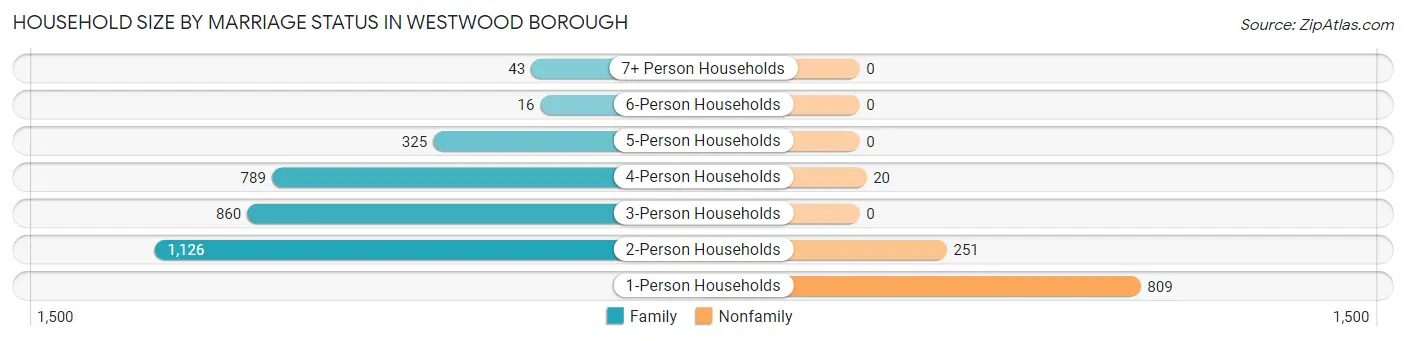
Out of a total of 4,239 households in Westwood borough, 3,159 (74.5%) are family households, while 1,080 (25.5%) are nonfamily households. The most numerous type of family households are 2-person households, comprising 1,126, and the most common type of nonfamily households are 1-person households, comprising 809.
| Household Size | Family Households | Nonfamily Households |
| 1-Person Households | - | 809 (19.1%) |
| 2-Person Households | 1,126 (26.6%) | 251 (5.9%) |
| 3-Person Households | 860 (20.3%) | 0 (0.0%) |
| 4-Person Households | 789 (18.6%) | 20 (0.5%) |
| 5-Person Households | 325 (7.7%) | 0 (0.0%) |
| 6-Person Households | 16 (0.4%) | 0 (0.0%) |
| 7+ Person Households | 43 (1.0%) | 0 (0.0%) |
| Total | 3,159 (74.5%) | 1,080 (25.5%) |
Female Fertility in Westwood borough
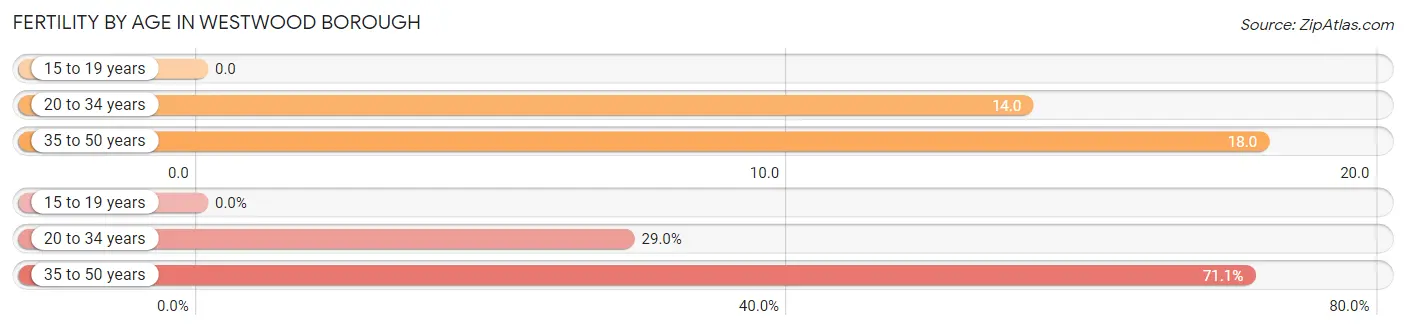
Fertility by Age in Westwood borough
Average fertility rate in Westwood borough is 14.0 births per 1,000 women. Women in the age bracket of 35 to 50 years have the highest fertility rate with 18.0 births per 1,000 women. Women in the age bracket of 35 to 50 years acount for 71.1% of all women with births.
| Age Bracket | Women with Births | Births / 1,000 Women |
| 15 to 19 years | 0 (0.0%) | 0.0 |
| 20 to 34 years | 11 (28.9%) | 14.0 |
| 35 to 50 years | 27 (71.1%) | 18.0 |
| Total | 38 (100.0%) | 14.0 |
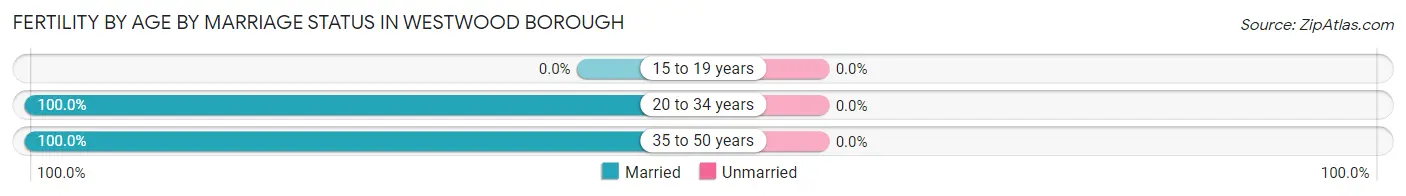
Fertility by Age by Marriage Status in Westwood borough
| Age Bracket | Married | Unmarried |
| 15 to 19 years | 0 (0.0%) | 0 (0.0%) |
| 20 to 34 years | 11 (100.0%) | 0 (0.0%) |
| 35 to 50 years | 27 (100.0%) | 0 (0.0%) |
| Total | 38 (100.0%) | 0 (0.0%) |
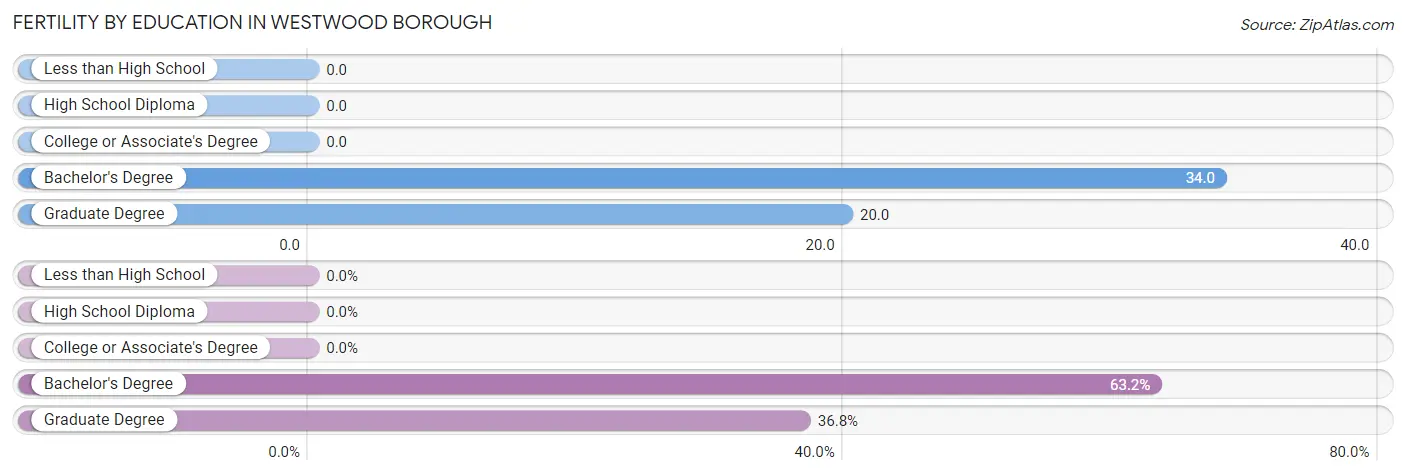
Fertility by Education in Westwood borough
| Educational Attainment | Women with Births | Births / 1,000 Women |
| Less than High School | 0 (0.0%) | 0.0 |
| High School Diploma | 0 (0.0%) | 0.0 |
| College or Associate's Degree | 0 (0.0%) | 0.0 |
| Bachelor's Degree | 24 (63.2%) | 34.0 |
| Graduate Degree | 14 (36.8%) | 20.0 |
| Total | 38 (100.0%) | 14.0 |
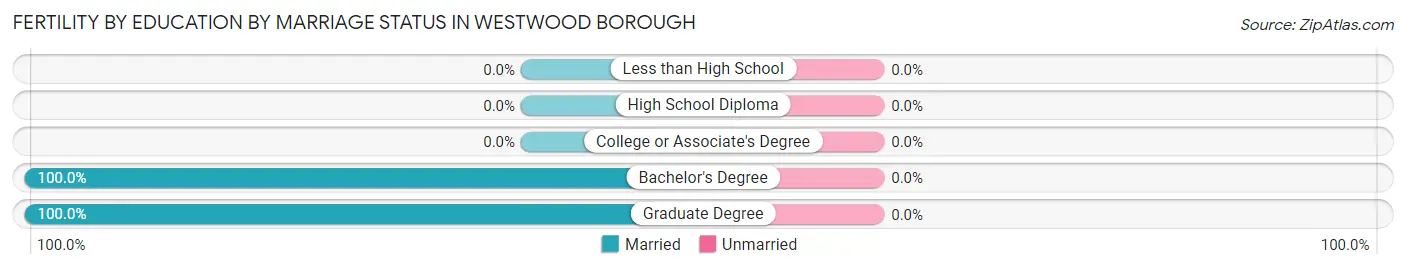
Fertility by Education by Marriage Status in Westwood borough
| Educational Attainment | Married | Unmarried |
| Less than High School | 0 (0.0%) | 0 (0.0%) |
| High School Diploma | 0 (0.0%) | 0 (0.0%) |
| College or Associate's Degree | 0 (0.0%) | 0 (0.0%) |
| Bachelor's Degree | 24 (100.0%) | 0 (0.0%) |
| Graduate Degree | 14 (100.0%) | 0 (0.0%) |
| Total | 38 (100.0%) | 0 (0.0%) |
Employment Characteristics in Westwood borough
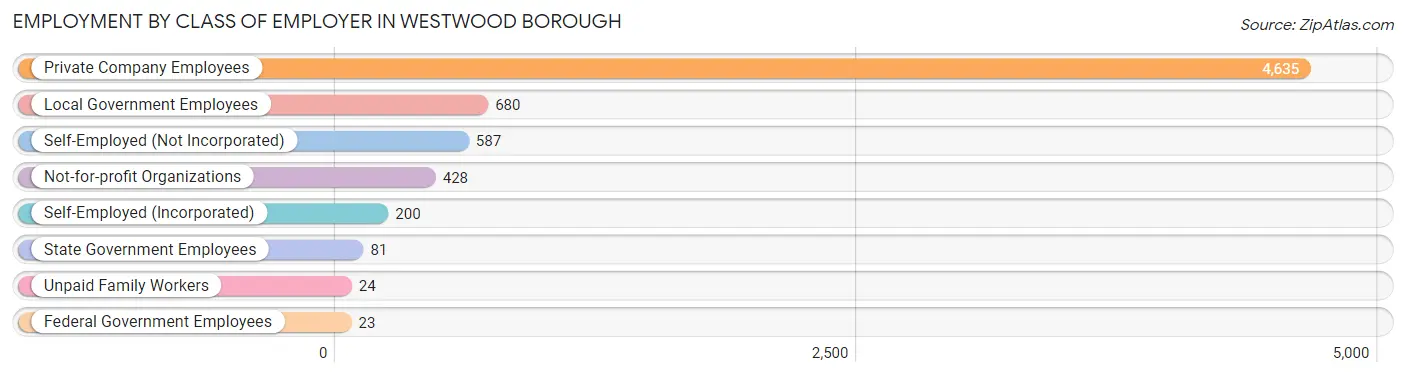
Employment by Class of Employer in Westwood borough
Among the 6,658 employed individuals in Westwood borough, private company employees (4,635 | 69.6%), local government employees (680 | 10.2%), and self-employed (not incorporated) (587 | 8.8%) make up the most common classes of employment.
| Employer Class | # Employees | % Employees |
| Private Company Employees | 4,635 | 69.6% |
| Self-Employed (Incorporated) | 200 | 3.0% |
| Self-Employed (Not Incorporated) | 587 | 8.8% |
| Not-for-profit Organizations | 428 | 6.4% |
| Local Government Employees | 680 | 10.2% |
| State Government Employees | 81 | 1.2% |
| Federal Government Employees | 23 | 0.4% |
| Unpaid Family Workers | 24 | 0.4% |
| Total | 6,658 | 100.0% |
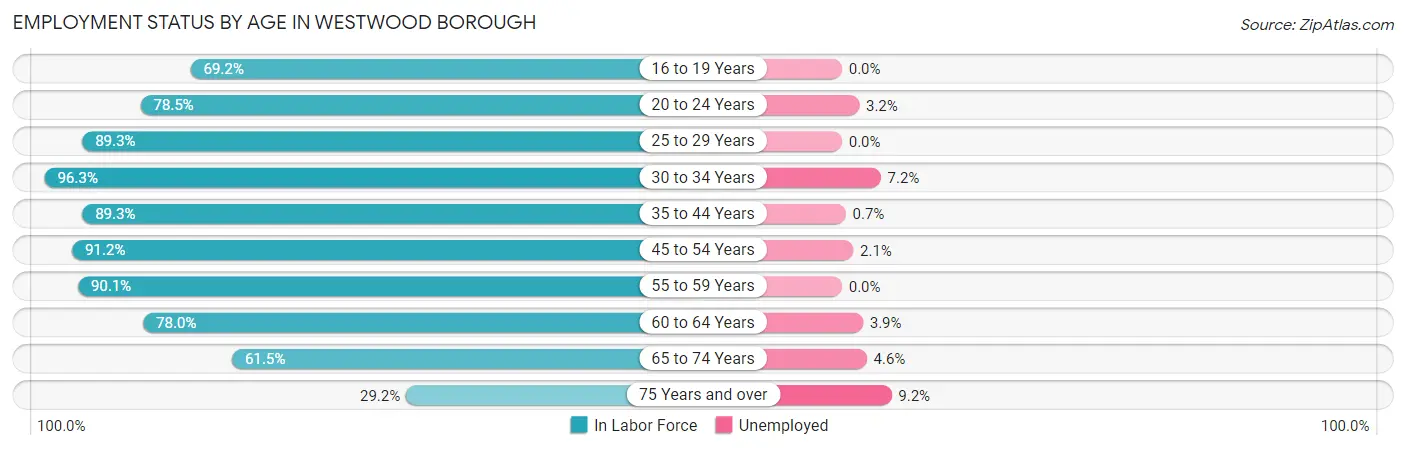
Employment Status by Age in Westwood borough
According to the labor force statistics for Westwood borough, out of the total population over 16 years of age (9,196), 75.7% or 6,961 individuals are in the labor force, with 2.6% or 181 of them unemployed. The age group with the highest labor force participation rate is 30 to 34 years, with 96.3% or 472 individuals in the labor force. Within the labor force, the 75 years and over age range has the highest percentage of unemployed individuals, with 9.2% or 33 of them being unemployed.
| Age Bracket | In Labor Force | Unemployed |
| 16 to 19 Years | 315 (69.2%) | 0 (0.0%) |
| 20 to 24 Years | 625 (78.5%) | 20 (3.2%) |
| 25 to 29 Years | 358 (89.3%) | 0 (0.0%) |
| 30 to 34 Years | 472 (96.3%) | 34 (7.2%) |
| 35 to 44 Years | 1,744 (89.3%) | 12 (0.7%) |
| 45 to 54 Years | 1,283 (91.2%) | 27 (2.1%) |
| 55 to 59 Years | 582 (90.1%) | 0 (0.0%) |
| 60 to 64 Years | 490 (78.0%) | 19 (3.9%) |
| 65 to 74 Years | 732 (61.5%) | 34 (4.6%) |
| 75 Years and over | 359 (29.2%) | 33 (9.2%) |
| Total | 6,961 (75.7%) | 181 (2.6%) |
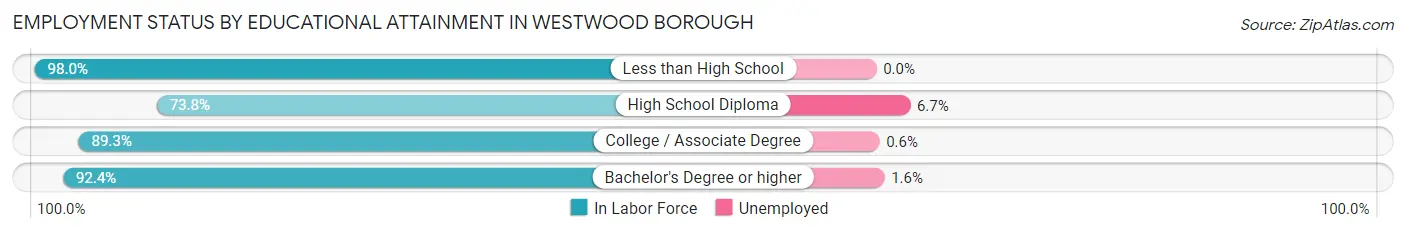
Employment Status by Educational Attainment in Westwood borough
According to labor force statistics for Westwood borough, 89.2% of individuals (4,928) out of the total population between 25 and 64 years of age (5,525) are in the labor force, with 1.9% or 94 of them being unemployed. The group with the highest labor force participation rate are those with the educational attainment of less than high school, with 98.0% or 198 individuals in the labor force. Within the labor force, individuals with high school diploma education have the highest percentage of unemployment, with 6.7% or 38 of them being unemployed.
| Educational Attainment | In Labor Force | Unemployed |
| Less than High School | 198 (98.0%) | 0 (0.0%) |
| High School Diploma | 571 (73.8%) | 52 (6.7%) |
| College / Associate Degree | 1,206 (89.3%) | 8 (0.6%) |
| Bachelor's Degree or higher | 2,956 (92.4%) | 51 (1.6%) |
| Total | 4,928 (89.2%) | 105 (1.9%) |
Employment Occupations by Sex in Westwood borough
Management, Business, Science and Arts Occupations
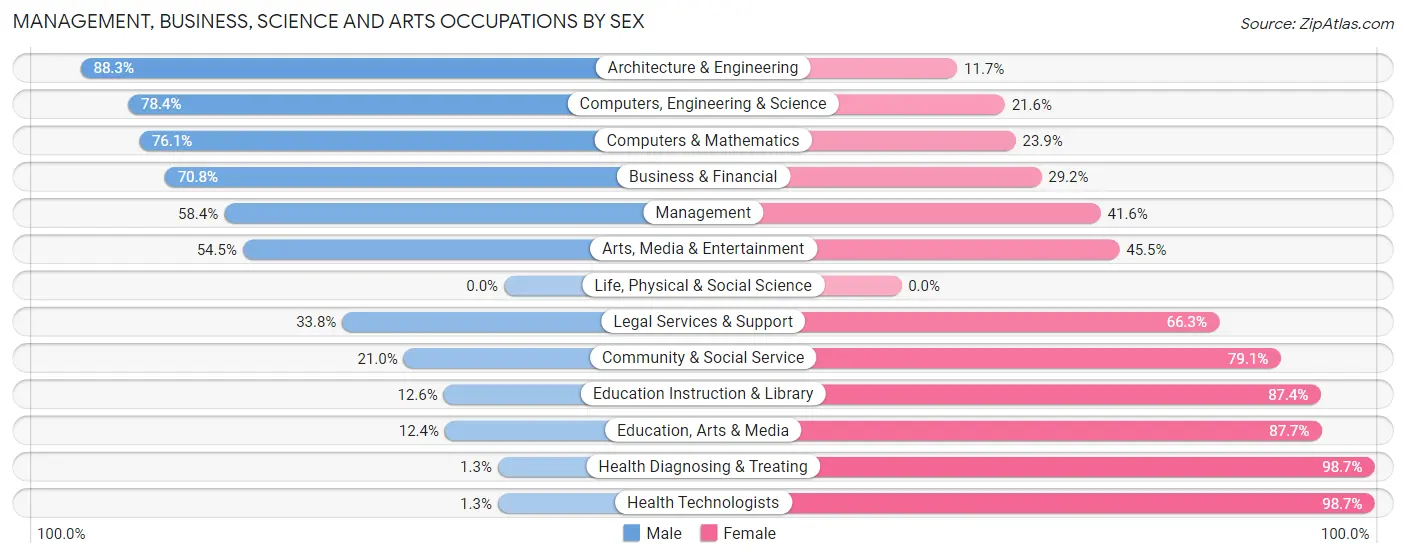
The most common Management, Business, Science and Arts occupations in Westwood borough are Management (1,190 | 17.5%), Community & Social Service (1,093 | 16.1%), Education Instruction & Library (754 | 11.1%), Health Diagnosing & Treating (540 | 8.0%), and Health Technologists (540 | 8.0%).
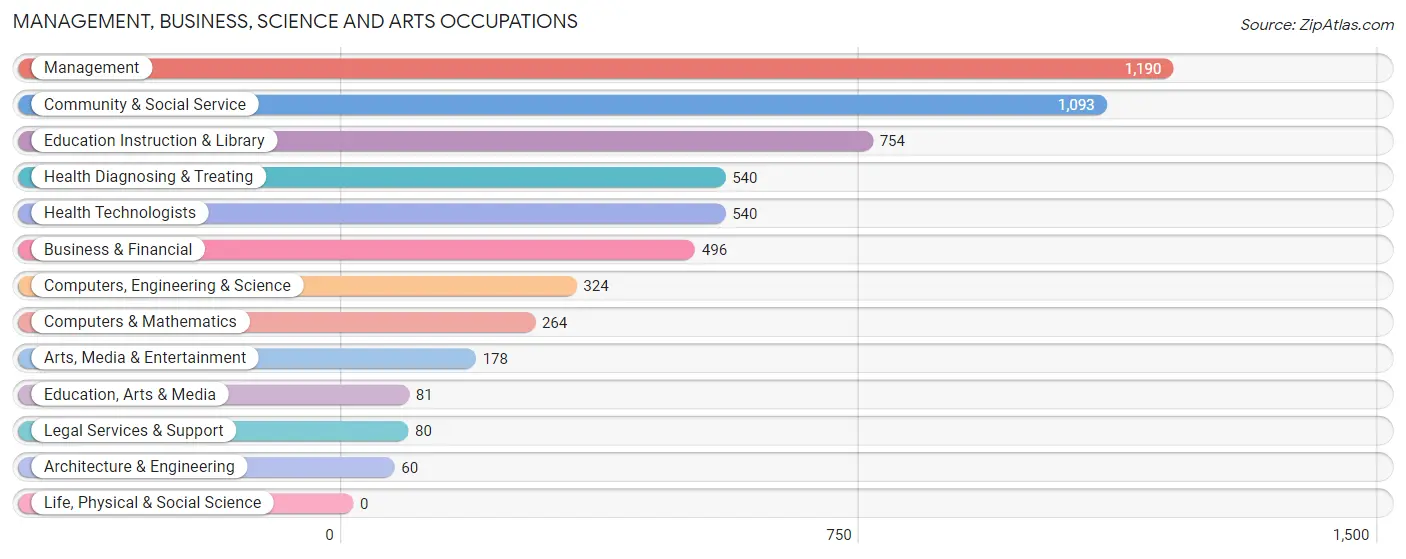
Management, Business, Science and Arts Occupations by Sex
Within the Management, Business, Science and Arts occupations in Westwood borough, the most male-oriented occupations are Architecture & Engineering (88.3%), Computers, Engineering & Science (78.4%), and Computers & Mathematics (76.1%), while the most female-oriented occupations are Health Diagnosing & Treating (98.7%), Health Technologists (98.7%), and Education, Arts & Media (87.6%).
| Occupation | Male | Female |
| Management | 695 (58.4%) | 495 (41.6%) |
| Business & Financial | 351 (70.8%) | 145 (29.2%) |
| Computers, Engineering & Science | 254 (78.4%) | 70 (21.6%) |
| Computers & Mathematics | 201 (76.1%) | 63 (23.9%) |
| Architecture & Engineering | 53 (88.3%) | 7 (11.7%) |
| Life, Physical & Social Science | 0 (0.0%) | 0 (0.0%) |
| Community & Social Service | 229 (20.9%) | 864 (79.0%) |
| Education, Arts & Media | 10 (12.3%) | 71 (87.6%) |
| Legal Services & Support | 27 (33.8%) | 53 (66.2%) |
| Education Instruction & Library | 95 (12.6%) | 659 (87.4%) |
| Arts, Media & Entertainment | 97 (54.5%) | 81 (45.5%) |
| Health Diagnosing & Treating | 7 (1.3%) | 533 (98.7%) |
| Health Technologists | 7 (1.3%) | 533 (98.7%) |
| Total (Category) | 1,536 (42.2%) | 2,107 (57.8%) |
| Total (Overall) | 3,405 (50.2%) | 3,376 (49.8%) |
Services Occupations
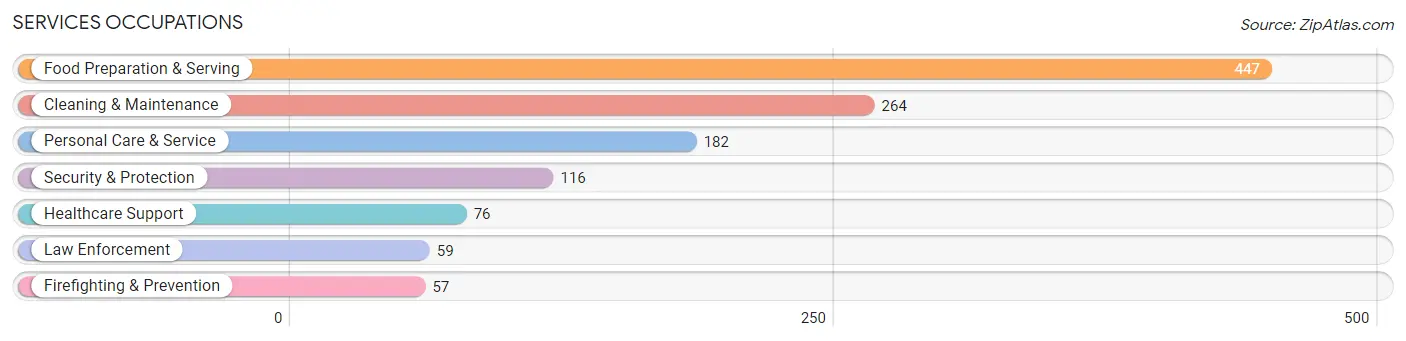
The most common Services occupations in Westwood borough are Food Preparation & Serving (447 | 6.6%), Cleaning & Maintenance (264 | 3.9%), Personal Care & Service (182 | 2.7%), Security & Protection (116 | 1.7%), and Healthcare Support (76 | 1.1%).
Services Occupations by Sex
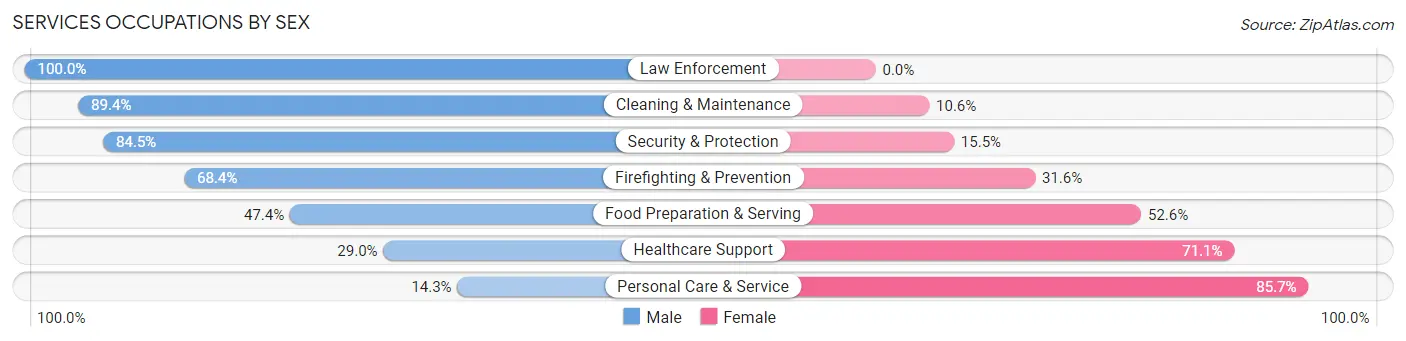
Within the Services occupations in Westwood borough, the most male-oriented occupations are Law Enforcement (100.0%), Cleaning & Maintenance (89.4%), and Security & Protection (84.5%), while the most female-oriented occupations are Personal Care & Service (85.7%), Healthcare Support (71.1%), and Food Preparation & Serving (52.6%).
| Occupation | Male | Female |
| Healthcare Support | 22 (28.9%) | 54 (71.1%) |
| Security & Protection | 98 (84.5%) | 18 (15.5%) |
| Firefighting & Prevention | 39 (68.4%) | 18 (31.6%) |
| Law Enforcement | 59 (100.0%) | 0 (0.0%) |
| Food Preparation & Serving | 212 (47.4%) | 235 (52.6%) |
| Cleaning & Maintenance | 236 (89.4%) | 28 (10.6%) |
| Personal Care & Service | 26 (14.3%) | 156 (85.7%) |
| Total (Category) | 594 (54.7%) | 491 (45.3%) |
| Total (Overall) | 3,405 (50.2%) | 3,376 (49.8%) |
Sales and Office Occupations
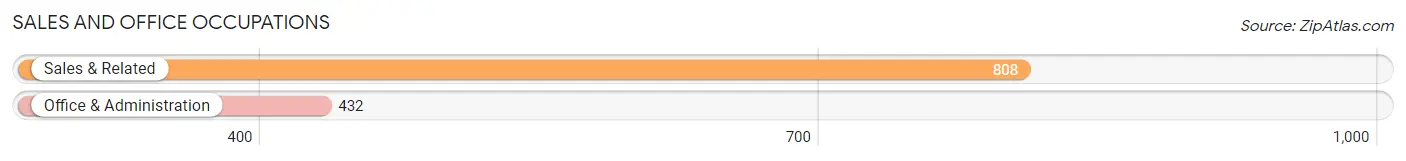
The most common Sales and Office occupations in Westwood borough are Sales & Related (808 | 11.9%), and Office & Administration (432 | 6.4%).
Sales and Office Occupations by Sex
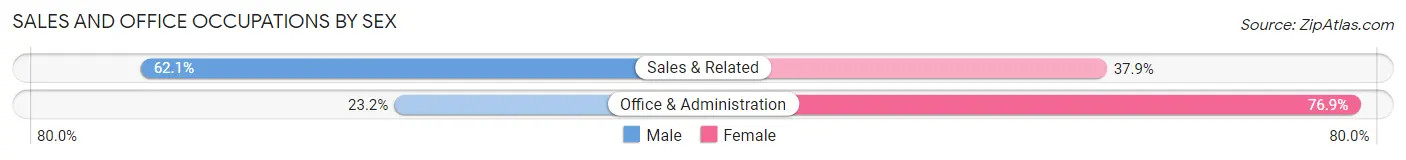
| Occupation | Male | Female |
| Sales & Related | 502 (62.1%) | 306 (37.9%) |
| Office & Administration | 100 (23.2%) | 332 (76.8%) |
| Total (Category) | 602 (48.5%) | 638 (51.4%) |
| Total (Overall) | 3,405 (50.2%) | 3,376 (49.8%) |
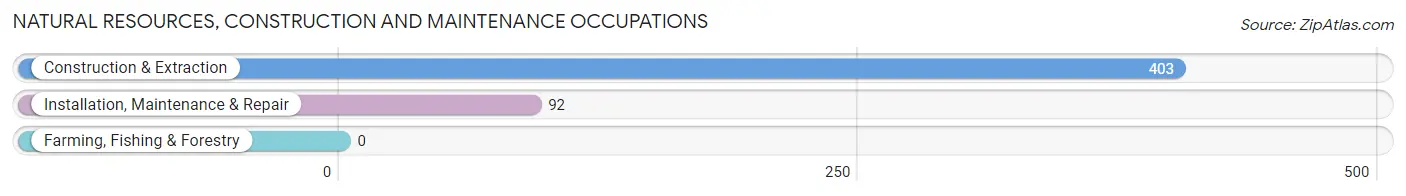
Natural Resources, Construction and Maintenance Occupations
The most common Natural Resources, Construction and Maintenance occupations in Westwood borough are Construction & Extraction (403 | 5.9%), and Installation, Maintenance & Repair (92 | 1.4%).
Natural Resources, Construction and Maintenance Occupations by Sex
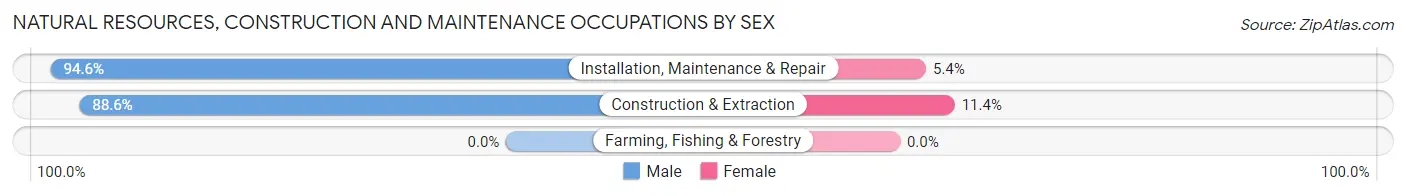
| Occupation | Male | Female |
| Farming, Fishing & Forestry | 0 (0.0%) | 0 (0.0%) |
| Construction & Extraction | 357 (88.6%) | 46 (11.4%) |
| Installation, Maintenance & Repair | 87 (94.6%) | 5 (5.4%) |
| Total (Category) | 444 (89.7%) | 51 (10.3%) |
| Total (Overall) | 3,405 (50.2%) | 3,376 (49.8%) |
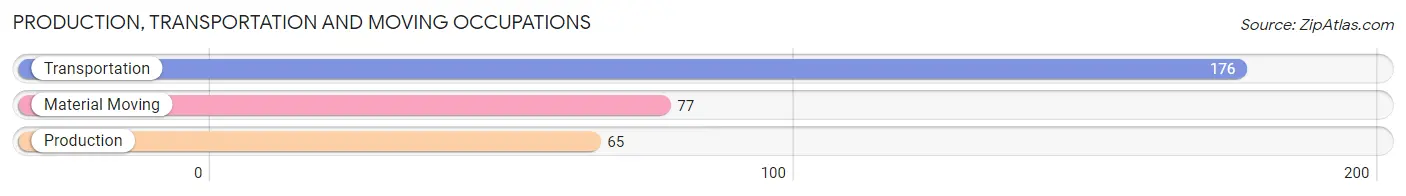
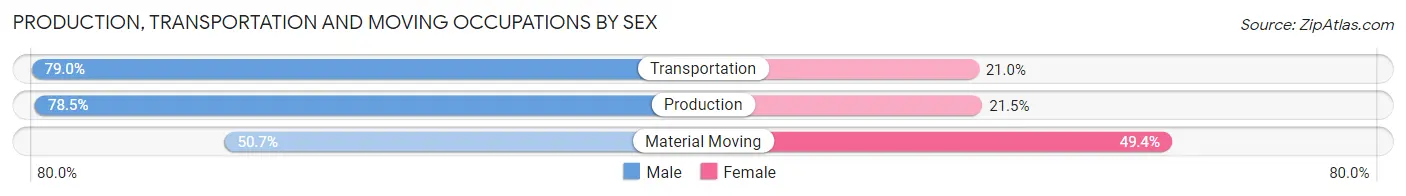
Production, Transportation and Moving Occupations
The most common Production, Transportation and Moving occupations in Westwood borough are Transportation (176 | 2.6%), Material Moving (77 | 1.1%), and Production (65 | 1.0%).
Production, Transportation and Moving Occupations by Sex
| Occupation | Male | Female |
| Production | 51 (78.5%) | 14 (21.5%) |
| Transportation | 139 (79.0%) | 37 (21.0%) |
| Material Moving | 39 (50.6%) | 38 (49.3%) |
| Total (Category) | 229 (72.0%) | 89 (28.0%) |
| Total (Overall) | 3,405 (50.2%) | 3,376 (49.8%) |
Employment Industries by Sex in Westwood borough
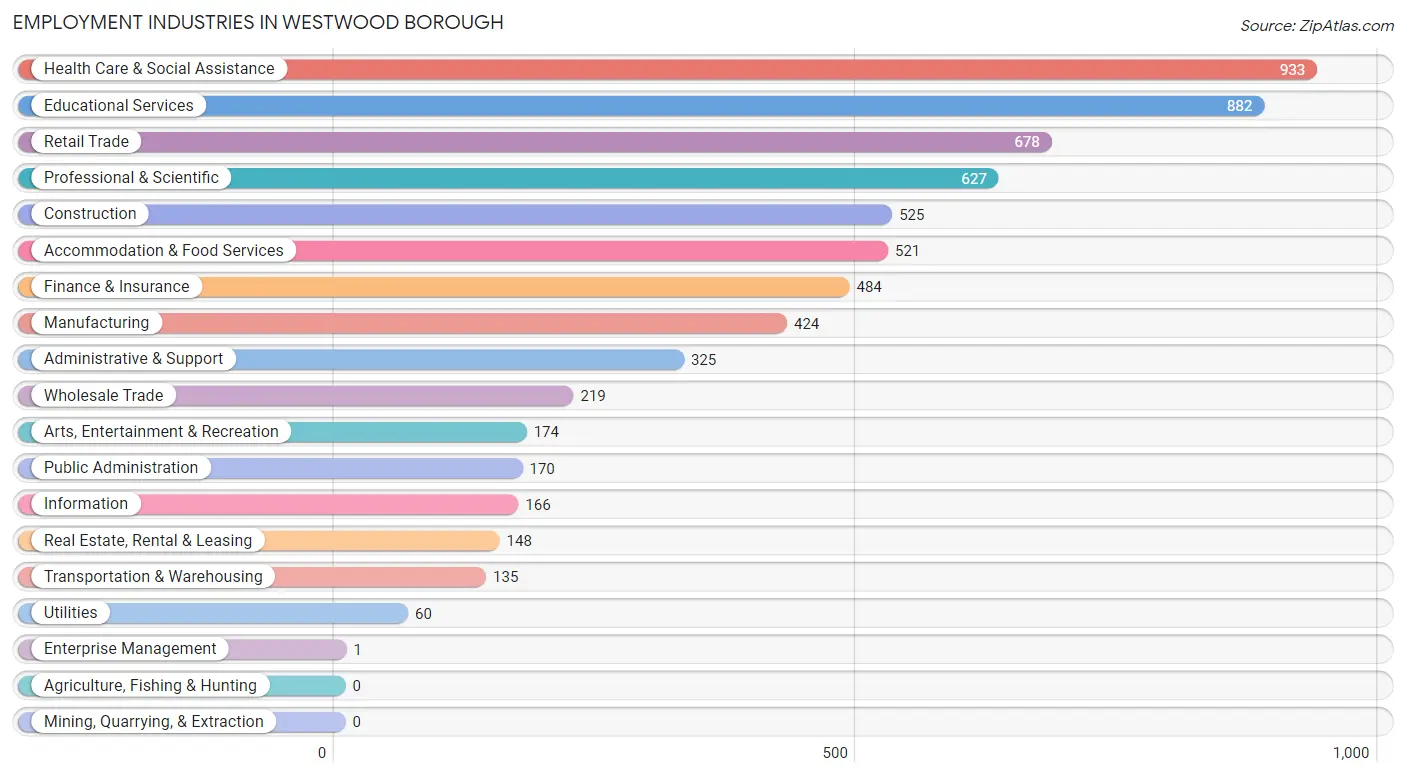
Employment Industries in Westwood borough
The major employment industries in Westwood borough include Health Care & Social Assistance (933 | 13.8%), Educational Services (882 | 13.0%), Retail Trade (678 | 10.0%), Professional & Scientific (627 | 9.2%), and Construction (525 | 7.7%).
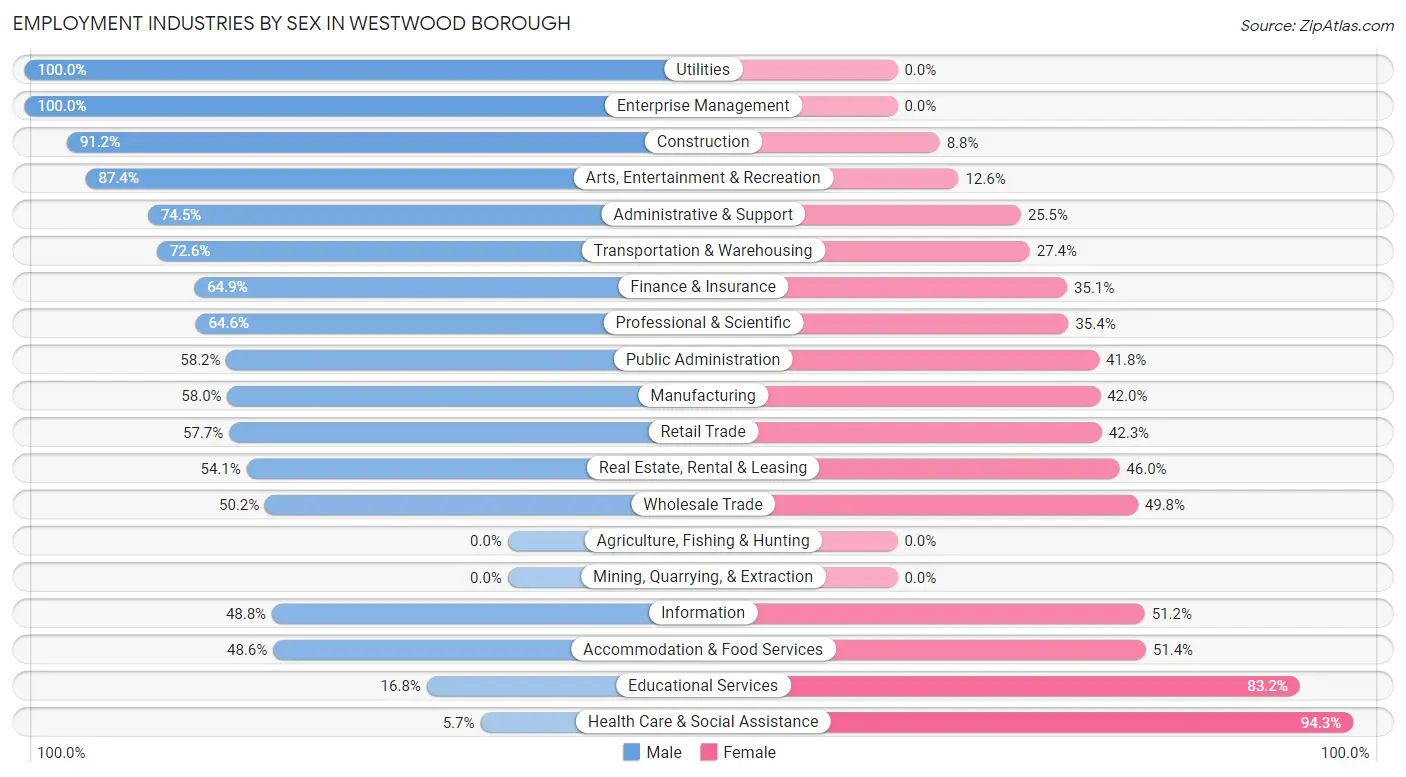
Employment Industries by Sex in Westwood borough
The Westwood borough industries that see more men than women are Utilities (100.0%), Enterprise Management (100.0%), and Construction (91.2%), whereas the industries that tend to have a higher number of women are Health Care & Social Assistance (94.3%), Educational Services (83.2%), and Accommodation & Food Services (51.4%).
| Industry | Male | Female |
| Agriculture, Fishing & Hunting | 0 (0.0%) | 0 (0.0%) |
| Mining, Quarrying, & Extraction | 0 (0.0%) | 0 (0.0%) |
| Construction | 479 (91.2%) | 46 (8.8%) |
| Manufacturing | 246 (58.0%) | 178 (42.0%) |
| Wholesale Trade | 110 (50.2%) | 109 (49.8%) |
| Retail Trade | 391 (57.7%) | 287 (42.3%) |
| Transportation & Warehousing | 98 (72.6%) | 37 (27.4%) |
| Utilities | 60 (100.0%) | 0 (0.0%) |
| Information | 81 (48.8%) | 85 (51.2%) |
| Finance & Insurance | 314 (64.9%) | 170 (35.1%) |
| Real Estate, Rental & Leasing | 80 (54.0%) | 68 (46.0%) |
| Professional & Scientific | 405 (64.6%) | 222 (35.4%) |
| Enterprise Management | 1 (100.0%) | 0 (0.0%) |
| Administrative & Support | 242 (74.5%) | 83 (25.5%) |
| Educational Services | 148 (16.8%) | 734 (83.2%) |
| Health Care & Social Assistance | 53 (5.7%) | 880 (94.3%) |
| Arts, Entertainment & Recreation | 152 (87.4%) | 22 (12.6%) |
| Accommodation & Food Services | 253 (48.6%) | 268 (51.4%) |
| Public Administration | 99 (58.2%) | 71 (41.8%) |
| Total | 3,405 (50.2%) | 3,376 (49.8%) |
Education in Westwood borough
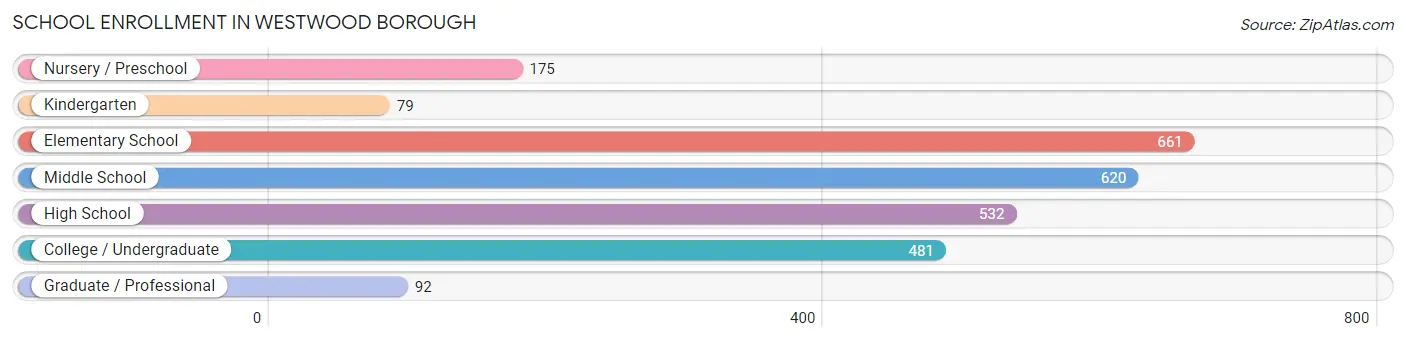
School Enrollment in Westwood borough
The most common levels of schooling among the 2,640 students in Westwood borough are elementary school (661 | 25.0%), middle school (620 | 23.5%), and high school (532 | 20.2%).
| School Level | # Students | % Students |
| Nursery / Preschool | 175 | 6.6% |
| Kindergarten | 79 | 3.0% |
| Elementary School | 661 | 25.0% |
| Middle School | 620 | 23.5% |
| High School | 532 | 20.2% |
| College / Undergraduate | 481 | 18.2% |
| Graduate / Professional | 92 | 3.5% |
| Total | 2,640 | 100.0% |
School Enrollment by Age by Funding Source in Westwood borough
Out of a total of 2,640 students who are enrolled in schools in Westwood borough, 491 (18.6%) attend a private institution, while the remaining 2,149 (81.4%) are enrolled in public schools. The age group of 3 to 4 year olds has the highest likelihood of being enrolled in private schools, with 108 (67.5% in the age bracket) enrolled. Conversely, the age group of 5 to 9 year old has the lowest likelihood of being enrolled in a private school, with 701 (97.9% in the age bracket) attending a public institution.
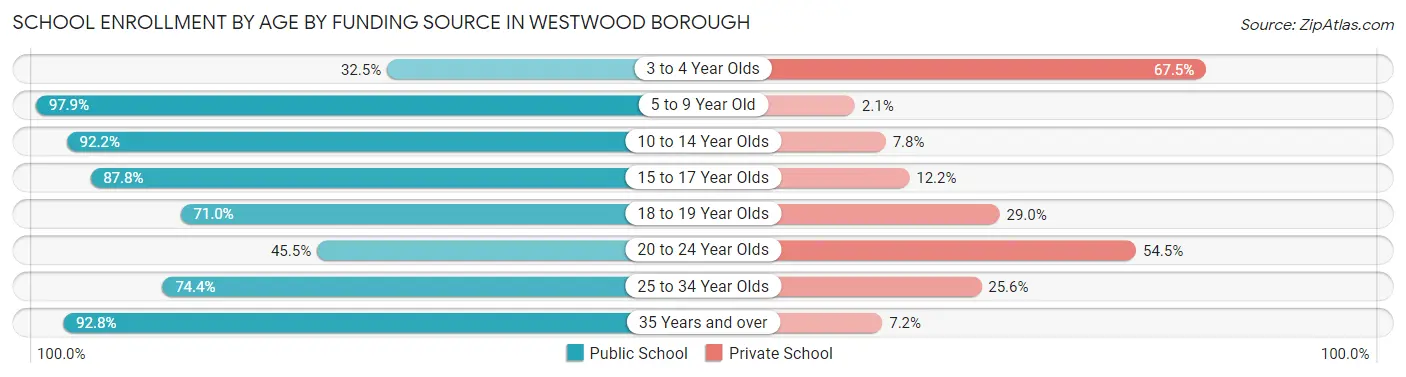
| Age Bracket | Public School | Private School |
| 3 to 4 Year Olds | 52 (32.5%) | 108 (67.5%) |
| 5 to 9 Year Old | 701 (97.9%) | 15 (2.1%) |
| 10 to 14 Year Olds | 624 (92.2%) | 53 (7.8%) |
| 15 to 17 Year Olds | 273 (87.8%) | 38 (12.2%) |
| 18 to 19 Year Olds | 176 (71.0%) | 72 (29.0%) |
| 20 to 24 Year Olds | 153 (45.5%) | 183 (54.5%) |
| 25 to 34 Year Olds | 29 (74.4%) | 10 (25.6%) |
| 35 Years and over | 142 (92.8%) | 11 (7.2%) |
| Total | 2,149 (81.4%) | 491 (18.6%) |
Educational Attainment by Field of Study in Westwood borough
Business (1,026 | 22.9%), science & technology (486 | 10.9%), education (434 | 9.7%), psychology (332 | 7.4%), and literature & languages (323 | 7.2%) are the most common fields of study among 4,475 individuals in Westwood borough who have obtained a bachelor's degree or higher.
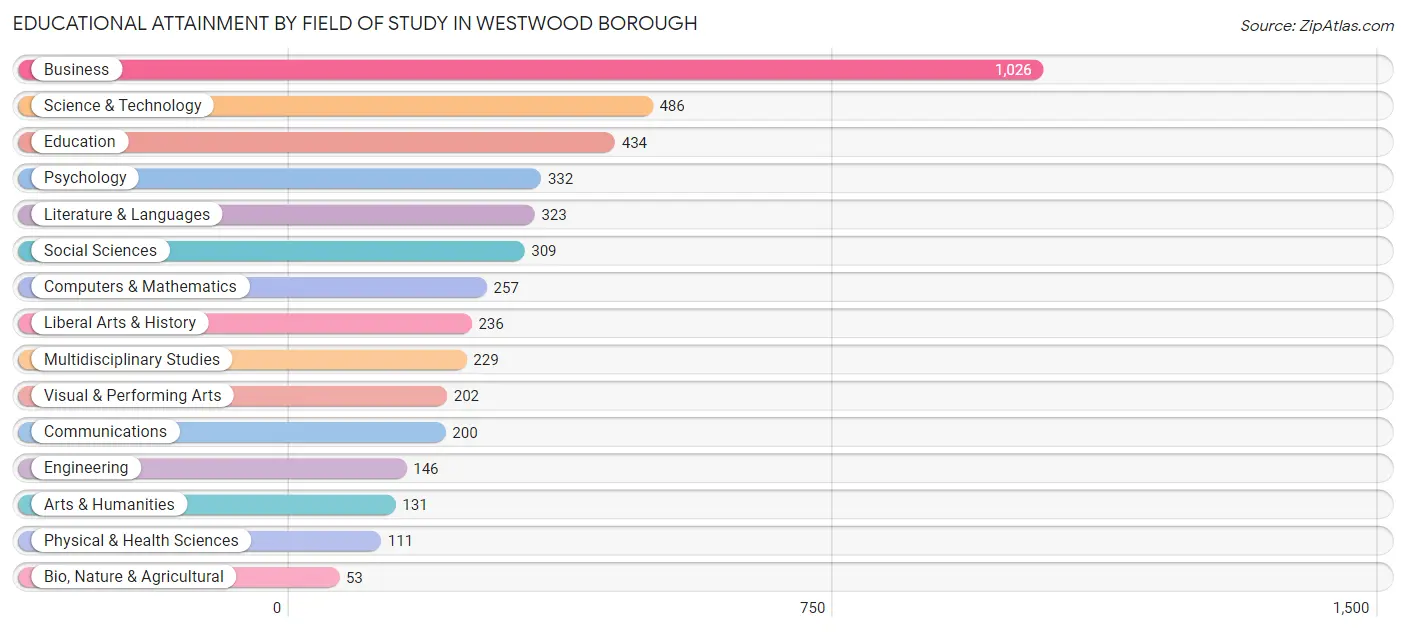
| Field of Study | # Graduates | % Graduates |
| Computers & Mathematics | 257 | 5.7% |
| Bio, Nature & Agricultural | 53 | 1.2% |
| Physical & Health Sciences | 111 | 2.5% |
| Psychology | 332 | 7.4% |
| Social Sciences | 309 | 6.9% |
| Engineering | 146 | 3.3% |
| Multidisciplinary Studies | 229 | 5.1% |
| Science & Technology | 486 | 10.9% |
| Business | 1,026 | 22.9% |
| Education | 434 | 9.7% |
| Literature & Languages | 323 | 7.2% |
| Liberal Arts & History | 236 | 5.3% |
| Visual & Performing Arts | 202 | 4.5% |
| Communications | 200 | 4.5% |
| Arts & Humanities | 131 | 2.9% |
| Total | 4,475 | 100.0% |
Transportation & Commute in Westwood borough
Vehicle Availability by Sex in Westwood borough
The most prevalent vehicle ownership categories in Westwood borough are males with 2 vehicles (1,477, accounting for 43.9%) and females with 2 vehicles (1,176, making up 45.0%).
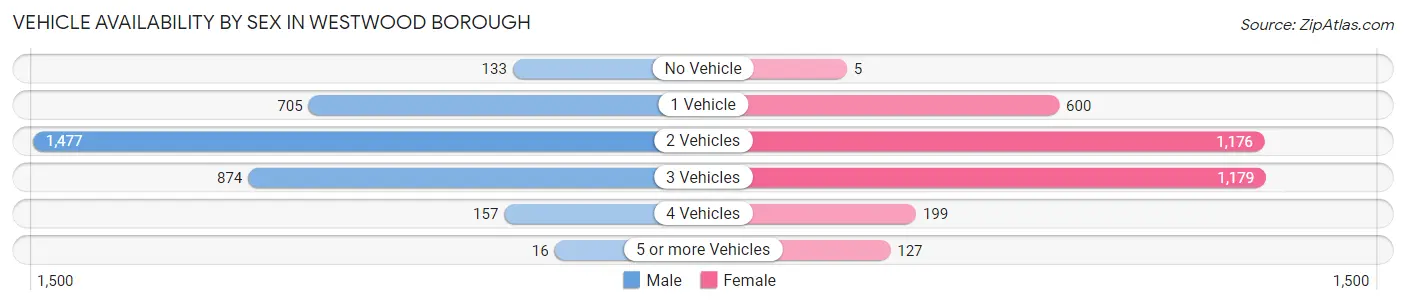
| Vehicles Available | Male | Female |
| No Vehicle | 133 (4.0%) | 5 (0.2%) |
| 1 Vehicle | 705 (21.0%) | 600 (18.3%) |
| 2 Vehicles | 1,477 (43.9%) | 1,176 (35.8%) |
| 3 Vehicles | 874 (26.0%) | 1,179 (35.9%) |
| 4 Vehicles | 157 (4.7%) | 199 (6.1%) |
| 5 or more Vehicles | 16 (0.5%) | 127 (3.9%) |
| Total | 3,362 (100.0%) | 3,286 (100.0%) |
Commute Time in Westwood borough
The most frequently occuring commute durations in Westwood borough are 10 to 14 minutes (1,035 commuters, 18.7%), 45 to 59 minutes (785 commuters, 14.2%), and 20 to 24 minutes (630 commuters, 11.4%).
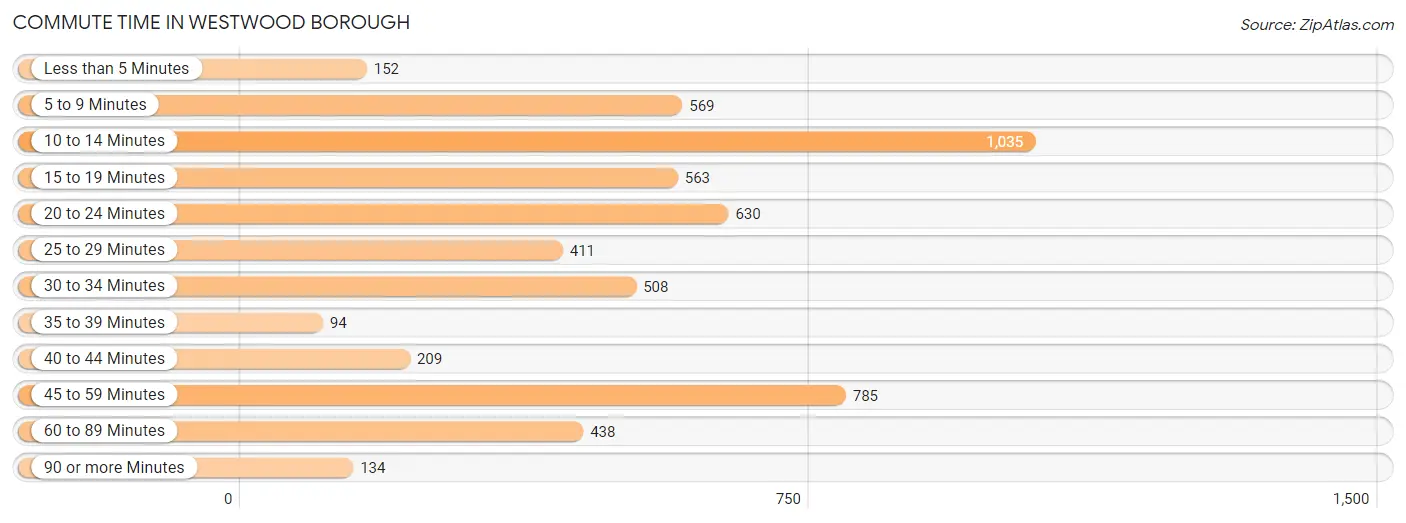
| Commute Time | # Commuters | % Commuters |
| Less than 5 Minutes | 152 | 2.8% |
| 5 to 9 Minutes | 569 | 10.3% |
| 10 to 14 Minutes | 1,035 | 18.7% |
| 15 to 19 Minutes | 563 | 10.2% |
| 20 to 24 Minutes | 630 | 11.4% |
| 25 to 29 Minutes | 411 | 7.4% |
| 30 to 34 Minutes | 508 | 9.2% |
| 35 to 39 Minutes | 94 | 1.7% |
| 40 to 44 Minutes | 209 | 3.8% |
| 45 to 59 Minutes | 785 | 14.2% |
| 60 to 89 Minutes | 438 | 7.9% |
| 90 or more Minutes | 134 | 2.4% |
Commute Time by Sex in Westwood borough
The most common commute times in Westwood borough are 10 to 14 minutes (650 commuters, 22.9%) for males and 45 to 59 minutes (436 commuters, 16.2%) for females.
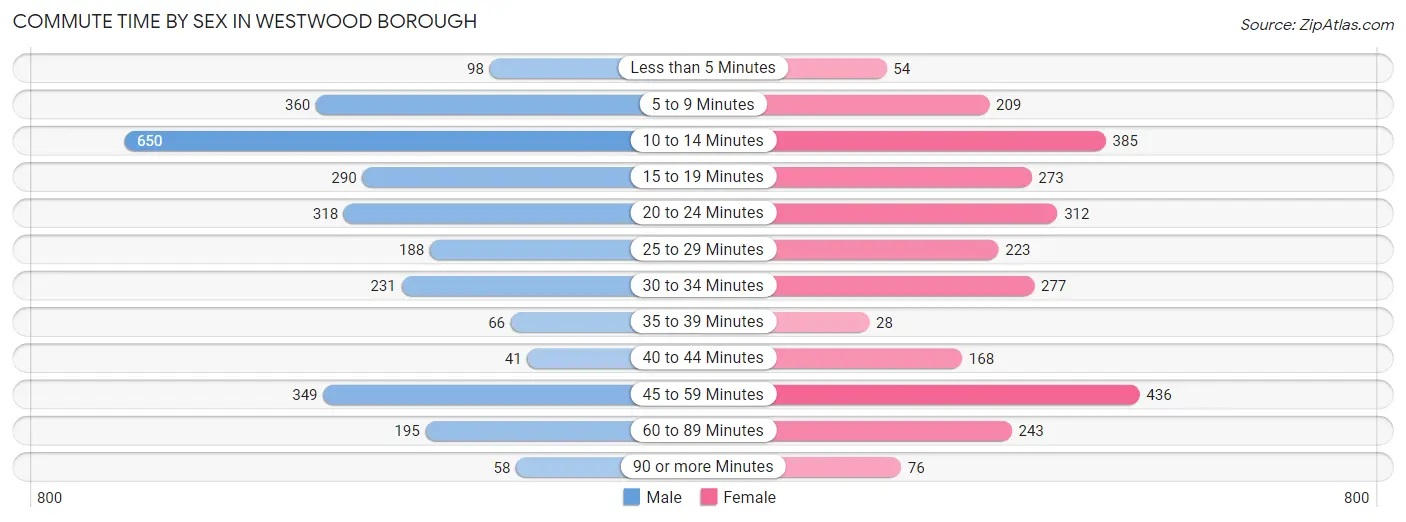
| Commute Time | Male | Female |
| Less than 5 Minutes | 98 (3.5%) | 54 (2.0%) |
| 5 to 9 Minutes | 360 (12.7%) | 209 (7.8%) |
| 10 to 14 Minutes | 650 (22.9%) | 385 (14.3%) |
| 15 to 19 Minutes | 290 (10.2%) | 273 (10.2%) |
| 20 to 24 Minutes | 318 (11.2%) | 312 (11.6%) |
| 25 to 29 Minutes | 188 (6.6%) | 223 (8.3%) |
| 30 to 34 Minutes | 231 (8.1%) | 277 (10.3%) |
| 35 to 39 Minutes | 66 (2.3%) | 28 (1.0%) |
| 40 to 44 Minutes | 41 (1.4%) | 168 (6.3%) |
| 45 to 59 Minutes | 349 (12.3%) | 436 (16.2%) |
| 60 to 89 Minutes | 195 (6.9%) | 243 (9.0%) |
| 90 or more Minutes | 58 (2.0%) | 76 (2.8%) |
Time of Departure to Work by Sex in Westwood borough
The most frequent times of departure to work in Westwood borough are 9:00 AM to 9:59 AM (449, 15.8%) for males and 7:00 AM to 7:29 AM (453, 16.9%) for females.
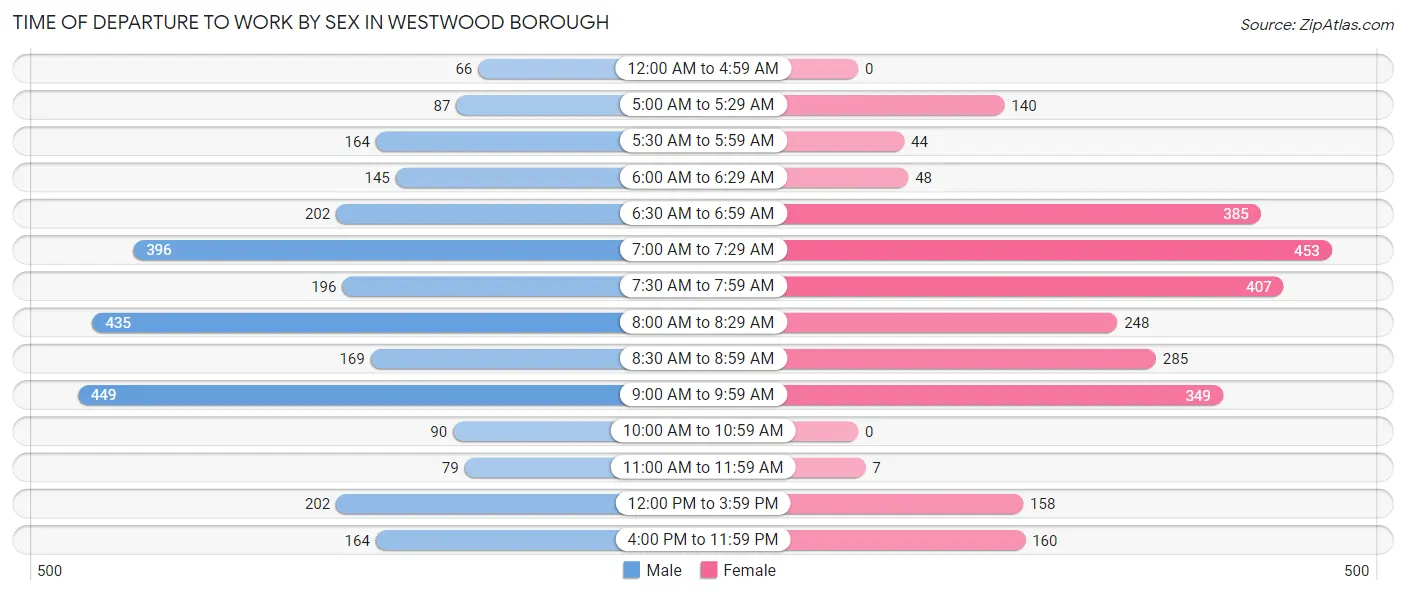
| Time of Departure | Male | Female |
| 12:00 AM to 4:59 AM | 66 (2.3%) | 0 (0.0%) |
| 5:00 AM to 5:29 AM | 87 (3.1%) | 140 (5.2%) |
| 5:30 AM to 5:59 AM | 164 (5.8%) | 44 (1.6%) |
| 6:00 AM to 6:29 AM | 145 (5.1%) | 48 (1.8%) |
| 6:30 AM to 6:59 AM | 202 (7.1%) | 385 (14.3%) |
| 7:00 AM to 7:29 AM | 396 (13.9%) | 453 (16.9%) |
| 7:30 AM to 7:59 AM | 196 (6.9%) | 407 (15.2%) |
| 8:00 AM to 8:29 AM | 435 (15.3%) | 248 (9.2%) |
| 8:30 AM to 8:59 AM | 169 (5.9%) | 285 (10.6%) |
| 9:00 AM to 9:59 AM | 449 (15.8%) | 349 (13.0%) |
| 10:00 AM to 10:59 AM | 90 (3.2%) | 0 (0.0%) |
| 11:00 AM to 11:59 AM | 79 (2.8%) | 7 (0.3%) |
| 12:00 PM to 3:59 PM | 202 (7.1%) | 158 (5.9%) |
| 4:00 PM to 11:59 PM | 164 (5.8%) | 160 (6.0%) |
| Total | 2,844 (100.0%) | 2,684 (100.0%) |
Housing Occupancy in Westwood borough
Occupancy by Ownership in Westwood borough
Of the total 4,239 dwellings in Westwood borough, owner-occupied units account for 2,755 (65.0%), while renter-occupied units make up 1,484 (35.0%).
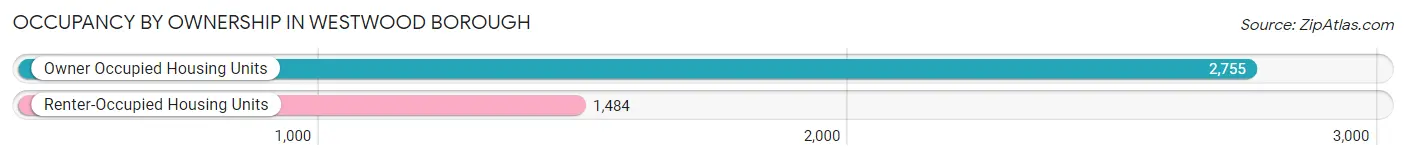
| Occupancy | # Housing Units | % Housing Units |
| Owner Occupied Housing Units | 2,755 | 65.0% |
| Renter-Occupied Housing Units | 1,484 | 35.0% |
| Total Occupied Housing Units | 4,239 | 100.0% |
Occupancy by Household Size in Westwood borough
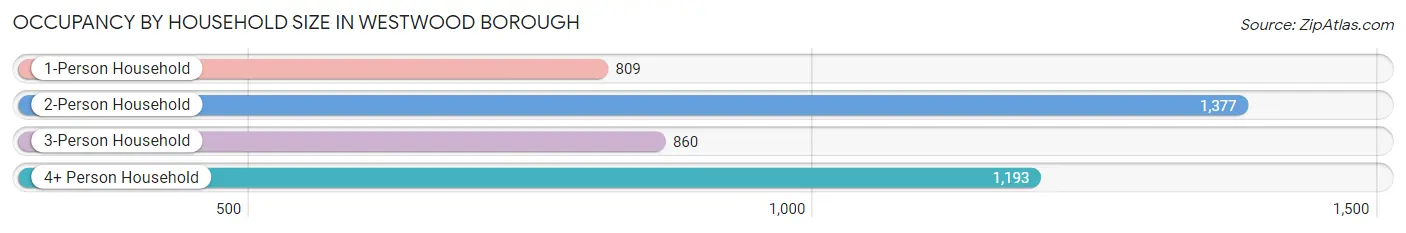
| Household Size | # Housing Units | % Housing Units |
| 1-Person Household | 809 | 19.1% |
| 2-Person Household | 1,377 | 32.5% |
| 3-Person Household | 860 | 20.3% |
| 4+ Person Household | 1,193 | 28.1% |
| Total Housing Units | 4,239 | 100.0% |
Occupancy by Ownership by Household Size in Westwood borough
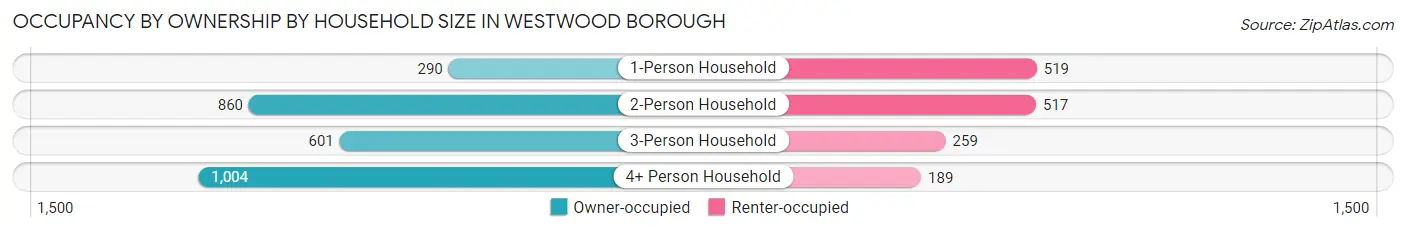
| Household Size | Owner-occupied | Renter-occupied |
| 1-Person Household | 290 (35.8%) | 519 (64.1%) |
| 2-Person Household | 860 (62.5%) | 517 (37.6%) |
| 3-Person Household | 601 (69.9%) | 259 (30.1%) |
| 4+ Person Household | 1,004 (84.2%) | 189 (15.8%) |
| Total Housing Units | 2,755 (65.0%) | 1,484 (35.0%) |
Occupancy by Educational Attainment in Westwood borough
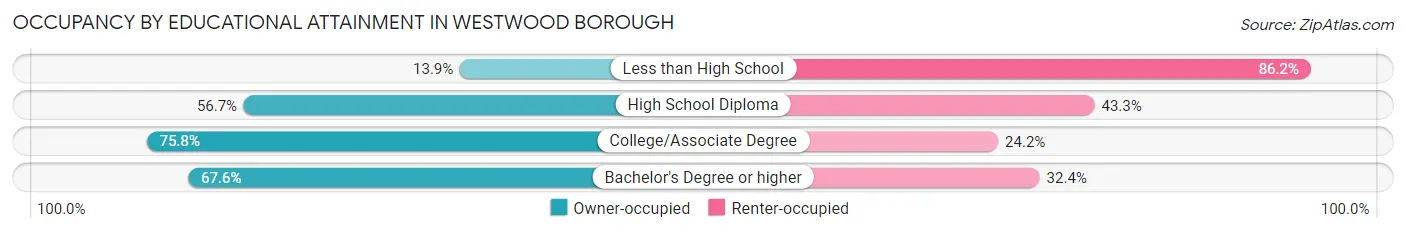
| Household Size | Owner-occupied | Renter-occupied |
| Less than High School | 32 (13.9%) | 199 (86.2%) |
| High School Diploma | 338 (56.7%) | 258 (43.3%) |
| College/Associate Degree | 727 (75.8%) | 232 (24.2%) |
| Bachelor's Degree or higher | 1,658 (67.6%) | 795 (32.4%) |
Occupancy by Age of Householder in Westwood borough
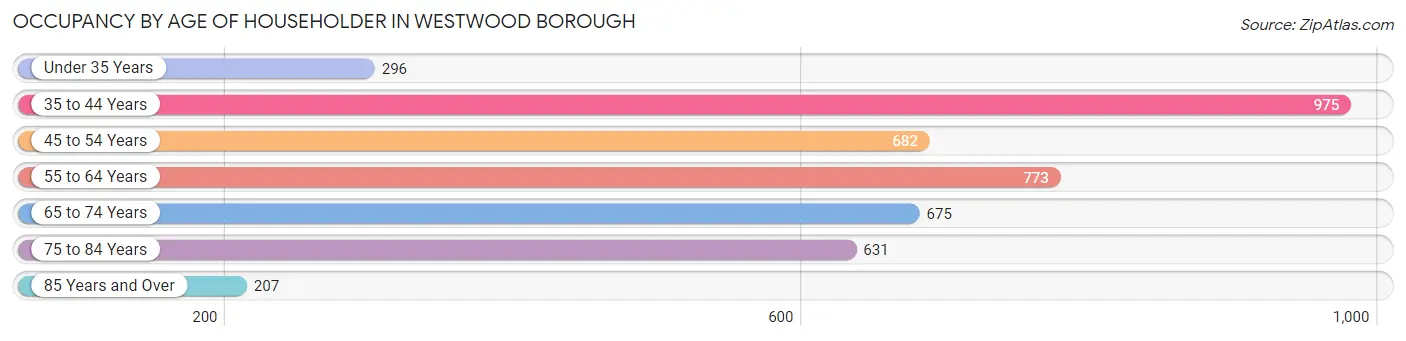
| Age Bracket | # Households | % Households |
| Under 35 Years | 296 | 7.0% |
| 35 to 44 Years | 975 | 23.0% |
| 45 to 54 Years | 682 | 16.1% |
| 55 to 64 Years | 773 | 18.2% |
| 65 to 74 Years | 675 | 15.9% |
| 75 to 84 Years | 631 | 14.9% |
| 85 Years and Over | 207 | 4.9% |
| Total | 4,239 | 100.0% |
Housing Finances in Westwood borough
Median Income by Occupancy in Westwood borough
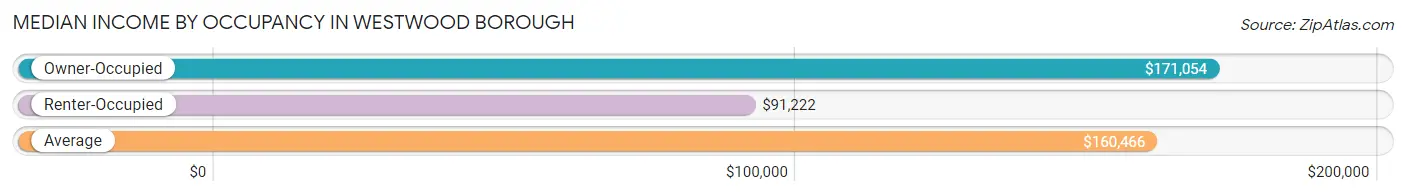
| Occupancy Type | # Households | Median Income |
| Owner-Occupied | 2,755 (65.0%) | $171,054 |
| Renter-Occupied | 1,484 (35.0%) | $91,222 |
| Average | 4,239 (100.0%) | $160,466 |
Occupancy by Householder Income Bracket in Westwood borough
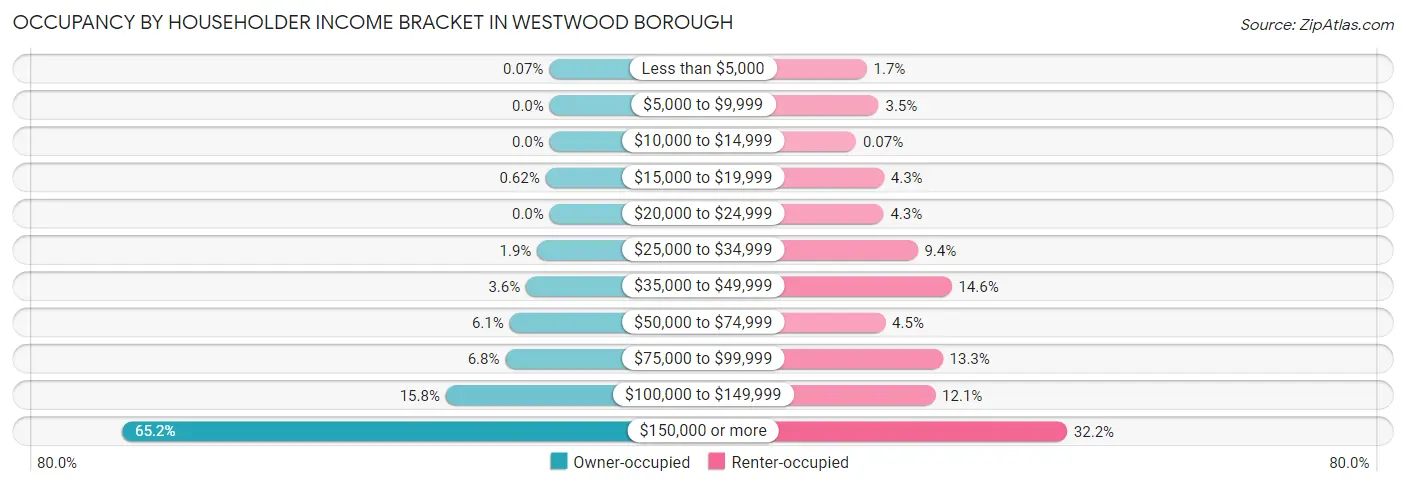
| Income Bracket | Owner-occupied | Renter-occupied |
| Less than $5,000 | 2 (0.1%) | 25 (1.7%) |
| $5,000 to $9,999 | 0 (0.0%) | 52 (3.5%) |
| $10,000 to $14,999 | 0 (0.0%) | 1 (0.1%) |
| $15,000 to $19,999 | 17 (0.6%) | 64 (4.3%) |
| $20,000 to $24,999 | 0 (0.0%) | 63 (4.3%) |
| $25,000 to $34,999 | 52 (1.9%) | 140 (9.4%) |
| $35,000 to $49,999 | 99 (3.6%) | 217 (14.6%) |
| $50,000 to $74,999 | 168 (6.1%) | 67 (4.5%) |
| $75,000 to $99,999 | 186 (6.8%) | 197 (13.3%) |
| $100,000 to $149,999 | 436 (15.8%) | 180 (12.1%) |
| $150,000 or more | 1,795 (65.1%) | 478 (32.2%) |
| Total | 2,755 (100.0%) | 1,484 (100.0%) |
Monthly Housing Cost Tiers in Westwood borough
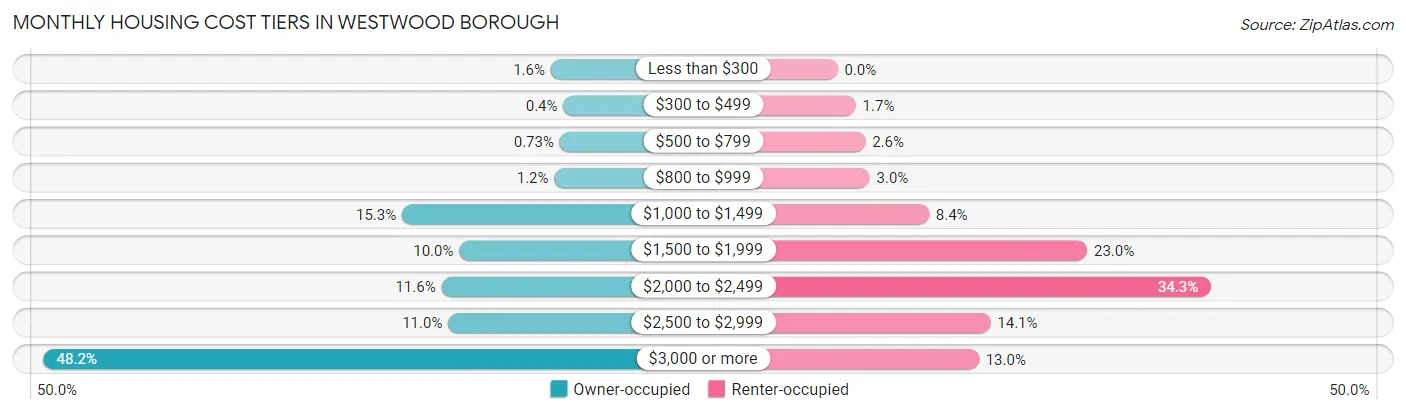
| Monthly Cost | Owner-occupied | Renter-occupied |
| Less than $300 | 43 (1.6%) | 0 (0.0%) |
| $300 to $499 | 11 (0.4%) | 25 (1.7%) |
| $500 to $799 | 20 (0.7%) | 38 (2.6%) |
| $800 to $999 | 34 (1.2%) | 44 (3.0%) |
| $1,000 to $1,499 | 420 (15.2%) | 125 (8.4%) |
| $1,500 to $1,999 | 275 (10.0%) | 341 (23.0%) |
| $2,000 to $2,499 | 320 (11.6%) | 509 (34.3%) |
| $2,500 to $2,999 | 303 (11.0%) | 209 (14.1%) |
| $3,000 or more | 1,329 (48.2%) | 193 (13.0%) |
| Total | 2,755 (100.0%) | 1,484 (100.0%) |
Physical Housing Characteristics in Westwood borough
Housing Structures in Westwood borough
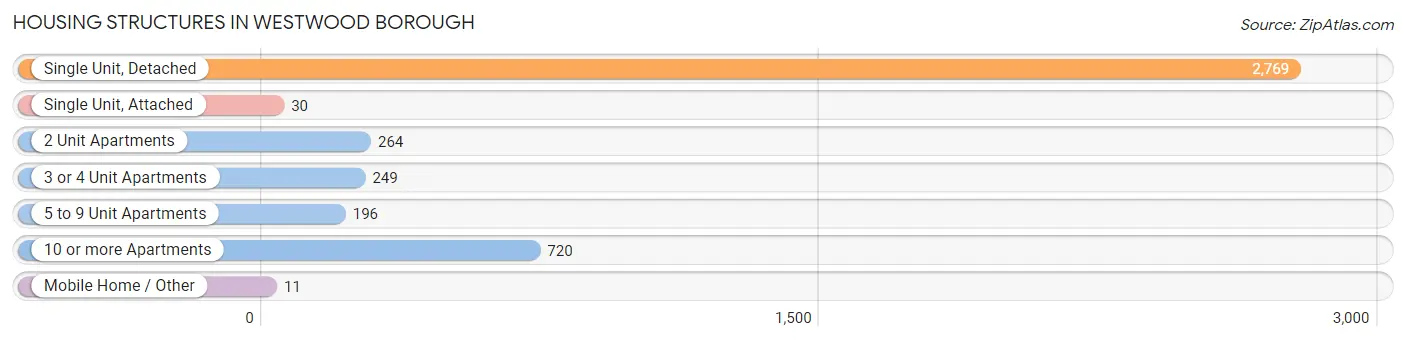
| Structure Type | # Housing Units | % Housing Units |
| Single Unit, Detached | 2,769 | 65.3% |
| Single Unit, Attached | 30 | 0.7% |
| 2 Unit Apartments | 264 | 6.2% |
| 3 or 4 Unit Apartments | 249 | 5.9% |
| 5 to 9 Unit Apartments | 196 | 4.6% |
| 10 or more Apartments | 720 | 17.0% |
| Mobile Home / Other | 11 | 0.3% |
| Total | 4,239 | 100.0% |
Housing Structures by Occupancy in Westwood borough
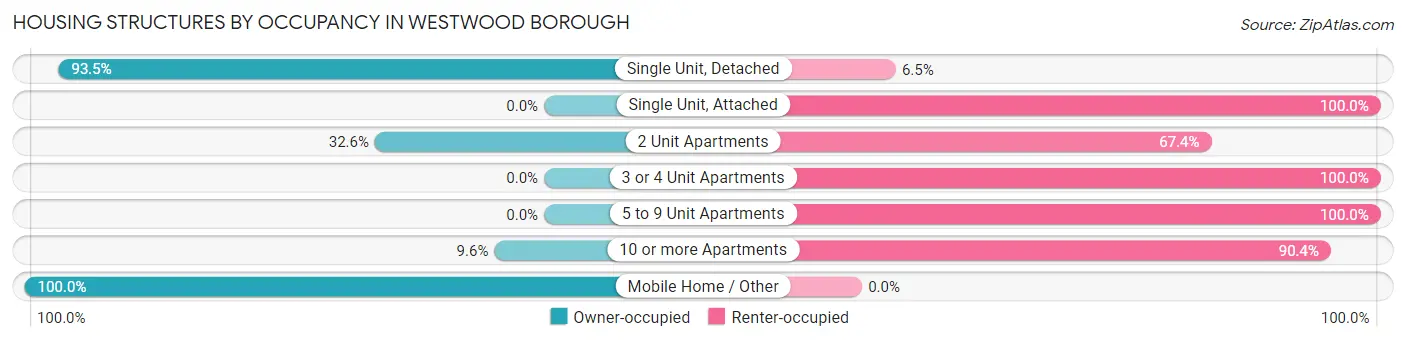
| Structure Type | Owner-occupied | Renter-occupied |
| Single Unit, Detached | 2,589 (93.5%) | 180 (6.5%) |
| Single Unit, Attached | 0 (0.0%) | 30 (100.0%) |
| 2 Unit Apartments | 86 (32.6%) | 178 (67.4%) |
| 3 or 4 Unit Apartments | 0 (0.0%) | 249 (100.0%) |
| 5 to 9 Unit Apartments | 0 (0.0%) | 196 (100.0%) |
| 10 or more Apartments | 69 (9.6%) | 651 (90.4%) |
| Mobile Home / Other | 11 (100.0%) | 0 (0.0%) |
| Total | 2,755 (65.0%) | 1,484 (35.0%) |
Housing Structures by Number of Rooms in Westwood borough
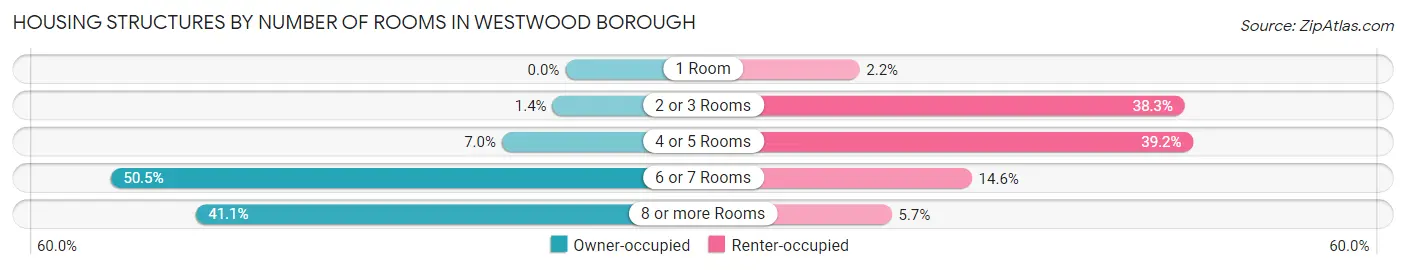
| Number of Rooms | Owner-occupied | Renter-occupied |
| 1 Room | 0 (0.0%) | 32 (2.2%) |
| 2 or 3 Rooms | 39 (1.4%) | 568 (38.3%) |
| 4 or 5 Rooms | 194 (7.0%) | 582 (39.2%) |
| 6 or 7 Rooms | 1,391 (50.5%) | 217 (14.6%) |
| 8 or more Rooms | 1,131 (41.0%) | 85 (5.7%) |
| Total | 2,755 (100.0%) | 1,484 (100.0%) |
Housing Structure by Heating Type in Westwood borough
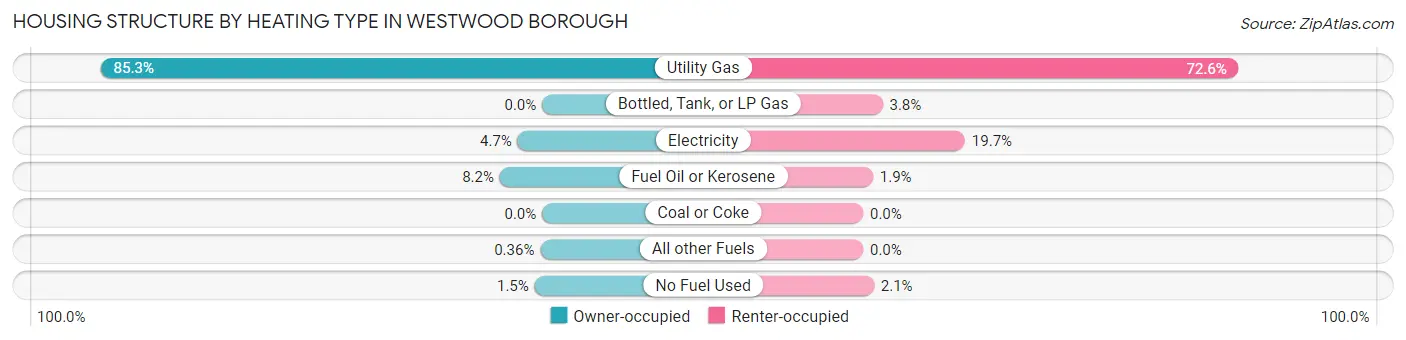
| Heating Type | Owner-occupied | Renter-occupied |
| Utility Gas | 2,350 (85.3%) | 1,077 (72.6%) |
| Bottled, Tank, or LP Gas | 0 (0.0%) | 56 (3.8%) |
| Electricity | 130 (4.7%) | 292 (19.7%) |
| Fuel Oil or Kerosene | 225 (8.2%) | 28 (1.9%) |
| Coal or Coke | 0 (0.0%) | 0 (0.0%) |
| All other Fuels | 10 (0.4%) | 0 (0.0%) |
| No Fuel Used | 40 (1.5%) | 31 (2.1%) |
| Total | 2,755 (100.0%) | 1,484 (100.0%) |
Household Vehicle Usage in Westwood borough
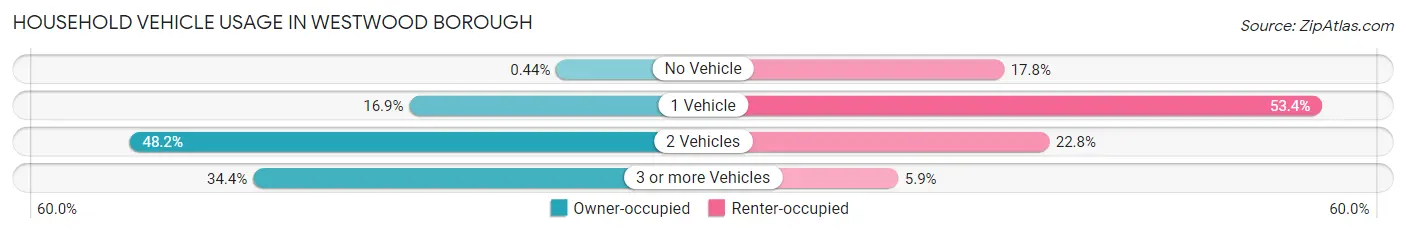
| Vehicles per Household | Owner-occupied | Renter-occupied |
| No Vehicle | 12 (0.4%) | 264 (17.8%) |
| 1 Vehicle | 466 (16.9%) | 793 (53.4%) |
| 2 Vehicles | 1,329 (48.2%) | 339 (22.8%) |
| 3 or more Vehicles | 948 (34.4%) | 88 (5.9%) |
| Total | 2,755 (100.0%) | 1,484 (100.0%) |
Real Estate & Mortgages in Westwood borough
Real Estate and Mortgage Overview in Westwood borough
| Characteristic | Without Mortgage | With Mortgage |
| Housing Units | 677 | 2,078 |
| Median Property Value | $491,400 | $550,600 |
| Median Household Income | $109,188 | $1,580 |
| Monthly Housing Costs | $1,306 | $1,329 |
| Real Estate Taxes | $10,001 | $18 |
Property Value by Mortgage Status in Westwood borough
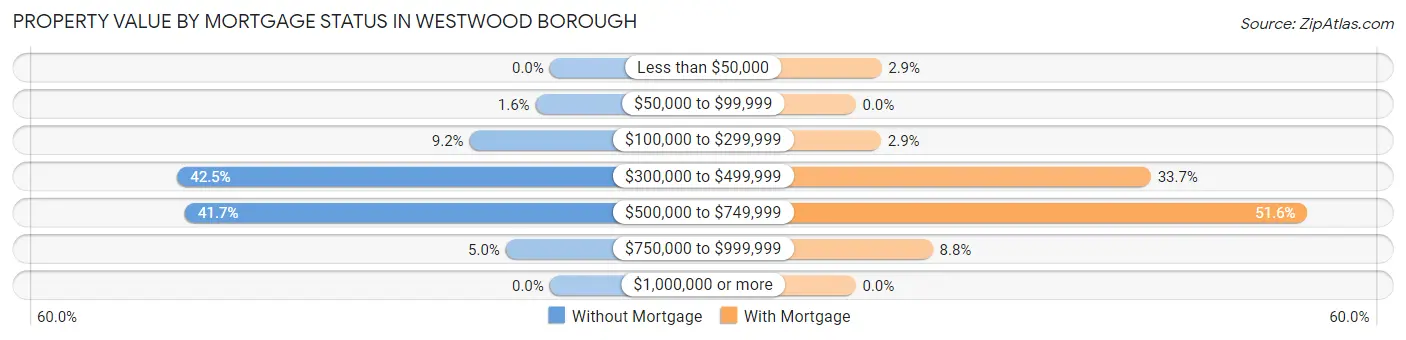
| Property Value | Without Mortgage | With Mortgage |
| Less than $50,000 | 0 (0.0%) | 61 (2.9%) |
| $50,000 to $99,999 | 11 (1.6%) | 0 (0.0%) |
| $100,000 to $299,999 | 62 (9.2%) | 60 (2.9%) |
| $300,000 to $499,999 | 288 (42.5%) | 701 (33.7%) |
| $500,000 to $749,999 | 282 (41.6%) | 1,073 (51.6%) |
| $750,000 to $999,999 | 34 (5.0%) | 183 (8.8%) |
| $1,000,000 or more | 0 (0.0%) | 0 (0.0%) |
| Total | 677 (100.0%) | 2,078 (100.0%) |
Household Income by Mortgage Status in Westwood borough
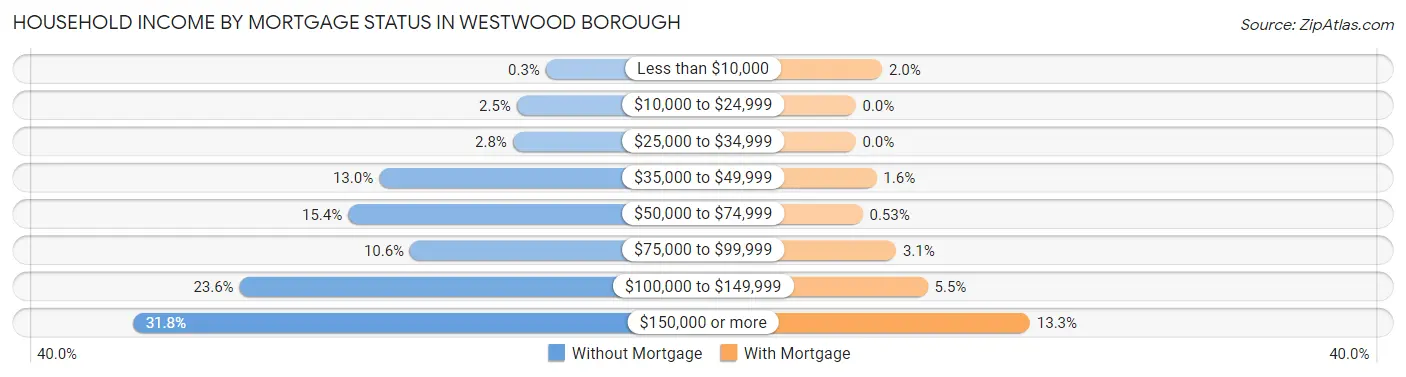
| Household Income | Without Mortgage | With Mortgage |
| Less than $10,000 | 2 (0.3%) | 42 (2.0%) |
| $10,000 to $24,999 | 17 (2.5%) | 0 (0.0%) |
| $25,000 to $34,999 | 19 (2.8%) | 0 (0.0%) |
| $35,000 to $49,999 | 88 (13.0%) | 33 (1.6%) |
| $50,000 to $74,999 | 104 (15.4%) | 11 (0.5%) |
| $75,000 to $99,999 | 72 (10.6%) | 64 (3.1%) |
| $100,000 to $149,999 | 160 (23.6%) | 114 (5.5%) |
| $150,000 or more | 215 (31.8%) | 276 (13.3%) |
| Total | 677 (100.0%) | 2,078 (100.0%) |
Property Value to Household Income Ratio in Westwood borough
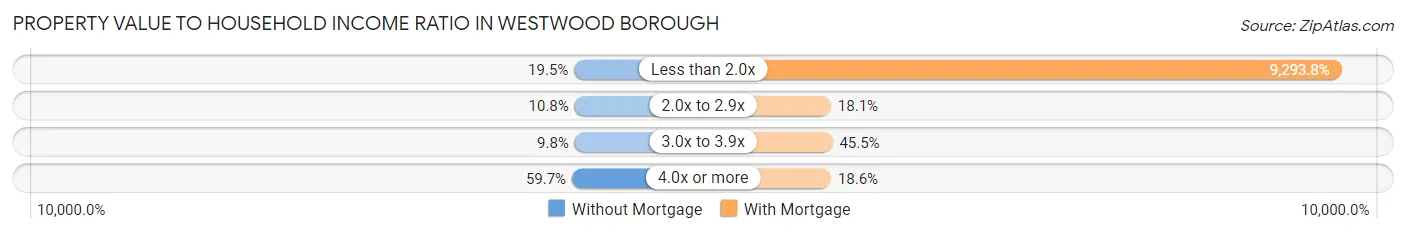
| Value-to-Income Ratio | Without Mortgage | With Mortgage |
| Less than 2.0x | 132 (19.5%) | 193,125 (9,293.8%) |
| 2.0x to 2.9x | 73 (10.8%) | 377 (18.1%) |
| 3.0x to 3.9x | 66 (9.8%) | 946 (45.5%) |
| 4.0x or more | 404 (59.7%) | 387 (18.6%) |
| Total | 677 (100.0%) | 2,078 (100.0%) |
Real Estate Taxes by Mortgage Status in Westwood borough
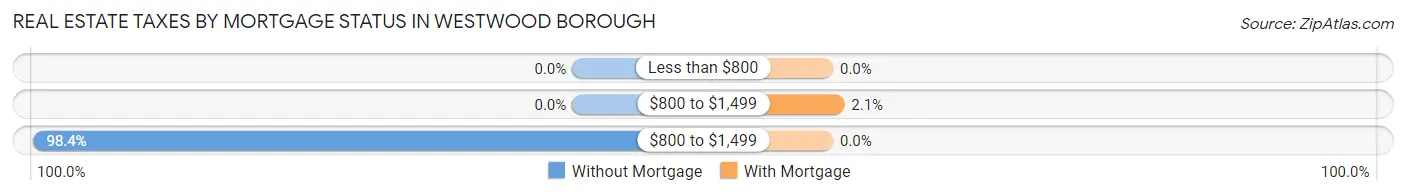
| Property Taxes | Without Mortgage | With Mortgage |
| Less than $800 | 0 (0.0%) | 0 (0.0%) |
| $800 to $1,499 | 0 (0.0%) | 43 (2.1%) |
| $800 to $1,499 | 666 (98.4%) | 0 (0.0%) |
| Total | 677 (100.0%) | 2,078 (100.0%) |
Health & Disability in Westwood borough
Health Insurance Coverage by Age in Westwood borough
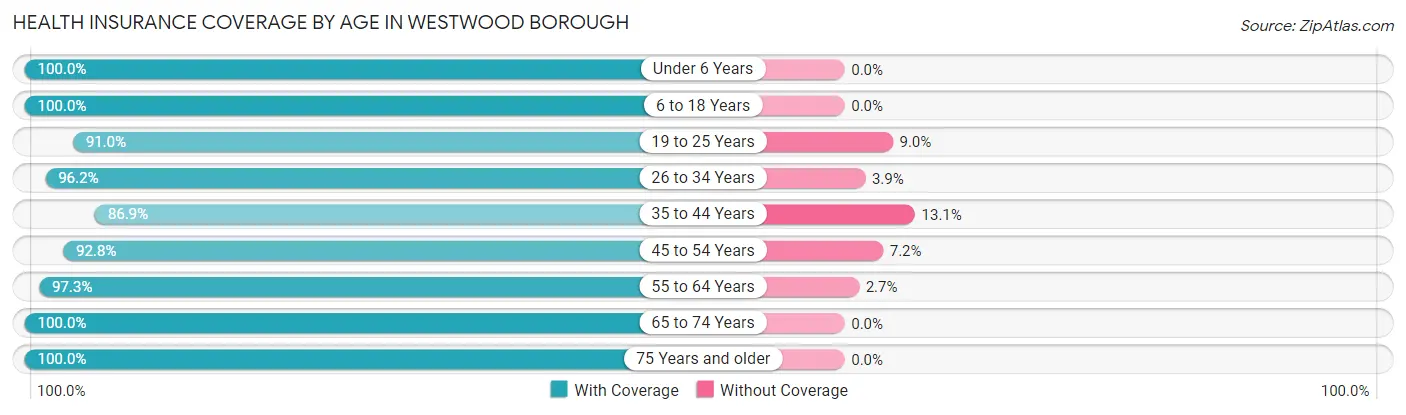
| Age Bracket | With Coverage | Without Coverage |
| Under 6 Years | 525 (100.0%) | 0 (0.0%) |
| 6 to 18 Years | 1,903 (100.0%) | 0 (0.0%) |
| 19 to 25 Years | 820 (91.0%) | 81 (9.0%) |
| 26 to 34 Years | 825 (96.2%) | 33 (3.8%) |
| 35 to 44 Years | 1,697 (86.9%) | 256 (13.1%) |
| 45 to 54 Years | 1,306 (92.8%) | 101 (7.2%) |
| 55 to 64 Years | 1,230 (97.3%) | 34 (2.7%) |
| 65 to 74 Years | 1,190 (100.0%) | 0 (0.0%) |
| 75 Years and older | 1,195 (100.0%) | 0 (0.0%) |
| Total | 10,691 (95.5%) | 505 (4.5%) |
Health Insurance Coverage by Citizenship Status in Westwood borough
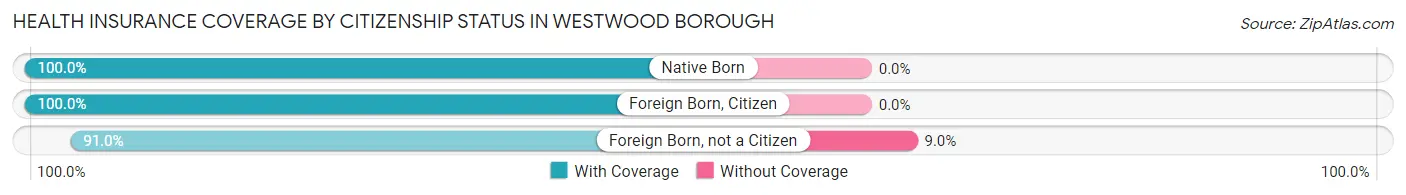
| Citizenship Status | With Coverage | Without Coverage |
| Native Born | 525 (100.0%) | 0 (0.0%) |
| Foreign Born, Citizen | 1,903 (100.0%) | 0 (0.0%) |
| Foreign Born, not a Citizen | 820 (91.0%) | 81 (9.0%) |
Health Insurance Coverage by Household Income in Westwood borough
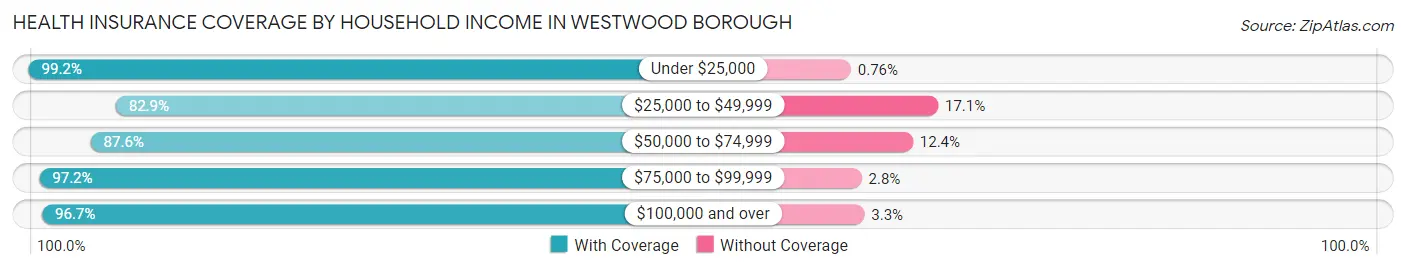
| Household Income | With Coverage | Without Coverage |
| Under $25,000 | 260 (99.2%) | 2 (0.8%) |
| $25,000 to $49,999 | 616 (82.9%) | 127 (17.1%) |
| $50,000 to $74,999 | 439 (87.6%) | 62 (12.4%) |
| $75,000 to $99,999 | 772 (97.2%) | 22 (2.8%) |
| $100,000 and over | 8,575 (96.7%) | 292 (3.3%) |
Public vs Private Health Insurance Coverage by Age in Westwood borough
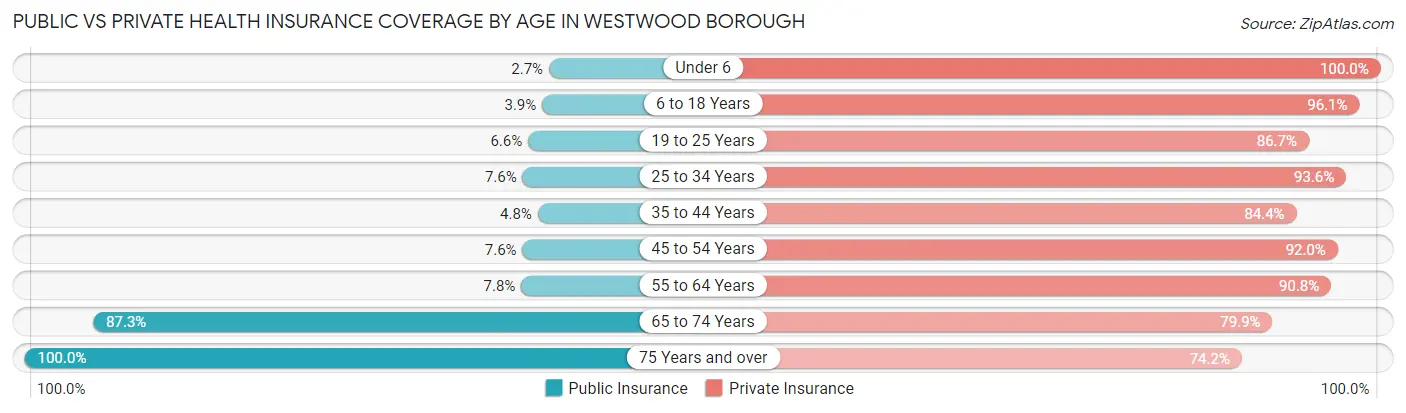
| Age Bracket | Public Insurance | Private Insurance |
| Under 6 | 14 (2.7%) | 525 (100.0%) |
| 6 to 18 Years | 75 (3.9%) | 1,828 (96.1%) |
| 19 to 25 Years | 59 (6.6%) | 781 (86.7%) |
| 25 to 34 Years | 65 (7.6%) | 803 (93.6%) |
| 35 to 44 Years | 93 (4.8%) | 1,648 (84.4%) |
| 45 to 54 Years | 107 (7.6%) | 1,295 (92.0%) |
| 55 to 64 Years | 99 (7.8%) | 1,148 (90.8%) |
| 65 to 74 Years | 1,039 (87.3%) | 951 (79.9%) |
| 75 Years and over | 1,195 (100.0%) | 887 (74.2%) |
| Total | 2,746 (24.5%) | 9,866 (88.1%) |
Disability Status by Sex by Age in Westwood borough
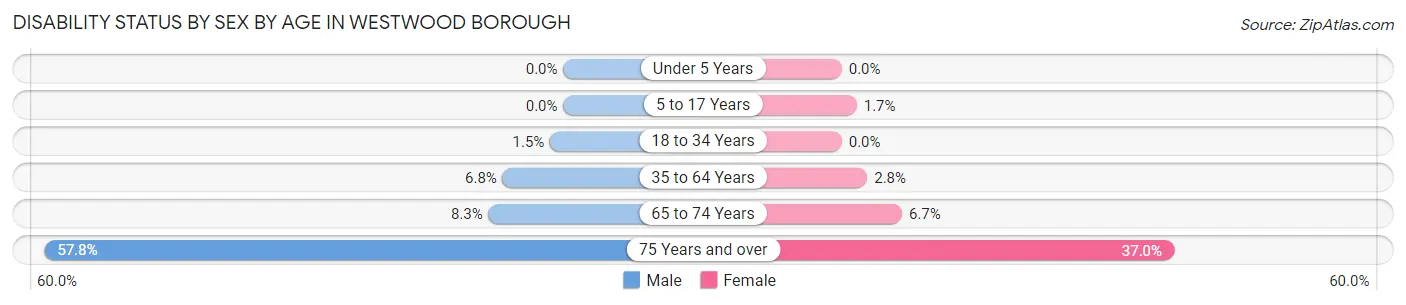
| Age Bracket | Male | Female |
| Under 5 Years | 0 (0.0%) | 0 (0.0%) |
| 5 to 17 Years | 0 (0.0%) | 14 (1.7%) |
| 18 to 34 Years | 15 (1.5%) | 0 (0.0%) |
| 35 to 64 Years | 146 (6.8%) | 70 (2.8%) |
| 65 to 74 Years | 52 (8.3%) | 38 (6.7%) |
| 75 Years and over | 189 (57.8%) | 321 (37.0%) |
Disability Class by Sex by Age in Westwood borough
Disability Class: Hearing Difficulty
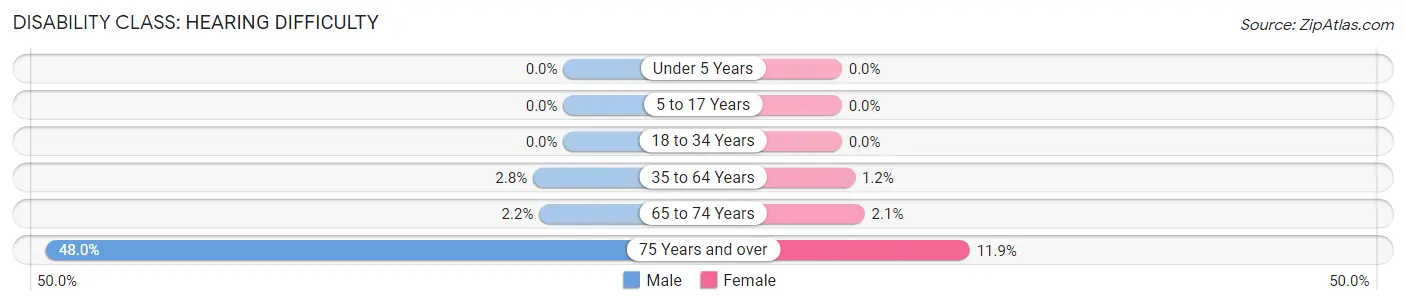
| Age Bracket | Male | Female |
| Under 5 Years | 0 (0.0%) | 0 (0.0%) |
| 5 to 17 Years | 0 (0.0%) | 0 (0.0%) |
| 18 to 34 Years | 0 (0.0%) | 0 (0.0%) |
| 35 to 64 Years | 61 (2.8%) | 30 (1.2%) |
| 65 to 74 Years | 14 (2.2%) | 12 (2.1%) |
| 75 Years and over | 157 (48.0%) | 103 (11.9%) |
Disability Class: Vision Difficulty
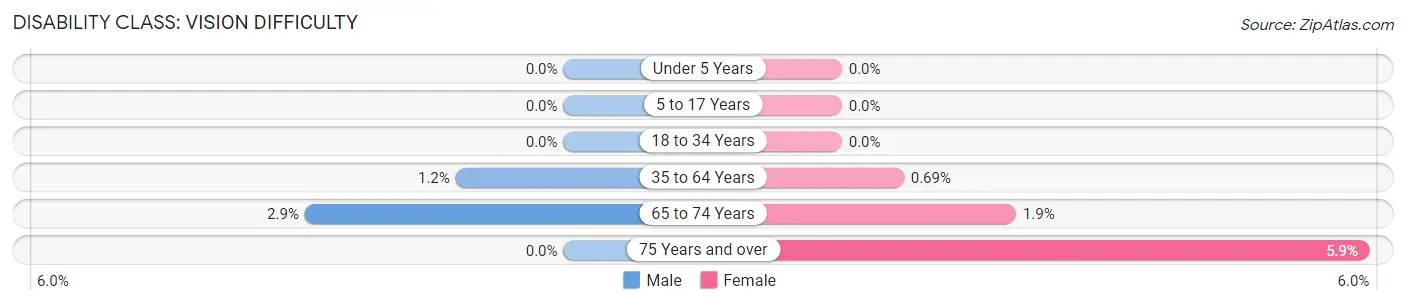
| Age Bracket | Male | Female |
| Under 5 Years | 0 (0.0%) | 0 (0.0%) |
| 5 to 17 Years | 0 (0.0%) | 0 (0.0%) |
| 18 to 34 Years | 0 (0.0%) | 0 (0.0%) |
| 35 to 64 Years | 26 (1.2%) | 17 (0.7%) |
| 65 to 74 Years | 18 (2.9%) | 11 (1.9%) |
| 75 Years and over | 0 (0.0%) | 51 (5.9%) |
Disability Class: Cognitive Difficulty
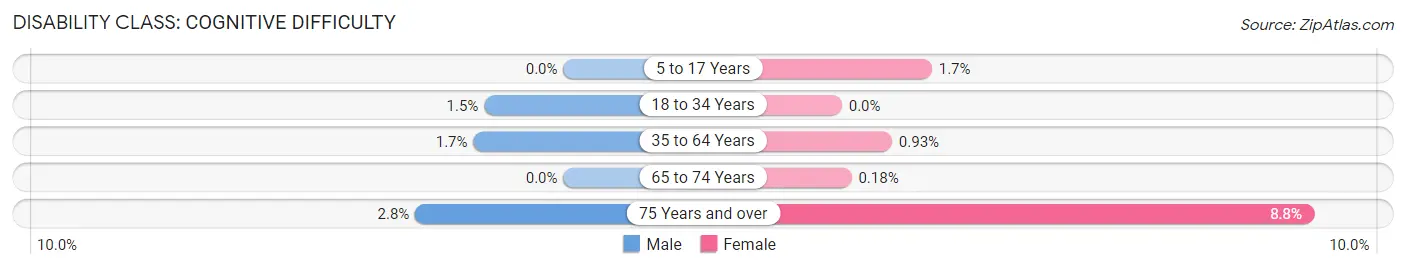
| Age Bracket | Male | Female |
| 5 to 17 Years | 0 (0.0%) | 14 (1.7%) |
| 18 to 34 Years | 15 (1.5%) | 0 (0.0%) |
| 35 to 64 Years | 36 (1.7%) | 23 (0.9%) |
| 65 to 74 Years | 0 (0.0%) | 1 (0.2%) |
| 75 Years and over | 9 (2.8%) | 76 (8.8%) |
Disability Class: Ambulatory Difficulty
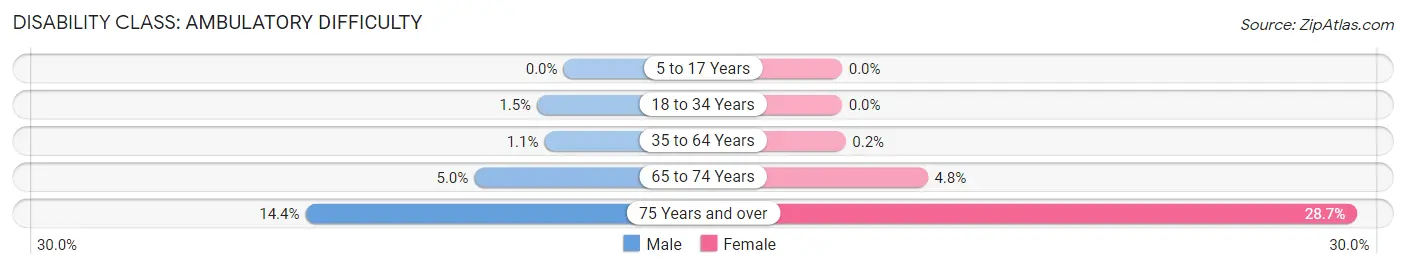
| Age Bracket | Male | Female |
| 5 to 17 Years | 0 (0.0%) | 0 (0.0%) |
| 18 to 34 Years | 15 (1.5%) | 0 (0.0%) |
| 35 to 64 Years | 23 (1.1%) | 5 (0.2%) |
| 65 to 74 Years | 31 (5.0%) | 27 (4.8%) |
| 75 Years and over | 47 (14.4%) | 249 (28.7%) |
Disability Class: Self-Care Difficulty
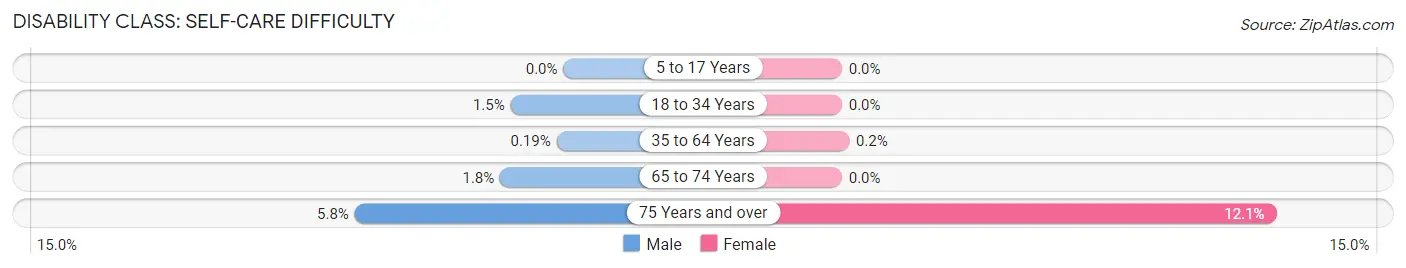
| Age Bracket | Male | Female |
| 5 to 17 Years | 0 (0.0%) | 0 (0.0%) |
| 18 to 34 Years | 15 (1.5%) | 0 (0.0%) |
| 35 to 64 Years | 4 (0.2%) | 5 (0.2%) |
| 65 to 74 Years | 11 (1.8%) | 0 (0.0%) |
| 75 Years and over | 19 (5.8%) | 105 (12.1%) |
Technology Access in Westwood borough
Computing Device Access in Westwood borough
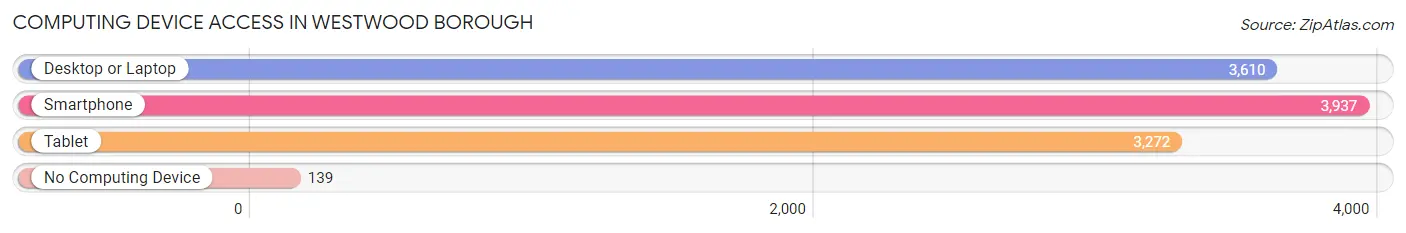
| Device Type | # Households | % Households |
| Desktop or Laptop | 3,610 | 85.2% |
| Smartphone | 3,937 | 92.9% |
| Tablet | 3,272 | 77.2% |
| No Computing Device | 139 | 3.3% |
| Total | 4,239 | 100.0% |
Internet Access in Westwood borough
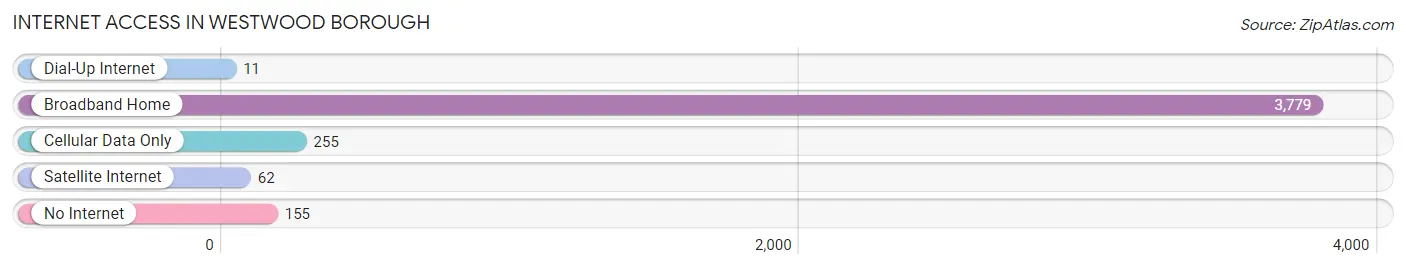
| Internet Type | # Households | % Households |
| Dial-Up Internet | 11 | 0.3% |
| Broadband Home | 3,779 | 89.1% |
| Cellular Data Only | 255 | 6.0% |
| Satellite Internet | 62 | 1.5% |
| No Internet | 155 | 3.7% |
| Total | 4,239 | 100.0% |
Westwood borough Summary
Westwood Borough is a small borough located in Bergen County, New Jersey. It is situated in the northeastern part of the state, just west of the Hudson River. The borough is bordered by the towns of Washington Township, Emerson, Hillsdale, and River Vale. Westwood is home to approximately 10,000 people and is known for its small-town charm and close-knit community.
Geography
Westwood Borough is located in the northeastern part of Bergen County, New Jersey. It is situated just west of the Hudson River and is bordered by the towns of Washington Township, Emerson, Hillsdale, and River Vale. The borough is approximately 4.5 square miles in size and is home to approximately 10,000 people. The terrain of Westwood is mostly flat, with some rolling hills in the northern part of the borough. The borough is home to several parks, including the Westwood Park, which features a playground, basketball court, and picnic area.
Economy
Westwood Borough is home to a variety of businesses, including retail stores, restaurants, and professional services. The borough is also home to several corporate headquarters, including the headquarters of the global pharmaceutical company, Merck & Co. The borough is also home to a number of small businesses, including a variety of restaurants, boutiques, and professional services.
Demographics
As of the 2010 census, Westwood Borough had a population of 10,067. The racial makeup of the borough was 87.3% White, 4.2% African American, 0.2% Native American, 5.2% Asian, and 2.9% from other races. Hispanic or Latino of any race were 8.3% of the population. The median household income in Westwood was $97,857, and the median family income was $117,857.
History
Westwood Borough was first settled in the early 1700s by Dutch settlers. The borough was officially incorporated in 1894 and was named after the Westwood family, who were prominent landowners in the area. The borough was primarily a farming community until the late 19th century, when the railroad was built through the area. This allowed for the development of industry and commerce in the area, which led to the growth of the borough.
Today, Westwood Borough is a vibrant community with a strong sense of community and a variety of businesses and services. The borough is home to a variety of parks and recreational facilities, as well as a number of corporate headquarters. Westwood is also home to a variety of cultural and educational institutions, including the Westwood Public Library and the Westwood Historical Society.
Common Questions
What is Per Capita Income in Westwood borough?
Per Capita income in Westwood borough is $62,659.
What is the Median Family Income in Westwood borough?
Median Family Income in Westwood borough is $169,688.
What is the Median Household income in Westwood borough?
Median Household Income in Westwood borough is $160,466.
What is Income or Wage Gap in Westwood borough?
Income or Wage Gap in Westwood borough is 24.7%.
Women in Westwood borough earn 75.3 cents for every dollar earned by a man.
What is Inequality or Gini Index in Westwood borough?
Inequality or Gini Index in Westwood borough is 0.38.
What is the Total Population of Westwood borough?
Total Population of Westwood borough is 11,241.
What is the Total Male Population of Westwood borough?
Total Male Population of Westwood borough is 5,328.
What is the Total Female Population of Westwood borough?
Total Female Population of Westwood borough is 5,913.
What is the Ratio of Males per 100 Females in Westwood borough?
There are 90.11 Males per 100 Females in Westwood borough.
What is the Ratio of Females per 100 Males in Westwood borough?
There are 110.98 Females per 100 Males in Westwood borough.
What is the Median Population Age in Westwood borough?
Median Population Age in Westwood borough is 41.8 Years.
What is the Average Family Size in Westwood borough
Average Family Size in Westwood borough is 3.0 People.
What is the Average Household Size in Westwood borough
Average Household Size in Westwood borough is 2.6 People.
How Large is the Labor Force in Westwood borough?
There are 6,961 People in the Labor Forcein in Westwood borough.
What is the Percentage of People in the Labor Force in Westwood borough?
75.7% of People are in the Labor Force in Westwood borough.
What is the Unemployment Rate in Westwood borough?
Unemployment Rate in Westwood borough is 2.6%.