Zip Codes with the Highest Percentage of Population Walking to Work in Paterson, NJ
RELATED REPORTS & OPTIONS
Walk to Work
Paterson
Compare Zip Codes
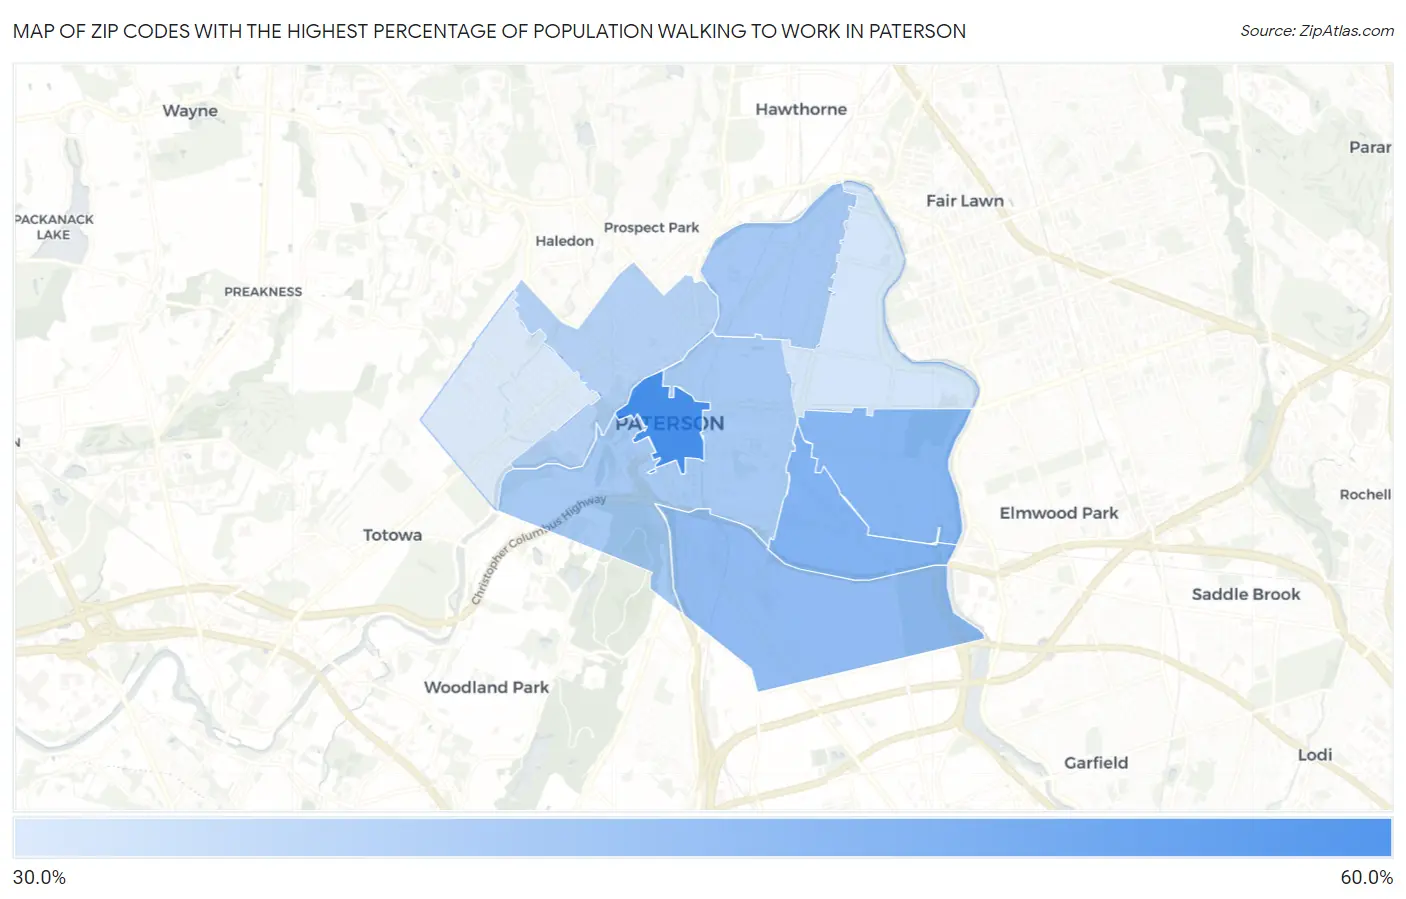
Map of Zip Codes with the Highest Percentage of Population Walking to Work in Paterson
31.3%
57.7%
Zip Codes with the Highest Percentage of Population Walking to Work in Paterson, NJ
| Zip Code | % Walk to Work | vs State | vs National | |
| 1. | 07505 | 57.7% | 38.0%(+19.7)#47 | 33.4%(+24.3)#2,046 |
| 2. | 07513 | 47.1% | 38.0%(+9.10)#132 | 33.4%(+13.7)#5,665 |
| 3. | 07504 | 45.9% | 38.0%(+7.90)#142 | 33.4%(+12.5)#6,075 |
| 4. | 07503 | 43.9% | 38.0%(+5.90)#155 | 33.4%(+10.5)#6,830 |
| 5. | 07524 | 40.6% | 38.0%(+2.60)#202 | 33.4%(+7.20)#8,115 |
| 6. | 07501 | 40.0% | 38.0%(+2.00)#212 | 33.4%(+6.60)#8,377 |
| 7. | 07522 | 37.9% | 38.0%(-0.100)#234 | 33.4%(+4.50)#9,265 |
| 8. | 07514 | 32.9% | 38.0%(-5.10)#297 | 33.4%(-0.500)#11,403 |
| 9. | 07502 | 31.3% | 38.0%(-6.70)#310 | 33.4%(-2.10)#12,084 |
1
Common Questions
What are the Top 5 Zip Codes with the Highest Percentage of Population Walking to Work in Paterson, NJ?
Top 5 Zip Codes with the Highest Percentage of Population Walking to Work in Paterson, NJ are:
What zip code has the Highest Percentage of Population Walking to Work in Paterson, NJ?
07505 has the Highest Percentage of Population Walking to Work in Paterson, NJ with 57.7%.
What is the Percentage of Population Walking to Work in Paterson, NJ?
Percentage of Population Walking to Work in Paterson is 43.3%.
What is the Percentage of Population Walking to Work in New Jersey?
Percentage of Population Walking to Work in New Jersey is 38.0%.
What is the Percentage of Population Walking to Work in the United States?
Percentage of Population Walking to Work in the United States is 33.4%.