Washington borough, NJ Map & Demographics
Washington borough Overview
$34,521
PER CAPITA INCOME
$87,159
AVG FAMILY INCOME
$67,761
AVG HOUSEHOLD INCOME
46.2%
WAGE / INCOME GAP [ % ]
53.8¢/ $1
WAGE / INCOME GAP [ $ ]
0.44
INEQUALITY / GINI INDEX
7,240
TOTAL POPULATION
3,524
MALE POPULATION
3,716
FEMALE POPULATION
94.83
MALES / 100 FEMALES
105.45
FEMALES / 100 MALES
38.8
MEDIAN AGE
3.3
AVG FAMILY SIZE
2.4
AVG HOUSEHOLD SIZE
3,829
LABOR FORCE [ PEOPLE ]
67.0%
PERCENT IN LABOR FORCE
5.4%
UNEMPLOYMENT RATE
Income in Washington borough
Income Overview in Washington borough
Per Capita Income in Washington borough is $34,521, while median incomes of families and households are $87,159 and $67,761 respectively.
| Characteristic | Number | Measure |
| Per Capita Income | 7,240 | $34,521 |
| Median Family Income | 1,670 | $87,159 |
| Mean Family Income | 1,670 | $108,179 |
| Median Household Income | 2,991 | $67,761 |
| Mean Household Income | 2,991 | $83,266 |
| Income Deficit | 1,670 | $0 |
| Wage / Income Gap (%) | 7,240 | 46.25% |
| Wage / Income Gap ($) | 7,240 | 53.75¢ per $1 |
| Gini / Inequality Index | 7,240 | 0.44 |
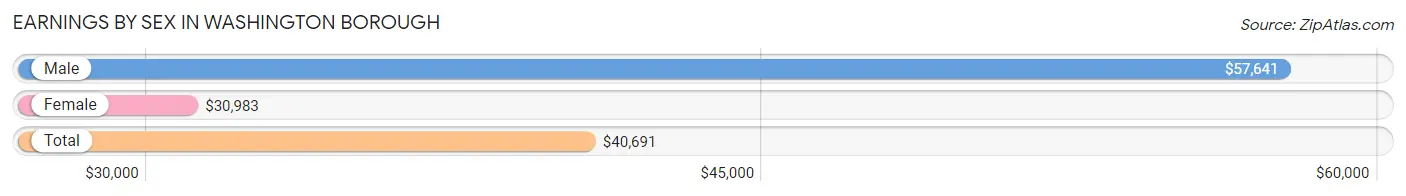
Earnings by Sex in Washington borough
Average Earnings in Washington borough are $40,691, $57,641 for men and $30,983 for women, a difference of 46.3%.
| Sex | Number | Average Earnings |
| Male | 2,220 (55.1%) | $57,641 |
| Female | 1,811 (44.9%) | $30,983 |
| Total | 4,031 (100.0%) | $40,691 |
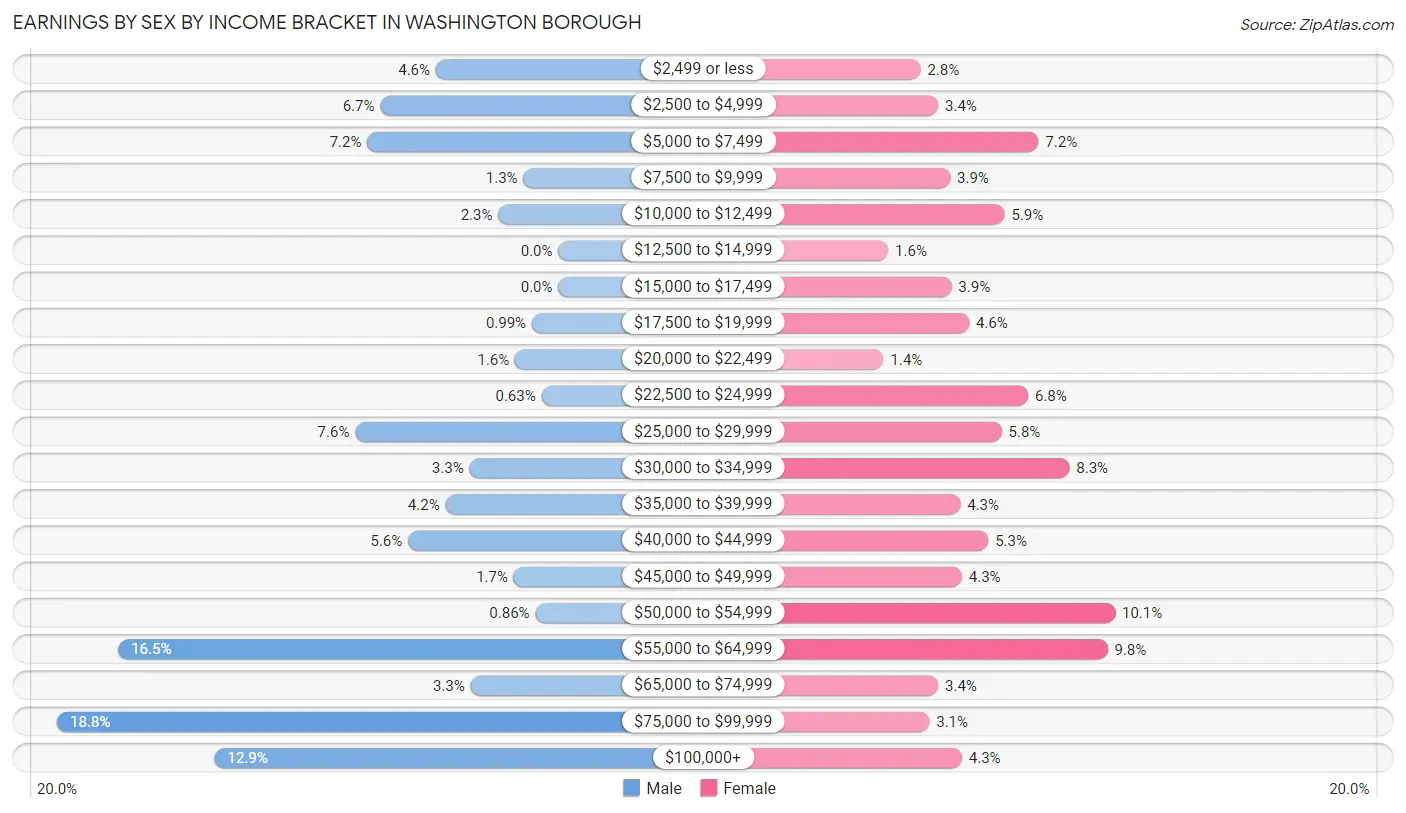
Earnings by Sex by Income Bracket in Washington borough
The most common earnings brackets in Washington borough are $75,000 to $99,999 for men (417 | 18.8%) and $50,000 to $54,999 for women (182 | 10.1%).
| Income | Male | Female |
| $2,499 or less | 102 (4.6%) | 50 (2.8%) |
| $2,500 to $4,999 | 148 (6.7%) | 62 (3.4%) |
| $5,000 to $7,499 | 159 (7.2%) | 130 (7.2%) |
| $7,500 to $9,999 | 29 (1.3%) | 70 (3.9%) |
| $10,000 to $12,499 | 50 (2.2%) | 107 (5.9%) |
| $12,500 to $14,999 | 0 (0.0%) | 28 (1.5%) |
| $15,000 to $17,499 | 0 (0.0%) | 71 (3.9%) |
| $17,500 to $19,999 | 22 (1.0%) | 83 (4.6%) |
| $20,000 to $22,499 | 36 (1.6%) | 25 (1.4%) |
| $22,500 to $24,999 | 14 (0.6%) | 123 (6.8%) |
| $25,000 to $29,999 | 169 (7.6%) | 105 (5.8%) |
| $30,000 to $34,999 | 74 (3.3%) | 151 (8.3%) |
| $35,000 to $39,999 | 94 (4.2%) | 77 (4.3%) |
| $40,000 to $44,999 | 125 (5.6%) | 96 (5.3%) |
| $45,000 to $49,999 | 37 (1.7%) | 78 (4.3%) |
| $50,000 to $54,999 | 19 (0.9%) | 182 (10.1%) |
| $55,000 to $64,999 | 366 (16.5%) | 177 (9.8%) |
| $65,000 to $74,999 | 73 (3.3%) | 62 (3.4%) |
| $75,000 to $99,999 | 417 (18.8%) | 56 (3.1%) |
| $100,000+ | 286 (12.9%) | 78 (4.3%) |
| Total | 2,220 (100.0%) | 1,811 (100.0%) |
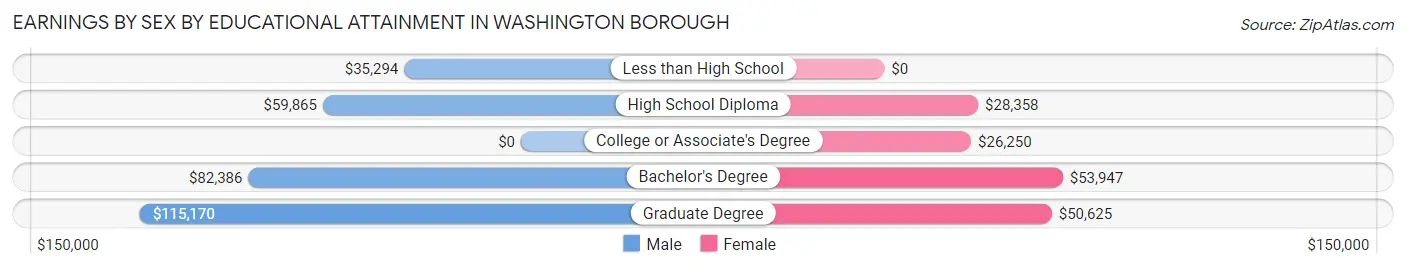
Earnings by Sex by Educational Attainment in Washington borough
Average earnings in Washington borough are $61,004 for men and $31,202 for women, a difference of 48.8%. Men with an educational attainment of graduate degree enjoy the highest average annual earnings of $115,170, while those with less than high school education earn the least with $35,294. Women with an educational attainment of bachelor's degree earn the most with the average annual earnings of $53,947, while those with college or associate's degree education have the smallest earnings of $26,250.
| Educational Attainment | Male Income | Female Income |
| Less than High School | $35,294 | $0 |
| High School Diploma | $59,865 | $28,358 |
| College or Associate's Degree | - | - |
| Bachelor's Degree | $82,386 | $53,947 |
| Graduate Degree | $115,170 | $50,625 |
| Total | $61,004 | $31,202 |
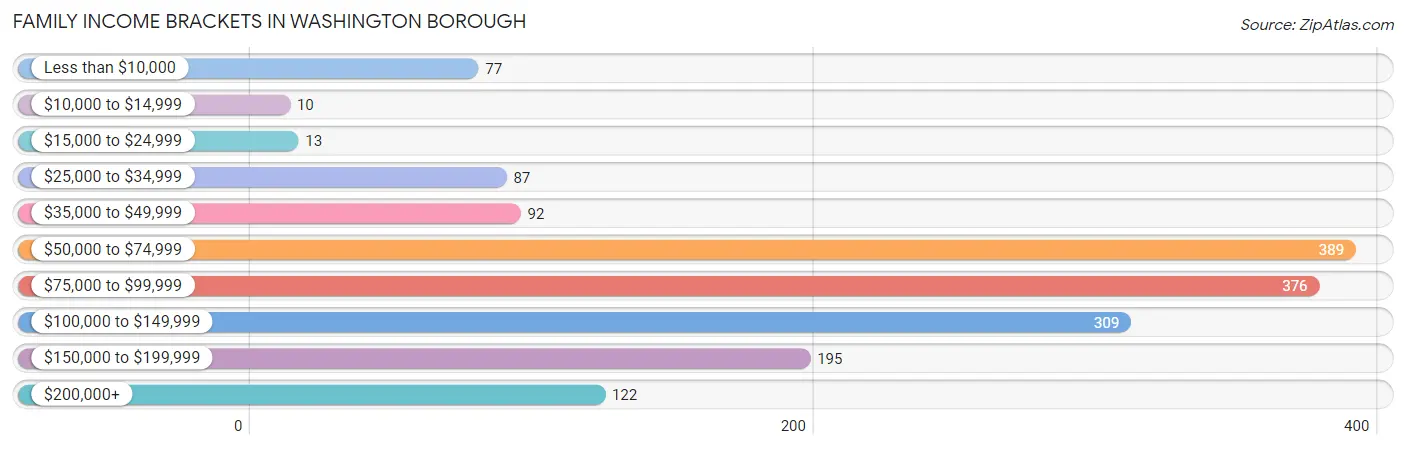
Family Income in Washington borough
Family Income Brackets in Washington borough
According to the Washington borough family income data, there are 389 families falling into the $50,000 to $74,999 income range, which is the most common income bracket and makes up 23.3% of all families. Conversely, the $10,000 to $14,999 income bracket is the least frequent group with only 10 families (0.6%) belonging to this category.
| Income Bracket | # Families | % Families |
| Less than $10,000 | 77 | 4.6% |
| $10,000 to $14,999 | 10 | 0.6% |
| $15,000 to $24,999 | 13 | 0.8% |
| $25,000 to $34,999 | 87 | 5.2% |
| $35,000 to $49,999 | 92 | 5.5% |
| $50,000 to $74,999 | 389 | 23.3% |
| $75,000 to $99,999 | 376 | 22.5% |
| $100,000 to $149,999 | 309 | 18.5% |
| $150,000 to $199,999 | 195 | 11.7% |
| $200,000+ | 122 | 7.3% |
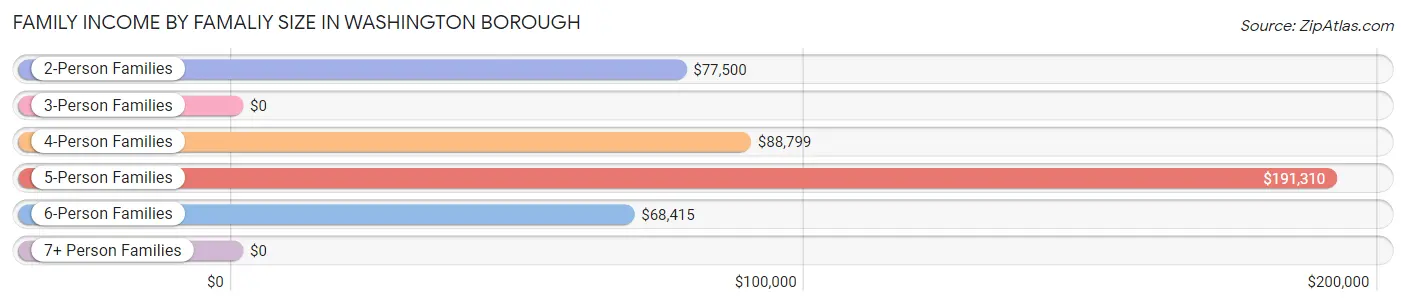
Family Income by Famaliy Size in Washington borough
5-person families (130 | 7.8%) account for the highest median family income in Washington borough with $191,310 per family, while 2-person families (588 | 35.2%) have the highest median income of $38,750 per family member.
| Income Bracket | # Families | Median Income |
| 2-Person Families | 588 (35.2%) | $77,500 |
| 3-Person Families | 444 (26.6%) | $0 |
| 4-Person Families | 335 (20.1%) | $88,799 |
| 5-Person Families | 130 (7.8%) | $191,310 |
| 6-Person Families | 119 (7.1%) | $68,415 |
| 7+ Person Families | 54 (3.2%) | $0 |
| Total | 1,670 (100.0%) | $87,159 |
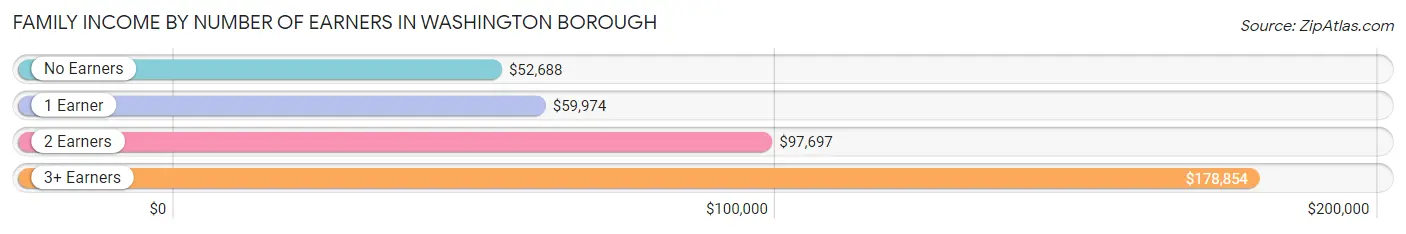
Family Income by Number of Earners in Washington borough
The median family income in Washington borough is $87,159, with families comprising 3+ earners (314) having the highest median family income of $178,854, while families with no earners (227) have the lowest median family income of $52,688, accounting for 18.8% and 13.6% of families, respectively.
| Number of Earners | # Families | Median Income |
| No Earners | 227 (13.6%) | $52,688 |
| 1 Earner | 577 (34.5%) | $59,974 |
| 2 Earners | 552 (33.1%) | $97,697 |
| 3+ Earners | 314 (18.8%) | $178,854 |
| Total | 1,670 (100.0%) | $87,159 |
Household Income in Washington borough
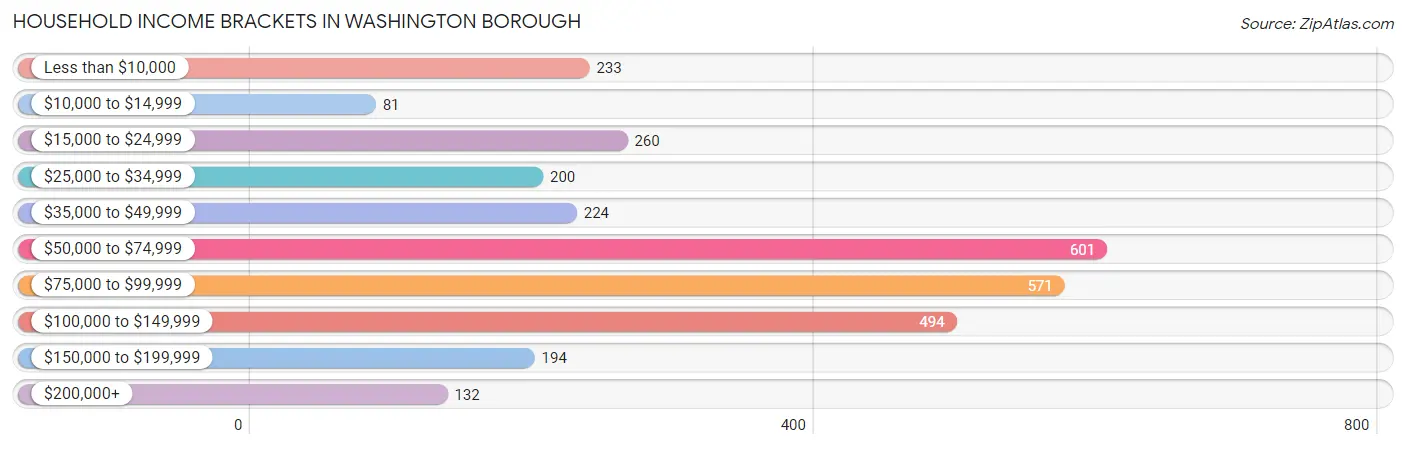
Household Income Brackets in Washington borough
With 601 households falling in the category, the $50,000 to $74,999 income range is the most frequent in Washington borough, accounting for 20.1% of all households. In contrast, only 81 households (2.7%) fall into the $10,000 to $14,999 income bracket, making it the least populous group.
| Income Bracket | # Households | % Households |
| Less than $10,000 | 233 | 7.8% |
| $10,000 to $14,999 | 81 | 2.7% |
| $15,000 to $24,999 | 260 | 8.7% |
| $25,000 to $34,999 | 200 | 6.7% |
| $35,000 to $49,999 | 224 | 7.5% |
| $50,000 to $74,999 | 601 | 20.1% |
| $75,000 to $99,999 | 571 | 19.1% |
| $100,000 to $149,999 | 494 | 16.5% |
| $150,000 to $199,999 | 194 | 6.5% |
| $200,000+ | 132 | 4.4% |
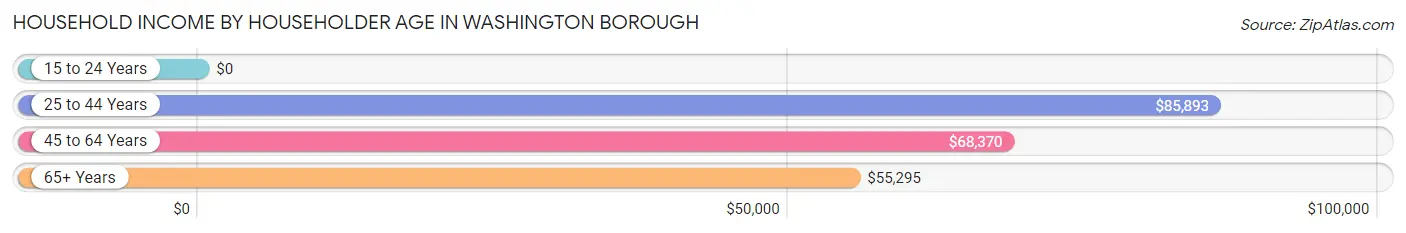
Household Income by Householder Age in Washington borough
The median household income in Washington borough is $67,761, with the highest median household income of $85,893 found in the 25 to 44 years age bracket for the primary householder. A total of 870 households (29.1%) fall into this category. Meanwhile, the 15 to 24 years age bracket for the primary householder has the lowest median household income of $0, with 26 households (0.9%) in this group.
| Income Bracket | # Households | Median Income |
| 15 to 24 Years | 26 (0.9%) | $0 |
| 25 to 44 Years | 870 (29.1%) | $85,893 |
| 45 to 64 Years | 1,464 (48.9%) | $68,370 |
| 65+ Years | 631 (21.1%) | $55,295 |
| Total | 2,991 (100.0%) | $67,761 |
Poverty in Washington borough
Income Below Poverty by Sex and Age in Washington borough
With 6.9% poverty level for males and 13.4% for females among the residents of Washington borough, 15 year old males and under 5 year old females are the most vulnerable to poverty, with 54 males (65.1%) and 74 females (28.3%) in their respective age groups living below the poverty level.
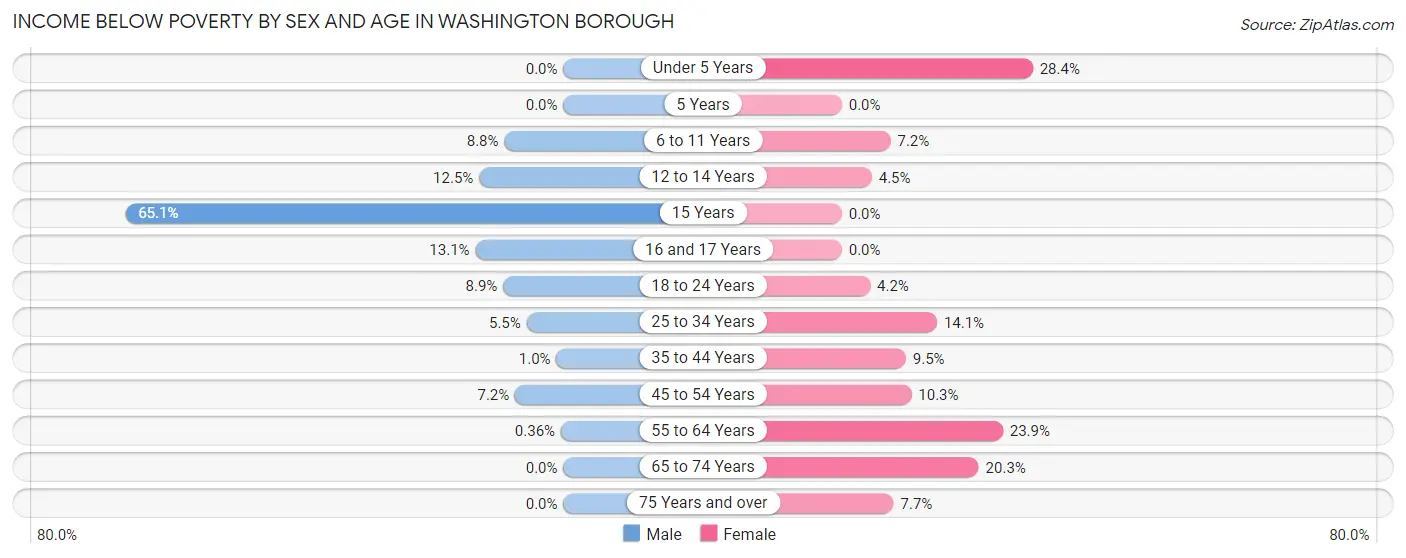
| Age Bracket | Male | Female |
| Under 5 Years | 0 (0.0%) | 74 (28.3%) |
| 5 Years | 0 (0.0%) | 0 (0.0%) |
| 6 to 11 Years | 12 (8.8%) | 27 (7.2%) |
| 12 to 14 Years | 32 (12.5%) | 11 (4.4%) |
| 15 Years | 54 (65.1%) | 0 (0.0%) |
| 16 and 17 Years | 35 (13.1%) | 0 (0.0%) |
| 18 to 24 Years | 42 (8.9%) | 6 (4.2%) |
| 25 to 34 Years | 25 (5.4%) | 66 (14.1%) |
| 35 to 44 Years | 3 (1.0%) | 52 (9.5%) |
| 45 to 54 Years | 39 (7.2%) | 53 (10.3%) |
| 55 to 64 Years | 2 (0.4%) | 110 (23.9%) |
| 65 to 74 Years | 0 (0.0%) | 76 (20.3%) |
| 75 Years and over | 0 (0.0%) | 21 (7.7%) |
| Total | 244 (6.9%) | 496 (13.4%) |
Income Above Poverty by Sex and Age in Washington borough
According to the poverty statistics in Washington borough, males aged under 5 years and females aged 15 years are the age groups that are most secure financially, with 100.0% of males and 100.0% of females in these age groups living above the poverty line.
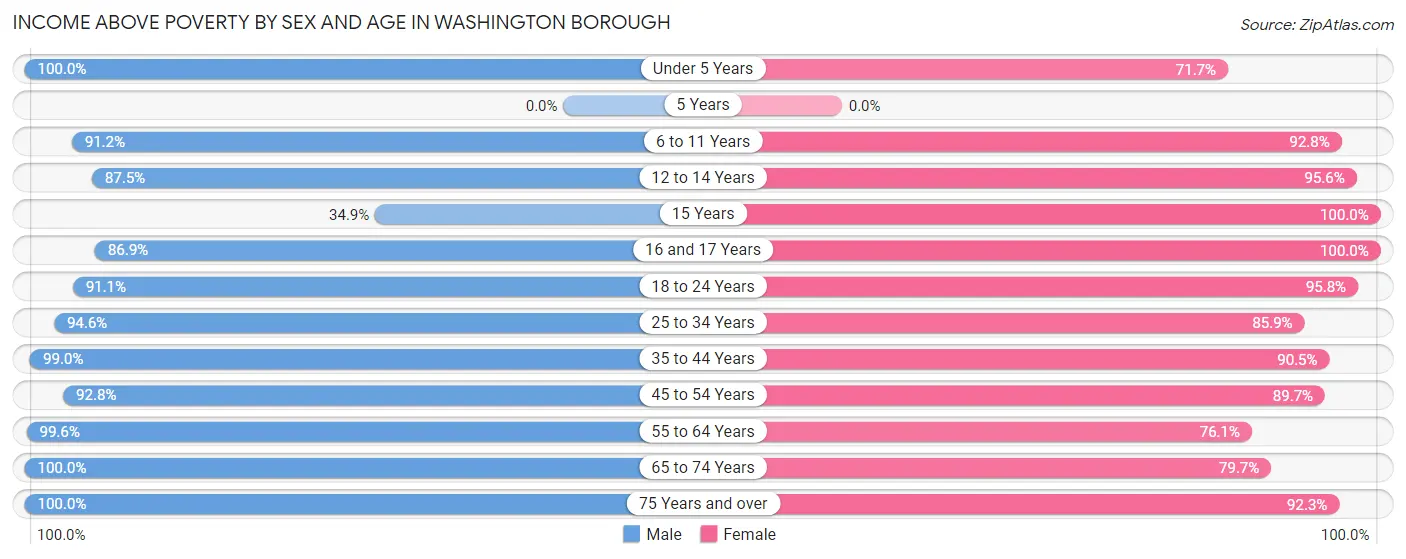
| Age Bracket | Male | Female |
| Under 5 Years | 137 (100.0%) | 187 (71.7%) |
| 5 Years | 0 (0.0%) | 0 (0.0%) |
| 6 to 11 Years | 125 (91.2%) | 346 (92.8%) |
| 12 to 14 Years | 224 (87.5%) | 236 (95.6%) |
| 15 Years | 29 (34.9%) | 31 (100.0%) |
| 16 and 17 Years | 233 (86.9%) | 27 (100.0%) |
| 18 to 24 Years | 428 (91.1%) | 137 (95.8%) |
| 25 to 34 Years | 434 (94.6%) | 401 (85.9%) |
| 35 to 44 Years | 287 (99.0%) | 495 (90.5%) |
| 45 to 54 Years | 506 (92.8%) | 460 (89.7%) |
| 55 to 64 Years | 548 (99.6%) | 350 (76.1%) |
| 65 to 74 Years | 248 (100.0%) | 298 (79.7%) |
| 75 Years and over | 81 (100.0%) | 252 (92.3%) |
| Total | 3,280 (93.1%) | 3,220 (86.7%) |
Income Below Poverty Among Married-Couple Families in Washington borough
The poverty statistics for married-couple families in Washington borough show that 3.5% or 39 of the total 1,110 families live below the poverty line. Families with 3 or 4 children have the highest poverty rate of 20.3%, comprising of 39 families. On the other hand, families with no children have the lowest poverty rate of 0.0%, which includes 0 families.
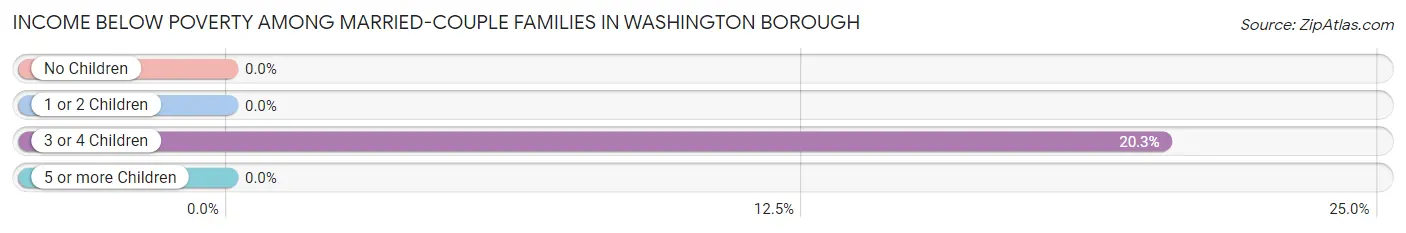
| Children | Above Poverty | Below Poverty |
| No Children | 527 (100.0%) | 0 (0.0%) |
| 1 or 2 Children | 361 (100.0%) | 0 (0.0%) |
| 3 or 4 Children | 153 (79.7%) | 39 (20.3%) |
| 5 or more Children | 30 (100.0%) | 0 (0.0%) |
| Total | 1,071 (96.5%) | 39 (3.5%) |
Income Below Poverty Among Single-Parent Households in Washington borough
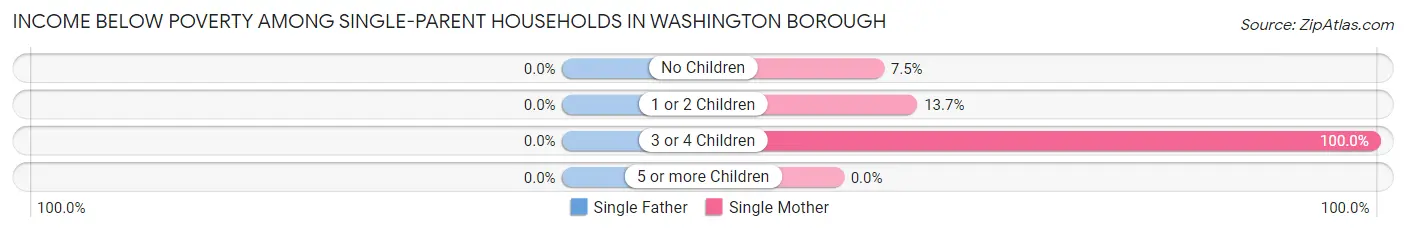
| Children | Single Father | Single Mother |
| No Children | 0 (0.0%) | 14 (7.5%) |
| 1 or 2 Children | 0 (0.0%) | 37 (13.7%) |
| 3 or 4 Children | 0 (0.0%) | 10 (100.0%) |
| 5 or more Children | 0 (0.0%) | 0 (0.0%) |
| Total | 0 (0.0%) | 61 (13.1%) |
Income Below Poverty Among Married-Couple vs Single-Parent Households in Washington borough
The poverty data for Washington borough shows that 39 of the married-couple family households (3.5%) and 61 of the single-parent households (10.9%) are living below the poverty level. Within the married-couple family households, those with 3 or 4 children have the highest poverty rate, with 39 households (20.3%) falling below the poverty line. Among the single-parent households, those with 3 or 4 children have the highest poverty rate, with 10 household (100.0%) living below poverty.
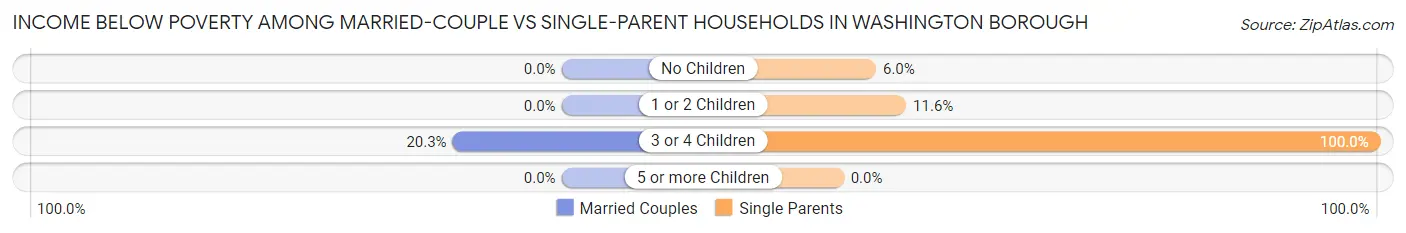
| Children | Married-Couple Families | Single-Parent Households |
| No Children | 0 (0.0%) | 14 (6.0%) |
| 1 or 2 Children | 0 (0.0%) | 37 (11.6%) |
| 3 or 4 Children | 39 (20.3%) | 10 (100.0%) |
| 5 or more Children | 0 (0.0%) | 0 (0.0%) |
| Total | 39 (3.5%) | 61 (10.9%) |
Race in Washington borough
The most populous races in Washington borough are White / Caucasian (5,802 | 80.1%), Hispanic or Latino (874 | 12.1%), and Some other Race (625 | 8.6%).
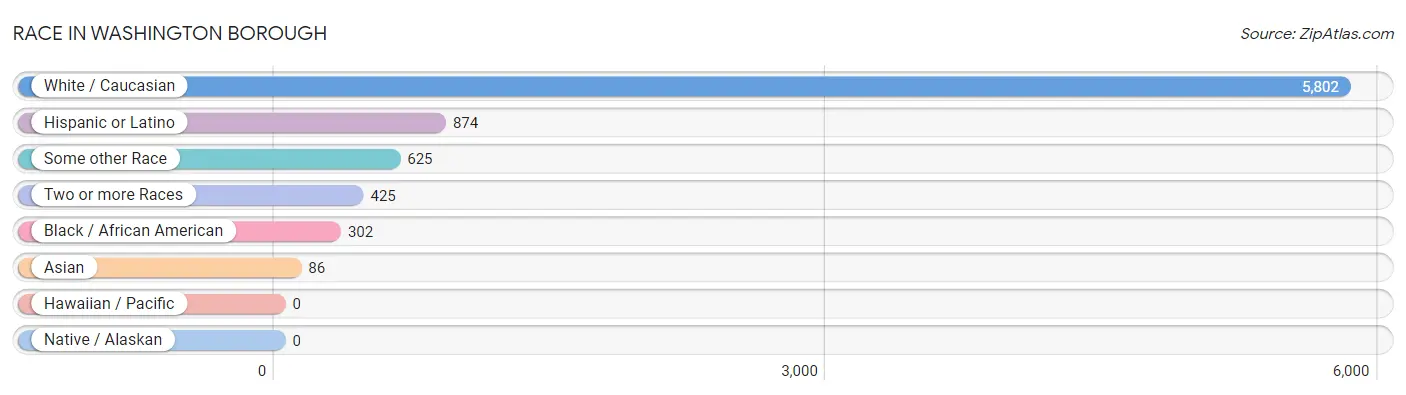
| Race | # Population | % Population |
| Asian | 86 | 1.2% |
| Black / African American | 302 | 4.2% |
| Hawaiian / Pacific | 0 | 0.0% |
| Hispanic or Latino | 874 | 12.1% |
| Native / Alaskan | 0 | 0.0% |
| White / Caucasian | 5,802 | 80.1% |
| Two or more Races | 425 | 5.9% |
| Some other Race | 625 | 8.6% |
| Total | 7,240 | 100.0% |
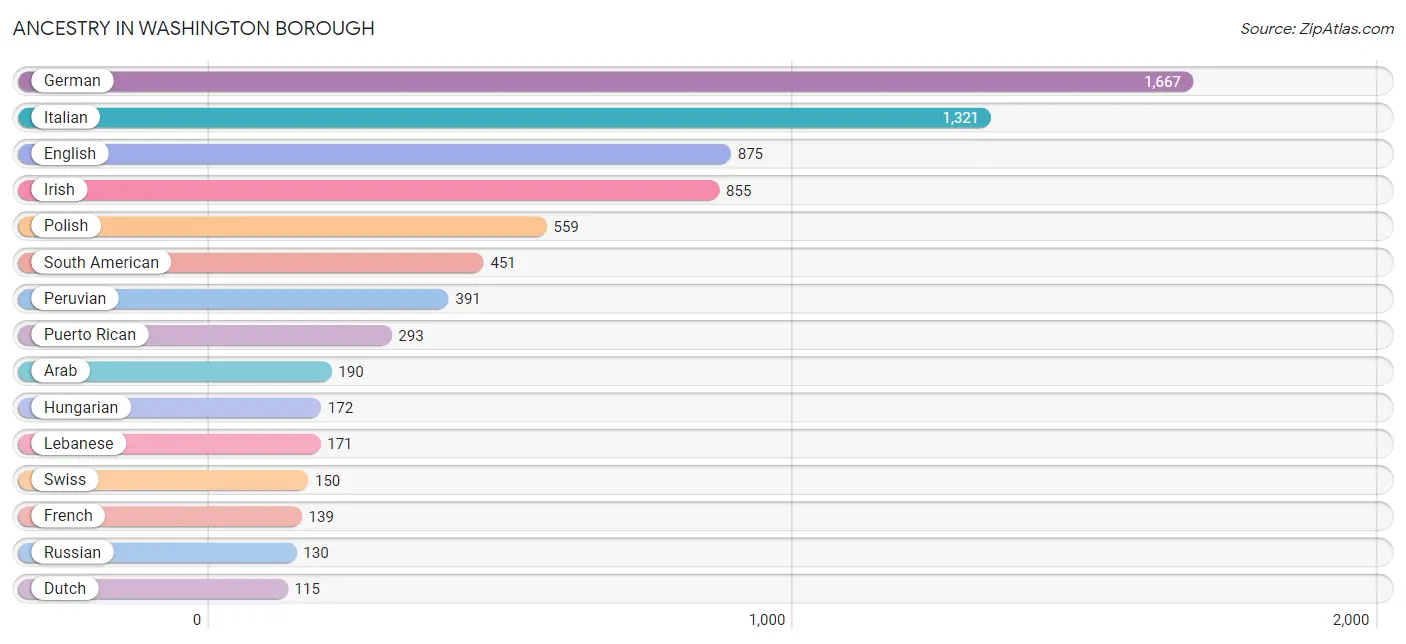
Ancestry in Washington borough
The most populous ancestries reported in Washington borough are German (1,667 | 23.0%), Italian (1,321 | 18.2%), English (875 | 12.1%), Irish (855 | 11.8%), and Polish (559 | 7.7%), together accounting for 72.9% of all Washington borough residents.
| Ancestry | # Population | % Population |
| American | 100 | 1.4% |
| Arab | 190 | 2.6% |
| Austrian | 33 | 0.5% |
| British West Indian | 22 | 0.3% |
| Canadian | 30 | 0.4% |
| Colombian | 27 | 0.4% |
| Croatian | 13 | 0.2% |
| Cuban | 54 | 0.7% |
| Dominican | 25 | 0.4% |
| Dutch | 115 | 1.6% |
| Eastern European | 42 | 0.6% |
| Ecuadorian | 33 | 0.5% |
| English | 875 | 12.1% |
| European | 70 | 1.0% |
| French | 139 | 1.9% |
| French Canadian | 21 | 0.3% |
| German | 1,667 | 23.0% |
| Greek | 21 | 0.3% |
| Guyanese | 35 | 0.5% |
| Hungarian | 172 | 2.4% |
| Irish | 855 | 11.8% |
| Italian | 1,321 | 18.2% |
| Jamaican | 36 | 0.5% |
| Lebanese | 171 | 2.4% |
| Lithuanian | 19 | 0.3% |
| Mexican | 51 | 0.7% |
| Pennsylvania German | 71 | 1.0% |
| Peruvian | 391 | 5.4% |
| Polish | 559 | 7.7% |
| Puerto Rican | 293 | 4.1% |
| Romanian | 66 | 0.9% |
| Russian | 130 | 1.8% |
| Scandinavian | 22 | 0.3% |
| Scottish | 11 | 0.2% |
| Seminole | 32 | 0.4% |
| South American | 451 | 6.2% |
| Swedish | 24 | 0.3% |
| Swiss | 150 | 2.1% |
| Syrian | 19 | 0.3% |
| Thai | 86 | 1.2% |
| Trinidadian and Tobagonian | 54 | 0.7% |
| Turkish | 21 | 0.3% |
| Ukrainian | 45 | 0.6% |
| Yugoslavian | 17 | 0.2% | View All 44 Rows |
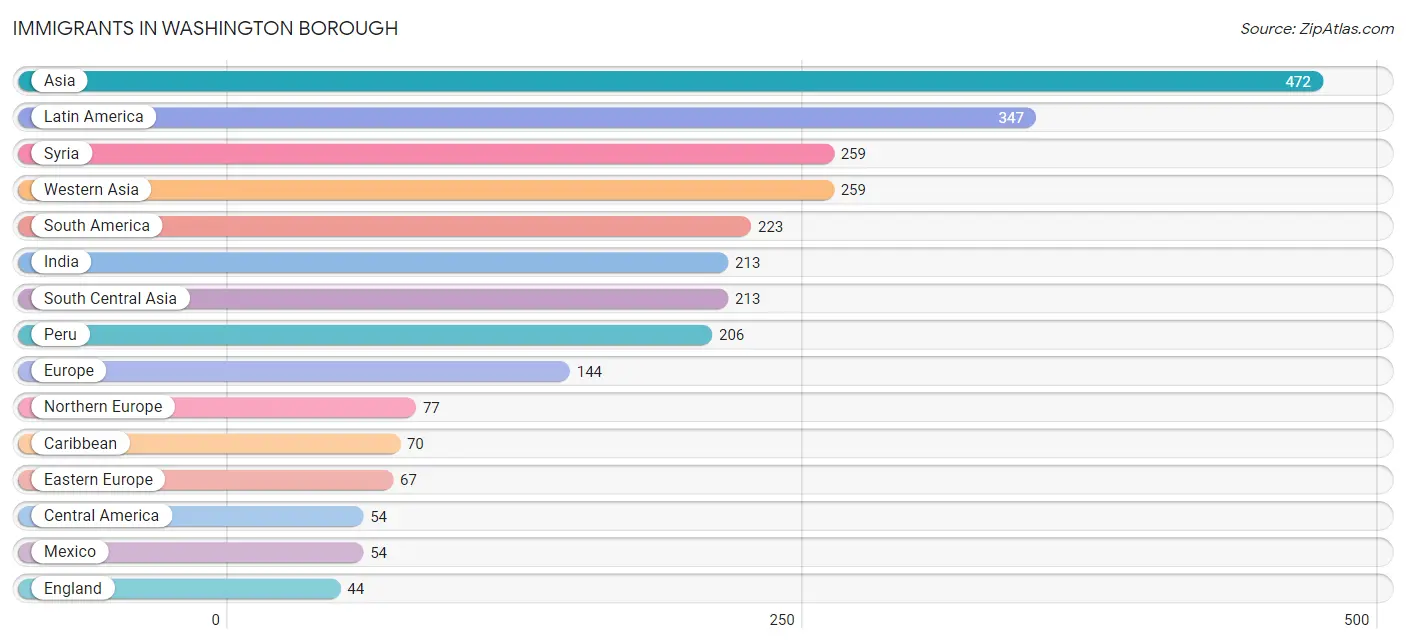
Immigrants in Washington borough
The most numerous immigrant groups reported in Washington borough came from Asia (472 | 6.5%), Latin America (347 | 4.8%), Syria (259 | 3.6%), Western Asia (259 | 3.6%), and South America (223 | 3.1%), together accounting for 21.5% of all Washington borough residents.
| Immigration Origin | # Population | % Population |
| Asia | 472 | 6.5% |
| Canada | 30 | 0.4% |
| Caribbean | 70 | 1.0% |
| Central America | 54 | 0.7% |
| Dominica | 22 | 0.3% |
| Dominican Republic | 25 | 0.4% |
| Eastern Europe | 67 | 0.9% |
| Ecuador | 17 | 0.2% |
| England | 44 | 0.6% |
| Europe | 144 | 2.0% |
| Hungary | 25 | 0.4% |
| India | 213 | 2.9% |
| Latin America | 347 | 4.8% |
| Mexico | 54 | 0.7% |
| Northern Europe | 77 | 1.1% |
| Peru | 206 | 2.9% |
| Romania | 42 | 0.6% |
| South America | 223 | 3.1% |
| South Central Asia | 213 | 2.9% |
| Syria | 259 | 3.6% |
| Trinidad and Tobago | 23 | 0.3% |
| Western Asia | 259 | 3.6% | View All 22 Rows |
Sex and Age in Washington borough
Sex and Age in Washington borough
The most populous age groups in Washington borough are 20 to 24 Years (414 | 11.7%) for men and 10 to 14 Years (535 | 14.4%) for women.
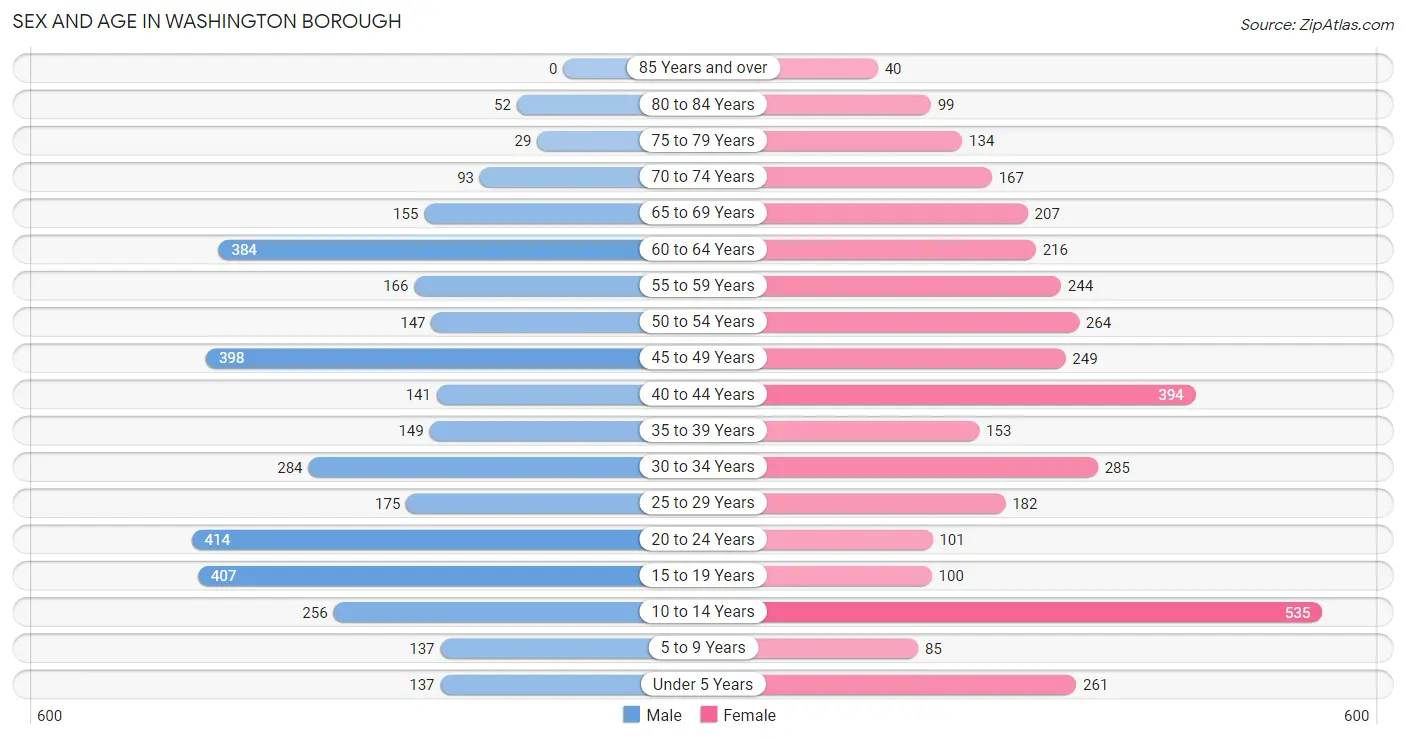
| Age Bracket | Male | Female |
| Under 5 Years | 137 (3.9%) | 261 (7.0%) |
| 5 to 9 Years | 137 (3.9%) | 85 (2.3%) |
| 10 to 14 Years | 256 (7.3%) | 535 (14.4%) |
| 15 to 19 Years | 407 (11.6%) | 100 (2.7%) |
| 20 to 24 Years | 414 (11.7%) | 101 (2.7%) |
| 25 to 29 Years | 175 (5.0%) | 182 (4.9%) |
| 30 to 34 Years | 284 (8.1%) | 285 (7.7%) |
| 35 to 39 Years | 149 (4.2%) | 153 (4.1%) |
| 40 to 44 Years | 141 (4.0%) | 394 (10.6%) |
| 45 to 49 Years | 398 (11.3%) | 249 (6.7%) |
| 50 to 54 Years | 147 (4.2%) | 264 (7.1%) |
| 55 to 59 Years | 166 (4.7%) | 244 (6.6%) |
| 60 to 64 Years | 384 (10.9%) | 216 (5.8%) |
| 65 to 69 Years | 155 (4.4%) | 207 (5.6%) |
| 70 to 74 Years | 93 (2.6%) | 167 (4.5%) |
| 75 to 79 Years | 29 (0.8%) | 134 (3.6%) |
| 80 to 84 Years | 52 (1.5%) | 99 (2.7%) |
| 85 Years and over | 0 (0.0%) | 40 (1.1%) |
| Total | 3,524 (100.0%) | 3,716 (100.0%) |
Families and Households in Washington borough
Median Family Size in Washington borough
The median family size in Washington borough is 3.31 persons per family, with married-couple families (1,110 | 66.5%) accounting for the largest median family size of 3.61 persons per family. On the other hand, single male/father families (93 | 5.6%) represent the smallest median family size with 2.37 persons per family.
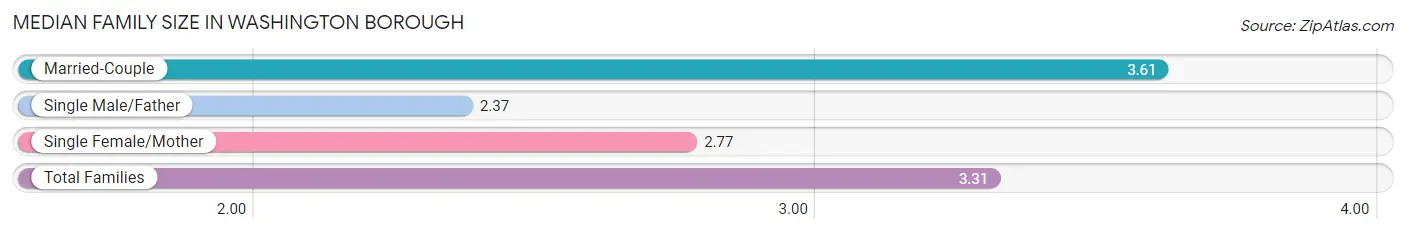
| Family Type | # Families | Family Size |
| Married-Couple | 1,110 (66.5%) | 3.61 |
| Single Male/Father | 93 (5.6%) | 2.37 |
| Single Female/Mother | 467 (28.0%) | 2.77 |
| Total Families | 1,670 (100.0%) | 3.31 |
Median Household Size in Washington borough
The median household size in Washington borough is 2.41 persons per household, with married-couple households (1,110 | 37.1%) accounting for the largest median household size of 3.65 persons per household. non-family households (1,321 | 44.2%) represent the smallest median household size with 1.20 persons per household.
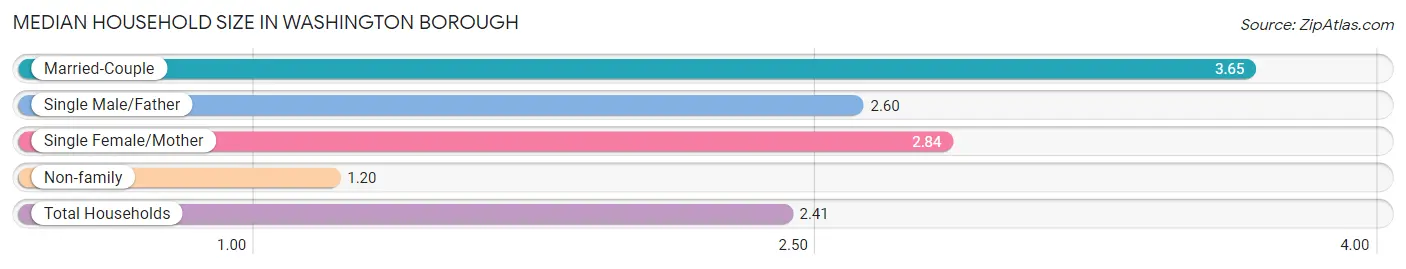
| Household Type | # Households | Household Size |
| Married-Couple | 1,110 (37.1%) | 3.65 |
| Single Male/Father | 93 (3.1%) | 2.60 |
| Single Female/Mother | 467 (15.6%) | 2.84 |
| Non-family | 1,321 (44.2%) | 1.20 |
| Total Households | 2,991 (100.0%) | 2.41 |
Household Size by Marriage Status in Washington borough
Out of a total of 2,991 households in Washington borough, 1,670 (55.8%) are family households, while 1,321 (44.2%) are nonfamily households. The most numerous type of family households are 2-person households, comprising 588, and the most common type of nonfamily households are 1-person households, comprising 1,148.
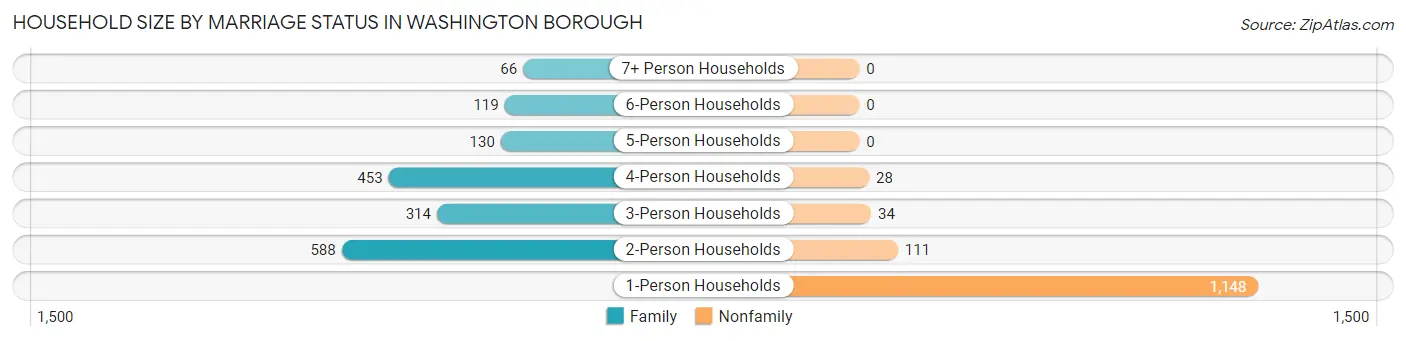
| Household Size | Family Households | Nonfamily Households |
| 1-Person Households | - | 1,148 (38.4%) |
| 2-Person Households | 588 (19.7%) | 111 (3.7%) |
| 3-Person Households | 314 (10.5%) | 34 (1.1%) |
| 4-Person Households | 453 (15.1%) | 28 (0.9%) |
| 5-Person Households | 130 (4.3%) | 0 (0.0%) |
| 6-Person Households | 119 (4.0%) | 0 (0.0%) |
| 7+ Person Households | 66 (2.2%) | 0 (0.0%) |
| Total | 1,670 (55.8%) | 1,321 (44.2%) |
Female Fertility in Washington borough
Fertility by Age in Washington borough
Average fertility rate in Washington borough is 4.0 births per 1,000 women. Women in the age bracket of 20 to 34 years have the highest fertility rate with 11.0 births per 1,000 women. Women in the age bracket of 20 to 34 years acount for 100.0% of all women with births.
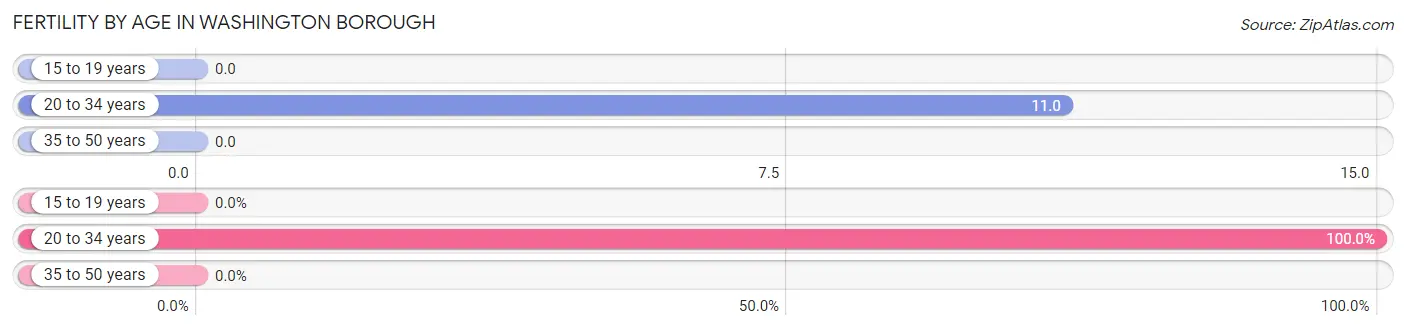
| Age Bracket | Women with Births | Births / 1,000 Women |
| 15 to 19 years | 0 (0.0%) | 0.0 |
| 20 to 34 years | 6 (100.0%) | 11.0 |
| 35 to 50 years | 0 (0.0%) | 0.0 |
| Total | 6 (100.0%) | 4.0 |
Fertility by Age by Marriage Status in Washington borough
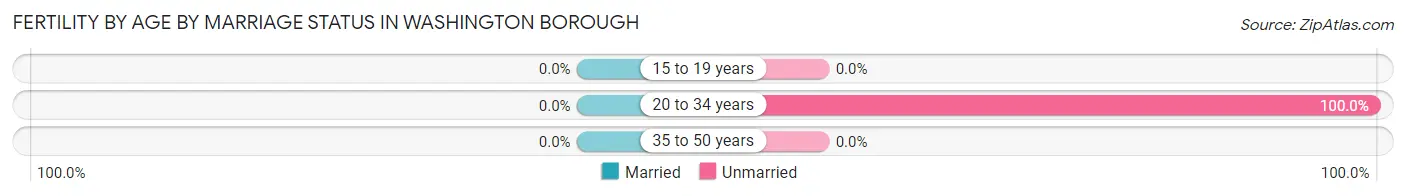
| Age Bracket | Married | Unmarried |
| 15 to 19 years | 0 (0.0%) | 0 (0.0%) |
| 20 to 34 years | 0 (0.0%) | 6 (100.0%) |
| 35 to 50 years | 0 (0.0%) | 0 (0.0%) |
| Total | 0 (0.0%) | 6 (100.0%) |
Fertility by Education in Washington borough
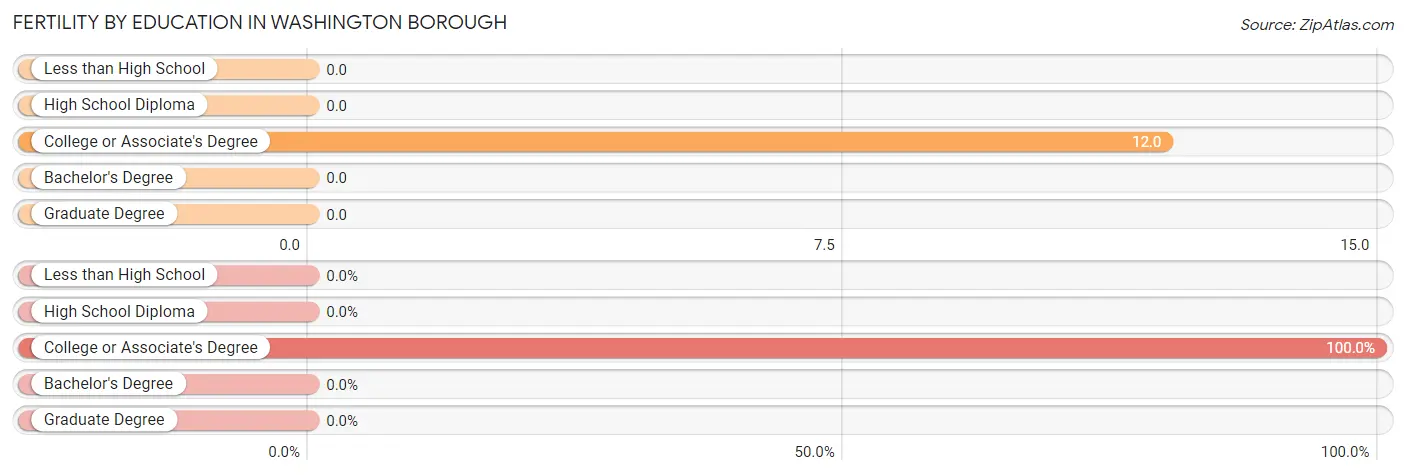
| Educational Attainment | Women with Births | Births / 1,000 Women |
| Less than High School | 0 (0.0%) | 0.0 |
| High School Diploma | 0 (0.0%) | 0.0 |
| College or Associate's Degree | 6 (100.0%) | 12.0 |
| Bachelor's Degree | 0 (0.0%) | 0.0 |
| Graduate Degree | 0 (0.0%) | 0.0 |
| Total | 6 (100.0%) | 4.0 |
Fertility by Education by Marriage Status in Washington borough
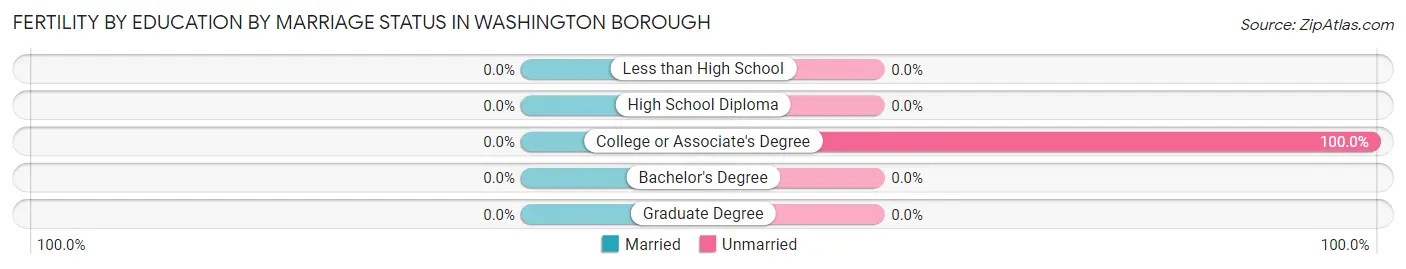
| Educational Attainment | Married | Unmarried |
| Less than High School | 0 (0.0%) | 0 (0.0%) |
| High School Diploma | 0 (0.0%) | 0 (0.0%) |
| College or Associate's Degree | 0 (0.0%) | 6 (100.0%) |
| Bachelor's Degree | 0 (0.0%) | 0 (0.0%) |
| Graduate Degree | 0 (0.0%) | 0 (0.0%) |
| Total | 0 (0.0%) | 6 (100.0%) |
Employment Characteristics in Washington borough
Employment by Class of Employer in Washington borough
Among the 3,418 employed individuals in Washington borough, private company employees (2,438 | 71.3%), not-for-profit organizations (367 | 10.7%), and local government employees (254 | 7.4%) make up the most common classes of employment.
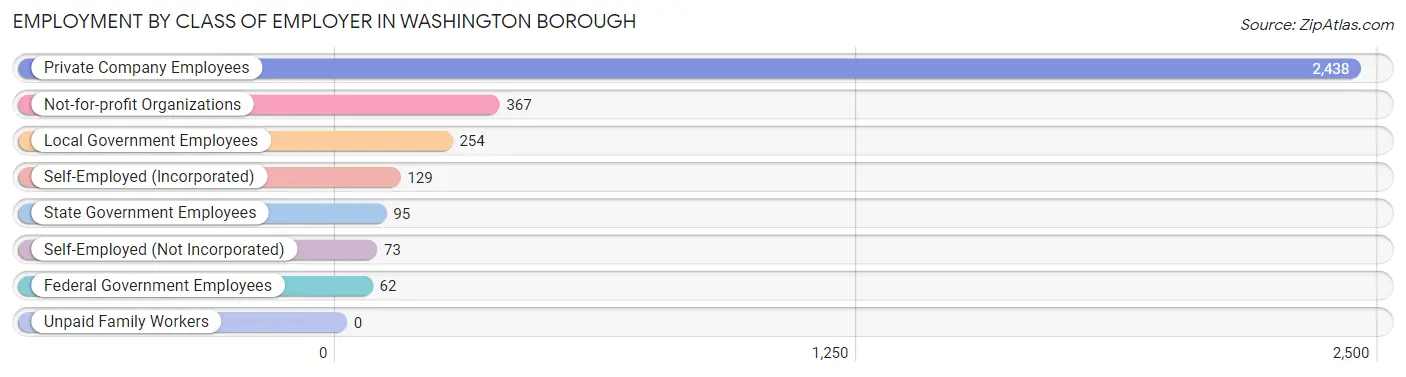
| Employer Class | # Employees | % Employees |
| Private Company Employees | 2,438 | 71.3% |
| Self-Employed (Incorporated) | 129 | 3.8% |
| Self-Employed (Not Incorporated) | 73 | 2.1% |
| Not-for-profit Organizations | 367 | 10.7% |
| Local Government Employees | 254 | 7.4% |
| State Government Employees | 95 | 2.8% |
| Federal Government Employees | 62 | 1.8% |
| Unpaid Family Workers | 0 | 0.0% |
| Total | 3,418 | 100.0% |
Employment Status by Age in Washington borough
According to the labor force statistics for Washington borough, out of the total population over 16 years of age (5,715), 67.0% or 3,829 individuals are in the labor force, with 5.4% or 207 of them unemployed. The age group with the highest labor force participation rate is 25 to 29 years, with 93.8% or 335 individuals in the labor force. Within the labor force, the 55 to 59 years age range has the highest percentage of unemployed individuals, with 28.3% or 67 of them being unemployed.
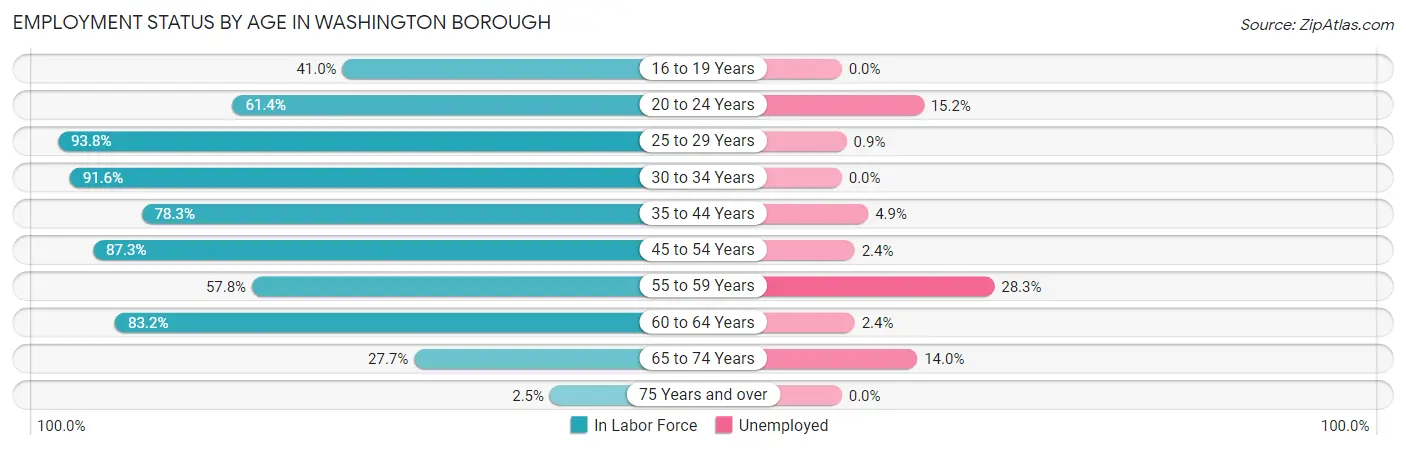
| Age Bracket | In Labor Force | Unemployed |
| 16 to 19 Years | 161 (41.0%) | 0 (0.0%) |
| 20 to 24 Years | 316 (61.4%) | 48 (15.2%) |
| 25 to 29 Years | 335 (93.8%) | 3 (0.9%) |
| 30 to 34 Years | 521 (91.6%) | 0 (0.0%) |
| 35 to 44 Years | 655 (78.3%) | 32 (4.9%) |
| 45 to 54 Years | 924 (87.3%) | 22 (2.4%) |
| 55 to 59 Years | 237 (57.8%) | 67 (28.3%) |
| 60 to 64 Years | 499 (83.2%) | 12 (2.4%) |
| 65 to 74 Years | 172 (27.7%) | 24 (14.0%) |
| 75 Years and over | 9 (2.5%) | 0 (0.0%) |
| Total | 3,829 (67.0%) | 207 (5.4%) |
Employment Status by Educational Attainment in Washington borough
According to labor force statistics for Washington borough, 82.8% of individuals (3,172) out of the total population between 25 and 64 years of age (3,831) are in the labor force, with 4.3% or 136 of them being unemployed. The group with the highest labor force participation rate are those with the educational attainment of bachelor's degree or higher, with 91.9% or 911 individuals in the labor force. Within the labor force, individuals with college / associate degree education have the highest percentage of unemployment, with 6.1% or 48 of them being unemployed.
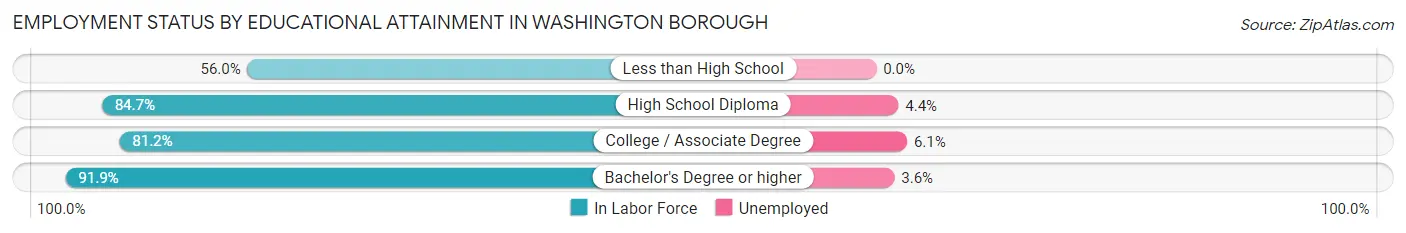
| Educational Attainment | In Labor Force | Unemployed |
| Less than High School | 216 (56.0%) | 0 (0.0%) |
| High School Diploma | 1,254 (84.7%) | 65 (4.4%) |
| College / Associate Degree | 790 (81.2%) | 59 (6.1%) |
| Bachelor's Degree or higher | 911 (91.9%) | 36 (3.6%) |
| Total | 3,172 (82.8%) | 165 (4.3%) |
Employment Occupations by Sex in Washington borough
Management, Business, Science and Arts Occupations
The most common Management, Business, Science and Arts occupations in Washington borough are Community & Social Service (335 | 9.2%), Management (325 | 9.0%), Education Instruction & Library (221 | 6.1%), Computers, Engineering & Science (213 | 5.9%), and Computers & Mathematics (172 | 4.8%).
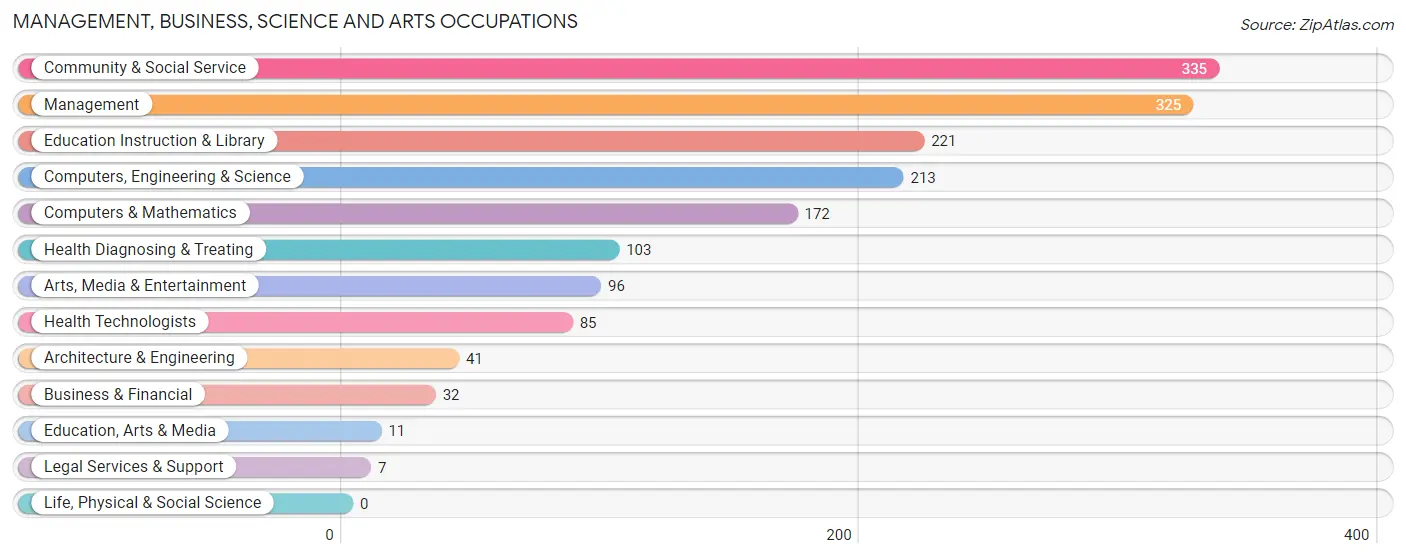
Management, Business, Science and Arts Occupations by Sex
Within the Management, Business, Science and Arts occupations in Washington borough, the most male-oriented occupations are Computers, Engineering & Science (100.0%), Computers & Mathematics (100.0%), and Architecture & Engineering (100.0%), while the most female-oriented occupations are Business & Financial (100.0%), Education, Arts & Media (100.0%), and Education Instruction & Library (88.2%).
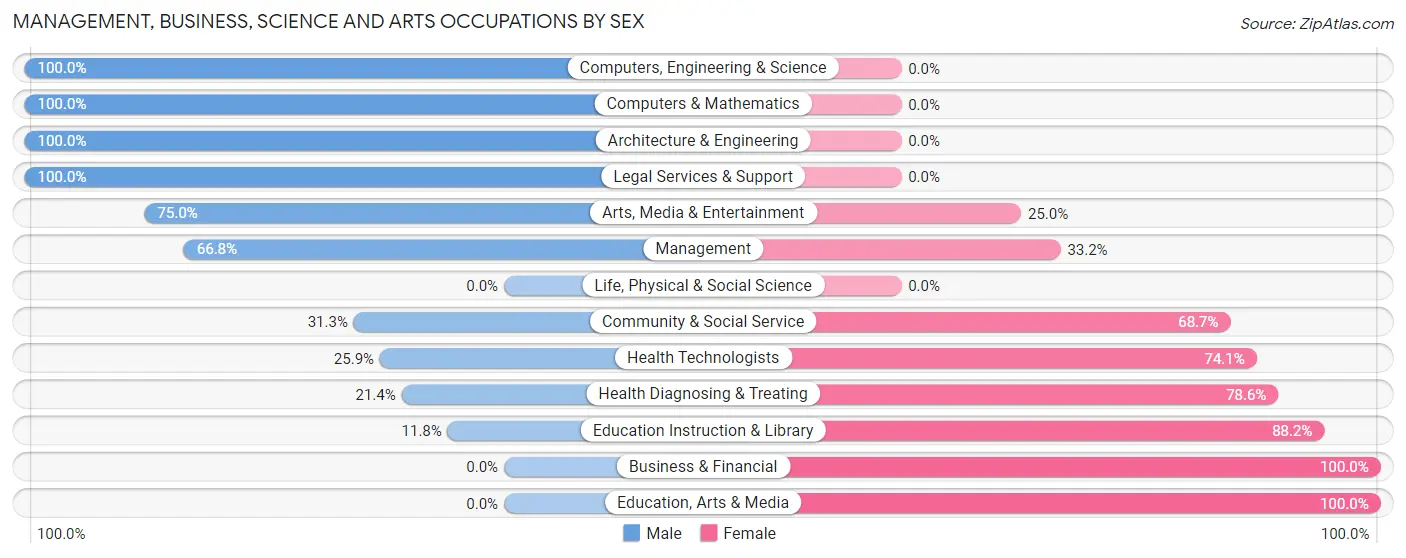
| Occupation | Male | Female |
| Management | 217 (66.8%) | 108 (33.2%) |
| Business & Financial | 0 (0.0%) | 32 (100.0%) |
| Computers, Engineering & Science | 213 (100.0%) | 0 (0.0%) |
| Computers & Mathematics | 172 (100.0%) | 0 (0.0%) |
| Architecture & Engineering | 41 (100.0%) | 0 (0.0%) |
| Life, Physical & Social Science | 0 (0.0%) | 0 (0.0%) |
| Community & Social Service | 105 (31.3%) | 230 (68.7%) |
| Education, Arts & Media | 0 (0.0%) | 11 (100.0%) |
| Legal Services & Support | 7 (100.0%) | 0 (0.0%) |
| Education Instruction & Library | 26 (11.8%) | 195 (88.2%) |
| Arts, Media & Entertainment | 72 (75.0%) | 24 (25.0%) |
| Health Diagnosing & Treating | 22 (21.4%) | 81 (78.6%) |
| Health Technologists | 22 (25.9%) | 63 (74.1%) |
| Total (Category) | 557 (55.3%) | 451 (44.7%) |
| Total (Overall) | 2,000 (55.2%) | 1,621 (44.8%) |
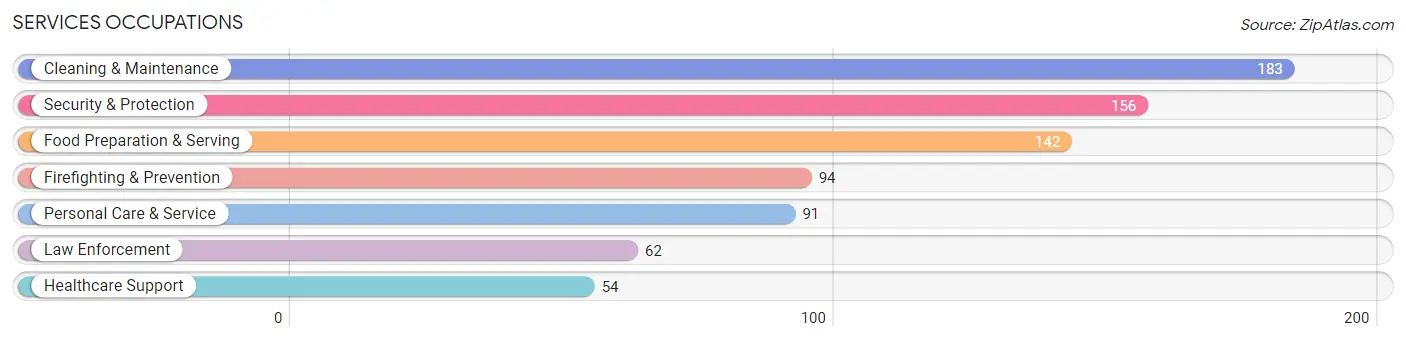
Services Occupations
The most common Services occupations in Washington borough are Cleaning & Maintenance (183 | 5.1%), Security & Protection (156 | 4.3%), Food Preparation & Serving (142 | 3.9%), Firefighting & Prevention (94 | 2.6%), and Personal Care & Service (91 | 2.5%).
Services Occupations by Sex
Within the Services occupations in Washington borough, the most male-oriented occupations are Law Enforcement (100.0%), Security & Protection (91.7%), and Firefighting & Prevention (86.2%), while the most female-oriented occupations are Healthcare Support (100.0%), Personal Care & Service (50.5%), and Food Preparation & Serving (37.3%).
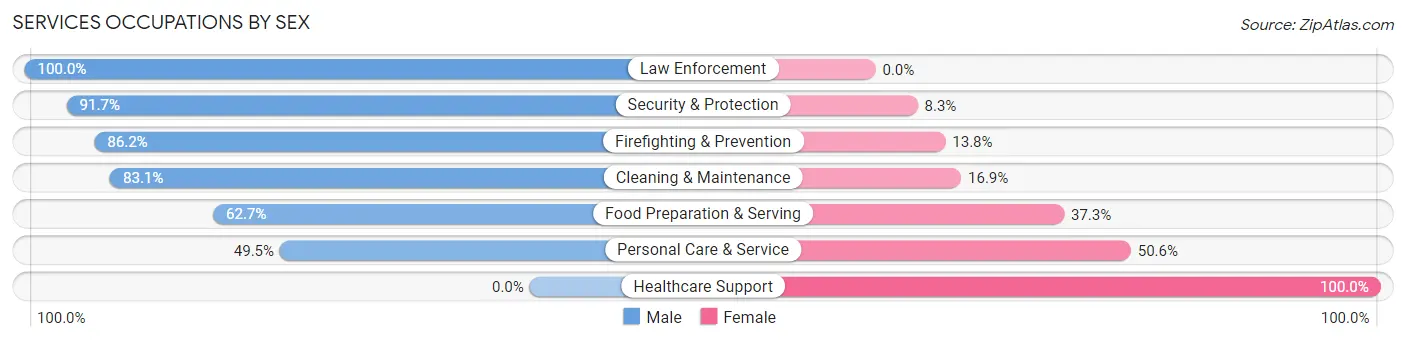
| Occupation | Male | Female |
| Healthcare Support | 0 (0.0%) | 54 (100.0%) |
| Security & Protection | 143 (91.7%) | 13 (8.3%) |
| Firefighting & Prevention | 81 (86.2%) | 13 (13.8%) |
| Law Enforcement | 62 (100.0%) | 0 (0.0%) |
| Food Preparation & Serving | 89 (62.7%) | 53 (37.3%) |
| Cleaning & Maintenance | 152 (83.1%) | 31 (16.9%) |
| Personal Care & Service | 45 (49.4%) | 46 (50.5%) |
| Total (Category) | 429 (68.5%) | 197 (31.5%) |
| Total (Overall) | 2,000 (55.2%) | 1,621 (44.8%) |
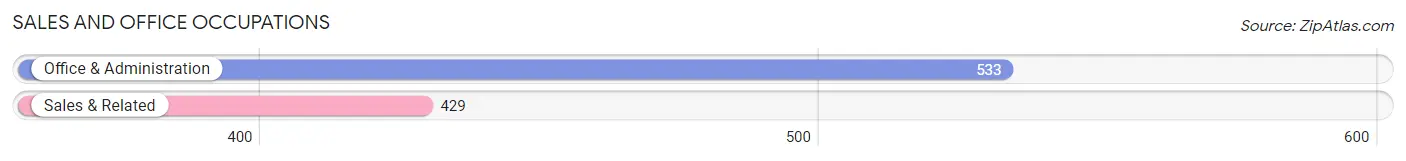
Sales and Office Occupations
The most common Sales and Office occupations in Washington borough are Office & Administration (533 | 14.7%), and Sales & Related (429 | 11.8%).
Sales and Office Occupations by Sex
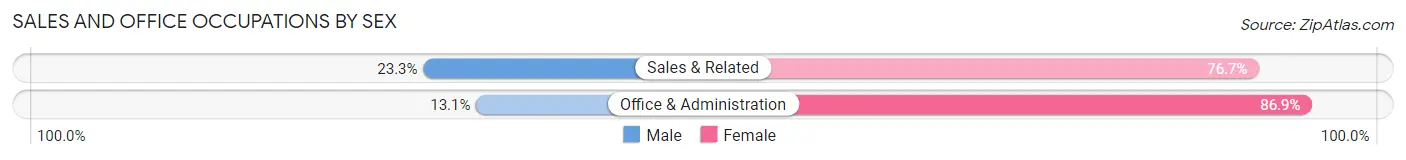
| Occupation | Male | Female |
| Sales & Related | 100 (23.3%) | 329 (76.7%) |
| Office & Administration | 70 (13.1%) | 463 (86.9%) |
| Total (Category) | 170 (17.7%) | 792 (82.3%) |
| Total (Overall) | 2,000 (55.2%) | 1,621 (44.8%) |
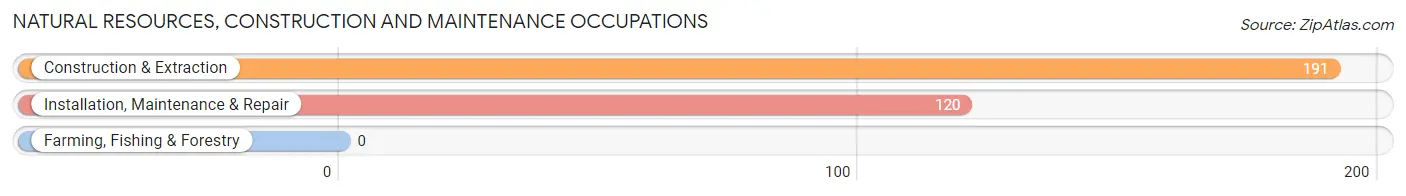
Natural Resources, Construction and Maintenance Occupations
The most common Natural Resources, Construction and Maintenance occupations in Washington borough are Construction & Extraction (191 | 5.3%), and Installation, Maintenance & Repair (120 | 3.3%).
Natural Resources, Construction and Maintenance Occupations by Sex
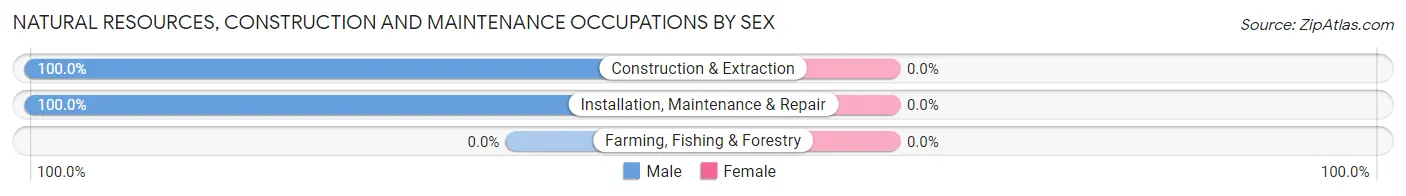
| Occupation | Male | Female |
| Farming, Fishing & Forestry | 0 (0.0%) | 0 (0.0%) |
| Construction & Extraction | 191 (100.0%) | 0 (0.0%) |
| Installation, Maintenance & Repair | 120 (100.0%) | 0 (0.0%) |
| Total (Category) | 311 (100.0%) | 0 (0.0%) |
| Total (Overall) | 2,000 (55.2%) | 1,621 (44.8%) |
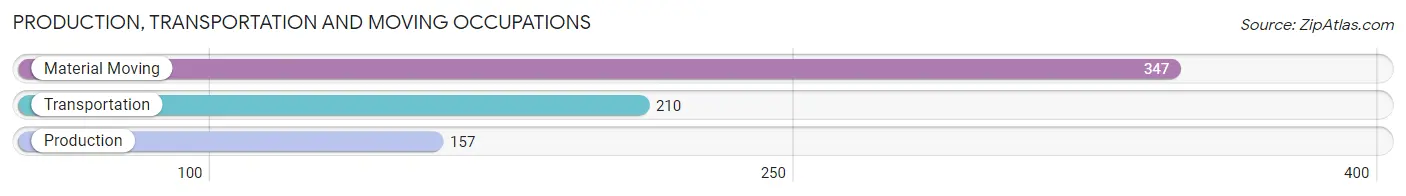
Production, Transportation and Moving Occupations
The most common Production, Transportation and Moving occupations in Washington borough are Material Moving (347 | 9.6%), Transportation (210 | 5.8%), and Production (157 | 4.3%).
Production, Transportation and Moving Occupations by Sex
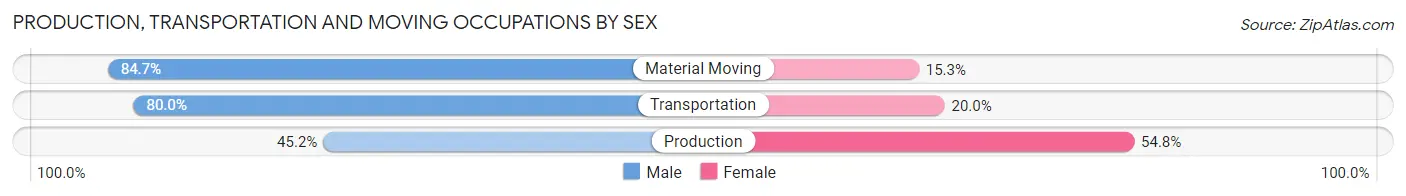
| Occupation | Male | Female |
| Production | 71 (45.2%) | 86 (54.8%) |
| Transportation | 168 (80.0%) | 42 (20.0%) |
| Material Moving | 294 (84.7%) | 53 (15.3%) |
| Total (Category) | 533 (74.7%) | 181 (25.4%) |
| Total (Overall) | 2,000 (55.2%) | 1,621 (44.8%) |
Employment Industries by Sex in Washington borough
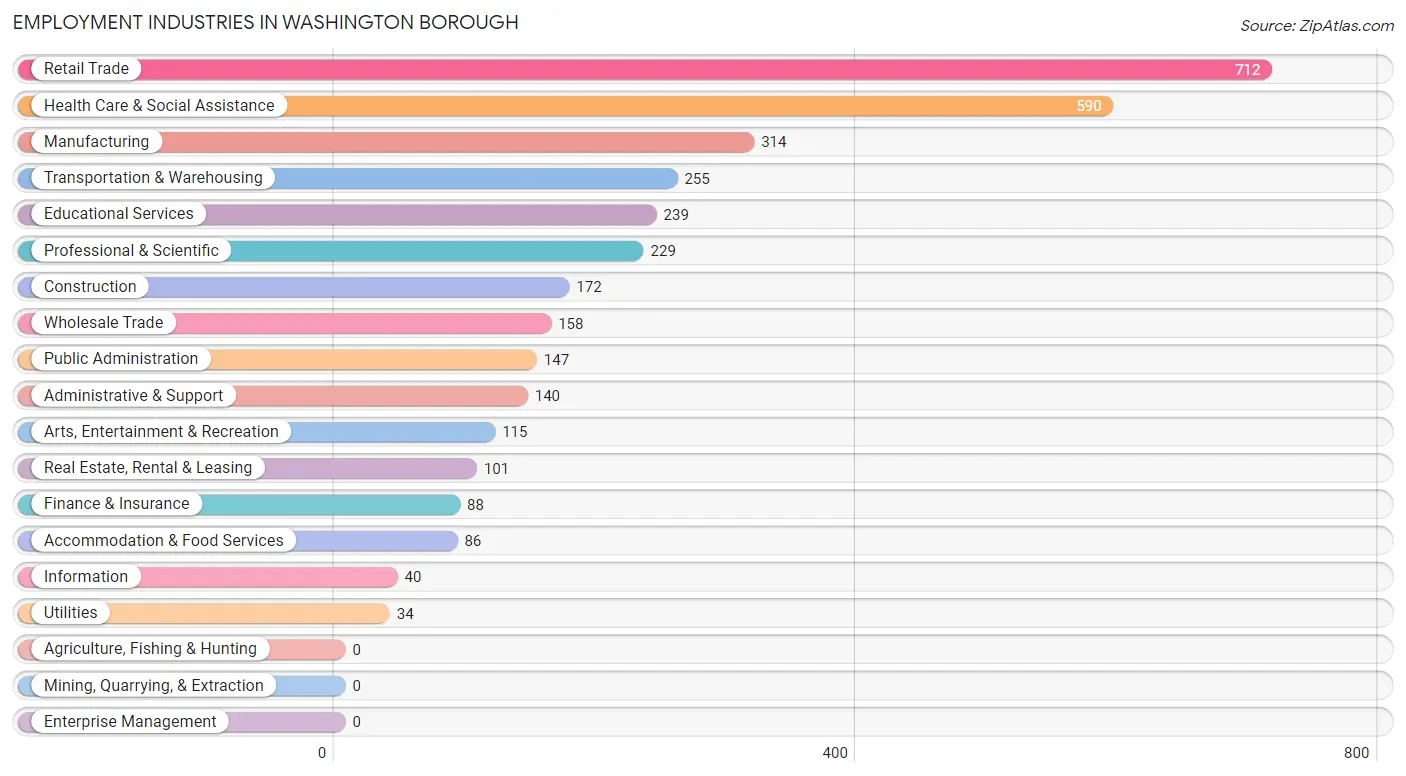
Employment Industries in Washington borough
The major employment industries in Washington borough include Retail Trade (712 | 19.7%), Health Care & Social Assistance (590 | 16.3%), Manufacturing (314 | 8.7%), Transportation & Warehousing (255 | 7.0%), and Educational Services (239 | 6.6%).
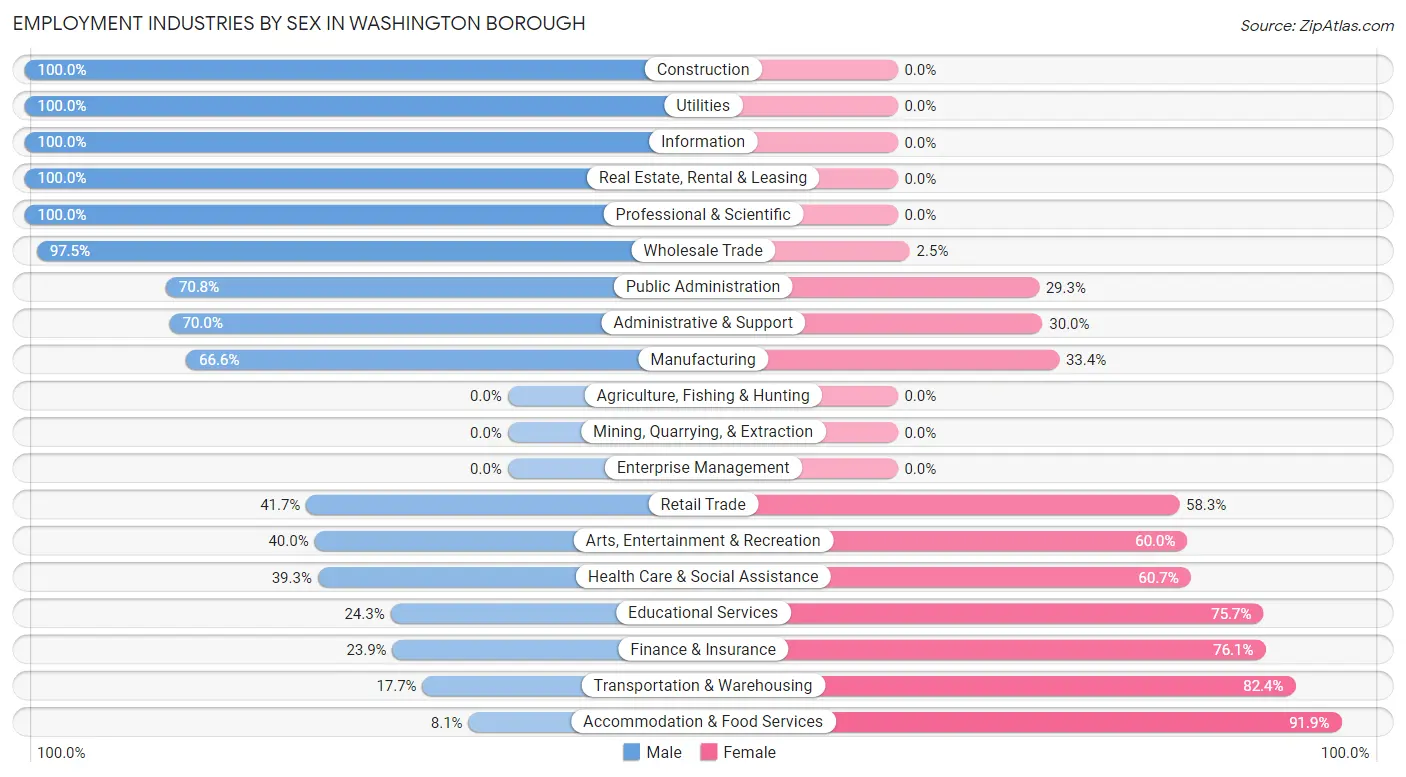
Employment Industries by Sex in Washington borough
The Washington borough industries that see more men than women are Construction (100.0%), Utilities (100.0%), and Information (100.0%), whereas the industries that tend to have a higher number of women are Accommodation & Food Services (91.9%), Transportation & Warehousing (82.4%), and Finance & Insurance (76.1%).
| Industry | Male | Female |
| Agriculture, Fishing & Hunting | 0 (0.0%) | 0 (0.0%) |
| Mining, Quarrying, & Extraction | 0 (0.0%) | 0 (0.0%) |
| Construction | 172 (100.0%) | 0 (0.0%) |
| Manufacturing | 209 (66.6%) | 105 (33.4%) |
| Wholesale Trade | 154 (97.5%) | 4 (2.5%) |
| Retail Trade | 297 (41.7%) | 415 (58.3%) |
| Transportation & Warehousing | 45 (17.6%) | 210 (82.4%) |
| Utilities | 34 (100.0%) | 0 (0.0%) |
| Information | 40 (100.0%) | 0 (0.0%) |
| Finance & Insurance | 21 (23.9%) | 67 (76.1%) |
| Real Estate, Rental & Leasing | 101 (100.0%) | 0 (0.0%) |
| Professional & Scientific | 229 (100.0%) | 0 (0.0%) |
| Enterprise Management | 0 (0.0%) | 0 (0.0%) |
| Administrative & Support | 98 (70.0%) | 42 (30.0%) |
| Educational Services | 58 (24.3%) | 181 (75.7%) |
| Health Care & Social Assistance | 232 (39.3%) | 358 (60.7%) |
| Arts, Entertainment & Recreation | 46 (40.0%) | 69 (60.0%) |
| Accommodation & Food Services | 7 (8.1%) | 79 (91.9%) |
| Public Administration | 104 (70.8%) | 43 (29.2%) |
| Total | 2,000 (55.2%) | 1,621 (44.8%) |
Education in Washington borough
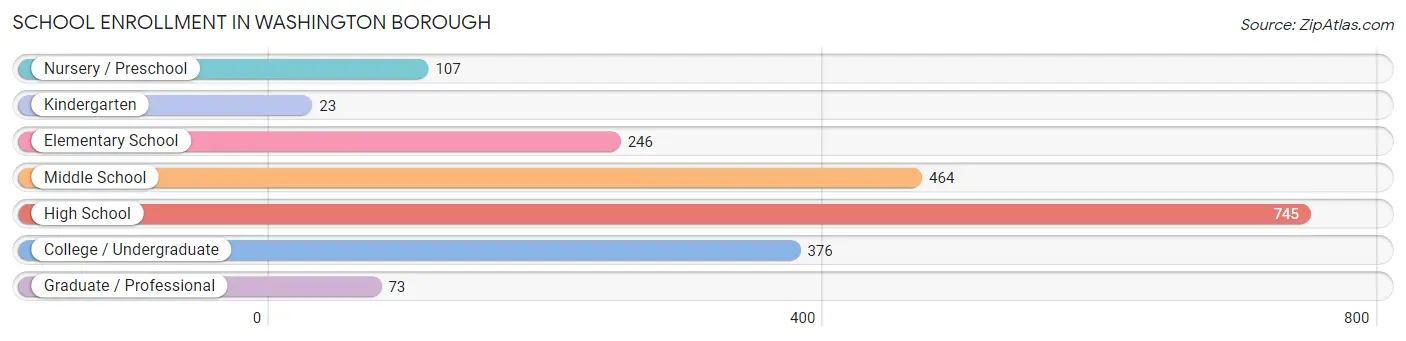
School Enrollment in Washington borough
The most common levels of schooling among the 2,034 students in Washington borough are high school (745 | 36.6%), middle school (464 | 22.8%), and college / undergraduate (376 | 18.5%).
| School Level | # Students | % Students |
| Nursery / Preschool | 107 | 5.3% |
| Kindergarten | 23 | 1.1% |
| Elementary School | 246 | 12.1% |
| Middle School | 464 | 22.8% |
| High School | 745 | 36.6% |
| College / Undergraduate | 376 | 18.5% |
| Graduate / Professional | 73 | 3.6% |
| Total | 2,034 | 100.0% |
School Enrollment by Age by Funding Source in Washington borough
Out of a total of 2,034 students who are enrolled in schools in Washington borough, 403 (19.8%) attend a private institution, while the remaining 1,631 (80.2%) are enrolled in public schools. The age group of 25 to 34 year olds has the highest likelihood of being enrolled in private schools, with 38 (63.3% in the age bracket) enrolled. Conversely, the age group of 15 to 17 year olds has the lowest likelihood of being enrolled in a private school, with 382 (93.4% in the age bracket) attending a public institution.
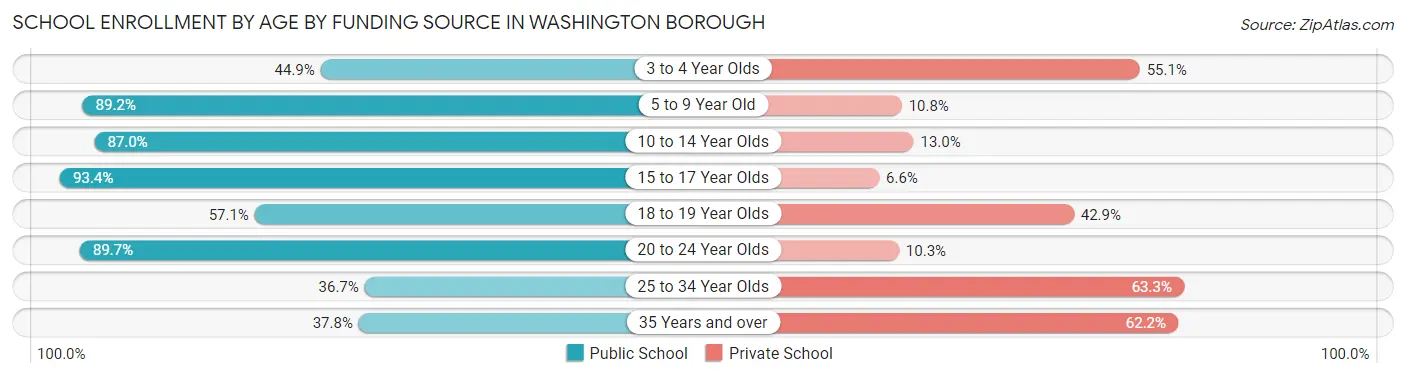
| Age Bracket | Public School | Private School |
| 3 to 4 Year Olds | 48 (44.9%) | 59 (55.1%) |
| 5 to 9 Year Old | 198 (89.2%) | 24 (10.8%) |
| 10 to 14 Year Olds | 688 (87.0%) | 103 (13.0%) |
| 15 to 17 Year Olds | 382 (93.4%) | 27 (6.6%) |
| 18 to 19 Year Olds | 56 (57.1%) | 42 (42.9%) |
| 20 to 24 Year Olds | 183 (89.7%) | 21 (10.3%) |
| 25 to 34 Year Olds | 22 (36.7%) | 38 (63.3%) |
| 35 Years and over | 54 (37.8%) | 89 (62.2%) |
| Total | 1,631 (80.2%) | 403 (19.8%) |
Educational Attainment by Field of Study in Washington borough
Arts & humanities (202 | 15.2%), liberal arts & history (179 | 13.5%), business (173 | 13.0%), social sciences (169 | 12.7%), and science & technology (146 | 11.0%) are the most common fields of study among 1,328 individuals in Washington borough who have obtained a bachelor's degree or higher.
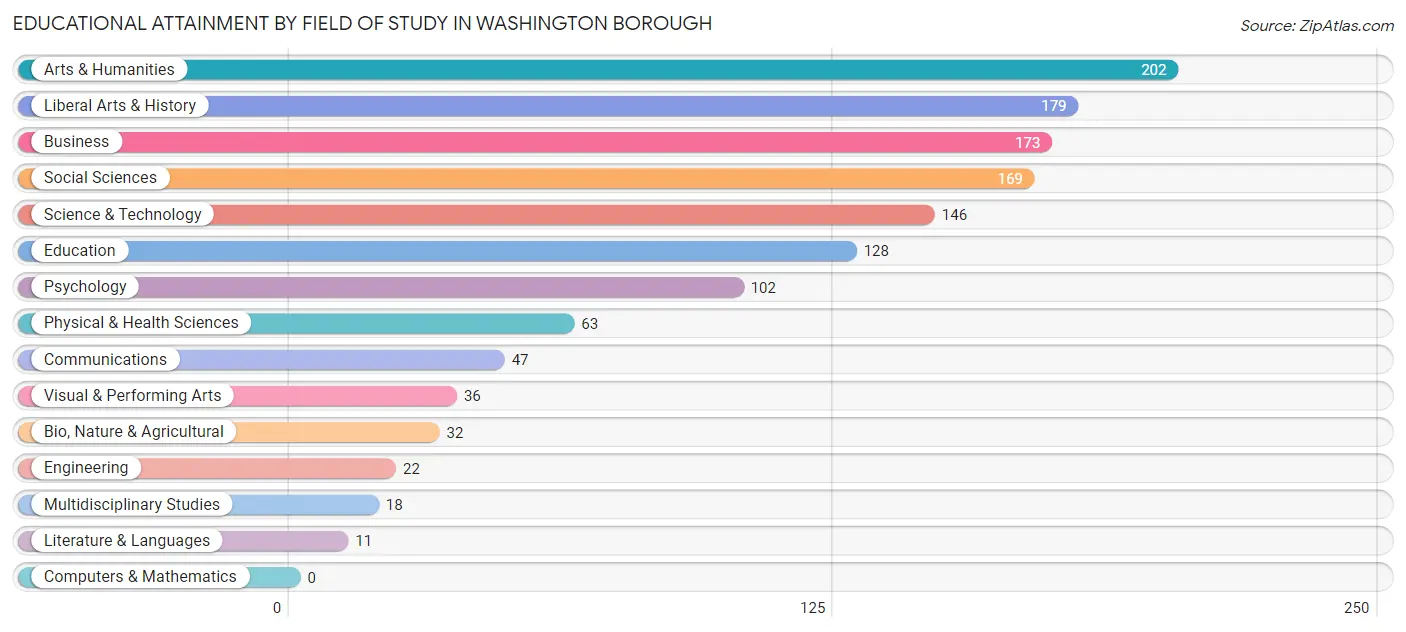
| Field of Study | # Graduates | % Graduates |
| Computers & Mathematics | 0 | 0.0% |
| Bio, Nature & Agricultural | 32 | 2.4% |
| Physical & Health Sciences | 63 | 4.7% |
| Psychology | 102 | 7.7% |
| Social Sciences | 169 | 12.7% |
| Engineering | 22 | 1.7% |
| Multidisciplinary Studies | 18 | 1.4% |
| Science & Technology | 146 | 11.0% |
| Business | 173 | 13.0% |
| Education | 128 | 9.6% |
| Literature & Languages | 11 | 0.8% |
| Liberal Arts & History | 179 | 13.5% |
| Visual & Performing Arts | 36 | 2.7% |
| Communications | 47 | 3.5% |
| Arts & Humanities | 202 | 15.2% |
| Total | 1,328 | 100.0% |
Transportation & Commute in Washington borough
Vehicle Availability by Sex in Washington borough
The most prevalent vehicle ownership categories in Washington borough are males with 2 vehicles (746, accounting for 40.1%) and females with 2 vehicles (587, making up 47.9%).
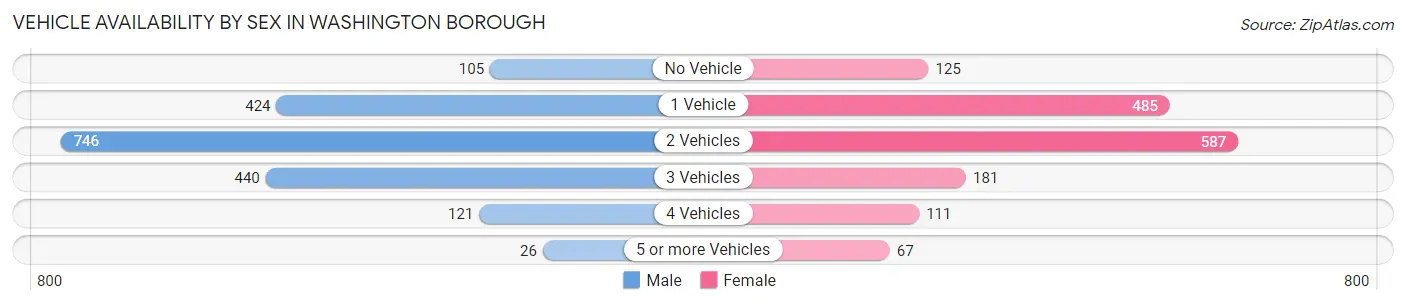
| Vehicles Available | Male | Female |
| No Vehicle | 105 (5.6%) | 125 (8.0%) |
| 1 Vehicle | 424 (22.8%) | 485 (31.2%) |
| 2 Vehicles | 746 (40.1%) | 587 (37.7%) |
| 3 Vehicles | 440 (23.6%) | 181 (11.6%) |
| 4 Vehicles | 121 (6.5%) | 111 (7.1%) |
| 5 or more Vehicles | 26 (1.4%) | 67 (4.3%) |
| Total | 1,862 (100.0%) | 1,556 (100.0%) |
Commute Time in Washington borough
The most frequently occuring commute durations in Washington borough are 5 to 9 minutes (484 commuters, 16.3%), 45 to 59 minutes (407 commuters, 13.7%), and 30 to 34 minutes (371 commuters, 12.5%).
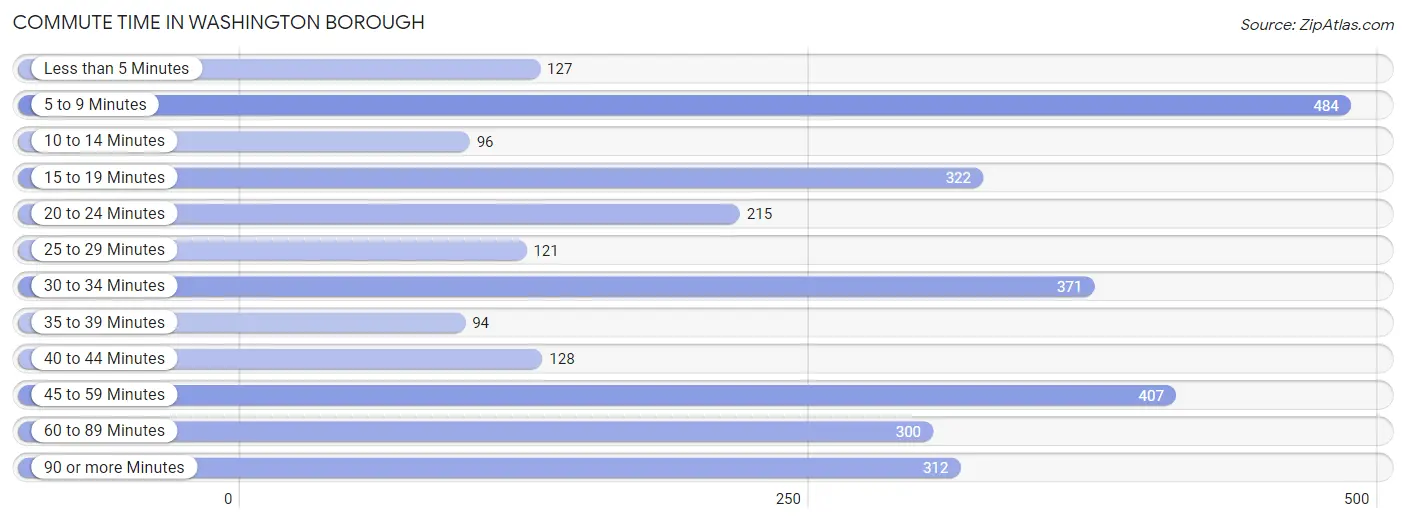
| Commute Time | # Commuters | % Commuters |
| Less than 5 Minutes | 127 | 4.3% |
| 5 to 9 Minutes | 484 | 16.3% |
| 10 to 14 Minutes | 96 | 3.2% |
| 15 to 19 Minutes | 322 | 10.8% |
| 20 to 24 Minutes | 215 | 7.2% |
| 25 to 29 Minutes | 121 | 4.1% |
| 30 to 34 Minutes | 371 | 12.5% |
| 35 to 39 Minutes | 94 | 3.2% |
| 40 to 44 Minutes | 128 | 4.3% |
| 45 to 59 Minutes | 407 | 13.7% |
| 60 to 89 Minutes | 300 | 10.1% |
| 90 or more Minutes | 312 | 10.5% |
Commute Time by Sex in Washington borough
The most common commute times in Washington borough are 60 to 89 minutes (288 commuters, 18.1%) for males and 5 to 9 minutes (252 commuters, 18.1%) for females.
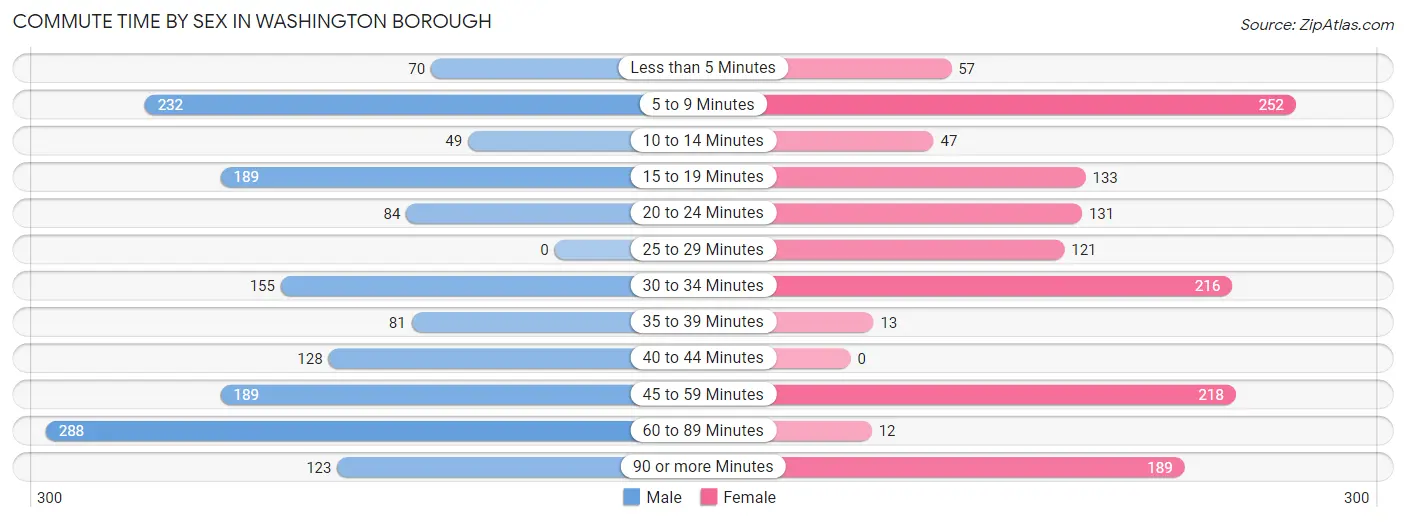
| Commute Time | Male | Female |
| Less than 5 Minutes | 70 (4.4%) | 57 (4.1%) |
| 5 to 9 Minutes | 232 (14.6%) | 252 (18.1%) |
| 10 to 14 Minutes | 49 (3.1%) | 47 (3.4%) |
| 15 to 19 Minutes | 189 (11.9%) | 133 (9.6%) |
| 20 to 24 Minutes | 84 (5.3%) | 131 (9.4%) |
| 25 to 29 Minutes | 0 (0.0%) | 121 (8.7%) |
| 30 to 34 Minutes | 155 (9.8%) | 216 (15.5%) |
| 35 to 39 Minutes | 81 (5.1%) | 13 (0.9%) |
| 40 to 44 Minutes | 128 (8.1%) | 0 (0.0%) |
| 45 to 59 Minutes | 189 (11.9%) | 218 (15.7%) |
| 60 to 89 Minutes | 288 (18.1%) | 12 (0.9%) |
| 90 or more Minutes | 123 (7.7%) | 189 (13.6%) |
Time of Departure to Work by Sex in Washington borough
The most frequent times of departure to work in Washington borough are 6:00 AM to 6:29 AM (406, 25.6%) for males and 6:00 AM to 6:29 AM (200, 14.4%) for females.
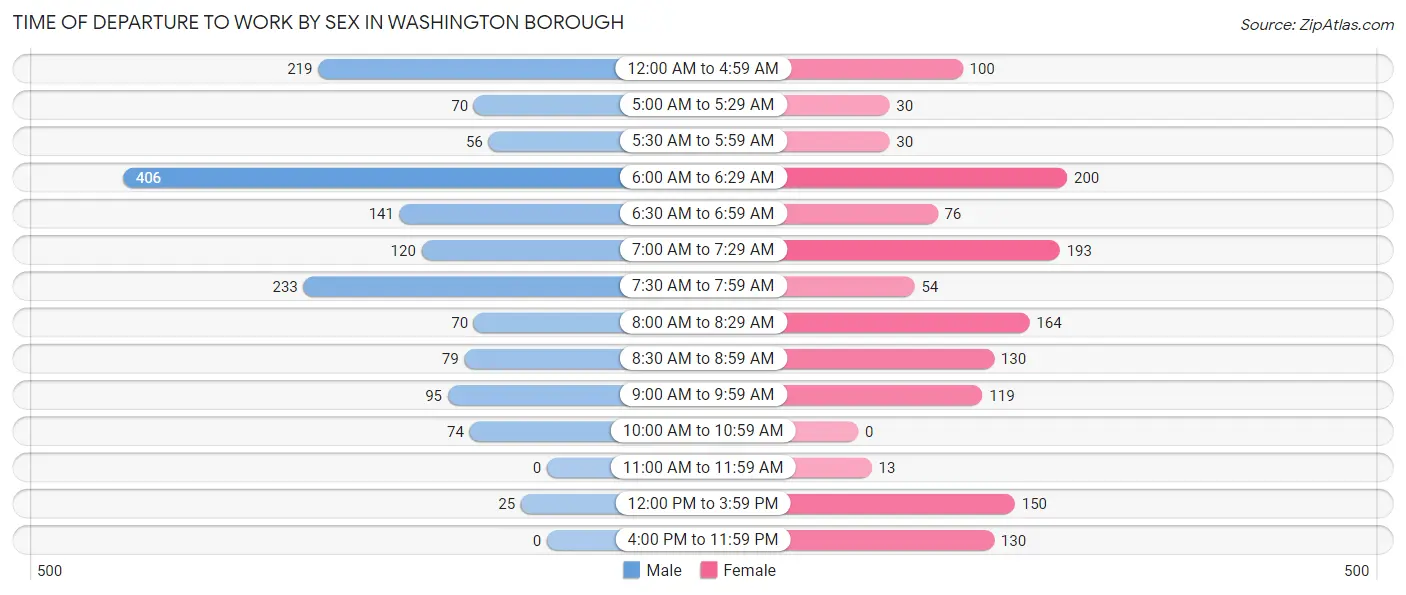
| Time of Departure | Male | Female |
| 12:00 AM to 4:59 AM | 219 (13.8%) | 100 (7.2%) |
| 5:00 AM to 5:29 AM | 70 (4.4%) | 30 (2.2%) |
| 5:30 AM to 5:59 AM | 56 (3.5%) | 30 (2.2%) |
| 6:00 AM to 6:29 AM | 406 (25.6%) | 200 (14.4%) |
| 6:30 AM to 6:59 AM | 141 (8.9%) | 76 (5.5%) |
| 7:00 AM to 7:29 AM | 120 (7.6%) | 193 (13.9%) |
| 7:30 AM to 7:59 AM | 233 (14.7%) | 54 (3.9%) |
| 8:00 AM to 8:29 AM | 70 (4.4%) | 164 (11.8%) |
| 8:30 AM to 8:59 AM | 79 (5.0%) | 130 (9.4%) |
| 9:00 AM to 9:59 AM | 95 (6.0%) | 119 (8.6%) |
| 10:00 AM to 10:59 AM | 74 (4.7%) | 0 (0.0%) |
| 11:00 AM to 11:59 AM | 0 (0.0%) | 13 (0.9%) |
| 12:00 PM to 3:59 PM | 25 (1.6%) | 150 (10.8%) |
| 4:00 PM to 11:59 PM | 0 (0.0%) | 130 (9.4%) |
| Total | 1,588 (100.0%) | 1,389 (100.0%) |
Housing Occupancy in Washington borough
Occupancy by Ownership in Washington borough
Of the total 2,991 dwellings in Washington borough, owner-occupied units account for 1,446 (48.3%), while renter-occupied units make up 1,545 (51.6%).
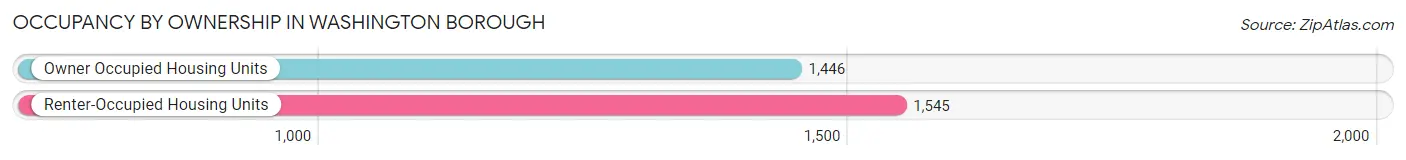
| Occupancy | # Housing Units | % Housing Units |
| Owner Occupied Housing Units | 1,446 | 48.3% |
| Renter-Occupied Housing Units | 1,545 | 51.6% |
| Total Occupied Housing Units | 2,991 | 100.0% |
Occupancy by Household Size in Washington borough
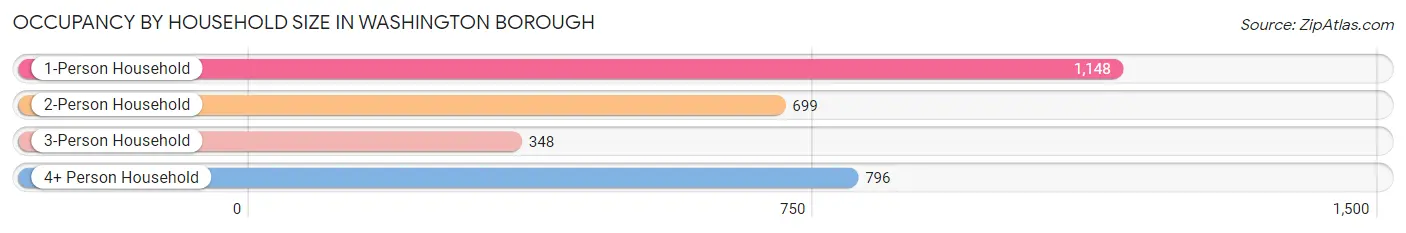
| Household Size | # Housing Units | % Housing Units |
| 1-Person Household | 1,148 | 38.4% |
| 2-Person Household | 699 | 23.4% |
| 3-Person Household | 348 | 11.6% |
| 4+ Person Household | 796 | 26.6% |
| Total Housing Units | 2,991 | 100.0% |
Occupancy by Ownership by Household Size in Washington borough
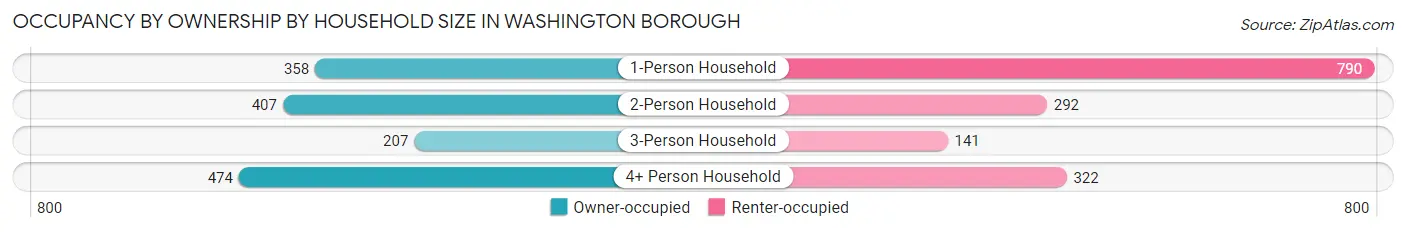
| Household Size | Owner-occupied | Renter-occupied |
| 1-Person Household | 358 (31.2%) | 790 (68.8%) |
| 2-Person Household | 407 (58.2%) | 292 (41.8%) |
| 3-Person Household | 207 (59.5%) | 141 (40.5%) |
| 4+ Person Household | 474 (59.6%) | 322 (40.5%) |
| Total Housing Units | 1,446 (48.3%) | 1,545 (51.6%) |
Occupancy by Educational Attainment in Washington borough
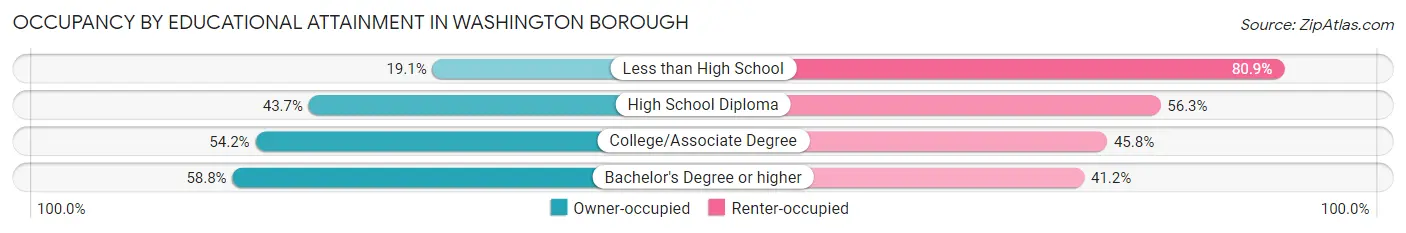
| Household Size | Owner-occupied | Renter-occupied |
| Less than High School | 44 (19.1%) | 186 (80.9%) |
| High School Diploma | 541 (43.7%) | 698 (56.3%) |
| College/Associate Degree | 403 (54.2%) | 340 (45.8%) |
| Bachelor's Degree or higher | 458 (58.8%) | 321 (41.2%) |
Occupancy by Age of Householder in Washington borough
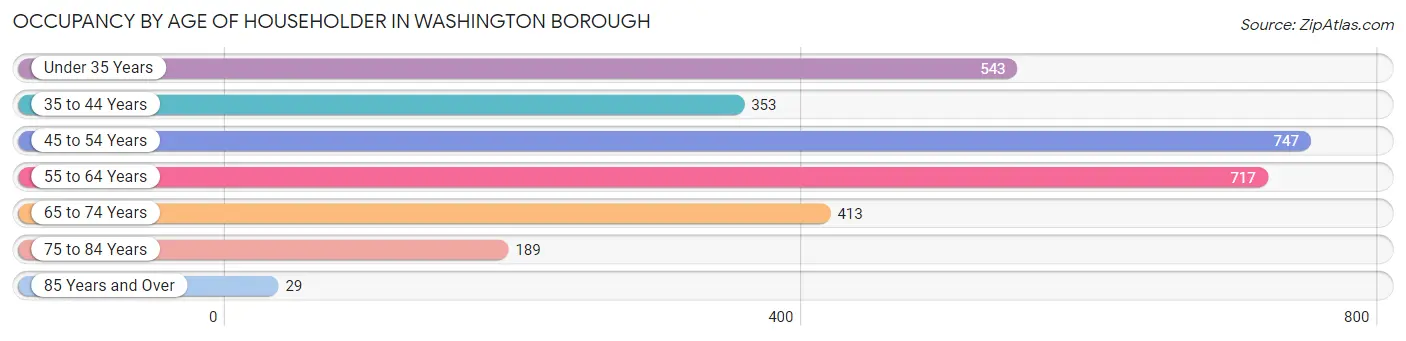
| Age Bracket | # Households | % Households |
| Under 35 Years | 543 | 18.1% |
| 35 to 44 Years | 353 | 11.8% |
| 45 to 54 Years | 747 | 25.0% |
| 55 to 64 Years | 717 | 24.0% |
| 65 to 74 Years | 413 | 13.8% |
| 75 to 84 Years | 189 | 6.3% |
| 85 Years and Over | 29 | 1.0% |
| Total | 2,991 | 100.0% |
Housing Finances in Washington borough
Median Income by Occupancy in Washington borough
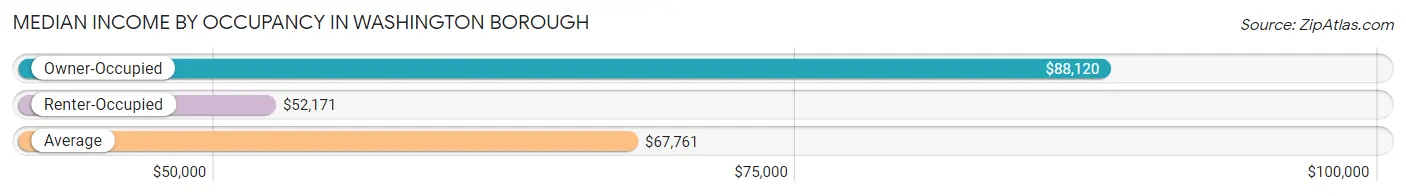
| Occupancy Type | # Households | Median Income |
| Owner-Occupied | 1,446 (48.3%) | $88,120 |
| Renter-Occupied | 1,545 (51.6%) | $52,171 |
| Average | 2,991 (100.0%) | $67,761 |
Occupancy by Householder Income Bracket in Washington borough

| Income Bracket | Owner-occupied | Renter-occupied |
| Less than $5,000 | 0 (0.0%) | 138 (8.9%) |
| $5,000 to $9,999 | 24 (1.7%) | 72 (4.7%) |
| $10,000 to $14,999 | 0 (0.0%) | 82 (5.3%) |
| $15,000 to $19,999 | 22 (1.5%) | 129 (8.4%) |
| $20,000 to $24,999 | 0 (0.0%) | 109 (7.1%) |
| $25,000 to $34,999 | 87 (6.0%) | 112 (7.2%) |
| $35,000 to $49,999 | 142 (9.8%) | 81 (5.2%) |
| $50,000 to $74,999 | 323 (22.3%) | 277 (17.9%) |
| $75,000 to $99,999 | 297 (20.5%) | 274 (17.7%) |
| $100,000 to $149,999 | 223 (15.4%) | 271 (17.5%) |
| $150,000 or more | 328 (22.7%) | 0 (0.0%) |
| Total | 1,446 (100.0%) | 1,545 (100.0%) |
Monthly Housing Cost Tiers in Washington borough
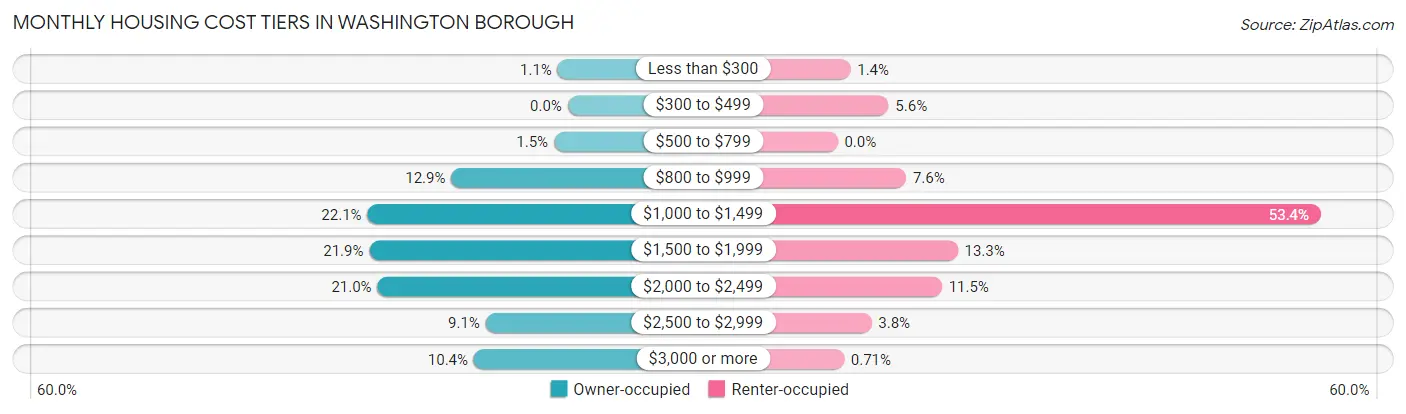
| Monthly Cost | Owner-occupied | Renter-occupied |
| Less than $300 | 16 (1.1%) | 22 (1.4%) |
| $300 to $499 | 0 (0.0%) | 87 (5.6%) |
| $500 to $799 | 22 (1.5%) | 0 (0.0%) |
| $800 to $999 | 186 (12.9%) | 117 (7.6%) |
| $1,000 to $1,499 | 320 (22.1%) | 825 (53.4%) |
| $1,500 to $1,999 | 317 (21.9%) | 205 (13.3%) |
| $2,000 to $2,499 | 304 (21.0%) | 178 (11.5%) |
| $2,500 to $2,999 | 131 (9.1%) | 58 (3.7%) |
| $3,000 or more | 150 (10.4%) | 11 (0.7%) |
| Total | 1,446 (100.0%) | 1,545 (100.0%) |
Physical Housing Characteristics in Washington borough
Housing Structures in Washington borough
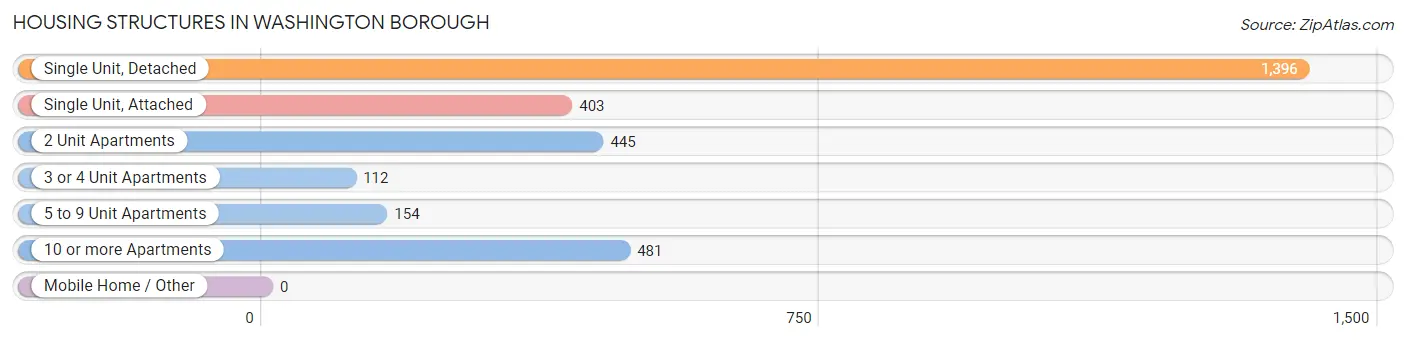
| Structure Type | # Housing Units | % Housing Units |
| Single Unit, Detached | 1,396 | 46.7% |
| Single Unit, Attached | 403 | 13.5% |
| 2 Unit Apartments | 445 | 14.9% |
| 3 or 4 Unit Apartments | 112 | 3.7% |
| 5 to 9 Unit Apartments | 154 | 5.1% |
| 10 or more Apartments | 481 | 16.1% |
| Mobile Home / Other | 0 | 0.0% |
| Total | 2,991 | 100.0% |
Housing Structures by Occupancy in Washington borough
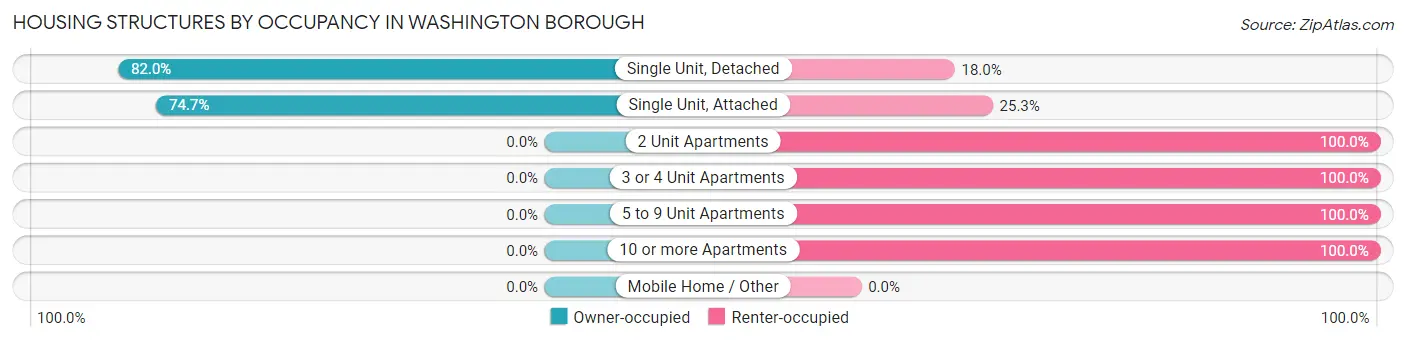
| Structure Type | Owner-occupied | Renter-occupied |
| Single Unit, Detached | 1,145 (82.0%) | 251 (18.0%) |
| Single Unit, Attached | 301 (74.7%) | 102 (25.3%) |
| 2 Unit Apartments | 0 (0.0%) | 445 (100.0%) |
| 3 or 4 Unit Apartments | 0 (0.0%) | 112 (100.0%) |
| 5 to 9 Unit Apartments | 0 (0.0%) | 154 (100.0%) |
| 10 or more Apartments | 0 (0.0%) | 481 (100.0%) |
| Mobile Home / Other | 0 (0.0%) | 0 (0.0%) |
| Total | 1,446 (48.3%) | 1,545 (51.6%) |
Housing Structures by Number of Rooms in Washington borough
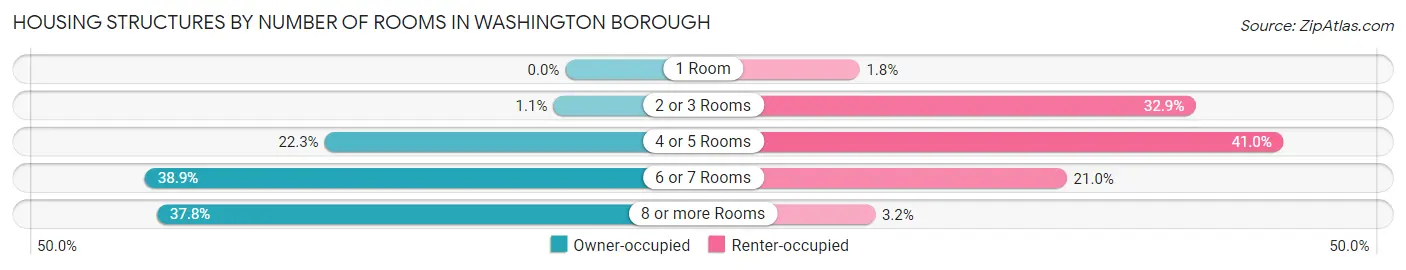
| Number of Rooms | Owner-occupied | Renter-occupied |
| 1 Room | 0 (0.0%) | 28 (1.8%) |
| 2 or 3 Rooms | 16 (1.1%) | 509 (32.9%) |
| 4 or 5 Rooms | 322 (22.3%) | 634 (41.0%) |
| 6 or 7 Rooms | 562 (38.9%) | 324 (21.0%) |
| 8 or more Rooms | 546 (37.8%) | 50 (3.2%) |
| Total | 1,446 (100.0%) | 1,545 (100.0%) |
Housing Structure by Heating Type in Washington borough
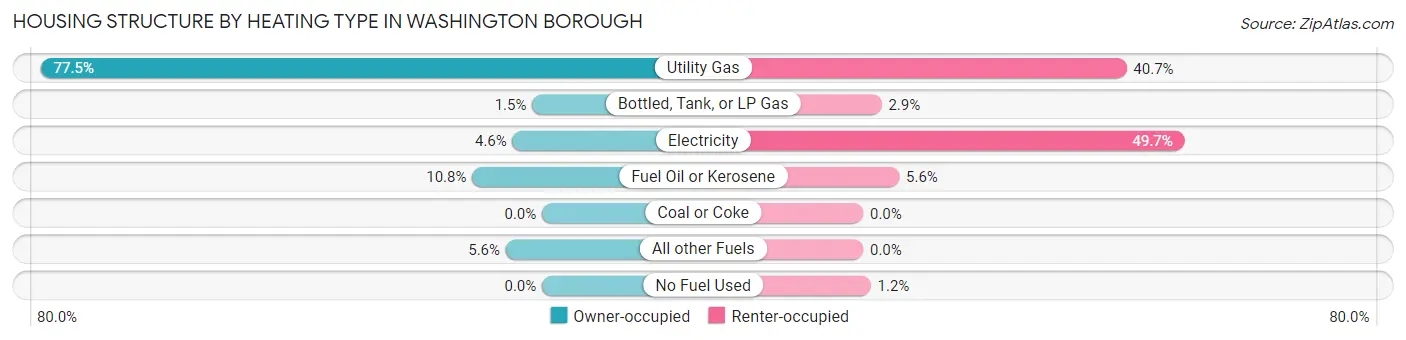
| Heating Type | Owner-occupied | Renter-occupied |
| Utility Gas | 1,121 (77.5%) | 629 (40.7%) |
| Bottled, Tank, or LP Gas | 22 (1.5%) | 44 (2.9%) |
| Electricity | 66 (4.6%) | 768 (49.7%) |
| Fuel Oil or Kerosene | 156 (10.8%) | 86 (5.6%) |
| Coal or Coke | 0 (0.0%) | 0 (0.0%) |
| All other Fuels | 81 (5.6%) | 0 (0.0%) |
| No Fuel Used | 0 (0.0%) | 18 (1.2%) |
| Total | 1,446 (100.0%) | 1,545 (100.0%) |
Household Vehicle Usage in Washington borough
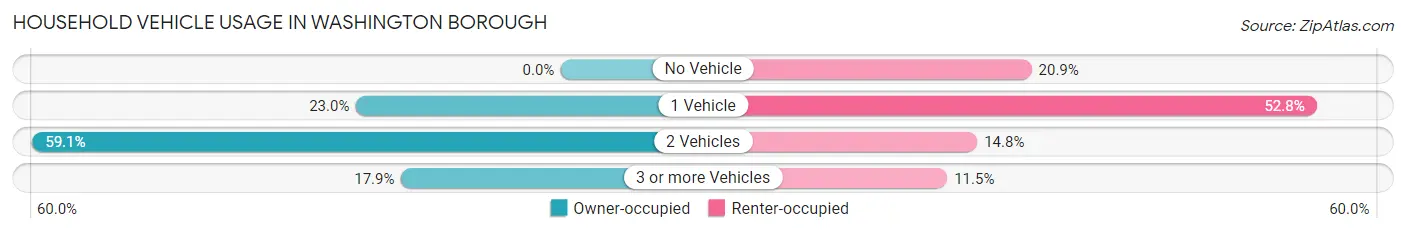
| Vehicles per Household | Owner-occupied | Renter-occupied |
| No Vehicle | 0 (0.0%) | 323 (20.9%) |
| 1 Vehicle | 332 (23.0%) | 816 (52.8%) |
| 2 Vehicles | 855 (59.1%) | 229 (14.8%) |
| 3 or more Vehicles | 259 (17.9%) | 177 (11.5%) |
| Total | 1,446 (100.0%) | 1,545 (100.0%) |
Real Estate & Mortgages in Washington borough
Real Estate and Mortgage Overview in Washington borough
| Characteristic | Without Mortgage | With Mortgage |
| Housing Units | 333 | 1,113 |
| Median Property Value | $193,700 | $222,400 |
| Median Household Income | $68,942 | $274 |
| Monthly Housing Costs | $986 | $150 |
| Real Estate Taxes | $7,687 | $12 |
Property Value by Mortgage Status in Washington borough
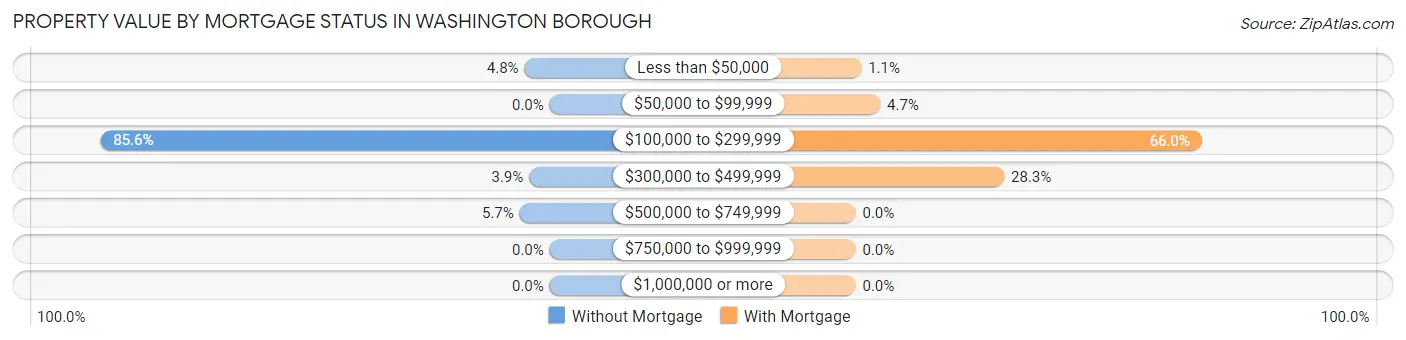
| Property Value | Without Mortgage | With Mortgage |
| Less than $50,000 | 16 (4.8%) | 12 (1.1%) |
| $50,000 to $99,999 | 0 (0.0%) | 52 (4.7%) |
| $100,000 to $299,999 | 285 (85.6%) | 734 (65.9%) |
| $300,000 to $499,999 | 13 (3.9%) | 315 (28.3%) |
| $500,000 to $749,999 | 19 (5.7%) | 0 (0.0%) |
| $750,000 to $999,999 | 0 (0.0%) | 0 (0.0%) |
| $1,000,000 or more | 0 (0.0%) | 0 (0.0%) |
| Total | 333 (100.0%) | 1,113 (100.0%) |
Household Income by Mortgage Status in Washington borough
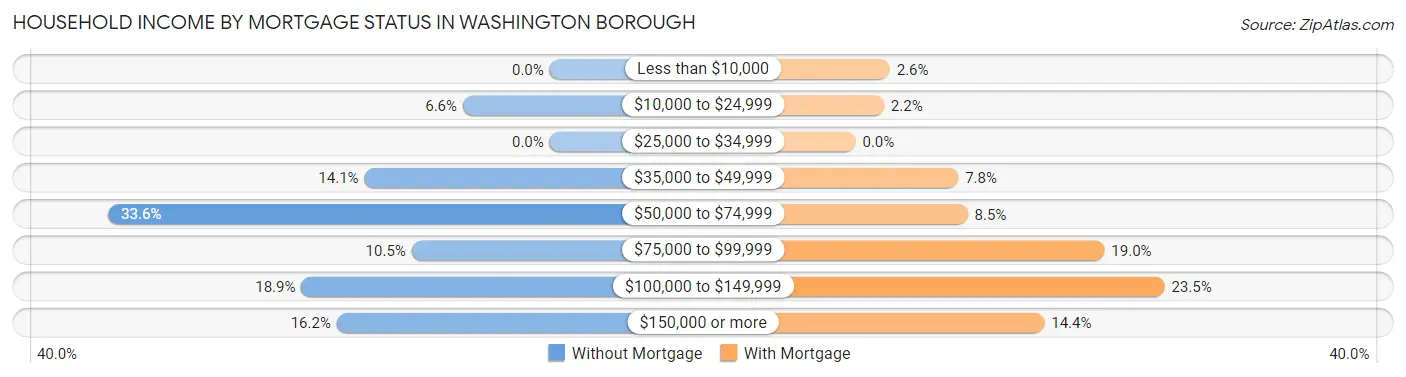
| Household Income | Without Mortgage | With Mortgage |
| Less than $10,000 | 0 (0.0%) | 29 (2.6%) |
| $10,000 to $24,999 | 22 (6.6%) | 24 (2.2%) |
| $25,000 to $34,999 | 0 (0.0%) | 0 (0.0%) |
| $35,000 to $49,999 | 47 (14.1%) | 87 (7.8%) |
| $50,000 to $74,999 | 112 (33.6%) | 95 (8.5%) |
| $75,000 to $99,999 | 35 (10.5%) | 211 (19.0%) |
| $100,000 to $149,999 | 63 (18.9%) | 262 (23.5%) |
| $150,000 or more | 54 (16.2%) | 160 (14.4%) |
| Total | 333 (100.0%) | 1,113 (100.0%) |
Property Value to Household Income Ratio in Washington borough
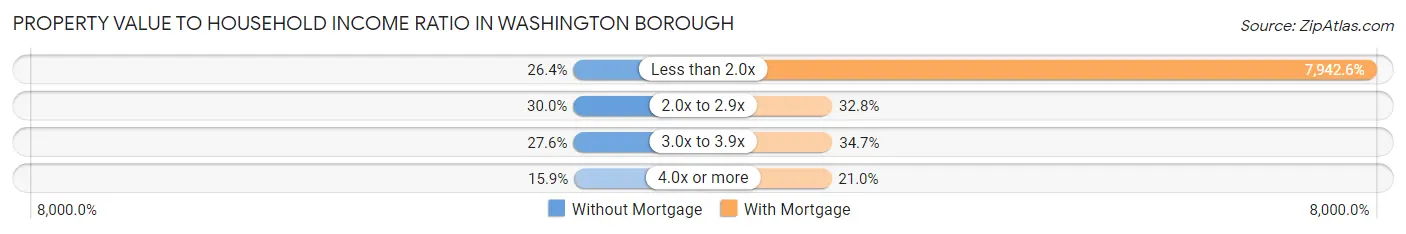
| Value-to-Income Ratio | Without Mortgage | With Mortgage |
| Less than 2.0x | 88 (26.4%) | 88,401 (7,942.6%) |
| 2.0x to 2.9x | 100 (30.0%) | 365 (32.8%) |
| 3.0x to 3.9x | 92 (27.6%) | 386 (34.7%) |
| 4.0x or more | 53 (15.9%) | 234 (21.0%) |
| Total | 333 (100.0%) | 1,113 (100.0%) |
Real Estate Taxes by Mortgage Status in Washington borough
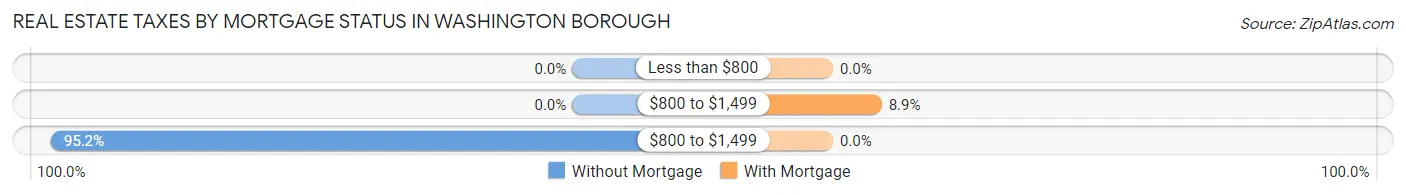
| Property Taxes | Without Mortgage | With Mortgage |
| Less than $800 | 0 (0.0%) | 0 (0.0%) |
| $800 to $1,499 | 0 (0.0%) | 99 (8.9%) |
| $800 to $1,499 | 317 (95.2%) | 0 (0.0%) |
| Total | 333 (100.0%) | 1,113 (100.0%) |
Health & Disability in Washington borough
Health Insurance Coverage by Age in Washington borough
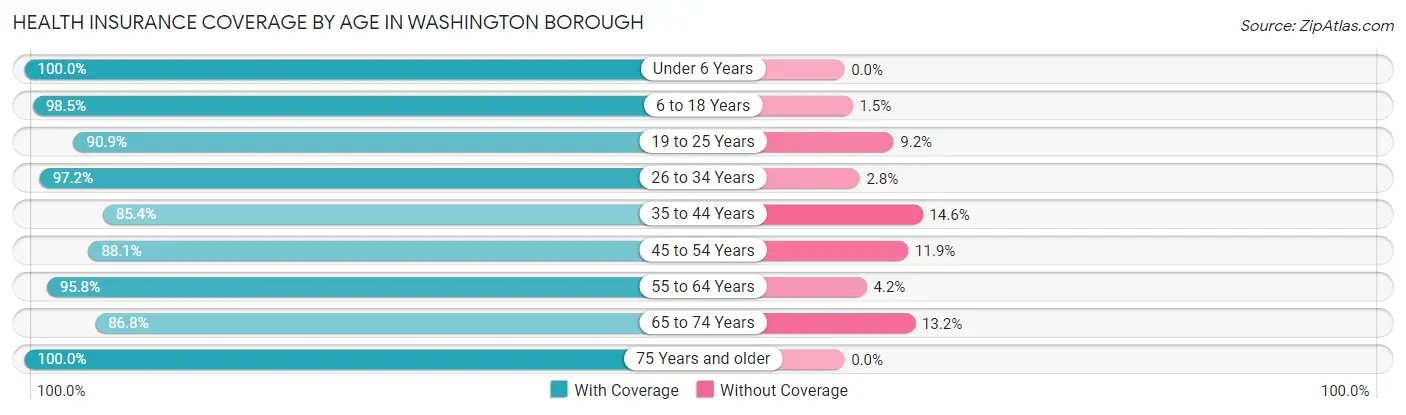
| Age Bracket | With Coverage | Without Coverage |
| Under 6 Years | 398 (100.0%) | 0 (0.0%) |
| 6 to 18 Years | 1,486 (98.5%) | 23 (1.5%) |
| 19 to 25 Years | 516 (90.8%) | 52 (9.1%) |
| 26 to 34 Years | 859 (97.2%) | 25 (2.8%) |
| 35 to 44 Years | 715 (85.4%) | 122 (14.6%) |
| 45 to 54 Years | 932 (88.1%) | 126 (11.9%) |
| 55 to 64 Years | 968 (95.8%) | 42 (4.2%) |
| 65 to 74 Years | 540 (86.8%) | 82 (13.2%) |
| 75 Years and older | 354 (100.0%) | 0 (0.0%) |
| Total | 6,768 (93.5%) | 472 (6.5%) |
Health Insurance Coverage by Citizenship Status in Washington borough
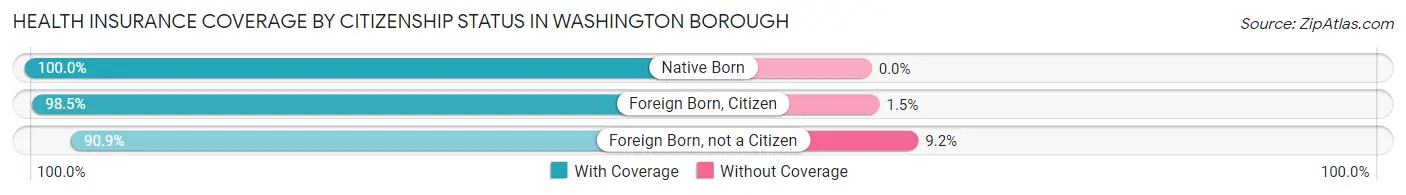
| Citizenship Status | With Coverage | Without Coverage |
| Native Born | 398 (100.0%) | 0 (0.0%) |
| Foreign Born, Citizen | 1,486 (98.5%) | 23 (1.5%) |
| Foreign Born, not a Citizen | 516 (90.8%) | 52 (9.1%) |
Health Insurance Coverage by Household Income in Washington borough
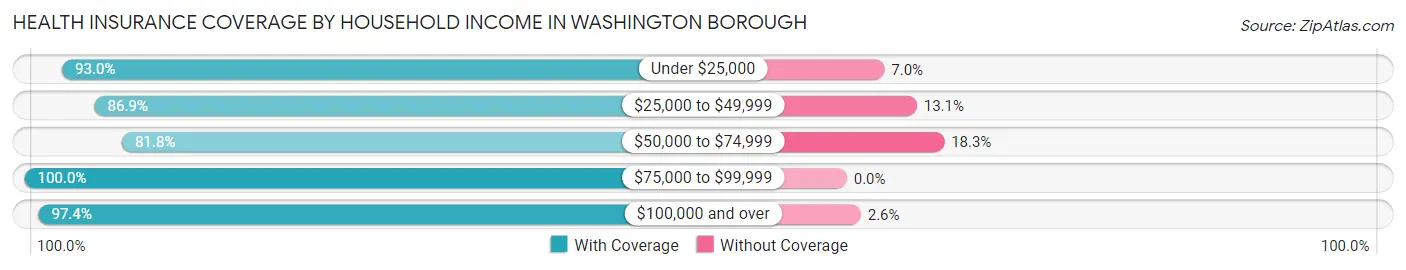
| Household Income | With Coverage | Without Coverage |
| Under $25,000 | 819 (93.0%) | 62 (7.0%) |
| $25,000 to $49,999 | 649 (86.9%) | 98 (13.1%) |
| $50,000 to $74,999 | 1,053 (81.8%) | 235 (18.2%) |
| $75,000 to $99,999 | 1,459 (100.0%) | 0 (0.0%) |
| $100,000 and over | 2,754 (97.4%) | 74 (2.6%) |
Public vs Private Health Insurance Coverage by Age in Washington borough
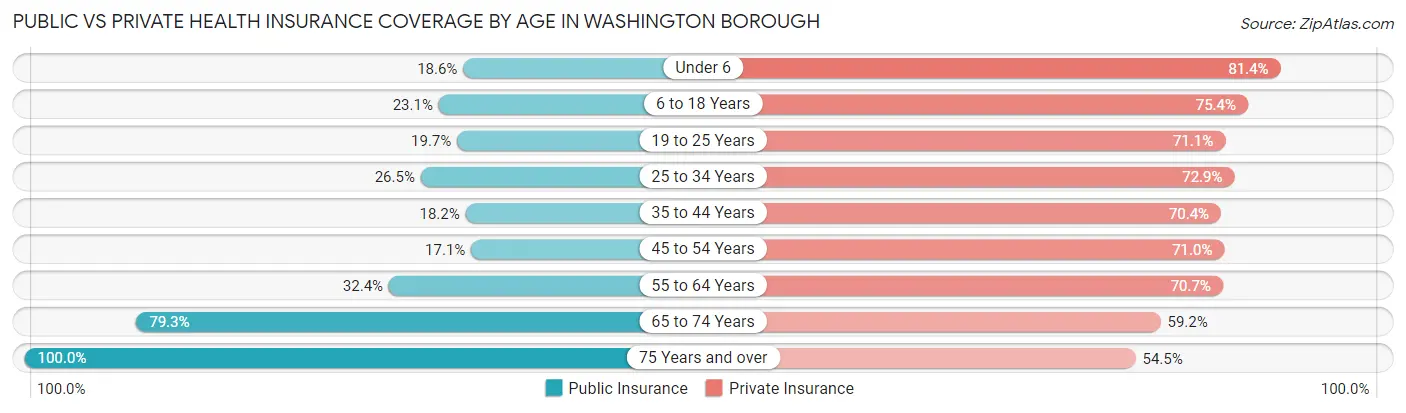
| Age Bracket | Public Insurance | Private Insurance |
| Under 6 | 74 (18.6%) | 324 (81.4%) |
| 6 to 18 Years | 349 (23.1%) | 1,137 (75.3%) |
| 19 to 25 Years | 112 (19.7%) | 404 (71.1%) |
| 25 to 34 Years | 234 (26.5%) | 644 (72.9%) |
| 35 to 44 Years | 152 (18.2%) | 589 (70.4%) |
| 45 to 54 Years | 181 (17.1%) | 751 (71.0%) |
| 55 to 64 Years | 327 (32.4%) | 714 (70.7%) |
| 65 to 74 Years | 493 (79.3%) | 368 (59.2%) |
| 75 Years and over | 354 (100.0%) | 193 (54.5%) |
| Total | 2,276 (31.4%) | 5,124 (70.8%) |
Disability Status by Sex by Age in Washington borough
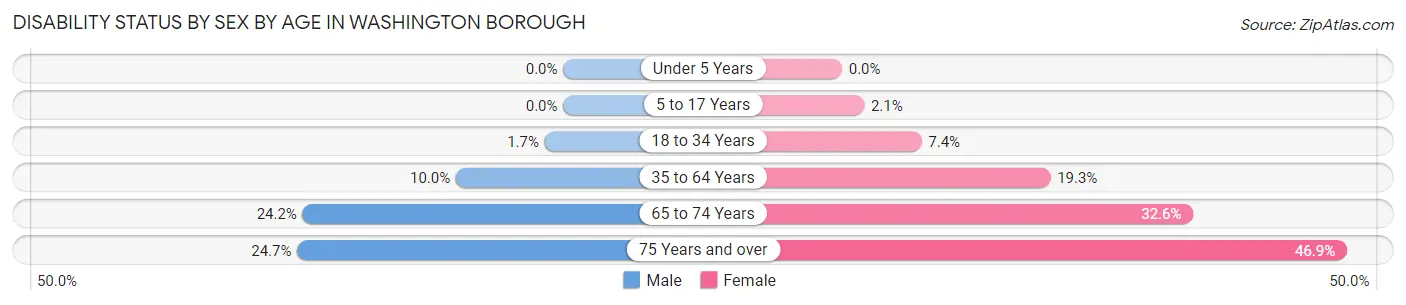
| Age Bracket | Male | Female |
| Under 5 Years | 0 (0.0%) | 0 (0.0%) |
| 5 to 17 Years | 0 (0.0%) | 14 (2.1%) |
| 18 to 34 Years | 16 (1.7%) | 45 (7.4%) |
| 35 to 64 Years | 138 (10.0%) | 294 (19.3%) |
| 65 to 74 Years | 60 (24.2%) | 122 (32.6%) |
| 75 Years and over | 20 (24.7%) | 128 (46.9%) |
Disability Class by Sex by Age in Washington borough
Disability Class: Hearing Difficulty
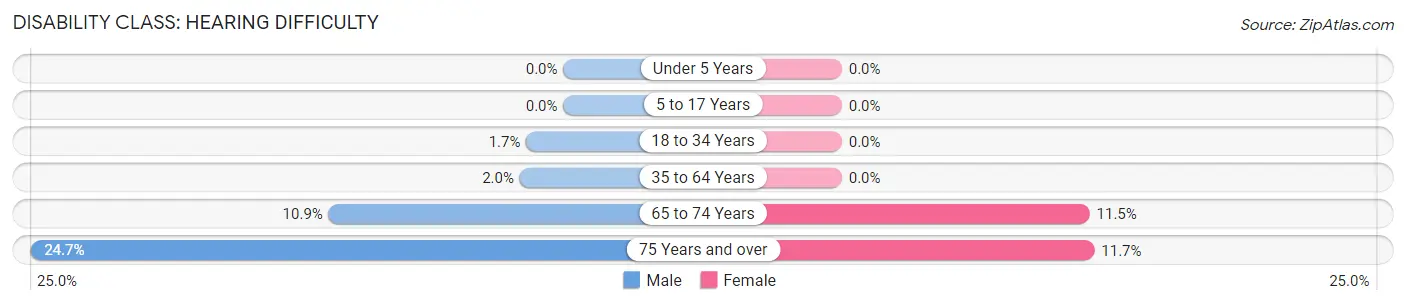
| Age Bracket | Male | Female |
| Under 5 Years | 0 (0.0%) | 0 (0.0%) |
| 5 to 17 Years | 0 (0.0%) | 0 (0.0%) |
| 18 to 34 Years | 16 (1.7%) | 0 (0.0%) |
| 35 to 64 Years | 28 (2.0%) | 0 (0.0%) |
| 65 to 74 Years | 27 (10.9%) | 43 (11.5%) |
| 75 Years and over | 20 (24.7%) | 32 (11.7%) |
Disability Class: Vision Difficulty

| Age Bracket | Male | Female |
| Under 5 Years | 0 (0.0%) | 0 (0.0%) |
| 5 to 17 Years | 0 (0.0%) | 0 (0.0%) |
| 18 to 34 Years | 16 (1.7%) | 19 (3.1%) |
| 35 to 64 Years | 28 (2.0%) | 37 (2.4%) |
| 65 to 74 Years | 0 (0.0%) | 22 (5.9%) |
| 75 Years and over | 0 (0.0%) | 0 (0.0%) |
Disability Class: Cognitive Difficulty
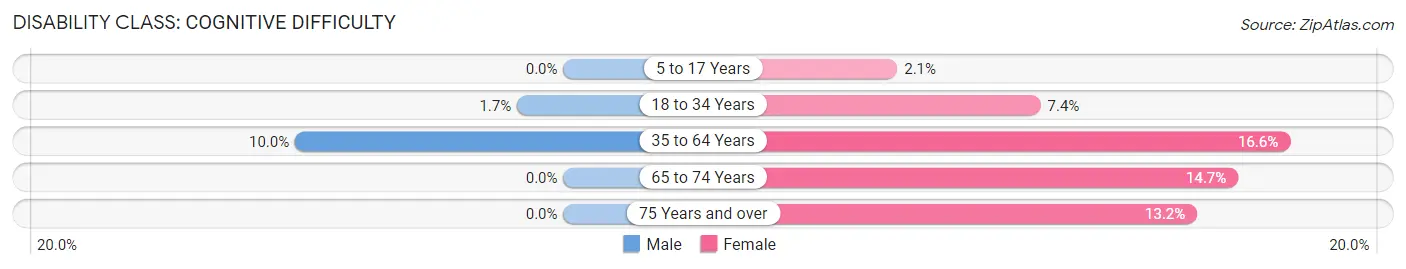
| Age Bracket | Male | Female |
| 5 to 17 Years | 0 (0.0%) | 14 (2.1%) |
| 18 to 34 Years | 16 (1.7%) | 45 (7.4%) |
| 35 to 64 Years | 138 (10.0%) | 253 (16.6%) |
| 65 to 74 Years | 0 (0.0%) | 55 (14.7%) |
| 75 Years and over | 0 (0.0%) | 36 (13.2%) |
Disability Class: Ambulatory Difficulty
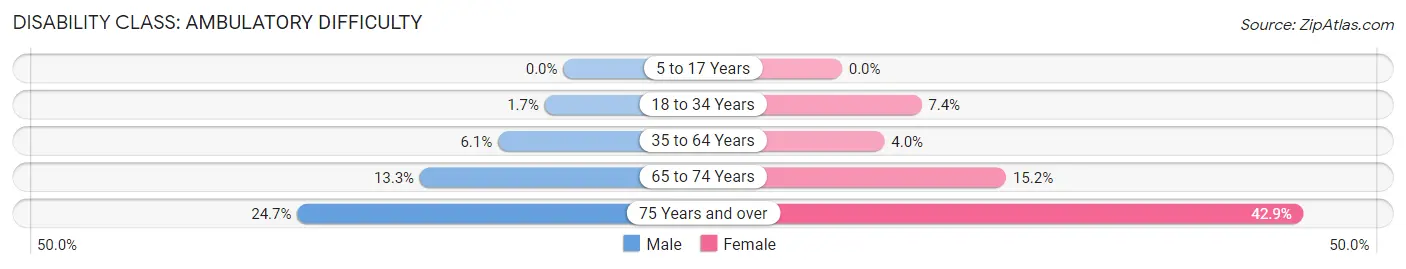
| Age Bracket | Male | Female |
| 5 to 17 Years | 0 (0.0%) | 0 (0.0%) |
| 18 to 34 Years | 16 (1.7%) | 45 (7.4%) |
| 35 to 64 Years | 84 (6.1%) | 60 (4.0%) |
| 65 to 74 Years | 33 (13.3%) | 57 (15.2%) |
| 75 Years and over | 20 (24.7%) | 117 (42.9%) |
Disability Class: Self-Care Difficulty
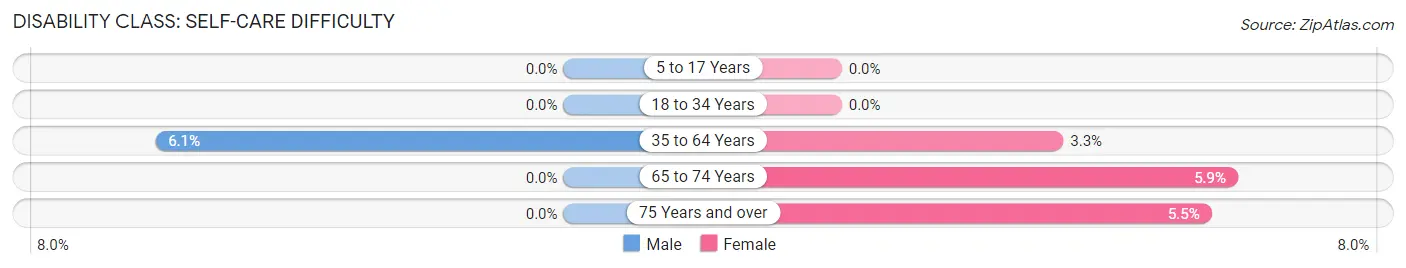
| Age Bracket | Male | Female |
| 5 to 17 Years | 0 (0.0%) | 0 (0.0%) |
| 18 to 34 Years | 0 (0.0%) | 0 (0.0%) |
| 35 to 64 Years | 84 (6.1%) | 50 (3.3%) |
| 65 to 74 Years | 0 (0.0%) | 22 (5.9%) |
| 75 Years and over | 0 (0.0%) | 15 (5.5%) |
Technology Access in Washington borough
Computing Device Access in Washington borough
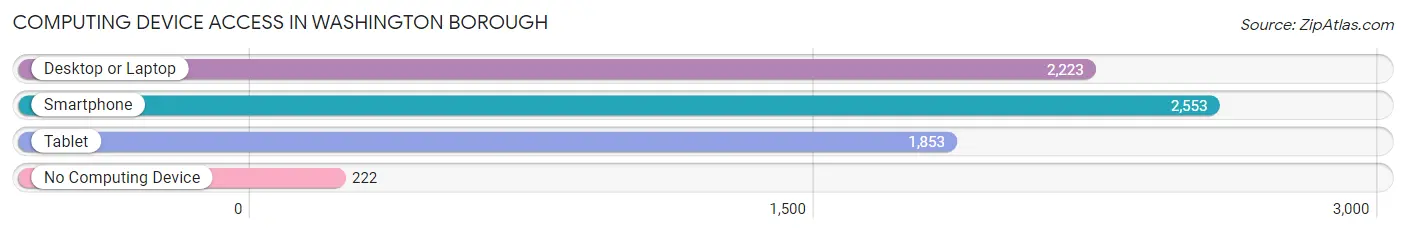
| Device Type | # Households | % Households |
| Desktop or Laptop | 2,223 | 74.3% |
| Smartphone | 2,553 | 85.4% |
| Tablet | 1,853 | 62.0% |
| No Computing Device | 222 | 7.4% |
| Total | 2,991 | 100.0% |
Internet Access in Washington borough
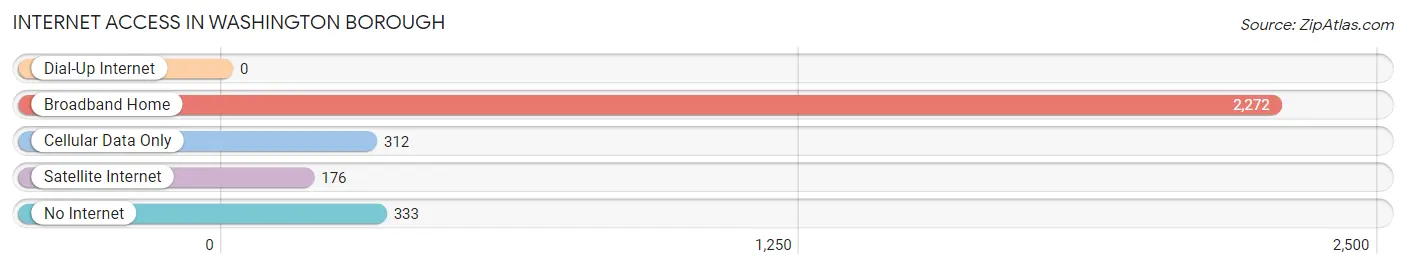
| Internet Type | # Households | % Households |
| Dial-Up Internet | 0 | 0.0% |
| Broadband Home | 2,272 | 76.0% |
| Cellular Data Only | 312 | 10.4% |
| Satellite Internet | 176 | 5.9% |
| No Internet | 333 | 11.1% |
| Total | 2,991 | 100.0% |
Washington borough Summary
History
Washington Borough is a small borough located in Warren County, New Jersey. It was incorporated in 1868 and is the oldest borough in the county. The area was first settled in the late 1700s by a group of German immigrants who were looking for a place to call home. The town was originally known as “New Germantown” and was later changed to “Washington” in honor of George Washington.
The town was a rural farming community for many years, but in the late 1800s, the town began to grow and develop. The first industry to come to the area was a silk mill, which was built in 1872. This was followed by a paper mill, a brickyard, and a sawmill. These industries helped to bring more people to the area and the population began to grow.
In the early 1900s, the town began to expand and more businesses began to open. The first bank was established in 1906 and the first post office opened in 1907. The town also had a movie theater, a hotel, and a variety of stores.
The town continued to grow and develop throughout the 20th century. In the 1950s, the town was home to a variety of industries, including a steel mill, a chemical plant, and a paper mill. The town also had a variety of stores, restaurants, and other businesses.
Geography
Washington Borough is located in Warren County, New Jersey. It is situated in the northwest corner of the county, near the border of Pennsylvania. The borough is bordered by the towns of Oxford, White Township, and Harmony Township.
The borough covers an area of 1.3 square miles and is home to a population of approximately 2,500 people. The town is located in a rural area and is surrounded by farmland and forests. The town is located at an elevation of approximately 500 feet above sea level.
Economy
Washington Borough is a small, rural community with a population of approximately 2,500 people. The town is home to a variety of businesses, including a bank, a post office, a variety of stores, and a few restaurants. The town also has a few small manufacturing businesses, including a paper mill and a steel mill.
The town is also home to a few small farms, which produce a variety of crops, including corn, soybeans, and hay. The town also has a few small businesses, such as a hardware store and a few auto repair shops.
Demographics
As of the 2010 census, the population of Washington Borough was 2,521. The racial makeup of the town was 94.3% White, 2.2% African American, 0.3% Native American, 0.7% Asian, 0.1% Pacific Islander, and 2.4% from other races. Hispanic or Latino of any race were 4.2% of the population.
The median household income in the town was $50,972 and the median family income was $60,972. The per capita income in the town was $25,972. About 8.3% of families and 10.2% of the population were below the poverty line, including 14.2% of those under age 18 and 6.2% of those age 65 or over.
Common Questions
What is Per Capita Income in Washington borough?
Per Capita income in Washington borough is $34,521.
What is the Median Family Income in Washington borough?
Median Family Income in Washington borough is $87,159.
What is the Median Household income in Washington borough?
Median Household Income in Washington borough is $67,761.
What is Income or Wage Gap in Washington borough?
Income or Wage Gap in Washington borough is 46.2%.
Women in Washington borough earn 53.8 cents for every dollar earned by a man.
What is Inequality or Gini Index in Washington borough?
Inequality or Gini Index in Washington borough is 0.44.
What is the Total Population of Washington borough?
Total Population of Washington borough is 7,240.
What is the Total Male Population of Washington borough?
Total Male Population of Washington borough is 3,524.
What is the Total Female Population of Washington borough?
Total Female Population of Washington borough is 3,716.
What is the Ratio of Males per 100 Females in Washington borough?
There are 94.83 Males per 100 Females in Washington borough.
What is the Ratio of Females per 100 Males in Washington borough?
There are 105.45 Females per 100 Males in Washington borough.
What is the Median Population Age in Washington borough?
Median Population Age in Washington borough is 38.8 Years.
What is the Average Family Size in Washington borough
Average Family Size in Washington borough is 3.3 People.
What is the Average Household Size in Washington borough
Average Household Size in Washington borough is 2.4 People.
How Large is the Labor Force in Washington borough?
There are 3,829 People in the Labor Forcein in Washington borough.
What is the Percentage of People in the Labor Force in Washington borough?
67.0% of People are in the Labor Force in Washington borough.
What is the Unemployment Rate in Washington borough?
Unemployment Rate in Washington borough is 5.4%.