Butler borough, NJ Map & Demographics
Butler borough Overview
$52,221
PER CAPITA INCOME
$134,432
AVG FAMILY INCOME
$108,378
AVG HOUSEHOLD INCOME
15.4%
WAGE / INCOME GAP [ % ]
84.6¢/ $1
WAGE / INCOME GAP [ $ ]
0.36
INEQUALITY / GINI INDEX
8,045
TOTAL POPULATION
4,077
MALE POPULATION
3,968
FEMALE POPULATION
102.75
MALES / 100 FEMALES
97.33
FEMALES / 100 MALES
43.9
MEDIAN AGE
2.8
AVG FAMILY SIZE
2.3
AVG HOUSEHOLD SIZE
5,010
LABOR FORCE [ PEOPLE ]
72.0%
PERCENT IN LABOR FORCE
4.5%
UNEMPLOYMENT RATE
Income in Butler borough
Income Overview in Butler borough
Per Capita Income in Butler borough is $52,221, while median incomes of families and households are $134,432 and $108,378 respectively.
| Characteristic | Number | Measure |
| Per Capita Income | 8,045 | $52,221 |
| Median Family Income | 2,121 | $134,432 |
| Mean Family Income | 2,121 | $141,748 |
| Median Household Income | 3,482 | $108,378 |
| Mean Household Income | 3,482 | $118,543 |
| Income Deficit | 2,121 | $0 |
| Wage / Income Gap (%) | 8,045 | 15.41% |
| Wage / Income Gap ($) | 8,045 | 84.59¢ per $1 |
| Gini / Inequality Index | 8,045 | 0.36 |
Earnings by Sex in Butler borough
Average Earnings in Butler borough are $62,170, $68,359 for men and $57,825 for women, a difference of 15.4%.
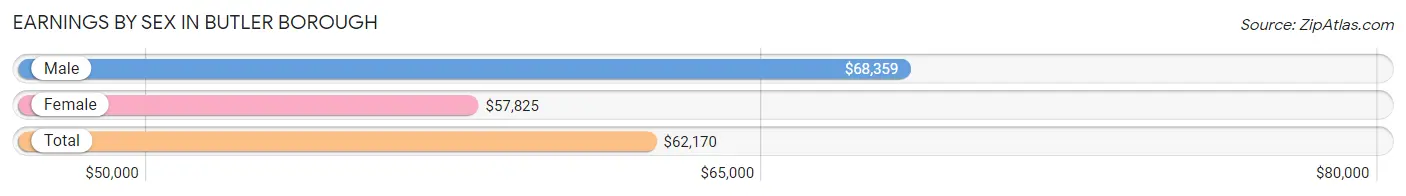
| Sex | Number | Average Earnings |
| Male | 2,741 (53.5%) | $68,359 |
| Female | 2,378 (46.5%) | $57,825 |
| Total | 5,119 (100.0%) | $62,170 |
Earnings by Sex by Income Bracket in Butler borough
The most common earnings brackets in Butler borough are $100,000+ for men (756 | 27.6%) and $100,000+ for women (499 | 21.0%).
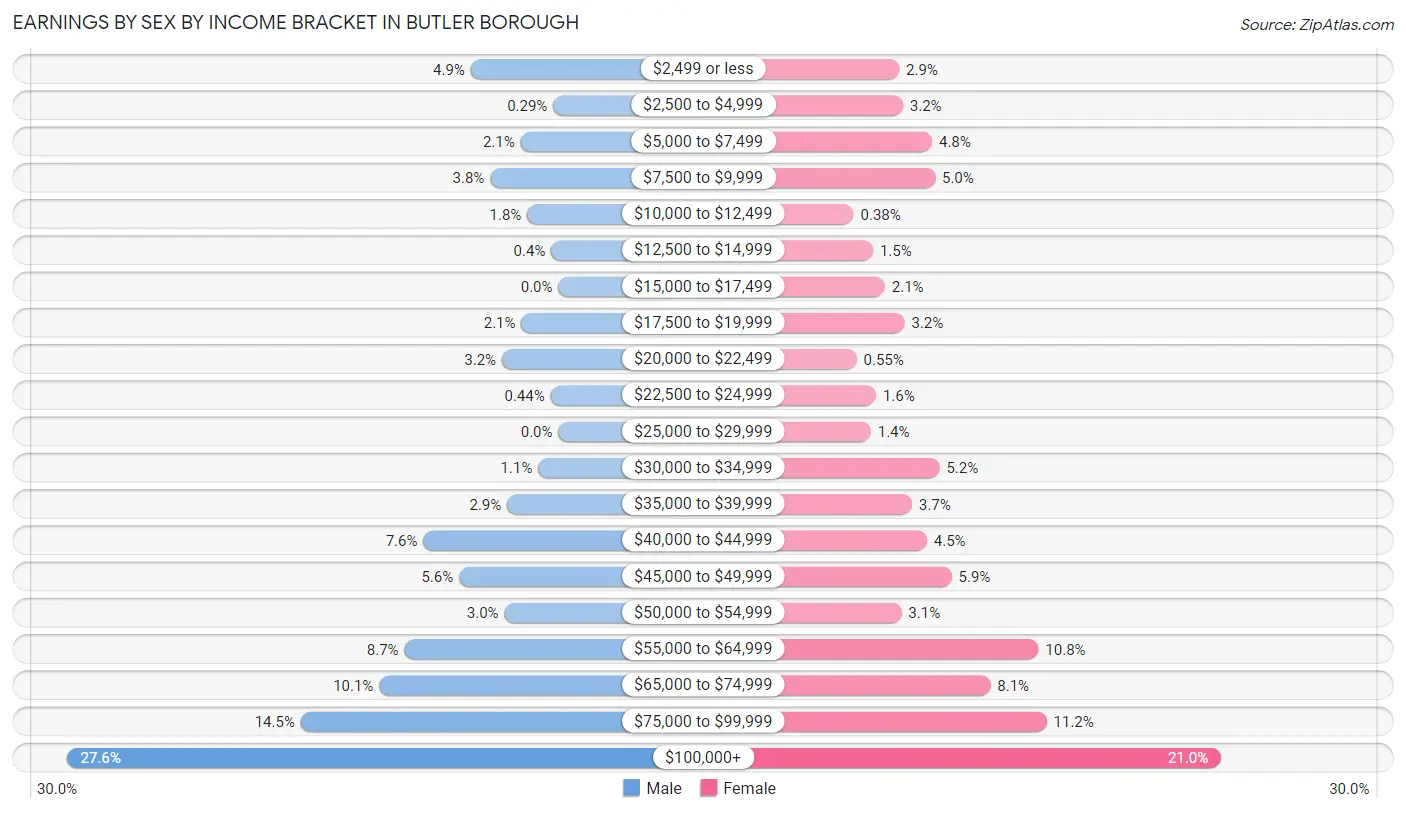
| Income | Male | Female |
| $2,499 or less | 135 (4.9%) | 70 (2.9%) |
| $2,500 to $4,999 | 8 (0.3%) | 75 (3.2%) |
| $5,000 to $7,499 | 58 (2.1%) | 114 (4.8%) |
| $7,500 to $9,999 | 105 (3.8%) | 118 (5.0%) |
| $10,000 to $12,499 | 48 (1.8%) | 9 (0.4%) |
| $12,500 to $14,999 | 11 (0.4%) | 35 (1.5%) |
| $15,000 to $17,499 | 0 (0.0%) | 51 (2.1%) |
| $17,500 to $19,999 | 57 (2.1%) | 77 (3.2%) |
| $20,000 to $22,499 | 87 (3.2%) | 13 (0.5%) |
| $22,500 to $24,999 | 12 (0.4%) | 39 (1.6%) |
| $25,000 to $29,999 | 0 (0.0%) | 32 (1.3%) |
| $30,000 to $34,999 | 31 (1.1%) | 124 (5.2%) |
| $35,000 to $39,999 | 79 (2.9%) | 87 (3.7%) |
| $40,000 to $44,999 | 208 (7.6%) | 107 (4.5%) |
| $45,000 to $49,999 | 153 (5.6%) | 140 (5.9%) |
| $50,000 to $54,999 | 83 (3.0%) | 73 (3.1%) |
| $55,000 to $64,999 | 237 (8.6%) | 256 (10.8%) |
| $65,000 to $74,999 | 276 (10.1%) | 192 (8.1%) |
| $75,000 to $99,999 | 397 (14.5%) | 267 (11.2%) |
| $100,000+ | 756 (27.6%) | 499 (21.0%) |
| Total | 2,741 (100.0%) | 2,378 (100.0%) |
Earnings by Sex by Educational Attainment in Butler borough
Average earnings in Butler borough are $72,277 for men and $61,135 for women, a difference of 15.4%. Men with an educational attainment of graduate degree enjoy the highest average annual earnings of $114,000, while those with high school diploma education earn the least with $58,393. Women with an educational attainment of graduate degree earn the most with the average annual earnings of $100,000, while those with high school diploma education have the smallest earnings of $33,490.
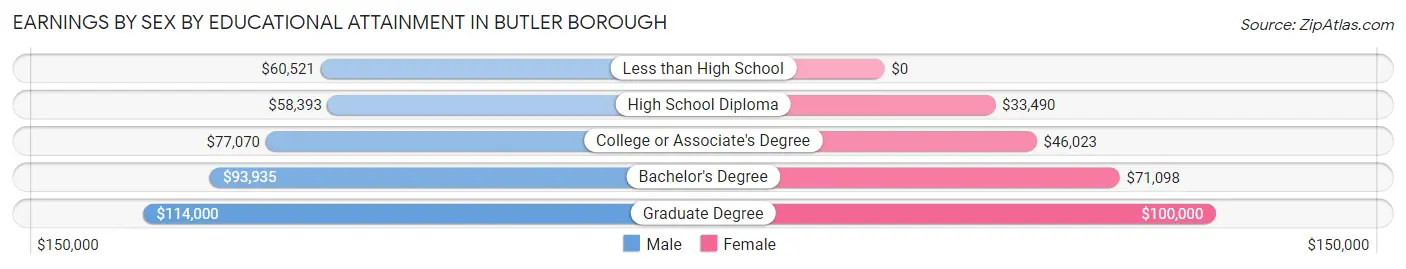
| Educational Attainment | Male Income | Female Income |
| Less than High School | $60,521 | $0 |
| High School Diploma | $58,393 | $33,490 |
| College or Associate's Degree | $77,070 | $46,023 |
| Bachelor's Degree | $93,935 | $71,098 |
| Graduate Degree | $114,000 | $100,000 |
| Total | $72,277 | $61,135 |
Family Income in Butler borough
Family Income Brackets in Butler borough
According to the Butler borough family income data, there are 607 families falling into the $100,000 to $149,999 income range, which is the most common income bracket and makes up 28.6% of all families.
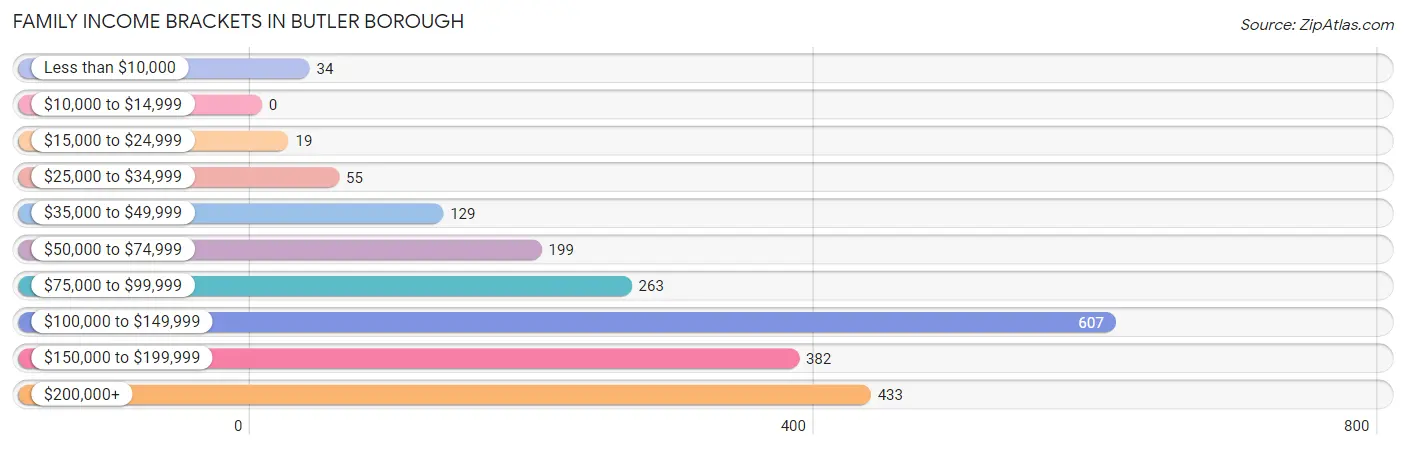
| Income Bracket | # Families | % Families |
| Less than $10,000 | 34 | 1.6% |
| $10,000 to $14,999 | 0 | 0.0% |
| $15,000 to $24,999 | 19 | 0.9% |
| $25,000 to $34,999 | 55 | 2.6% |
| $35,000 to $49,999 | 129 | 6.1% |
| $50,000 to $74,999 | 199 | 9.4% |
| $75,000 to $99,999 | 263 | 12.4% |
| $100,000 to $149,999 | 607 | 28.6% |
| $150,000 to $199,999 | 382 | 18.0% |
| $200,000+ | 433 | 20.4% |
Family Income by Famaliy Size in Butler borough
4-person families (307 | 14.5%) account for the highest median family income in Butler borough with $189,313 per family, while 2-person families (1,042 | 49.1%) have the highest median income of $49,584 per family member.
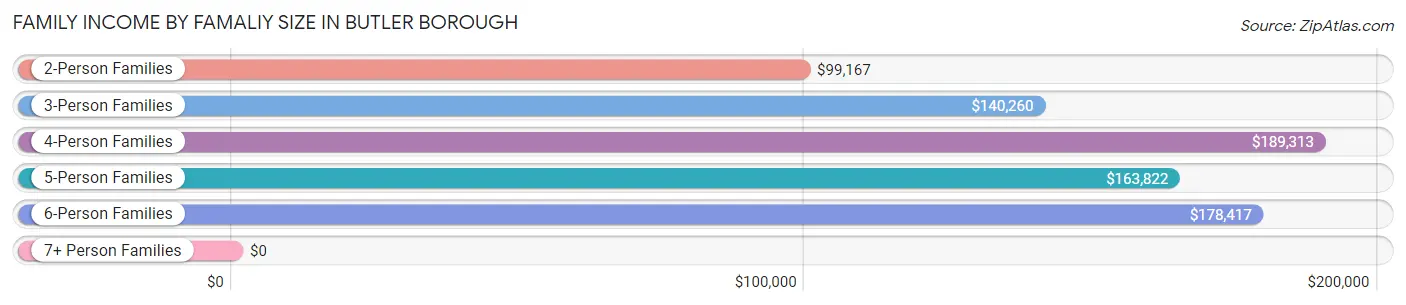
| Income Bracket | # Families | Median Income |
| 2-Person Families | 1,042 (49.1%) | $99,167 |
| 3-Person Families | 574 (27.1%) | $140,260 |
| 4-Person Families | 307 (14.5%) | $189,313 |
| 5-Person Families | 141 (6.7%) | $163,822 |
| 6-Person Families | 49 (2.3%) | $178,417 |
| 7+ Person Families | 8 (0.4%) | $0 |
| Total | 2,121 (100.0%) | $134,432 |
Family Income by Number of Earners in Butler borough
The median family income in Butler borough is $134,432, with families comprising 3+ earners (278) having the highest median family income of $177,833, while families with 1 earner (553) have the lowest median family income of $86,631, accounting for 13.1% and 26.1% of families, respectively.
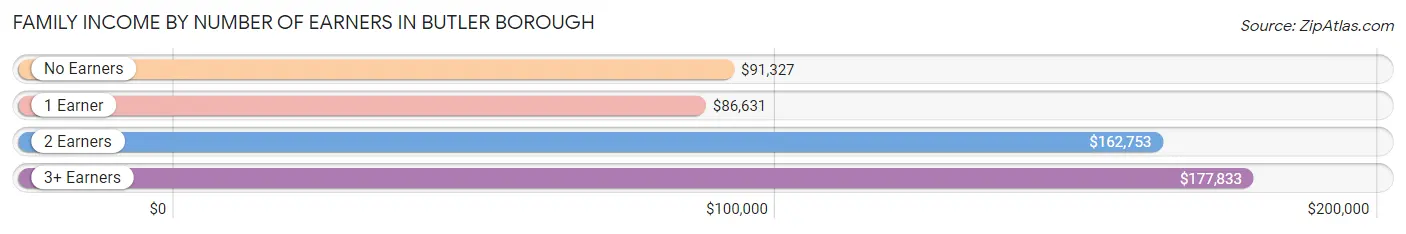
| Number of Earners | # Families | Median Income |
| No Earners | 234 (11.0%) | $91,327 |
| 1 Earner | 553 (26.1%) | $86,631 |
| 2 Earners | 1,056 (49.8%) | $162,753 |
| 3+ Earners | 278 (13.1%) | $177,833 |
| Total | 2,121 (100.0%) | $134,432 |
Household Income in Butler borough
Household Income Brackets in Butler borough
With 916 households falling in the category, the $100,000 to $149,999 income range is the most frequent in Butler borough, accounting for 26.3% of all households. In contrast, only 77 households (2.2%) fall into the $10,000 to $14,999 income bracket, making it the least populous group.
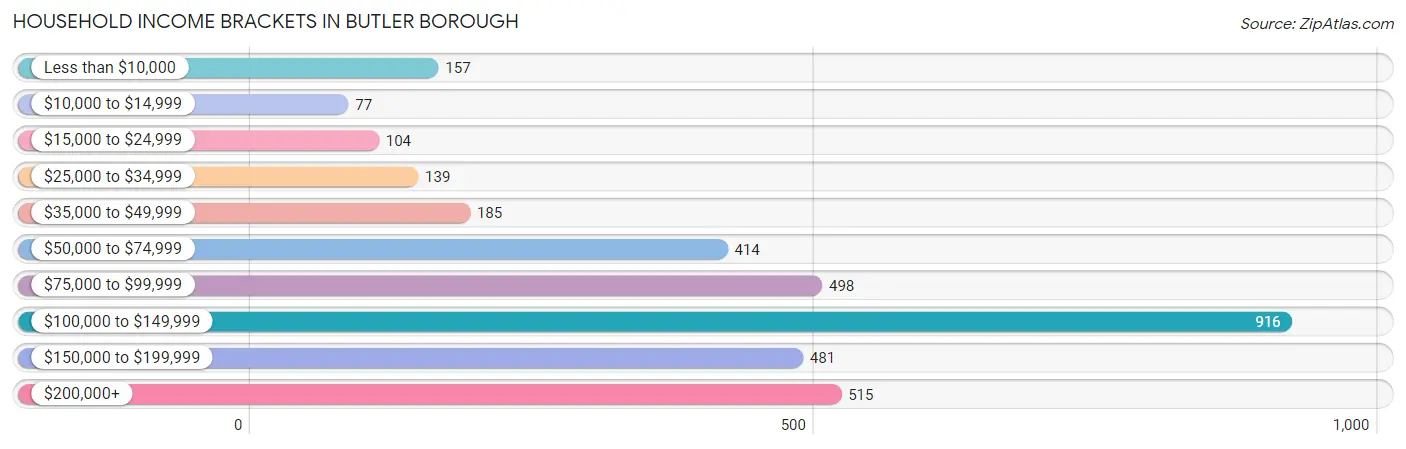
| Income Bracket | # Households | % Households |
| Less than $10,000 | 157 | 4.5% |
| $10,000 to $14,999 | 77 | 2.2% |
| $15,000 to $24,999 | 104 | 3.0% |
| $25,000 to $34,999 | 139 | 4.0% |
| $35,000 to $49,999 | 185 | 5.3% |
| $50,000 to $74,999 | 414 | 11.9% |
| $75,000 to $99,999 | 498 | 14.3% |
| $100,000 to $149,999 | 916 | 26.3% |
| $150,000 to $199,999 | 481 | 13.8% |
| $200,000+ | 515 | 14.8% |
Household Income by Householder Age in Butler borough
The median household income in Butler borough is $108,378, with the highest median household income of $124,593 found in the 25 to 44 years age bracket for the primary householder. A total of 1,012 households (29.1%) fall into this category.
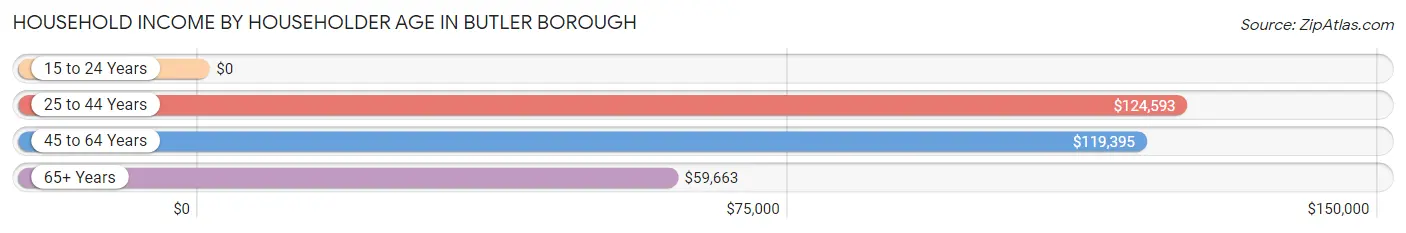
| Income Bracket | # Households | Median Income |
| 15 to 24 Years | 0 (0.0%) | $0 |
| 25 to 44 Years | 1,012 (29.1%) | $124,593 |
| 45 to 64 Years | 1,541 (44.3%) | $119,395 |
| 65+ Years | 929 (26.7%) | $59,663 |
| Total | 3,482 (100.0%) | $108,378 |
Poverty in Butler borough
Income Below Poverty by Sex and Age in Butler borough
With 4.8% poverty level for males and 9.9% for females among the residents of Butler borough, 12 to 14 year old males and 75 year old and over females are the most vulnerable to poverty, with 22 males (15.8%) and 152 females (37.1%) in their respective age groups living below the poverty level.
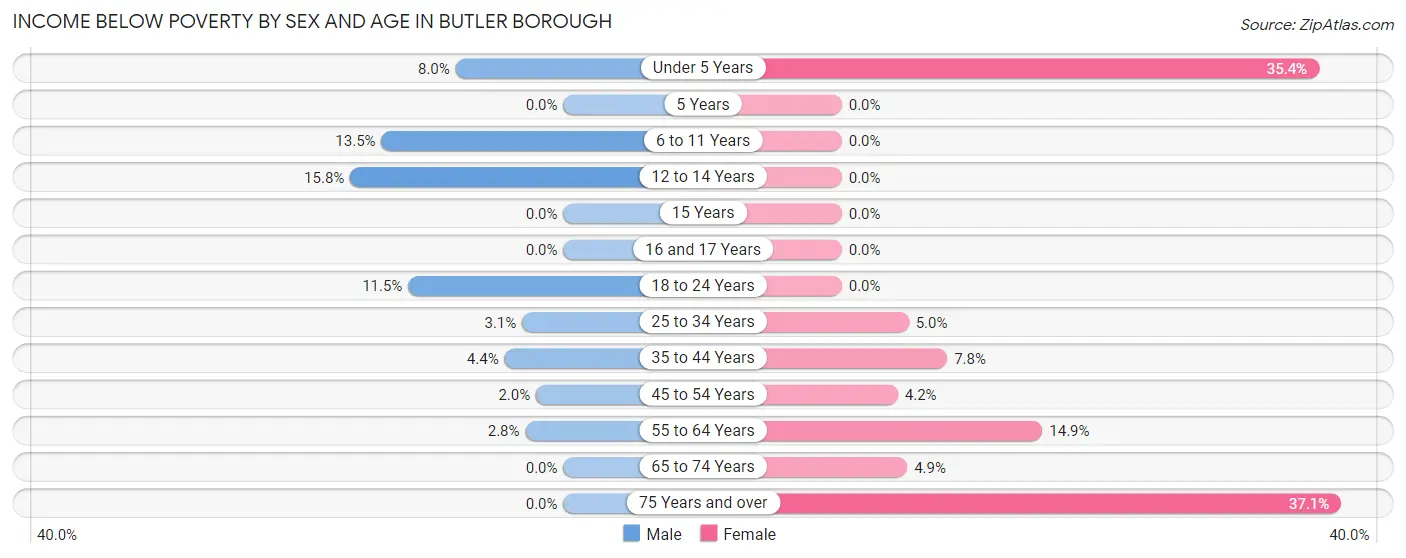
| Age Bracket | Male | Female |
| Under 5 Years | 12 (8.0%) | 34 (35.4%) |
| 5 Years | 0 (0.0%) | 0 (0.0%) |
| 6 to 11 Years | 45 (13.5%) | 0 (0.0%) |
| 12 to 14 Years | 22 (15.8%) | 0 (0.0%) |
| 15 Years | 0 (0.0%) | 0 (0.0%) |
| 16 and 17 Years | 0 (0.0%) | 0 (0.0%) |
| 18 to 24 Years | 44 (11.5%) | 0 (0.0%) |
| 25 to 34 Years | 20 (3.1%) | 23 (5.0%) |
| 35 to 44 Years | 22 (4.4%) | 49 (7.8%) |
| 45 to 54 Years | 12 (2.0%) | 29 (4.2%) |
| 55 to 64 Years | 18 (2.8%) | 84 (14.9%) |
| 65 to 74 Years | 0 (0.0%) | 21 (4.9%) |
| 75 Years and over | 0 (0.0%) | 152 (37.1%) |
| Total | 195 (4.8%) | 392 (9.9%) |
Income Above Poverty by Sex and Age in Butler borough
According to the poverty statistics in Butler borough, males aged 15 years and females aged 6 to 11 years are the age groups that are most secure financially, with 100.0% of males and 100.0% of females in these age groups living above the poverty line.
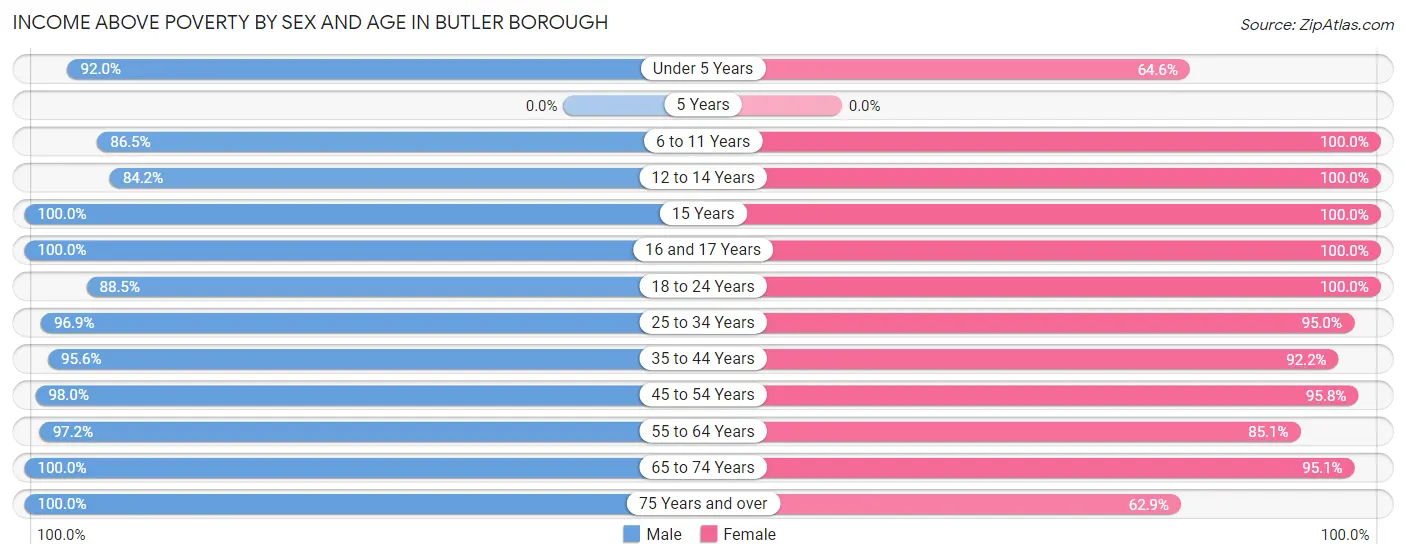
| Age Bracket | Male | Female |
| Under 5 Years | 138 (92.0%) | 62 (64.6%) |
| 5 Years | 0 (0.0%) | 0 (0.0%) |
| 6 to 11 Years | 288 (86.5%) | 102 (100.0%) |
| 12 to 14 Years | 117 (84.2%) | 163 (100.0%) |
| 15 Years | 64 (100.0%) | 39 (100.0%) |
| 16 and 17 Years | 102 (100.0%) | 49 (100.0%) |
| 18 to 24 Years | 338 (88.5%) | 327 (100.0%) |
| 25 to 34 Years | 633 (96.9%) | 440 (95.0%) |
| 35 to 44 Years | 481 (95.6%) | 577 (92.2%) |
| 45 to 54 Years | 579 (98.0%) | 668 (95.8%) |
| 55 to 64 Years | 620 (97.2%) | 480 (85.1%) |
| 65 to 74 Years | 430 (100.0%) | 411 (95.1%) |
| 75 Years and over | 92 (100.0%) | 258 (62.9%) |
| Total | 3,882 (95.2%) | 3,576 (90.1%) |
Income Below Poverty Among Married-Couple Families in Butler borough
The poverty statistics for married-couple families in Butler borough show that 0.5% or 8 of the total 1,610 families live below the poverty line. Families with 1 or 2 children have the highest poverty rate of 1.6%, comprising of 8 families. On the other hand, families with no children have the lowest poverty rate of 0.0%, which includes 0 families.
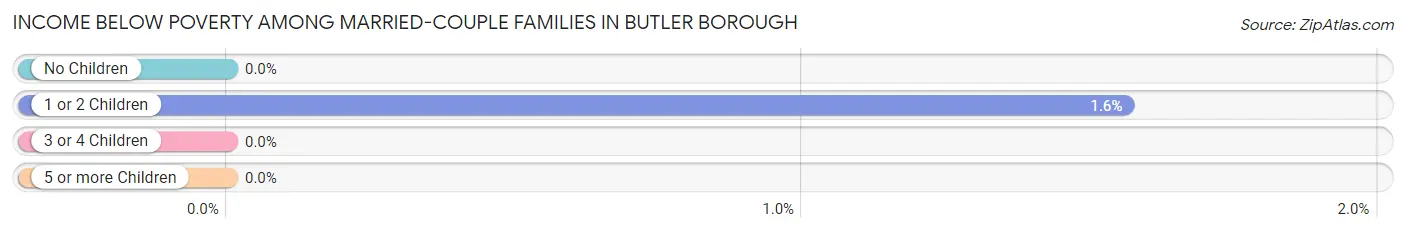
| Children | Above Poverty | Below Poverty |
| No Children | 950 (100.0%) | 0 (0.0%) |
| 1 or 2 Children | 505 (98.4%) | 8 (1.6%) |
| 3 or 4 Children | 147 (100.0%) | 0 (0.0%) |
| 5 or more Children | 0 (0.0%) | 0 (0.0%) |
| Total | 1,602 (99.5%) | 8 (0.5%) |
Income Below Poverty Among Single-Parent Households in Butler borough
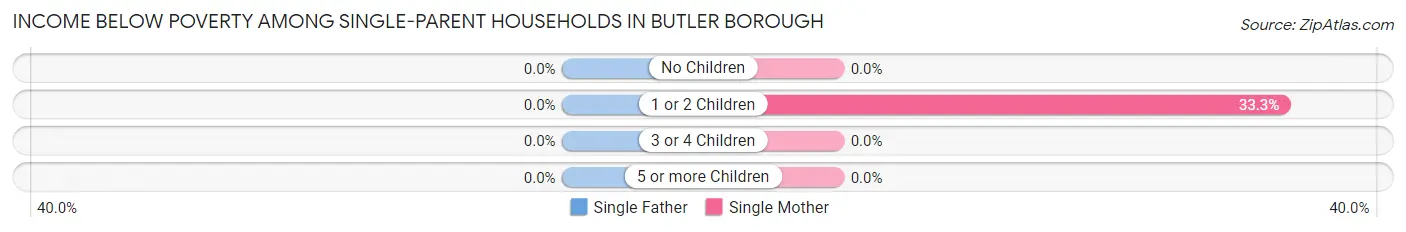
| Children | Single Father | Single Mother |
| No Children | 0 (0.0%) | 0 (0.0%) |
| 1 or 2 Children | 0 (0.0%) | 45 (33.3%) |
| 3 or 4 Children | 0 (0.0%) | 0 (0.0%) |
| 5 or more Children | 0 (0.0%) | 0 (0.0%) |
| Total | 0 (0.0%) | 45 (12.0%) |
Income Below Poverty Among Married-Couple vs Single-Parent Households in Butler borough
The poverty data for Butler borough shows that 8 of the married-couple family households (0.5%) and 45 of the single-parent households (8.8%) are living below the poverty level. Within the married-couple family households, those with 1 or 2 children have the highest poverty rate, with 8 households (1.6%) falling below the poverty line. Among the single-parent households, those with 1 or 2 children have the highest poverty rate, with 45 household (28.0%) living below poverty.
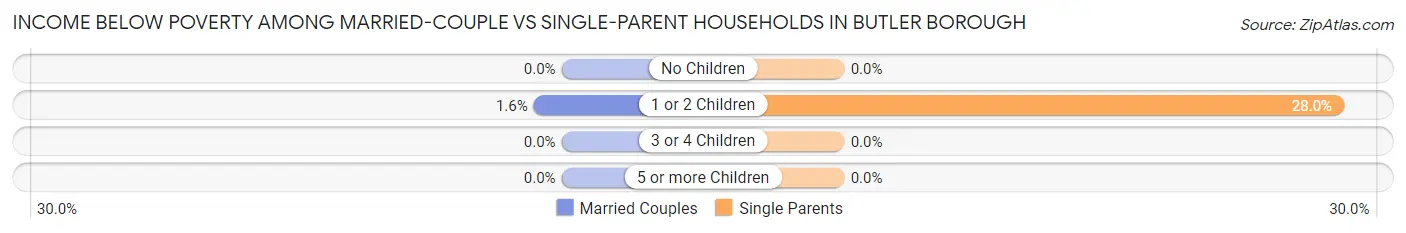
| Children | Married-Couple Families | Single-Parent Households |
| No Children | 0 (0.0%) | 0 (0.0%) |
| 1 or 2 Children | 8 (1.6%) | 45 (28.0%) |
| 3 or 4 Children | 0 (0.0%) | 0 (0.0%) |
| 5 or more Children | 0 (0.0%) | 0 (0.0%) |
| Total | 8 (0.5%) | 45 (8.8%) |
Race in Butler borough
The most populous races in Butler borough are White / Caucasian (6,575 | 81.7%), Hispanic or Latino (1,774 | 22.1%), and Some other Race (574 | 7.1%).
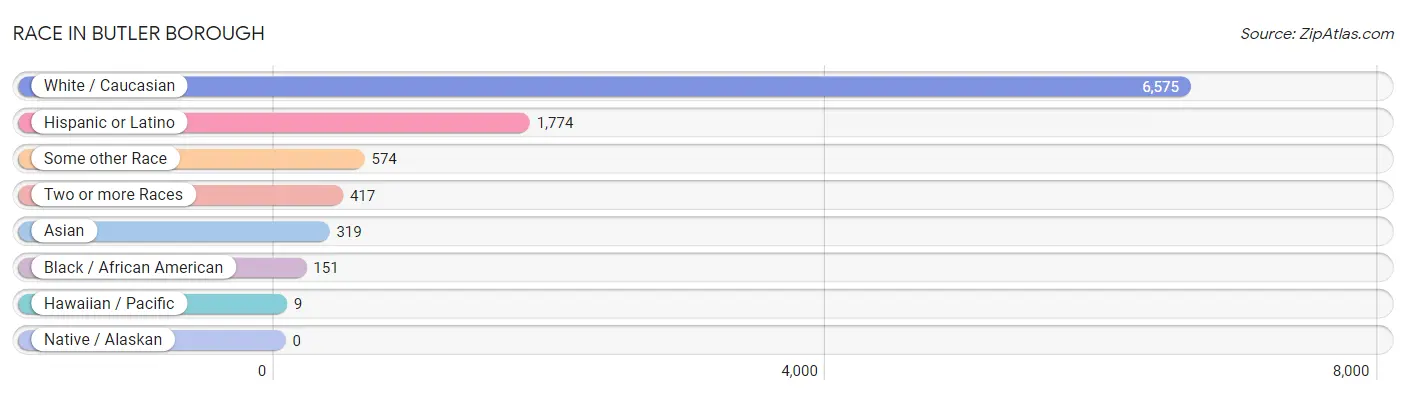
| Race | # Population | % Population |
| Asian | 319 | 4.0% |
| Black / African American | 151 | 1.9% |
| Hawaiian / Pacific | 9 | 0.1% |
| Hispanic or Latino | 1,774 | 22.1% |
| Native / Alaskan | 0 | 0.0% |
| White / Caucasian | 6,575 | 81.7% |
| Two or more Races | 417 | 5.2% |
| Some other Race | 574 | 7.1% |
| Total | 8,045 | 100.0% |
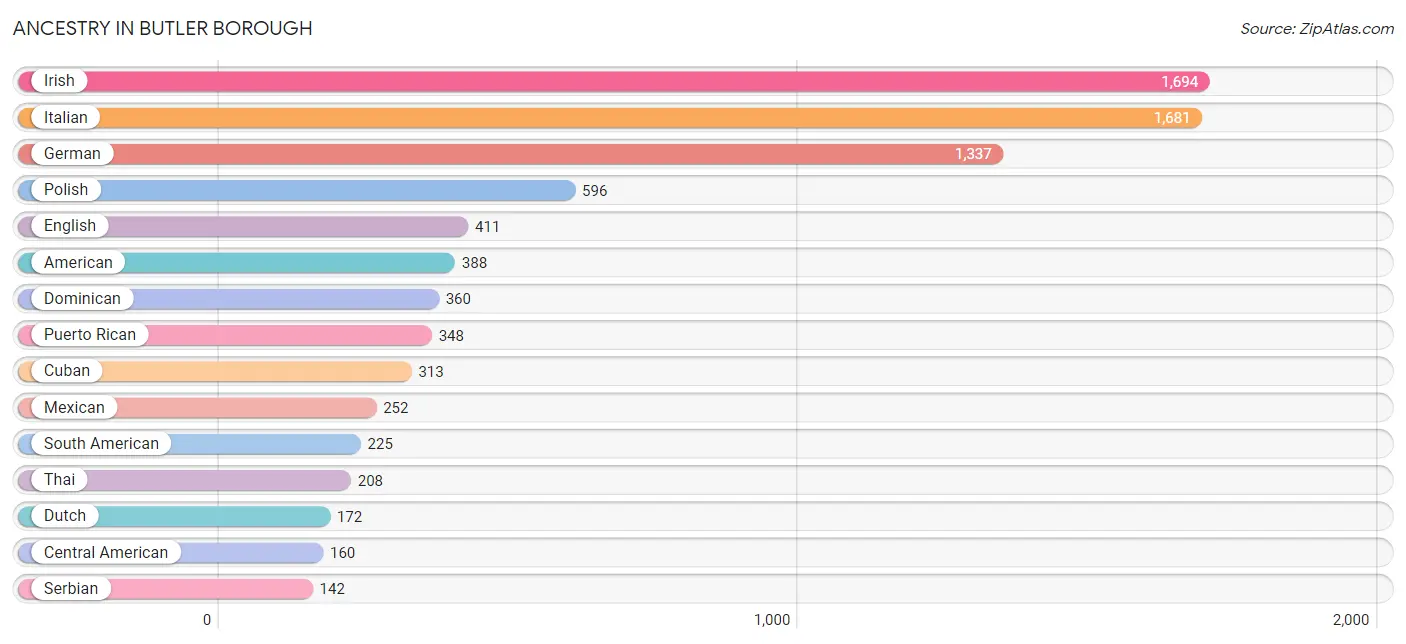
Ancestry in Butler borough
The most populous ancestries reported in Butler borough are Irish (1,694 | 21.1%), Italian (1,681 | 20.9%), German (1,337 | 16.6%), Polish (596 | 7.4%), and English (411 | 5.1%), together accounting for 71.1% of all Butler borough residents.
| Ancestry | # Population | % Population |
| American | 388 | 4.8% |
| Arab | 20 | 0.3% |
| Belgian | 27 | 0.3% |
| Bhutanese | 21 | 0.3% |
| Brazilian | 18 | 0.2% |
| British | 28 | 0.4% |
| Burmese | 16 | 0.2% |
| Carpatho Rusyn | 13 | 0.2% |
| Central American | 160 | 2.0% |
| Colombian | 70 | 0.9% |
| Costa Rican | 37 | 0.5% |
| Croatian | 29 | 0.4% |
| Cuban | 313 | 3.9% |
| Cypriot | 9 | 0.1% |
| Czech | 19 | 0.2% |
| Czechoslovakian | 10 | 0.1% |
| Danish | 8 | 0.1% |
| Dominican | 360 | 4.5% |
| Dutch | 172 | 2.1% |
| Eastern European | 58 | 0.7% |
| Ecuadorian | 91 | 1.1% |
| English | 411 | 5.1% |
| European | 12 | 0.2% |
| Finnish | 9 | 0.1% |
| French | 114 | 1.4% |
| French Canadian | 16 | 0.2% |
| German | 1,337 | 16.6% |
| Greek | 59 | 0.7% |
| Guatemalan | 123 | 1.5% |
| Hungarian | 43 | 0.5% |
| Indian (Asian) | 33 | 0.4% |
| Irish | 1,694 | 21.1% |
| Italian | 1,681 | 20.9% |
| Jamaican | 4 | 0.1% |
| Korean | 59 | 0.7% |
| Lebanese | 9 | 0.1% |
| Lithuanian | 18 | 0.2% |
| Macedonian | 34 | 0.4% |
| Mexican | 252 | 3.1% |
| Native Hawaiian | 9 | 0.1% |
| Norwegian | 31 | 0.4% |
| Palestinian | 9 | 0.1% |
| Peruvian | 64 | 0.8% |
| Polish | 596 | 7.4% |
| Portuguese | 17 | 0.2% |
| Puerto Rican | 348 | 4.3% |
| Romanian | 58 | 0.7% |
| Russian | 47 | 0.6% |
| Scotch-Irish | 110 | 1.4% |
| Scottish | 103 | 1.3% |
| Serbian | 142 | 1.8% |
| Slavic | 38 | 0.5% |
| Slovak | 106 | 1.3% |
| South American | 225 | 2.8% |
| Spaniard | 99 | 1.2% |
| Swedish | 68 | 0.9% |
| Swiss | 11 | 0.1% |
| Thai | 208 | 2.6% |
| Turkish | 92 | 1.1% |
| Ukrainian | 48 | 0.6% |
| Welsh | 23 | 0.3% |
| Yugoslavian | 9 | 0.1% | View All 62 Rows |
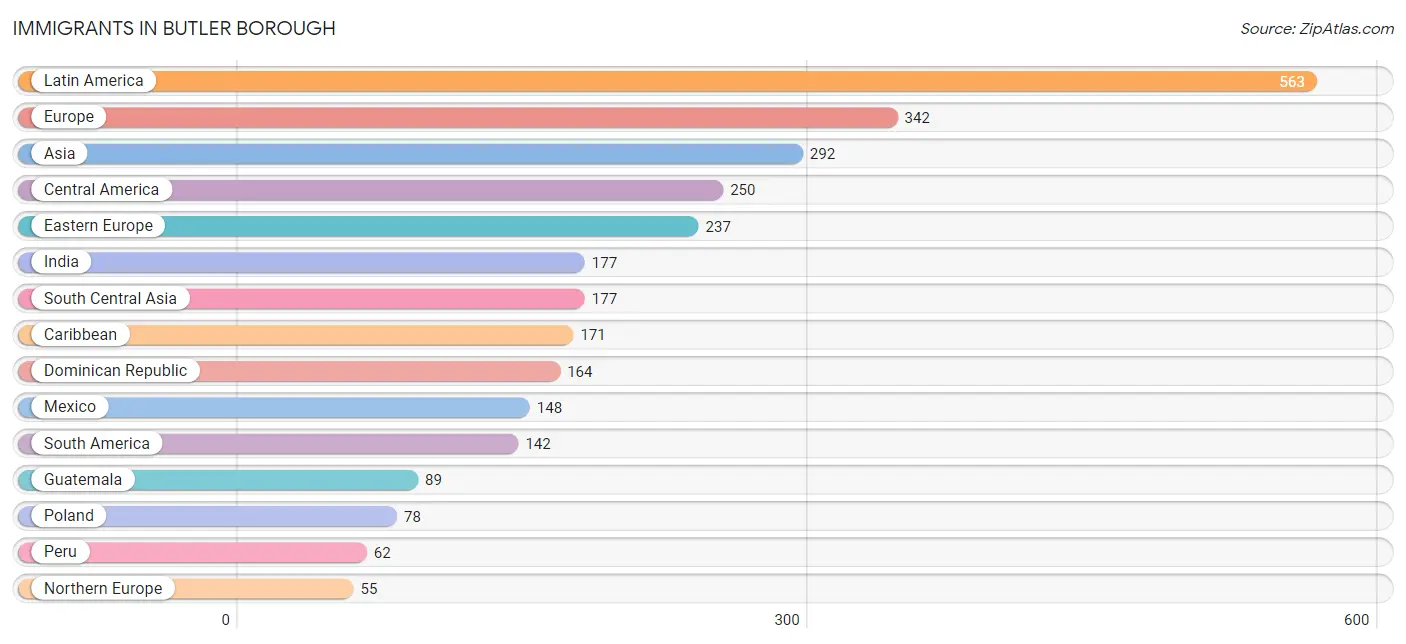
Immigrants in Butler borough
The most numerous immigrant groups reported in Butler borough came from Latin America (563 | 7.0%), Europe (342 | 4.3%), Asia (292 | 3.6%), Central America (250 | 3.1%), and Eastern Europe (237 | 2.9%), together accounting for 20.9% of all Butler borough residents.
| Immigration Origin | # Population | % Population |
| Asia | 292 | 3.6% |
| Bosnia and Herzegovina | 9 | 0.1% |
| Brazil | 18 | 0.2% |
| Canada | 6 | 0.1% |
| Caribbean | 171 | 2.1% |
| Central America | 250 | 3.1% |
| Colombia | 23 | 0.3% |
| Costa Rica | 13 | 0.2% |
| Croatia | 18 | 0.2% |
| Cuba | 7 | 0.1% |
| Dominican Republic | 164 | 2.0% |
| Eastern Asia | 37 | 0.5% |
| Eastern Europe | 237 | 2.9% |
| Ecuador | 31 | 0.4% |
| Europe | 342 | 4.3% |
| Germany | 11 | 0.1% |
| Greece | 16 | 0.2% |
| Guatemala | 89 | 1.1% |
| India | 177 | 2.2% |
| Ireland | 12 | 0.2% |
| Italy | 23 | 0.3% |
| Japan | 21 | 0.3% |
| Korea | 16 | 0.2% |
| Latin America | 563 | 7.0% |
| Lithuania | 9 | 0.1% |
| Mexico | 148 | 1.8% |
| North Macedonia | 14 | 0.2% |
| Northern Europe | 55 | 0.7% |
| Norway | 15 | 0.2% |
| Peru | 62 | 0.8% |
| Philippines | 30 | 0.4% |
| Poland | 78 | 1.0% |
| Romania | 45 | 0.6% |
| Serbia | 35 | 0.4% |
| South America | 142 | 1.8% |
| South Central Asia | 177 | 2.2% |
| South Eastern Asia | 30 | 0.4% |
| Southern Europe | 39 | 0.5% |
| Syria | 20 | 0.3% |
| Turkey | 19 | 0.2% |
| Uruguay | 8 | 0.1% |
| Western Asia | 48 | 0.6% |
| Western Europe | 11 | 0.1% | View All 43 Rows |
Sex and Age in Butler borough
Sex and Age in Butler borough
The most populous age groups in Butler borough are 55 to 59 Years (399 | 9.8%) for men and 45 to 49 Years (363 | 9.1%) for women.
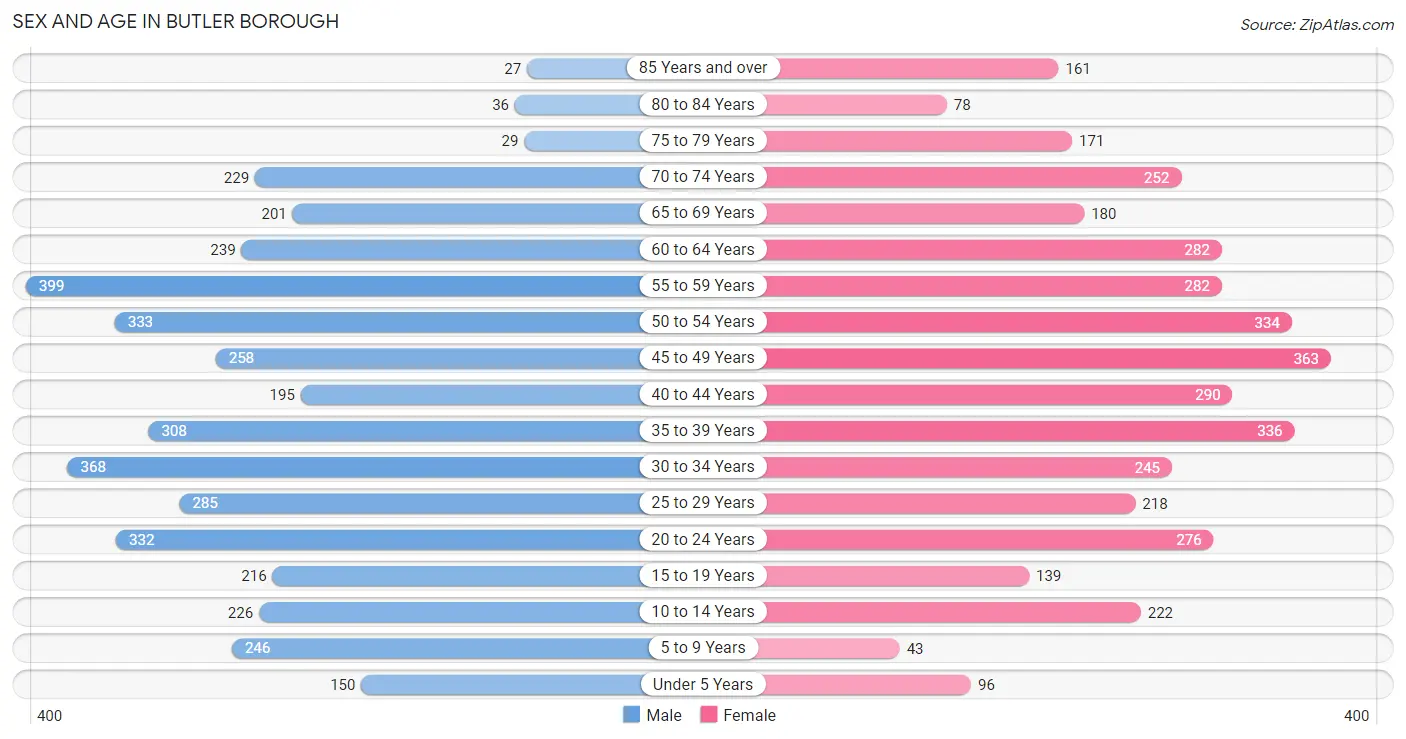
| Age Bracket | Male | Female |
| Under 5 Years | 150 (3.7%) | 96 (2.4%) |
| 5 to 9 Years | 246 (6.0%) | 43 (1.1%) |
| 10 to 14 Years | 226 (5.5%) | 222 (5.6%) |
| 15 to 19 Years | 216 (5.3%) | 139 (3.5%) |
| 20 to 24 Years | 332 (8.1%) | 276 (7.0%) |
| 25 to 29 Years | 285 (7.0%) | 218 (5.5%) |
| 30 to 34 Years | 368 (9.0%) | 245 (6.2%) |
| 35 to 39 Years | 308 (7.5%) | 336 (8.5%) |
| 40 to 44 Years | 195 (4.8%) | 290 (7.3%) |
| 45 to 49 Years | 258 (6.3%) | 363 (9.1%) |
| 50 to 54 Years | 333 (8.2%) | 334 (8.4%) |
| 55 to 59 Years | 399 (9.8%) | 282 (7.1%) |
| 60 to 64 Years | 239 (5.9%) | 282 (7.1%) |
| 65 to 69 Years | 201 (4.9%) | 180 (4.5%) |
| 70 to 74 Years | 229 (5.6%) | 252 (6.4%) |
| 75 to 79 Years | 29 (0.7%) | 171 (4.3%) |
| 80 to 84 Years | 36 (0.9%) | 78 (2.0%) |
| 85 Years and over | 27 (0.7%) | 161 (4.1%) |
| Total | 4,077 (100.0%) | 3,968 (100.0%) |
Families and Households in Butler borough
Median Family Size in Butler borough
The median family size in Butler borough is 2.83 persons per family, with married-couple families (1,610 | 75.9%) accounting for the largest median family size of 2.88 persons per family. On the other hand, single male/father families (135 | 6.4%) represent the smallest median family size with 2.49 persons per family.
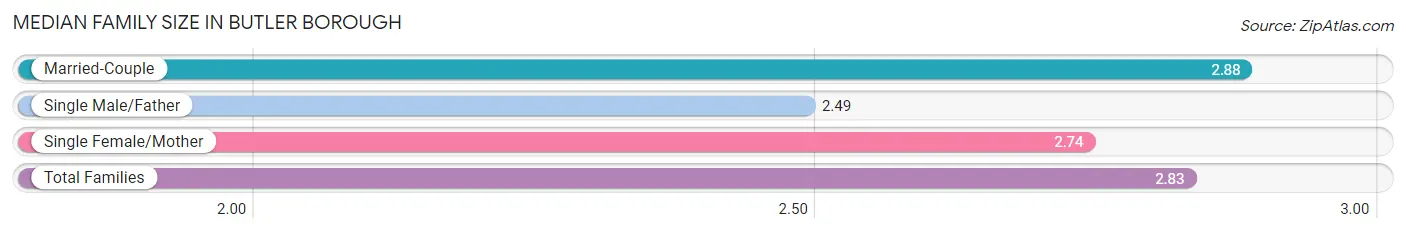
| Family Type | # Families | Family Size |
| Married-Couple | 1,610 (75.9%) | 2.88 |
| Single Male/Father | 135 (6.4%) | 2.49 |
| Single Female/Mother | 376 (17.7%) | 2.74 |
| Total Families | 2,121 (100.0%) | 2.83 |
Median Household Size in Butler borough
The median household size in Butler borough is 2.30 persons per household, with single female/mother households (376 | 10.8%) accounting for the largest median household size of 3.25 persons per household. non-family households (1,361 | 39.1%) represent the smallest median household size with 1.23 persons per household.
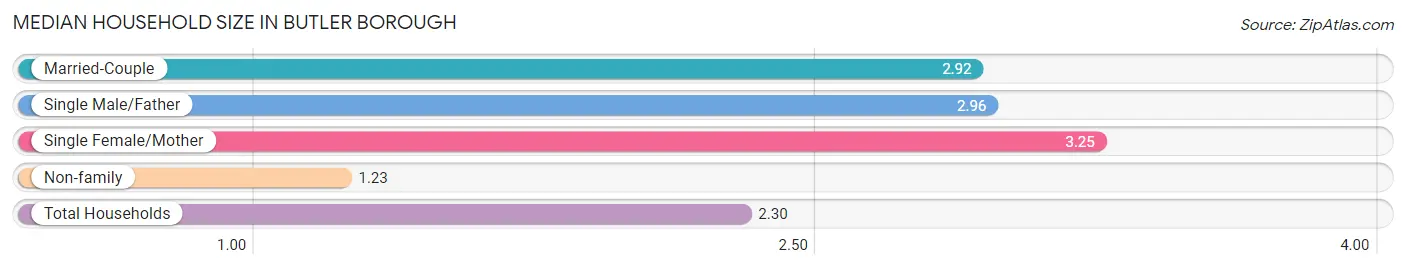
| Household Type | # Households | Household Size |
| Married-Couple | 1,610 (46.2%) | 2.92 |
| Single Male/Father | 135 (3.9%) | 2.96 |
| Single Female/Mother | 376 (10.8%) | 3.25 |
| Non-family | 1,361 (39.1%) | 1.23 |
| Total Households | 3,482 (100.0%) | 2.30 |
Household Size by Marriage Status in Butler borough
Out of a total of 3,482 households in Butler borough, 2,121 (60.9%) are family households, while 1,361 (39.1%) are nonfamily households. The most numerous type of family households are 2-person households, comprising 915, and the most common type of nonfamily households are 1-person households, comprising 1,139.
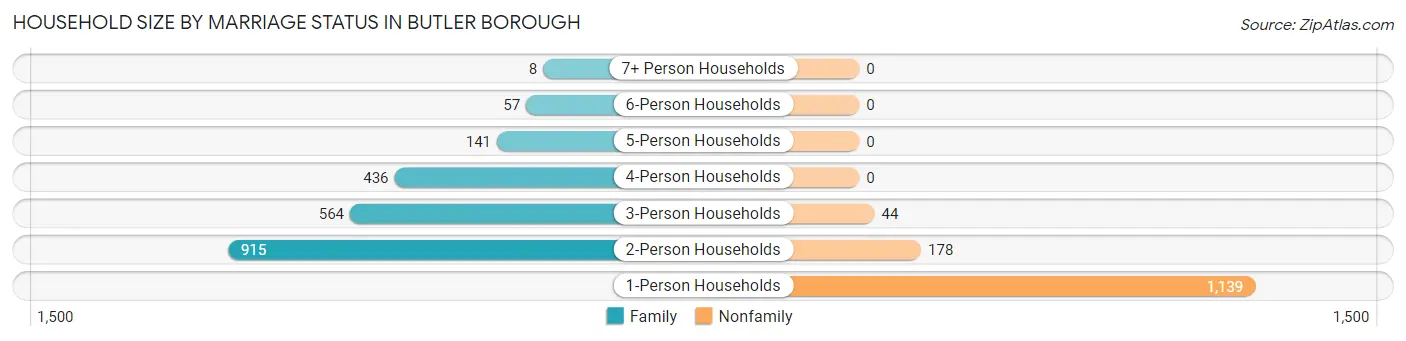
| Household Size | Family Households | Nonfamily Households |
| 1-Person Households | - | 1,139 (32.7%) |
| 2-Person Households | 915 (26.3%) | 178 (5.1%) |
| 3-Person Households | 564 (16.2%) | 44 (1.3%) |
| 4-Person Households | 436 (12.5%) | 0 (0.0%) |
| 5-Person Households | 141 (4.1%) | 0 (0.0%) |
| 6-Person Households | 57 (1.6%) | 0 (0.0%) |
| 7+ Person Households | 8 (0.2%) | 0 (0.0%) |
| Total | 2,121 (60.9%) | 1,361 (39.1%) |
Female Fertility in Butler borough
Fertility by Age in Butler borough
Average fertility rate in Butler borough is 52.0 births per 1,000 women. Women in the age bracket of 20 to 34 years have the highest fertility rate with 78.0 births per 1,000 women. Women in the age bracket of 20 to 34 years acount for 58.6% of all women with births.
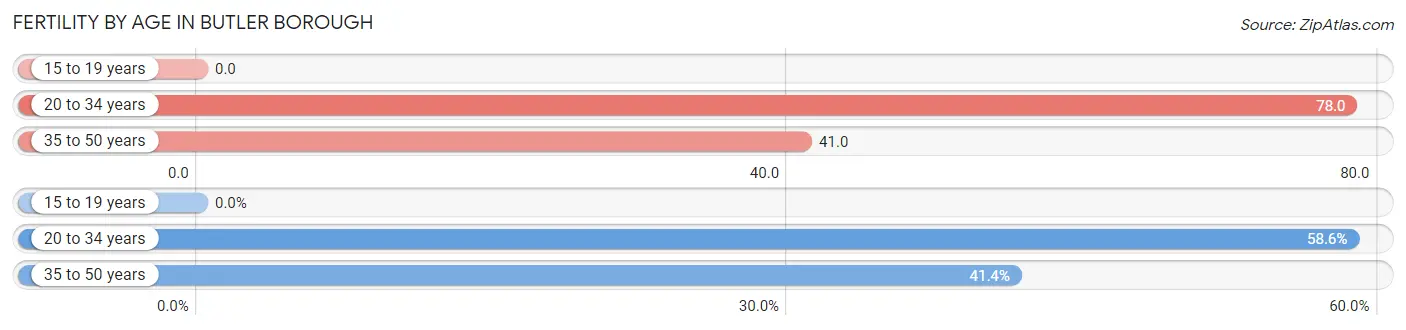
| Age Bracket | Women with Births | Births / 1,000 Women |
| 15 to 19 years | 0 (0.0%) | 0.0 |
| 20 to 34 years | 58 (58.6%) | 78.0 |
| 35 to 50 years | 41 (41.4%) | 41.0 |
| Total | 99 (100.0%) | 52.0 |
Fertility by Age by Marriage Status in Butler borough
58.6% of women with births (99) in Butler borough are married. The highest percentage of unmarried women with births falls into 35 to 50 years age bracket with 100.0% of them unmarried at the time of birth, while the lowest percentage of unmarried women with births belong to 20 to 34 years age bracket with 0.0% of them unmarried.
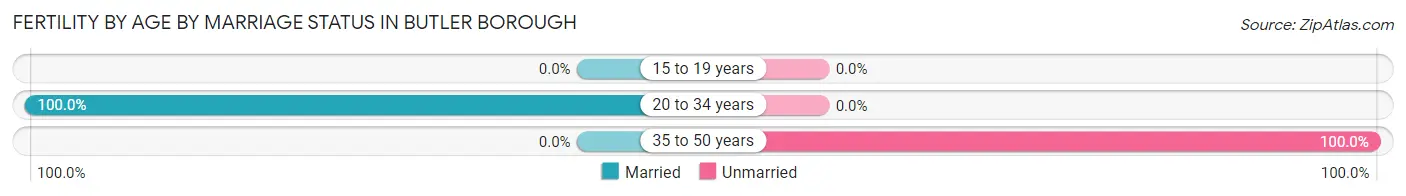
| Age Bracket | Married | Unmarried |
| 15 to 19 years | 0 (0.0%) | 0 (0.0%) |
| 20 to 34 years | 58 (100.0%) | 0 (0.0%) |
| 35 to 50 years | 0 (0.0%) | 41 (100.0%) |
| Total | 58 (58.6%) | 41 (41.4%) |
Fertility by Education in Butler borough
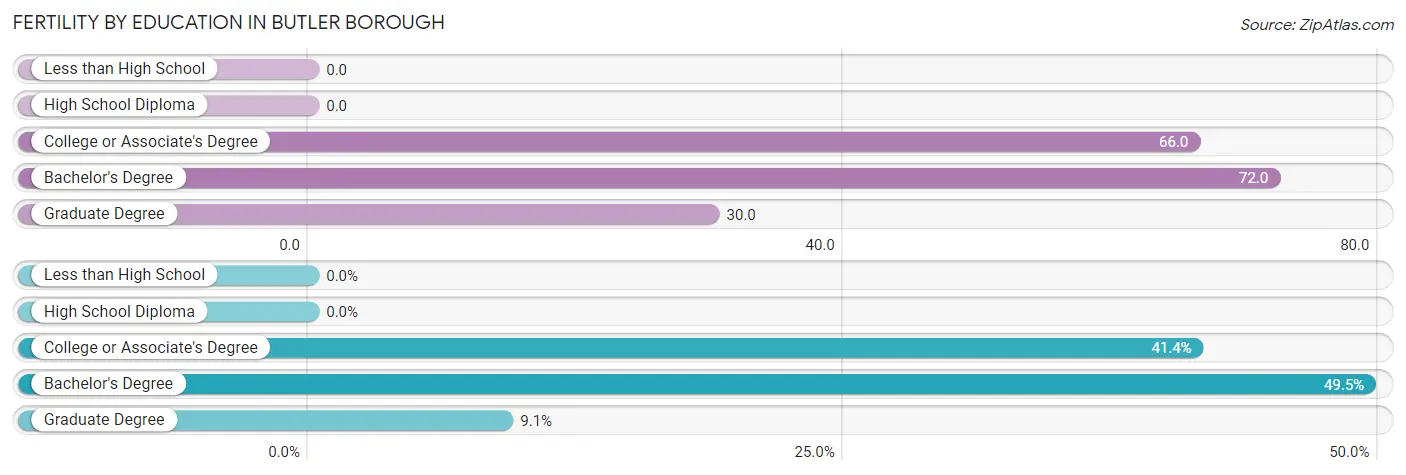
| Educational Attainment | Women with Births | Births / 1,000 Women |
| Less than High School | 0 (0.0%) | 0.0 |
| High School Diploma | 0 (0.0%) | 0.0 |
| College or Associate's Degree | 41 (41.4%) | 66.0 |
| Bachelor's Degree | 49 (49.5%) | 72.0 |
| Graduate Degree | 9 (9.1%) | 30.0 |
| Total | 99 (100.0%) | 52.0 |
Fertility by Education by Marriage Status in Butler borough
41.4% of women with births in Butler borough are unmarried. Women with the educational attainment of bachelor's degree are most likely to be married with 100.0% of them married at childbirth, while women with the educational attainment of college or associate's degree are least likely to be married with 100.0% of them unmarried at childbirth.
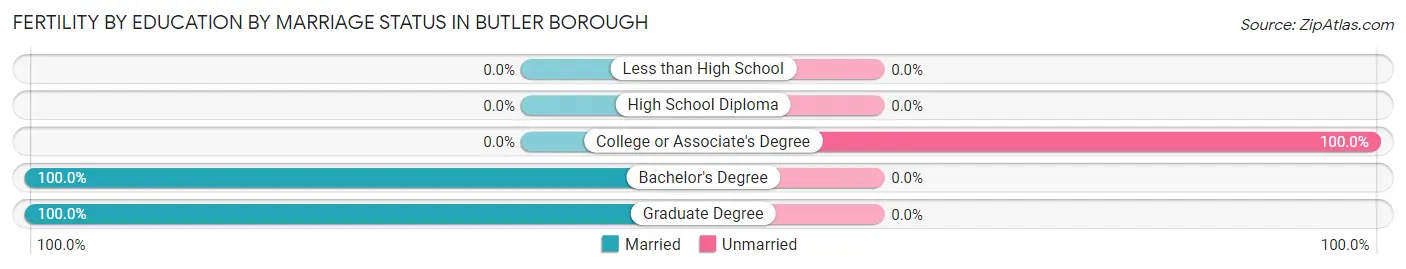
| Educational Attainment | Married | Unmarried |
| Less than High School | 0 (0.0%) | 0 (0.0%) |
| High School Diploma | 0 (0.0%) | 0 (0.0%) |
| College or Associate's Degree | 0 (0.0%) | 41 (100.0%) |
| Bachelor's Degree | 49 (100.0%) | 0 (0.0%) |
| Graduate Degree | 9 (100.0%) | 0 (0.0%) |
| Total | 58 (58.6%) | 41 (41.4%) |
Employment Characteristics in Butler borough
Employment by Class of Employer in Butler borough
Among the 4,727 employed individuals in Butler borough, private company employees (3,427 | 72.5%), local government employees (456 | 9.7%), and not-for-profit organizations (368 | 7.8%) make up the most common classes of employment.
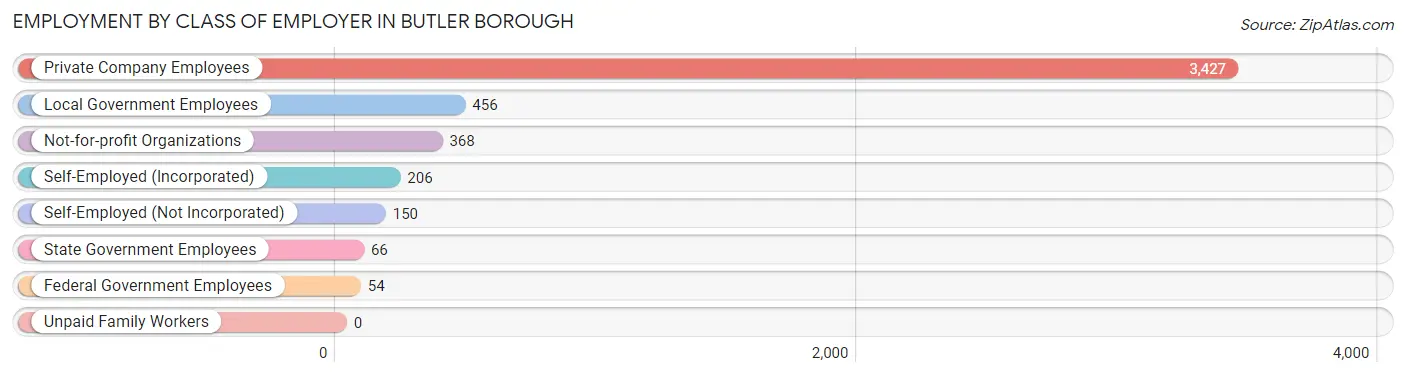
| Employer Class | # Employees | % Employees |
| Private Company Employees | 3,427 | 72.5% |
| Self-Employed (Incorporated) | 206 | 4.4% |
| Self-Employed (Not Incorporated) | 150 | 3.2% |
| Not-for-profit Organizations | 368 | 7.8% |
| Local Government Employees | 456 | 9.7% |
| State Government Employees | 66 | 1.4% |
| Federal Government Employees | 54 | 1.1% |
| Unpaid Family Workers | 0 | 0.0% |
| Total | 4,727 | 100.0% |
Employment Status by Age in Butler borough
According to the labor force statistics for Butler borough, out of the total population over 16 years of age (6,959), 72.0% or 5,010 individuals are in the labor force, with 4.5% or 225 of them unemployed. The age group with the highest labor force participation rate is 35 to 44 years, with 93.8% or 1,059 individuals in the labor force. Within the labor force, the 16 to 19 years age range has the highest percentage of unemployed individuals, with 33.9% or 37 of them being unemployed.
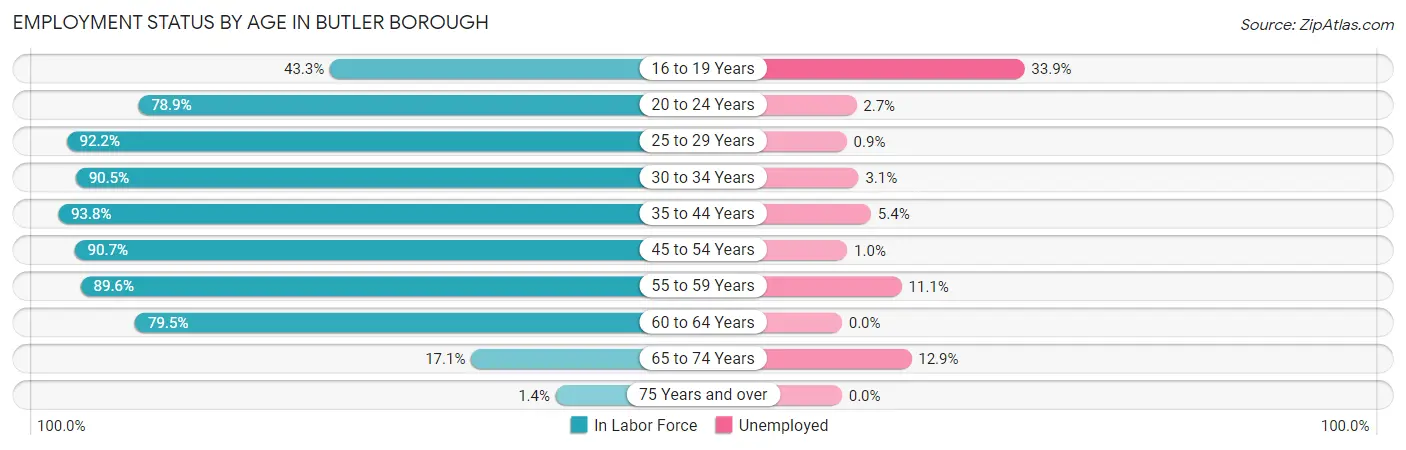
| Age Bracket | In Labor Force | Unemployed |
| 16 to 19 Years | 109 (43.3%) | 37 (33.9%) |
| 20 to 24 Years | 480 (78.9%) | 13 (2.7%) |
| 25 to 29 Years | 464 (92.2%) | 4 (0.9%) |
| 30 to 34 Years | 555 (90.5%) | 17 (3.1%) |
| 35 to 44 Years | 1,059 (93.8%) | 57 (5.4%) |
| 45 to 54 Years | 1,168 (90.7%) | 12 (1.0%) |
| 55 to 59 Years | 610 (89.6%) | 68 (11.1%) |
| 60 to 64 Years | 414 (79.5%) | 0 (0.0%) |
| 65 to 74 Years | 147 (17.1%) | 19 (12.9%) |
| 75 Years and over | 7 (1.4%) | 0 (0.0%) |
| Total | 5,010 (72.0%) | 225 (4.5%) |
Employment Status by Educational Attainment in Butler borough
According to labor force statistics for Butler borough, 90.2% of individuals (4,271) out of the total population between 25 and 64 years of age (4,735) are in the labor force, with 3.7% or 158 of them being unemployed. The group with the highest labor force participation rate are those with the educational attainment of college / associate degree, with 93.0% or 1,016 individuals in the labor force. Within the labor force, individuals with less than high school education have the highest percentage of unemployment, with 23.5% or 36 of them being unemployed.
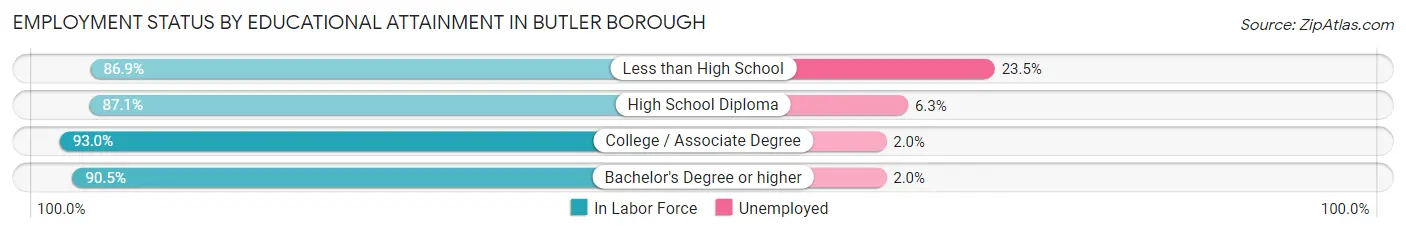
| Educational Attainment | In Labor Force | Unemployed |
| Less than High School | 153 (86.9%) | 41 (23.5%) |
| High School Diploma | 952 (87.1%) | 69 (6.3%) |
| College / Associate Degree | 1,016 (93.0%) | 22 (2.0%) |
| Bachelor's Degree or higher | 2,148 (90.5%) | 47 (2.0%) |
| Total | 4,271 (90.2%) | 175 (3.7%) |
Employment Occupations by Sex in Butler borough
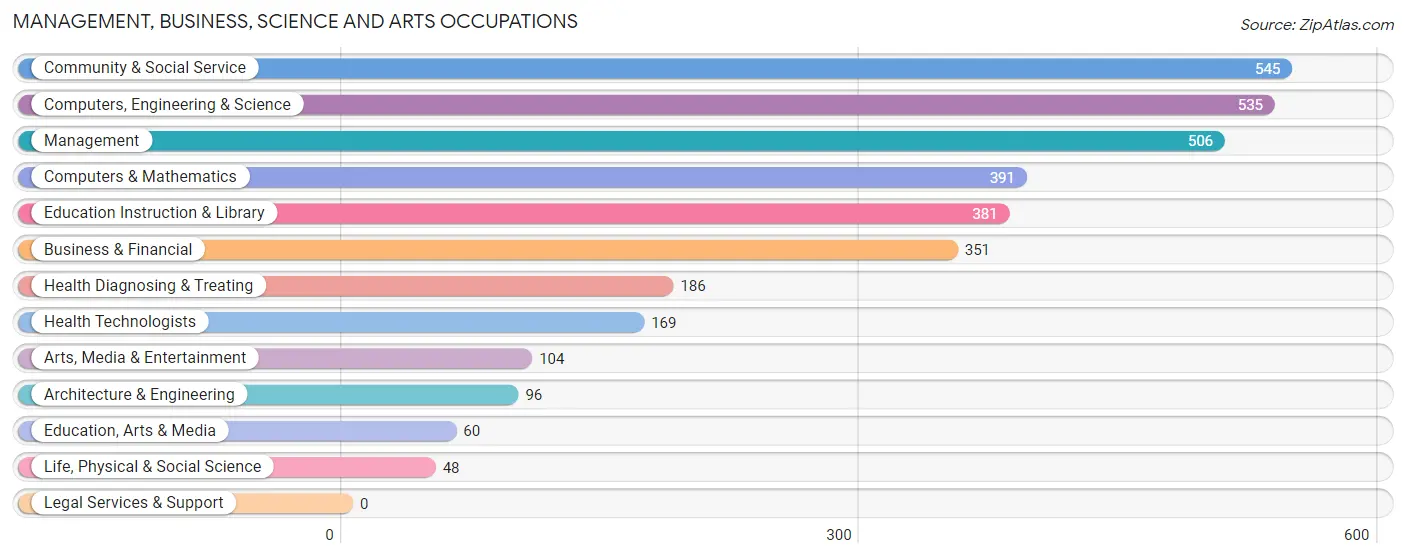
Management, Business, Science and Arts Occupations
The most common Management, Business, Science and Arts occupations in Butler borough are Community & Social Service (545 | 11.4%), Computers, Engineering & Science (535 | 11.2%), Management (506 | 10.6%), Computers & Mathematics (391 | 8.2%), and Education Instruction & Library (381 | 8.0%).
Management, Business, Science and Arts Occupations by Sex
Within the Management, Business, Science and Arts occupations in Butler borough, the most male-oriented occupations are Architecture & Engineering (80.2%), Arts, Media & Entertainment (79.8%), and Computers & Mathematics (79.0%), while the most female-oriented occupations are Life, Physical & Social Science (100.0%), Health Diagnosing & Treating (95.7%), and Health Technologists (95.3%).
| Occupation | Male | Female |
| Management | 307 (60.7%) | 199 (39.3%) |
| Business & Financial | 127 (36.2%) | 224 (63.8%) |
| Computers, Engineering & Science | 386 (72.2%) | 149 (27.9%) |
| Computers & Mathematics | 309 (79.0%) | 82 (21.0%) |
| Architecture & Engineering | 77 (80.2%) | 19 (19.8%) |
| Life, Physical & Social Science | 0 (0.0%) | 48 (100.0%) |
| Community & Social Service | 163 (29.9%) | 382 (70.1%) |
| Education, Arts & Media | 45 (75.0%) | 15 (25.0%) |
| Legal Services & Support | 0 (0.0%) | 0 (0.0%) |
| Education Instruction & Library | 35 (9.2%) | 346 (90.8%) |
| Arts, Media & Entertainment | 83 (79.8%) | 21 (20.2%) |
| Health Diagnosing & Treating | 8 (4.3%) | 178 (95.7%) |
| Health Technologists | 8 (4.7%) | 161 (95.3%) |
| Total (Category) | 991 (46.7%) | 1,132 (53.3%) |
| Total (Overall) | 2,521 (52.7%) | 2,265 (47.3%) |
Services Occupations
The most common Services occupations in Butler borough are Cleaning & Maintenance (161 | 3.4%), Food Preparation & Serving (128 | 2.7%), Healthcare Support (105 | 2.2%), Security & Protection (105 | 2.2%), and Personal Care & Service (93 | 1.9%).
Services Occupations by Sex
Within the Services occupations in Butler borough, the most male-oriented occupations are Law Enforcement (100.0%), Security & Protection (77.1%), and Firefighting & Prevention (47.8%), while the most female-oriented occupations are Personal Care & Service (73.1%), Healthcare Support (66.7%), and Cleaning & Maintenance (65.2%).
| Occupation | Male | Female |
| Healthcare Support | 35 (33.3%) | 70 (66.7%) |
| Security & Protection | 81 (77.1%) | 24 (22.9%) |
| Firefighting & Prevention | 22 (47.8%) | 24 (52.2%) |
| Law Enforcement | 59 (100.0%) | 0 (0.0%) |
| Food Preparation & Serving | 45 (35.2%) | 83 (64.8%) |
| Cleaning & Maintenance | 56 (34.8%) | 105 (65.2%) |
| Personal Care & Service | 25 (26.9%) | 68 (73.1%) |
| Total (Category) | 242 (40.9%) | 350 (59.1%) |
| Total (Overall) | 2,521 (52.7%) | 2,265 (47.3%) |
Sales and Office Occupations
The most common Sales and Office occupations in Butler borough are Office & Administration (662 | 13.8%), and Sales & Related (406 | 8.5%).
Sales and Office Occupations by Sex
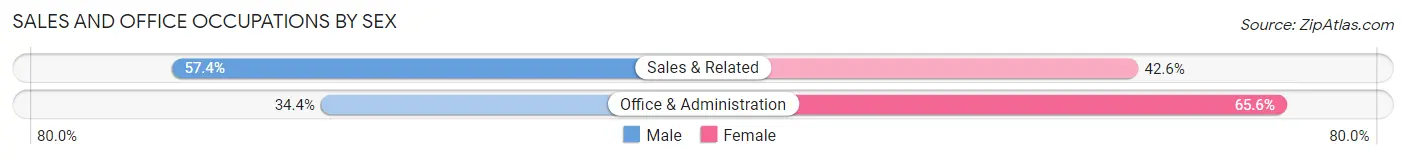
| Occupation | Male | Female |
| Sales & Related | 233 (57.4%) | 173 (42.6%) |
| Office & Administration | 228 (34.4%) | 434 (65.6%) |
| Total (Category) | 461 (43.2%) | 607 (56.8%) |
| Total (Overall) | 2,521 (52.7%) | 2,265 (47.3%) |
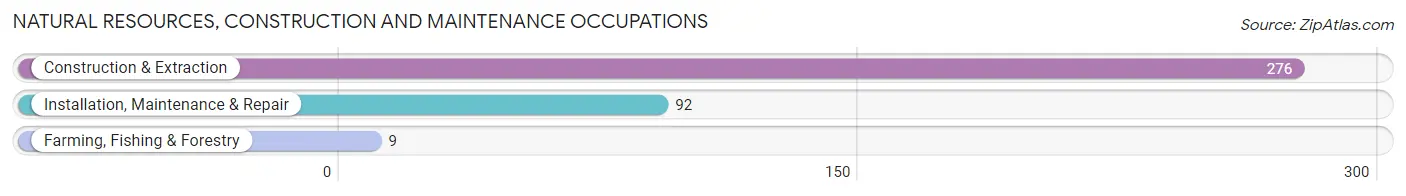
Natural Resources, Construction and Maintenance Occupations
The most common Natural Resources, Construction and Maintenance occupations in Butler borough are Construction & Extraction (276 | 5.8%), Installation, Maintenance & Repair (92 | 1.9%), and Farming, Fishing & Forestry (9 | 0.2%).
Natural Resources, Construction and Maintenance Occupations by Sex
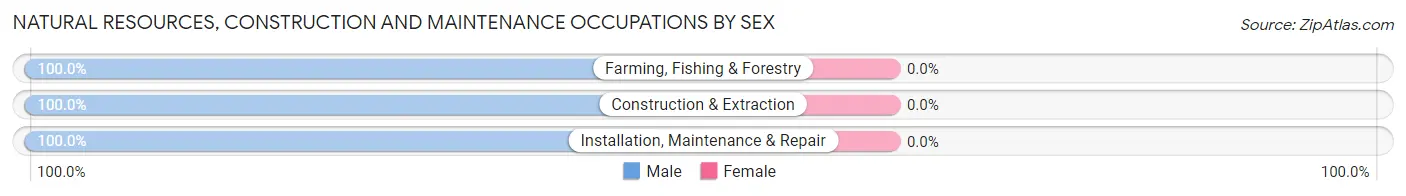
| Occupation | Male | Female |
| Farming, Fishing & Forestry | 9 (100.0%) | 0 (0.0%) |
| Construction & Extraction | 276 (100.0%) | 0 (0.0%) |
| Installation, Maintenance & Repair | 92 (100.0%) | 0 (0.0%) |
| Total (Category) | 377 (100.0%) | 0 (0.0%) |
| Total (Overall) | 2,521 (52.7%) | 2,265 (47.3%) |
Production, Transportation and Moving Occupations
The most common Production, Transportation and Moving occupations in Butler borough are Material Moving (289 | 6.0%), Transportation (174 | 3.6%), and Production (163 | 3.4%).
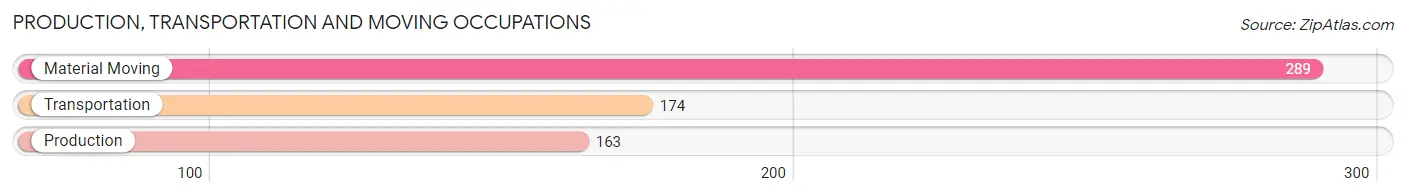
Production, Transportation and Moving Occupations by Sex
| Occupation | Male | Female |
| Production | 143 (87.7%) | 20 (12.3%) |
| Transportation | 144 (82.8%) | 30 (17.2%) |
| Material Moving | 163 (56.4%) | 126 (43.6%) |
| Total (Category) | 450 (71.9%) | 176 (28.1%) |
| Total (Overall) | 2,521 (52.7%) | 2,265 (47.3%) |
Employment Industries by Sex in Butler borough
Employment Industries in Butler borough
The major employment industries in Butler borough include Retail Trade (624 | 13.0%), Educational Services (567 | 11.8%), Manufacturing (514 | 10.7%), Health Care & Social Assistance (467 | 9.8%), and Professional & Scientific (402 | 8.4%).
Employment Industries by Sex in Butler borough
The Butler borough industries that see more men than women are Mining, Quarrying, & Extraction (100.0%), Utilities (100.0%), and Construction (94.6%), whereas the industries that tend to have a higher number of women are Enterprise Management (100.0%), Educational Services (87.3%), and Accommodation & Food Services (83.7%).
| Industry | Male | Female |
| Agriculture, Fishing & Hunting | 0 (0.0%) | 0 (0.0%) |
| Mining, Quarrying, & Extraction | 17 (100.0%) | 0 (0.0%) |
| Construction | 366 (94.6%) | 21 (5.4%) |
| Manufacturing | 372 (72.4%) | 142 (27.6%) |
| Wholesale Trade | 175 (68.1%) | 82 (31.9%) |
| Retail Trade | 358 (57.4%) | 266 (42.6%) |
| Transportation & Warehousing | 115 (43.4%) | 150 (56.6%) |
| Utilities | 27 (100.0%) | 0 (0.0%) |
| Information | 112 (87.5%) | 16 (12.5%) |
| Finance & Insurance | 115 (47.3%) | 128 (52.7%) |
| Real Estate, Rental & Leasing | 30 (21.7%) | 108 (78.3%) |
| Professional & Scientific | 289 (71.9%) | 113 (28.1%) |
| Enterprise Management | 0 (0.0%) | 36 (100.0%) |
| Administrative & Support | 92 (53.2%) | 81 (46.8%) |
| Educational Services | 72 (12.7%) | 495 (87.3%) |
| Health Care & Social Assistance | 131 (28.1%) | 336 (72.0%) |
| Arts, Entertainment & Recreation | 42 (79.2%) | 11 (20.7%) |
| Accommodation & Food Services | 33 (16.3%) | 170 (83.7%) |
| Public Administration | 87 (52.4%) | 79 (47.6%) |
| Total | 2,521 (52.7%) | 2,265 (47.3%) |
Education in Butler borough
School Enrollment in Butler borough
The most common levels of schooling among the 1,617 students in Butler borough are college / undergraduate (446 | 27.6%), middle school (409 | 25.3%), and high school (354 | 21.9%).
| School Level | # Students | % Students |
| Nursery / Preschool | 38 | 2.4% |
| Kindergarten | 22 | 1.4% |
| Elementary School | 278 | 17.2% |
| Middle School | 409 | 25.3% |
| High School | 354 | 21.9% |
| College / Undergraduate | 446 | 27.6% |
| Graduate / Professional | 70 | 4.3% |
| Total | 1,617 | 100.0% |
School Enrollment by Age by Funding Source in Butler borough
Out of a total of 1,617 students who are enrolled in schools in Butler borough, 272 (16.8%) attend a private institution, while the remaining 1,345 (83.2%) are enrolled in public schools. The age group of 35 years and over has the highest likelihood of being enrolled in private schools, with 58 (85.3% in the age bracket) enrolled. Conversely, the age group of 15 to 17 year olds has the lowest likelihood of being enrolled in a private school, with 240 (94.5% in the age bracket) attending a public institution.
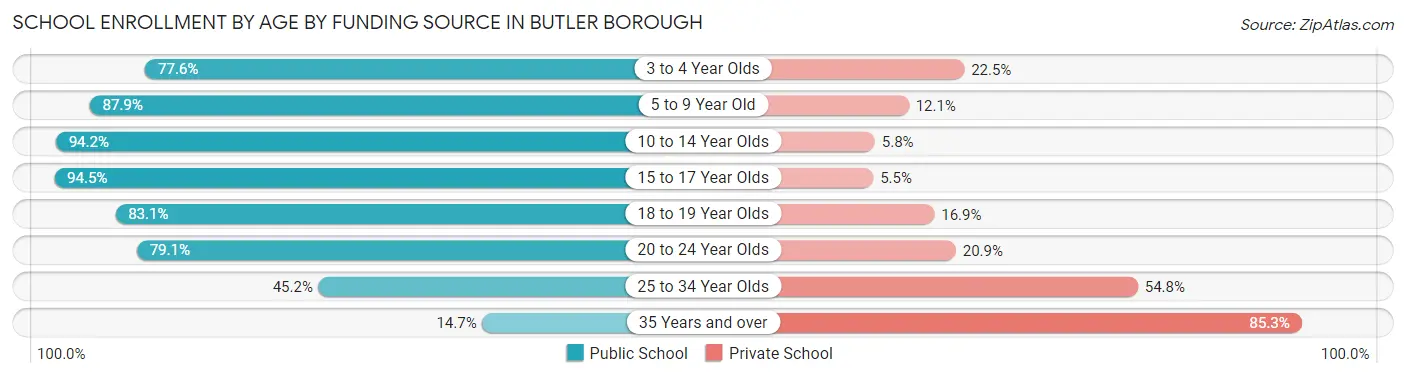
| Age Bracket | Public School | Private School |
| 3 to 4 Year Olds | 38 (77.5%) | 11 (22.5%) |
| 5 to 9 Year Old | 254 (87.9%) | 35 (12.1%) |
| 10 to 14 Year Olds | 422 (94.2%) | 26 (5.8%) |
| 15 to 17 Year Olds | 240 (94.5%) | 14 (5.5%) |
| 18 to 19 Year Olds | 64 (83.1%) | 13 (16.9%) |
| 20 to 24 Year Olds | 284 (79.1%) | 75 (20.9%) |
| 25 to 34 Year Olds | 33 (45.2%) | 40 (54.8%) |
| 35 Years and over | 10 (14.7%) | 58 (85.3%) |
| Total | 1,345 (83.2%) | 272 (16.8%) |
Educational Attainment by Field of Study in Butler borough
Business (486 | 16.7%), education (436 | 15.0%), computers & mathematics (376 | 12.9%), social sciences (271 | 9.3%), and engineering (258 | 8.9%) are the most common fields of study among 2,912 individuals in Butler borough who have obtained a bachelor's degree or higher.
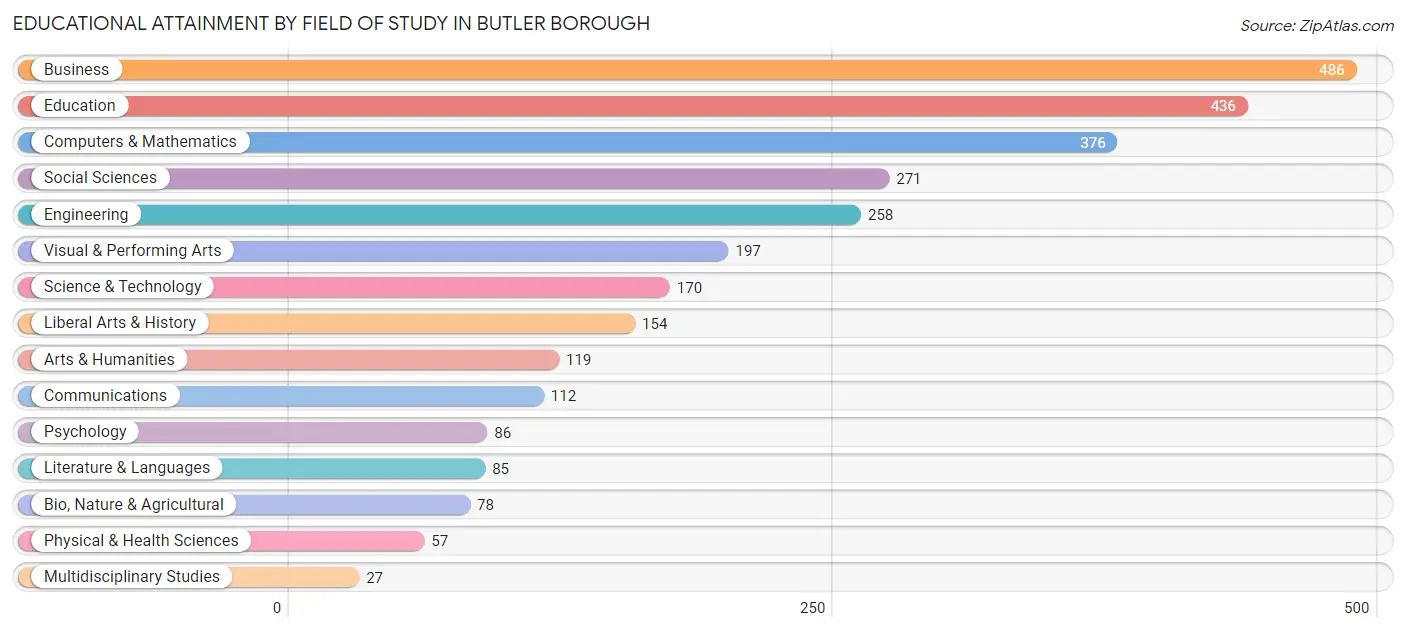
| Field of Study | # Graduates | % Graduates |
| Computers & Mathematics | 376 | 12.9% |
| Bio, Nature & Agricultural | 78 | 2.7% |
| Physical & Health Sciences | 57 | 2.0% |
| Psychology | 86 | 2.9% |
| Social Sciences | 271 | 9.3% |
| Engineering | 258 | 8.9% |
| Multidisciplinary Studies | 27 | 0.9% |
| Science & Technology | 170 | 5.8% |
| Business | 486 | 16.7% |
| Education | 436 | 15.0% |
| Literature & Languages | 85 | 2.9% |
| Liberal Arts & History | 154 | 5.3% |
| Visual & Performing Arts | 197 | 6.8% |
| Communications | 112 | 3.8% |
| Arts & Humanities | 119 | 4.1% |
| Total | 2,912 | 100.0% |
Transportation & Commute in Butler borough
Vehicle Availability by Sex in Butler borough
The most prevalent vehicle ownership categories in Butler borough are males with 2 vehicles (1,262, accounting for 51.3%) and females with 2 vehicles (1,110, making up 55.9%).
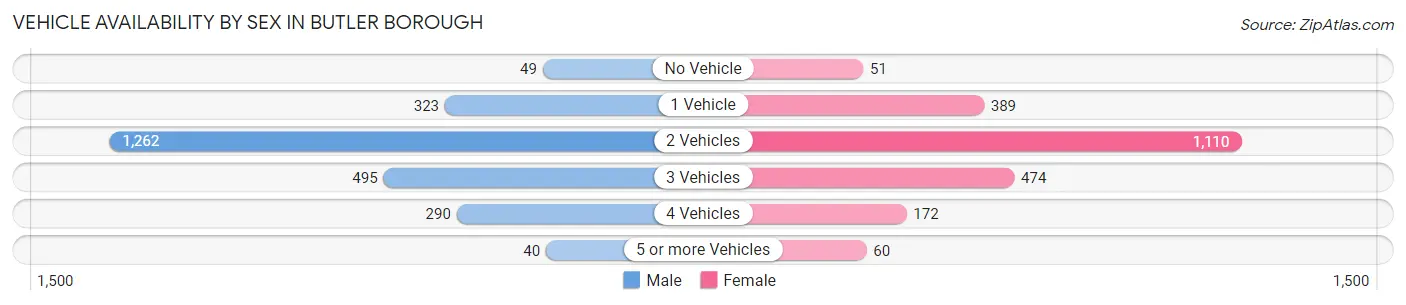
| Vehicles Available | Male | Female |
| No Vehicle | 49 (2.0%) | 51 (2.3%) |
| 1 Vehicle | 323 (13.1%) | 389 (17.2%) |
| 2 Vehicles | 1,262 (51.3%) | 1,110 (49.2%) |
| 3 Vehicles | 495 (20.1%) | 474 (21.0%) |
| 4 Vehicles | 290 (11.8%) | 172 (7.6%) |
| 5 or more Vehicles | 40 (1.6%) | 60 (2.7%) |
| Total | 2,459 (100.0%) | 2,256 (100.0%) |
Commute Time in Butler borough
The most frequently occuring commute durations in Butler borough are 30 to 34 minutes (751 commuters, 18.2%), 20 to 24 minutes (552 commuters, 13.4%), and 45 to 59 minutes (495 commuters, 12.0%).
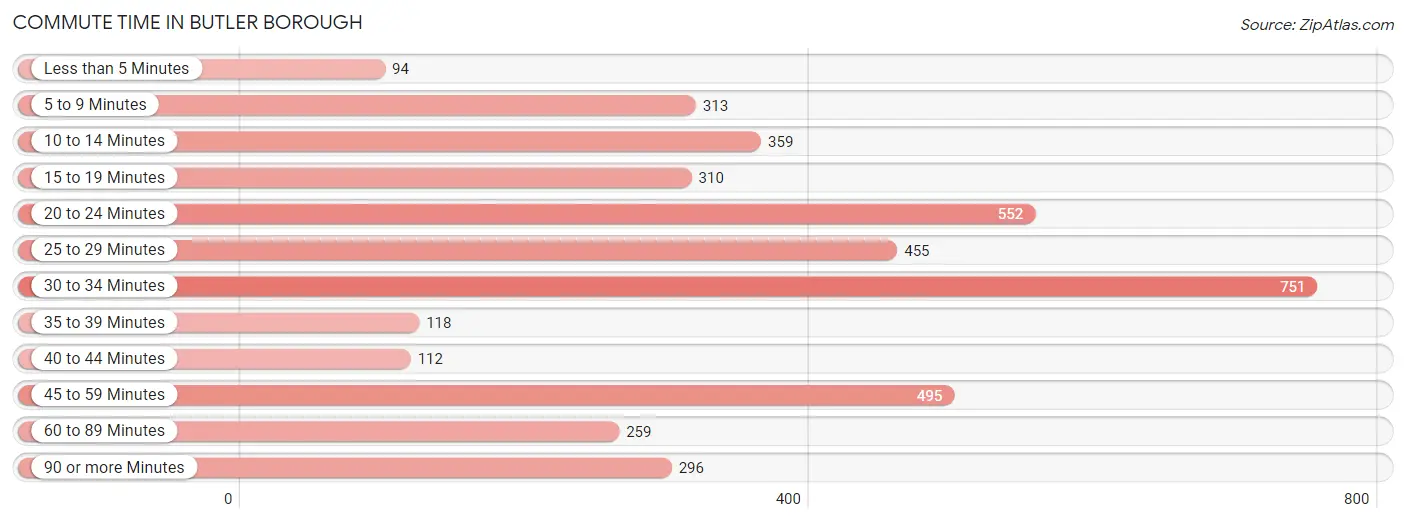
| Commute Time | # Commuters | % Commuters |
| Less than 5 Minutes | 94 | 2.3% |
| 5 to 9 Minutes | 313 | 7.6% |
| 10 to 14 Minutes | 359 | 8.7% |
| 15 to 19 Minutes | 310 | 7.5% |
| 20 to 24 Minutes | 552 | 13.4% |
| 25 to 29 Minutes | 455 | 11.1% |
| 30 to 34 Minutes | 751 | 18.2% |
| 35 to 39 Minutes | 118 | 2.9% |
| 40 to 44 Minutes | 112 | 2.7% |
| 45 to 59 Minutes | 495 | 12.0% |
| 60 to 89 Minutes | 259 | 6.3% |
| 90 or more Minutes | 296 | 7.2% |
Commute Time by Sex in Butler borough
The most common commute times in Butler borough are 30 to 34 minutes (438 commuters, 20.0%) for males and 30 to 34 minutes (313 commuters, 16.3%) for females.
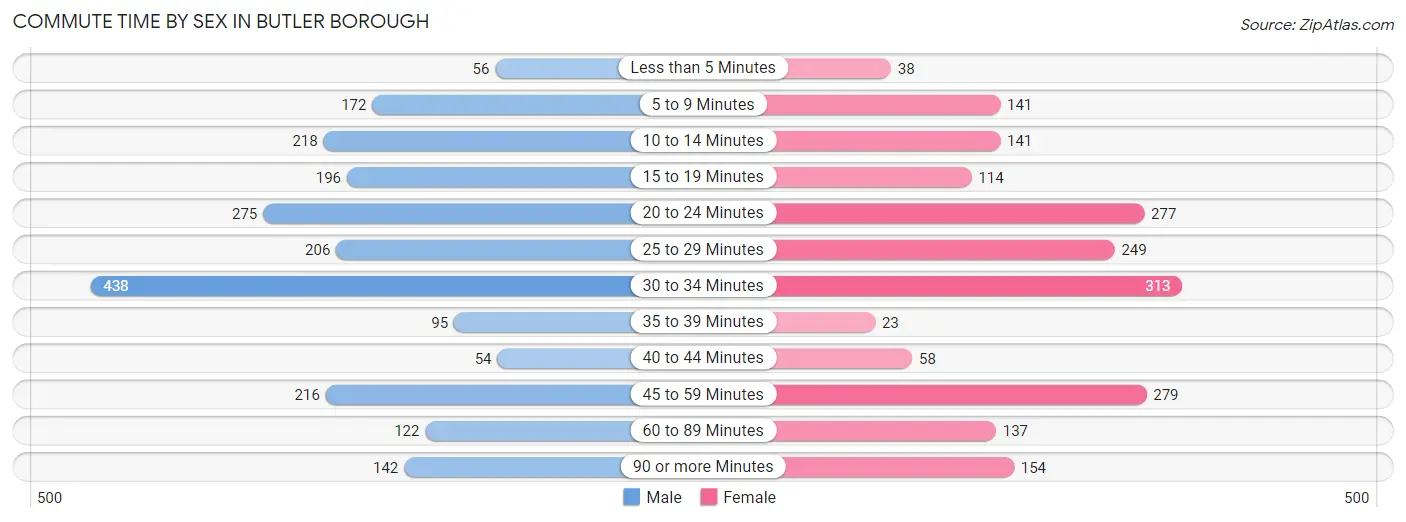
| Commute Time | Male | Female |
| Less than 5 Minutes | 56 (2.6%) | 38 (2.0%) |
| 5 to 9 Minutes | 172 (7.9%) | 141 (7.3%) |
| 10 to 14 Minutes | 218 (10.0%) | 141 (7.3%) |
| 15 to 19 Minutes | 196 (8.9%) | 114 (5.9%) |
| 20 to 24 Minutes | 275 (12.6%) | 277 (14.4%) |
| 25 to 29 Minutes | 206 (9.4%) | 249 (12.9%) |
| 30 to 34 Minutes | 438 (20.0%) | 313 (16.3%) |
| 35 to 39 Minutes | 95 (4.3%) | 23 (1.2%) |
| 40 to 44 Minutes | 54 (2.5%) | 58 (3.0%) |
| 45 to 59 Minutes | 216 (9.9%) | 279 (14.5%) |
| 60 to 89 Minutes | 122 (5.6%) | 137 (7.1%) |
| 90 or more Minutes | 142 (6.5%) | 154 (8.0%) |
Time of Departure to Work by Sex in Butler borough
The most frequent times of departure to work in Butler borough are 7:30 AM to 7:59 AM (365, 16.7%) for males and 7:30 AM to 7:59 AM (322, 16.7%) for females.
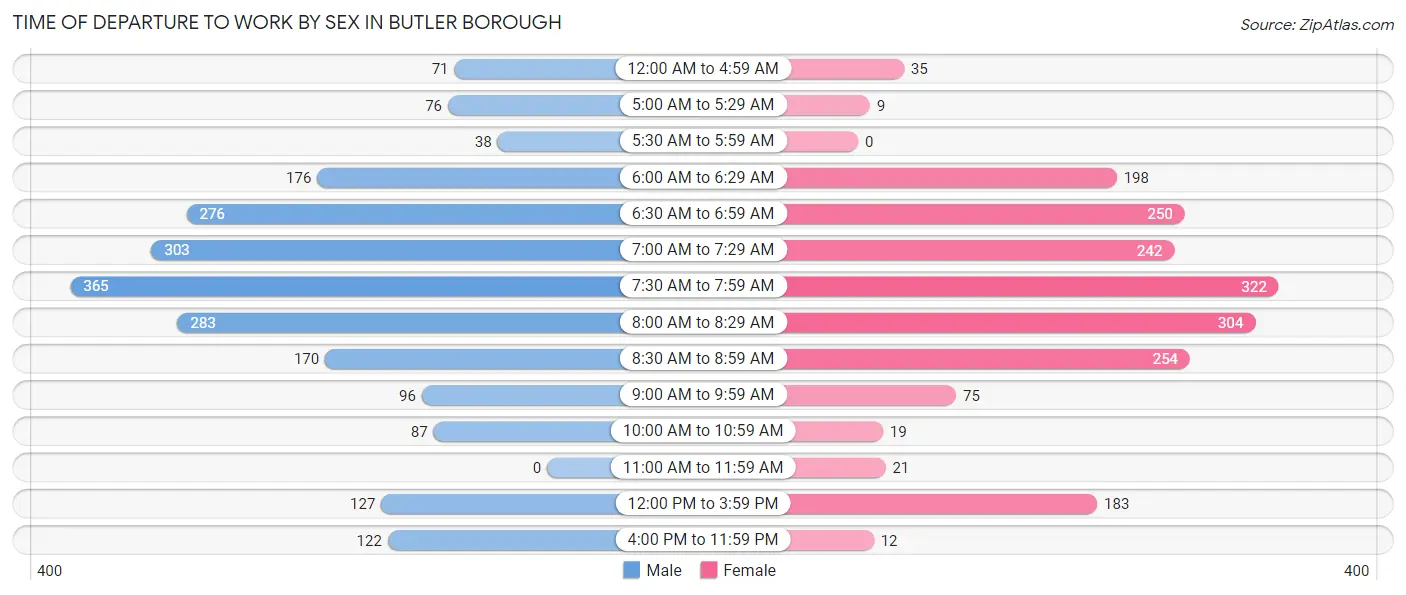
| Time of Departure | Male | Female |
| 12:00 AM to 4:59 AM | 71 (3.2%) | 35 (1.8%) |
| 5:00 AM to 5:29 AM | 76 (3.5%) | 9 (0.5%) |
| 5:30 AM to 5:59 AM | 38 (1.7%) | 0 (0.0%) |
| 6:00 AM to 6:29 AM | 176 (8.0%) | 198 (10.3%) |
| 6:30 AM to 6:59 AM | 276 (12.6%) | 250 (13.0%) |
| 7:00 AM to 7:29 AM | 303 (13.8%) | 242 (12.6%) |
| 7:30 AM to 7:59 AM | 365 (16.7%) | 322 (16.7%) |
| 8:00 AM to 8:29 AM | 283 (12.9%) | 304 (15.8%) |
| 8:30 AM to 8:59 AM | 170 (7.8%) | 254 (13.2%) |
| 9:00 AM to 9:59 AM | 96 (4.4%) | 75 (3.9%) |
| 10:00 AM to 10:59 AM | 87 (4.0%) | 19 (1.0%) |
| 11:00 AM to 11:59 AM | 0 (0.0%) | 21 (1.1%) |
| 12:00 PM to 3:59 PM | 127 (5.8%) | 183 (9.5%) |
| 4:00 PM to 11:59 PM | 122 (5.6%) | 12 (0.6%) |
| Total | 2,190 (100.0%) | 1,924 (100.0%) |
Housing Occupancy in Butler borough
Occupancy by Ownership in Butler borough
Of the total 3,482 dwellings in Butler borough, owner-occupied units account for 2,372 (68.1%), while renter-occupied units make up 1,110 (31.9%).
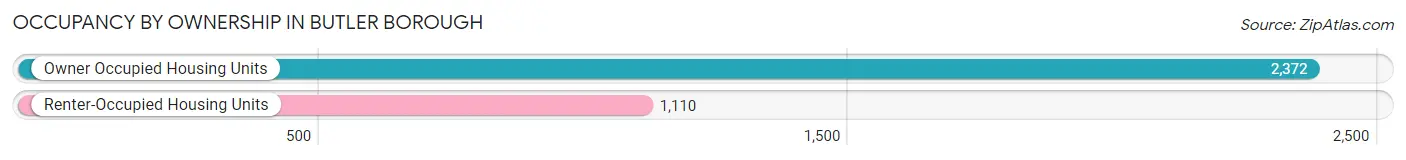
| Occupancy | # Housing Units | % Housing Units |
| Owner Occupied Housing Units | 2,372 | 68.1% |
| Renter-Occupied Housing Units | 1,110 | 31.9% |
| Total Occupied Housing Units | 3,482 | 100.0% |
Occupancy by Household Size in Butler borough
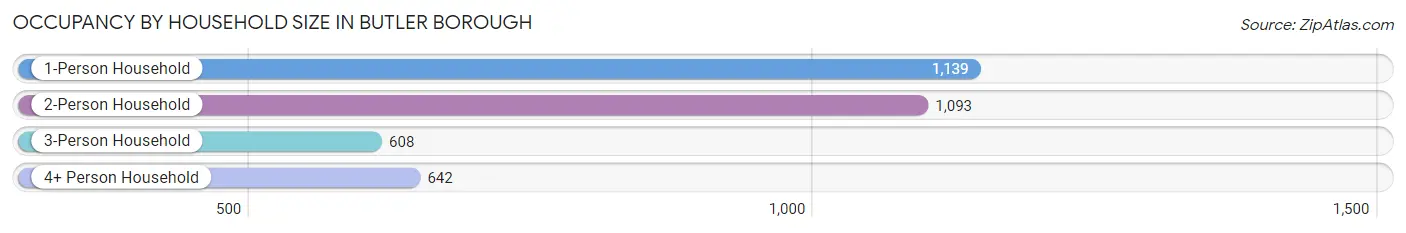
| Household Size | # Housing Units | % Housing Units |
| 1-Person Household | 1,139 | 32.7% |
| 2-Person Household | 1,093 | 31.4% |
| 3-Person Household | 608 | 17.5% |
| 4+ Person Household | 642 | 18.4% |
| Total Housing Units | 3,482 | 100.0% |
Occupancy by Ownership by Household Size in Butler borough
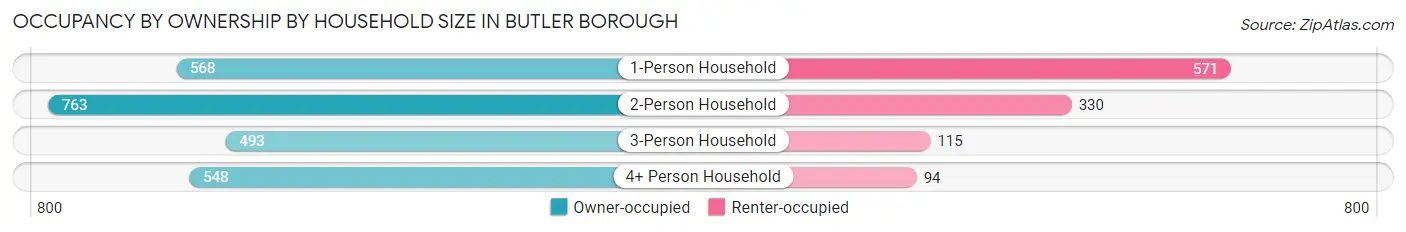
| Household Size | Owner-occupied | Renter-occupied |
| 1-Person Household | 568 (49.9%) | 571 (50.1%) |
| 2-Person Household | 763 (69.8%) | 330 (30.2%) |
| 3-Person Household | 493 (81.1%) | 115 (18.9%) |
| 4+ Person Household | 548 (85.4%) | 94 (14.6%) |
| Total Housing Units | 2,372 (68.1%) | 1,110 (31.9%) |
Occupancy by Educational Attainment in Butler borough
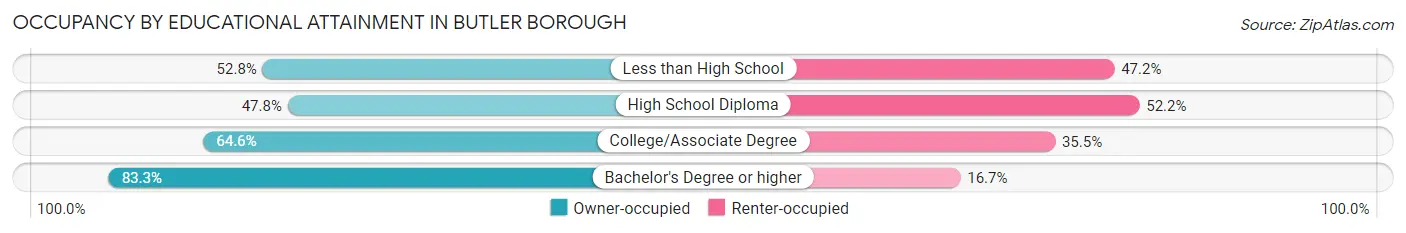
| Household Size | Owner-occupied | Renter-occupied |
| Less than High School | 85 (52.8%) | 76 (47.2%) |
| High School Diploma | 408 (47.8%) | 445 (52.2%) |
| College/Associate Degree | 610 (64.5%) | 335 (35.4%) |
| Bachelor's Degree or higher | 1,269 (83.3%) | 254 (16.7%) |
Occupancy by Age of Householder in Butler borough
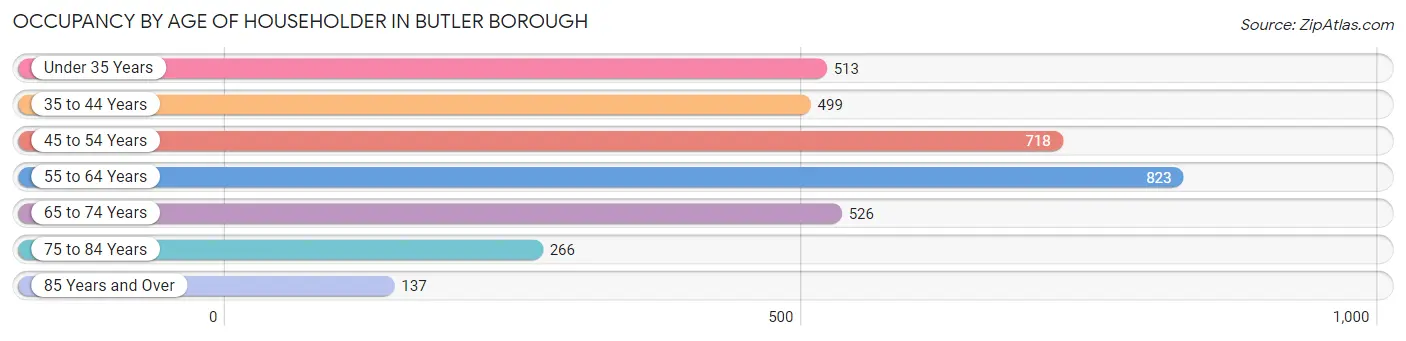
| Age Bracket | # Households | % Households |
| Under 35 Years | 513 | 14.7% |
| 35 to 44 Years | 499 | 14.3% |
| 45 to 54 Years | 718 | 20.6% |
| 55 to 64 Years | 823 | 23.6% |
| 65 to 74 Years | 526 | 15.1% |
| 75 to 84 Years | 266 | 7.6% |
| 85 Years and Over | 137 | 3.9% |
| Total | 3,482 | 100.0% |
Housing Finances in Butler borough
Median Income by Occupancy in Butler borough
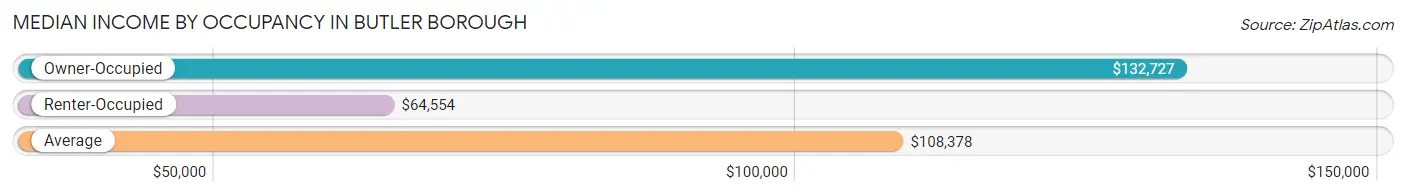
| Occupancy Type | # Households | Median Income |
| Owner-Occupied | 2,372 (68.1%) | $132,727 |
| Renter-Occupied | 1,110 (31.9%) | $64,554 |
| Average | 3,482 (100.0%) | $108,378 |
Occupancy by Householder Income Bracket in Butler borough
| Income Bracket | Owner-occupied | Renter-occupied |
| Less than $5,000 | 9 (0.4%) | 62 (5.6%) |
| $5,000 to $9,999 | 0 (0.0%) | 85 (7.7%) |
| $10,000 to $14,999 | 0 (0.0%) | 77 (6.9%) |
| $15,000 to $19,999 | 17 (0.7%) | 12 (1.1%) |
| $20,000 to $24,999 | 9 (0.4%) | 66 (5.9%) |
| $25,000 to $34,999 | 65 (2.7%) | 74 (6.7%) |
| $35,000 to $49,999 | 89 (3.7%) | 94 (8.5%) |
| $50,000 to $74,999 | 284 (12.0%) | 130 (11.7%) |
| $75,000 to $99,999 | 264 (11.1%) | 234 (21.1%) |
| $100,000 to $149,999 | 720 (30.3%) | 196 (17.7%) |
| $150,000 or more | 915 (38.6%) | 80 (7.2%) |
| Total | 2,372 (100.0%) | 1,110 (100.0%) |
Monthly Housing Cost Tiers in Butler borough
| Monthly Cost | Owner-occupied | Renter-occupied |
| Less than $300 | 0 (0.0%) | 64 (5.8%) |
| $300 to $499 | 36 (1.5%) | 60 (5.4%) |
| $500 to $799 | 11 (0.5%) | 17 (1.5%) |
| $800 to $999 | 42 (1.8%) | 32 (2.9%) |
| $1,000 to $1,499 | 487 (20.5%) | 413 (37.2%) |
| $1,500 to $1,999 | 376 (15.9%) | 428 (38.6%) |
| $2,000 to $2,499 | 404 (17.0%) | 51 (4.6%) |
| $2,500 to $2,999 | 241 (10.2%) | 15 (1.3%) |
| $3,000 or more | 775 (32.7%) | 15 (1.3%) |
| Total | 2,372 (100.0%) | 1,110 (100.0%) |
Physical Housing Characteristics in Butler borough
Housing Structures in Butler borough
| Structure Type | # Housing Units | % Housing Units |
| Single Unit, Detached | 2,015 | 57.9% |
| Single Unit, Attached | 269 | 7.7% |
| 2 Unit Apartments | 358 | 10.3% |
| 3 or 4 Unit Apartments | 126 | 3.6% |
| 5 to 9 Unit Apartments | 117 | 3.4% |
| 10 or more Apartments | 597 | 17.2% |
| Mobile Home / Other | 0 | 0.0% |
| Total | 3,482 | 100.0% |
Housing Structures by Occupancy in Butler borough
| Structure Type | Owner-occupied | Renter-occupied |
| Single Unit, Detached | 1,883 (93.4%) | 132 (6.6%) |
| Single Unit, Attached | 199 (74.0%) | 70 (26.0%) |
| 2 Unit Apartments | 102 (28.5%) | 256 (71.5%) |
| 3 or 4 Unit Apartments | 0 (0.0%) | 126 (100.0%) |
| 5 to 9 Unit Apartments | 33 (28.2%) | 84 (71.8%) |
| 10 or more Apartments | 155 (26.0%) | 442 (74.0%) |
| Mobile Home / Other | 0 (0.0%) | 0 (0.0%) |
| Total | 2,372 (68.1%) | 1,110 (31.9%) |
Housing Structures by Number of Rooms in Butler borough
| Number of Rooms | Owner-occupied | Renter-occupied |
| 1 Room | 11 (0.5%) | 36 (3.2%) |
| 2 or 3 Rooms | 88 (3.7%) | 409 (36.8%) |
| 4 or 5 Rooms | 543 (22.9%) | 514 (46.3%) |
| 6 or 7 Rooms | 959 (40.4%) | 126 (11.4%) |
| 8 or more Rooms | 771 (32.5%) | 25 (2.2%) |
| Total | 2,372 (100.0%) | 1,110 (100.0%) |
Housing Structure by Heating Type in Butler borough
| Heating Type | Owner-occupied | Renter-occupied |
| Utility Gas | 2,173 (91.6%) | 674 (60.7%) |
| Bottled, Tank, or LP Gas | 18 (0.8%) | 23 (2.1%) |
| Electricity | 105 (4.4%) | 362 (32.6%) |
| Fuel Oil or Kerosene | 76 (3.2%) | 51 (4.6%) |
| Coal or Coke | 0 (0.0%) | 0 (0.0%) |
| All other Fuels | 0 (0.0%) | 0 (0.0%) |
| No Fuel Used | 0 (0.0%) | 0 (0.0%) |
| Total | 2,372 (100.0%) | 1,110 (100.0%) |
Household Vehicle Usage in Butler borough
| Vehicles per Household | Owner-occupied | Renter-occupied |
| No Vehicle | 65 (2.7%) | 173 (15.6%) |
| 1 Vehicle | 573 (24.2%) | 504 (45.4%) |
| 2 Vehicles | 1,179 (49.7%) | 361 (32.5%) |
| 3 or more Vehicles | 555 (23.4%) | 72 (6.5%) |
| Total | 2,372 (100.0%) | 1,110 (100.0%) |
Real Estate & Mortgages in Butler borough
Real Estate and Mortgage Overview in Butler borough
| Characteristic | Without Mortgage | With Mortgage |
| Housing Units | 605 | 1,767 |
| Median Property Value | $399,100 | $396,100 |
| Median Household Income | $75,078 | $755 |
| Monthly Housing Costs | $1,198 | $775 |
| Real Estate Taxes | $9,367 | $7 |
Property Value by Mortgage Status in Butler borough
| Property Value | Without Mortgage | With Mortgage |
| Less than $50,000 | 0 (0.0%) | 0 (0.0%) |
| $50,000 to $99,999 | 0 (0.0%) | 0 (0.0%) |
| $100,000 to $299,999 | 138 (22.8%) | 225 (12.7%) |
| $300,000 to $499,999 | 387 (64.0%) | 1,165 (65.9%) |
| $500,000 to $749,999 | 80 (13.2%) | 344 (19.5%) |
| $750,000 to $999,999 | 0 (0.0%) | 8 (0.4%) |
| $1,000,000 or more | 0 (0.0%) | 25 (1.4%) |
| Total | 605 (100.0%) | 1,767 (100.0%) |
Household Income by Mortgage Status in Butler borough
| Household Income | Without Mortgage | With Mortgage |
| Less than $10,000 | 9 (1.5%) | 55 (3.1%) |
| $10,000 to $24,999 | 17 (2.8%) | 0 (0.0%) |
| $25,000 to $34,999 | 58 (9.6%) | 9 (0.5%) |
| $35,000 to $49,999 | 66 (10.9%) | 7 (0.4%) |
| $50,000 to $74,999 | 152 (25.1%) | 23 (1.3%) |
| $75,000 to $99,999 | 57 (9.4%) | 132 (7.5%) |
| $100,000 to $149,999 | 86 (14.2%) | 207 (11.7%) |
| $150,000 or more | 160 (26.5%) | 634 (35.9%) |
| Total | 605 (100.0%) | 1,767 (100.0%) |
Property Value to Household Income Ratio in Butler borough
| Value-to-Income Ratio | Without Mortgage | With Mortgage |
| Less than 2.0x | 55 (9.1%) | 140,868 (7,972.2%) |
| 2.0x to 2.9x | 142 (23.5%) | 293 (16.6%) |
| 3.0x to 3.9x | 44 (7.3%) | 711 (40.2%) |
| 4.0x or more | 355 (58.7%) | 386 (21.8%) |
| Total | 605 (100.0%) | 1,767 (100.0%) |
Real Estate Taxes by Mortgage Status in Butler borough
| Property Taxes | Without Mortgage | With Mortgage |
| Less than $800 | 0 (0.0%) | 0 (0.0%) |
| $800 to $1,499 | 25 (4.1%) | 0 (0.0%) |
| $800 to $1,499 | 580 (95.9%) | 0 (0.0%) |
| Total | 605 (100.0%) | 1,767 (100.0%) |
Health & Disability in Butler borough
Health Insurance Coverage by Age in Butler borough
| Age Bracket | With Coverage | Without Coverage |
| Under 6 Years | 246 (100.0%) | 0 (0.0%) |
| 6 to 18 Years | 1,033 (99.3%) | 7 (0.7%) |
| 19 to 25 Years | 783 (100.0%) | 0 (0.0%) |
| 26 to 34 Years | 938 (94.5%) | 55 (5.5%) |
| 35 to 44 Years | 989 (87.6%) | 140 (12.4%) |
| 45 to 54 Years | 1,238 (96.1%) | 50 (3.9%) |
| 55 to 64 Years | 1,166 (97.0%) | 36 (3.0%) |
| 65 to 74 Years | 862 (100.0%) | 0 (0.0%) |
| 75 Years and older | 502 (100.0%) | 0 (0.0%) |
| Total | 7,757 (96.4%) | 288 (3.6%) |
Health Insurance Coverage by Citizenship Status in Butler borough
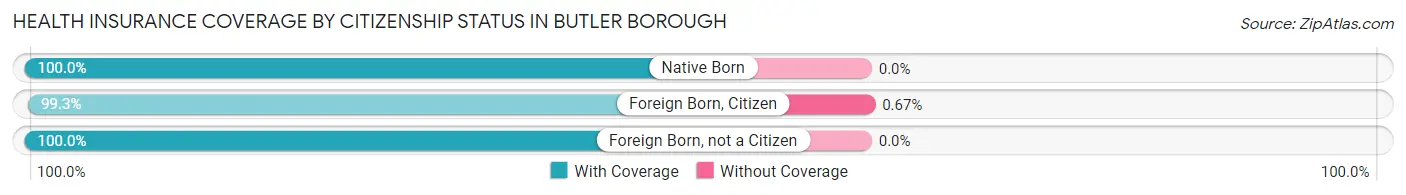
| Citizenship Status | With Coverage | Without Coverage |
| Native Born | 246 (100.0%) | 0 (0.0%) |
| Foreign Born, Citizen | 1,033 (99.3%) | 7 (0.7%) |
| Foreign Born, not a Citizen | 783 (100.0%) | 0 (0.0%) |
Health Insurance Coverage by Household Income in Butler borough
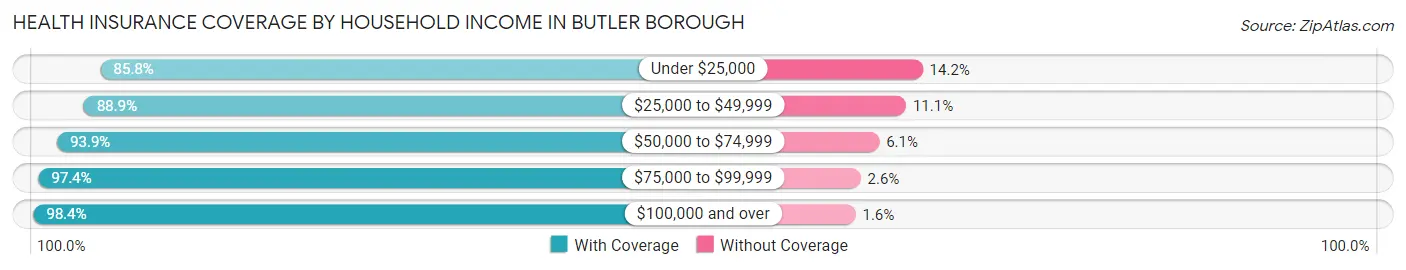
| Household Income | With Coverage | Without Coverage |
| Under $25,000 | 320 (85.8%) | 53 (14.2%) |
| $25,000 to $49,999 | 585 (88.9%) | 73 (11.1%) |
| $50,000 to $74,999 | 557 (93.9%) | 36 (6.1%) |
| $75,000 to $99,999 | 981 (97.4%) | 26 (2.6%) |
| $100,000 and over | 5,281 (98.4%) | 88 (1.6%) |
Public vs Private Health Insurance Coverage by Age in Butler borough
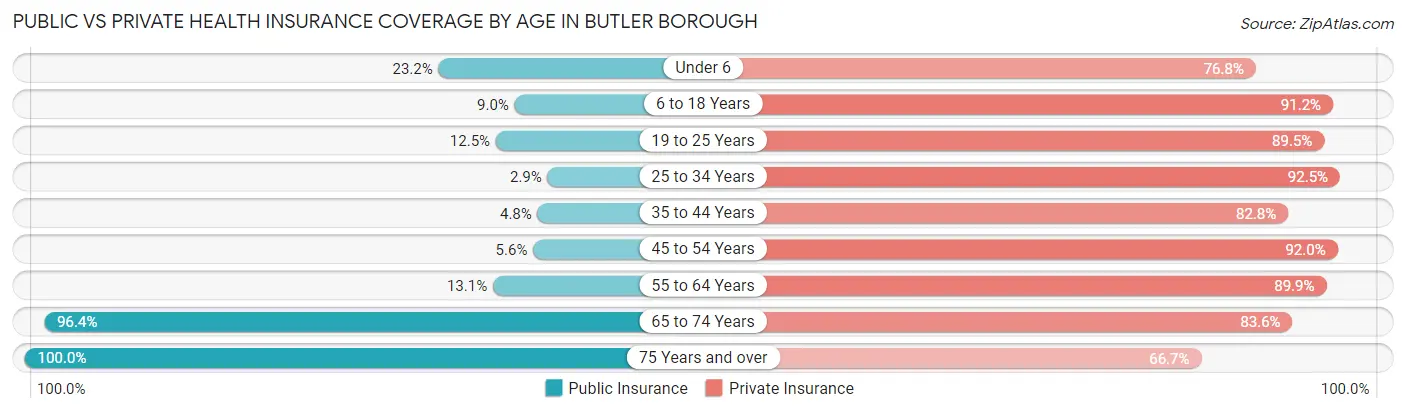
| Age Bracket | Public Insurance | Private Insurance |
| Under 6 | 57 (23.2%) | 189 (76.8%) |
| 6 to 18 Years | 94 (9.0%) | 948 (91.1%) |
| 19 to 25 Years | 98 (12.5%) | 701 (89.5%) |
| 25 to 34 Years | 29 (2.9%) | 918 (92.4%) |
| 35 to 44 Years | 54 (4.8%) | 935 (82.8%) |
| 45 to 54 Years | 72 (5.6%) | 1,185 (92.0%) |
| 55 to 64 Years | 157 (13.1%) | 1,081 (89.9%) |
| 65 to 74 Years | 831 (96.4%) | 721 (83.6%) |
| 75 Years and over | 502 (100.0%) | 335 (66.7%) |
| Total | 1,894 (23.5%) | 7,013 (87.2%) |
Disability Status by Sex by Age in Butler borough
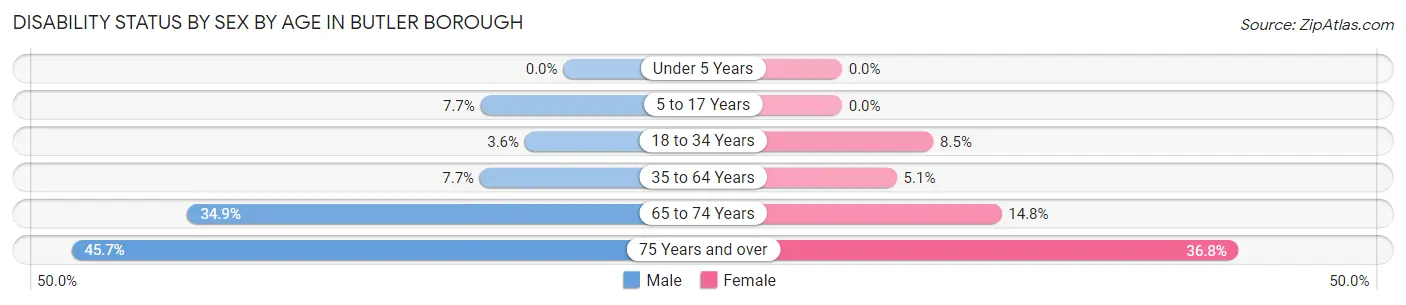
| Age Bracket | Male | Female |
| Under 5 Years | 0 (0.0%) | 0 (0.0%) |
| 5 to 17 Years | 49 (7.7%) | 0 (0.0%) |
| 18 to 34 Years | 37 (3.6%) | 67 (8.5%) |
| 35 to 64 Years | 134 (7.7%) | 96 (5.1%) |
| 65 to 74 Years | 150 (34.9%) | 64 (14.8%) |
| 75 Years and over | 42 (45.7%) | 151 (36.8%) |
Disability Class by Sex by Age in Butler borough
Disability Class: Hearing Difficulty
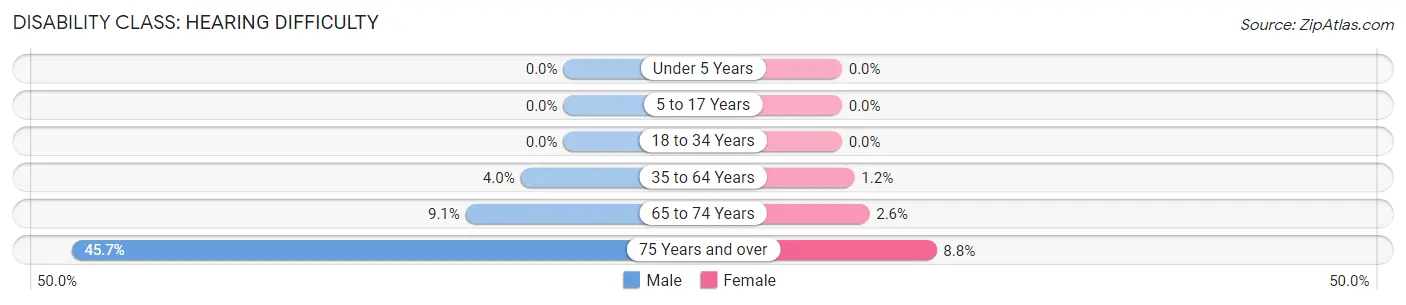
| Age Bracket | Male | Female |
| Under 5 Years | 0 (0.0%) | 0 (0.0%) |
| 5 to 17 Years | 0 (0.0%) | 0 (0.0%) |
| 18 to 34 Years | 0 (0.0%) | 0 (0.0%) |
| 35 to 64 Years | 69 (4.0%) | 22 (1.2%) |
| 65 to 74 Years | 39 (9.1%) | 11 (2.5%) |
| 75 Years and over | 42 (45.7%) | 36 (8.8%) |
Disability Class: Vision Difficulty
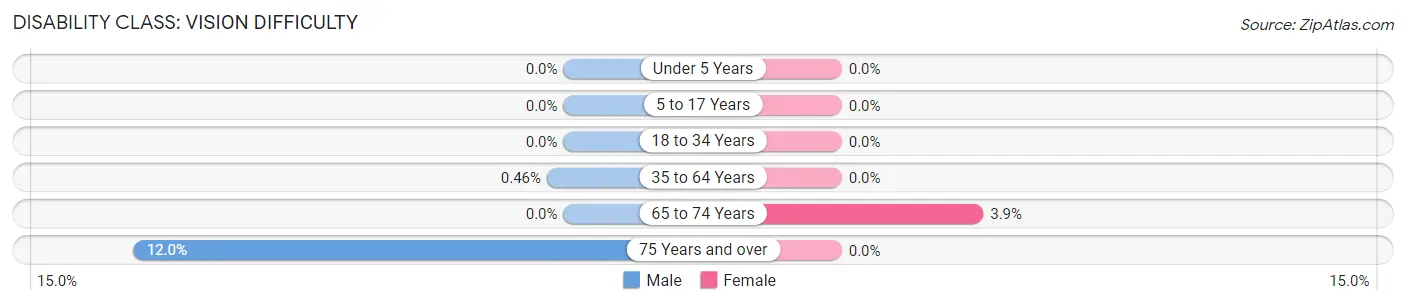
| Age Bracket | Male | Female |
| Under 5 Years | 0 (0.0%) | 0 (0.0%) |
| 5 to 17 Years | 0 (0.0%) | 0 (0.0%) |
| 18 to 34 Years | 0 (0.0%) | 0 (0.0%) |
| 35 to 64 Years | 8 (0.5%) | 0 (0.0%) |
| 65 to 74 Years | 0 (0.0%) | 17 (3.9%) |
| 75 Years and over | 11 (12.0%) | 0 (0.0%) |
Disability Class: Cognitive Difficulty
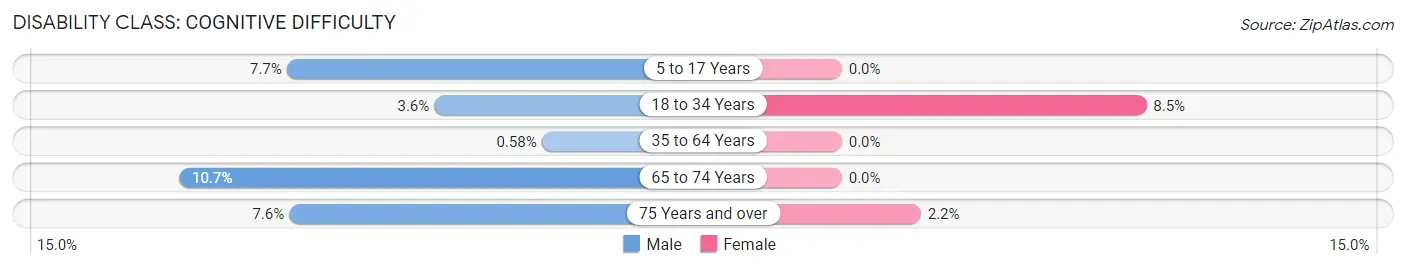
| Age Bracket | Male | Female |
| 5 to 17 Years | 49 (7.7%) | 0 (0.0%) |
| 18 to 34 Years | 37 (3.6%) | 67 (8.5%) |
| 35 to 64 Years | 10 (0.6%) | 0 (0.0%) |
| 65 to 74 Years | 46 (10.7%) | 0 (0.0%) |
| 75 Years and over | 7 (7.6%) | 9 (2.2%) |
Disability Class: Ambulatory Difficulty
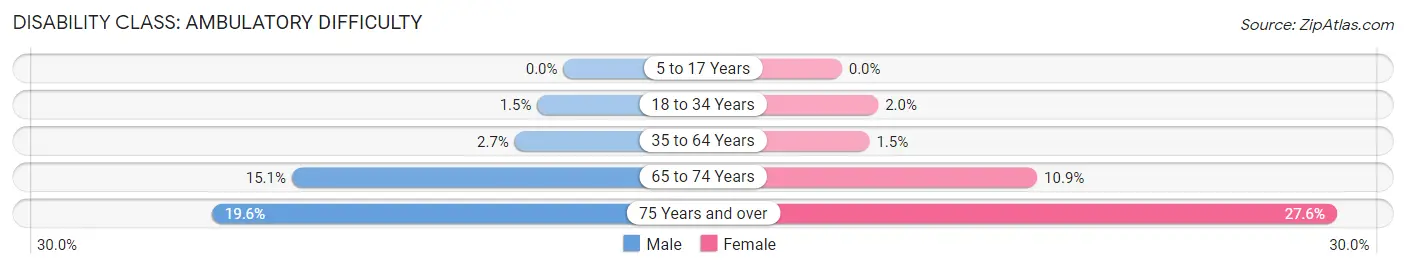
| Age Bracket | Male | Female |
| 5 to 17 Years | 0 (0.0%) | 0 (0.0%) |
| 18 to 34 Years | 15 (1.5%) | 16 (2.0%) |
| 35 to 64 Years | 47 (2.7%) | 29 (1.5%) |
| 65 to 74 Years | 65 (15.1%) | 47 (10.9%) |
| 75 Years and over | 18 (19.6%) | 113 (27.6%) |
Disability Class: Self-Care Difficulty
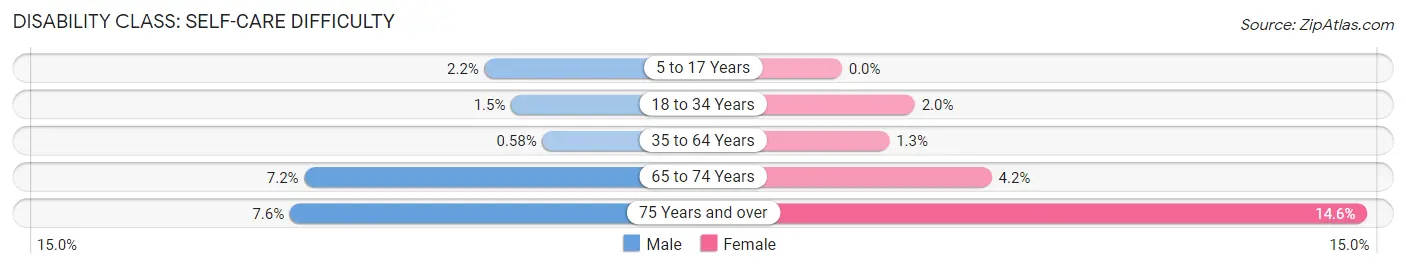
| Age Bracket | Male | Female |
| 5 to 17 Years | 14 (2.2%) | 0 (0.0%) |
| 18 to 34 Years | 15 (1.5%) | 16 (2.0%) |
| 35 to 64 Years | 10 (0.6%) | 25 (1.3%) |
| 65 to 74 Years | 31 (7.2%) | 18 (4.2%) |
| 75 Years and over | 7 (7.6%) | 60 (14.6%) |
Technology Access in Butler borough
Computing Device Access in Butler borough
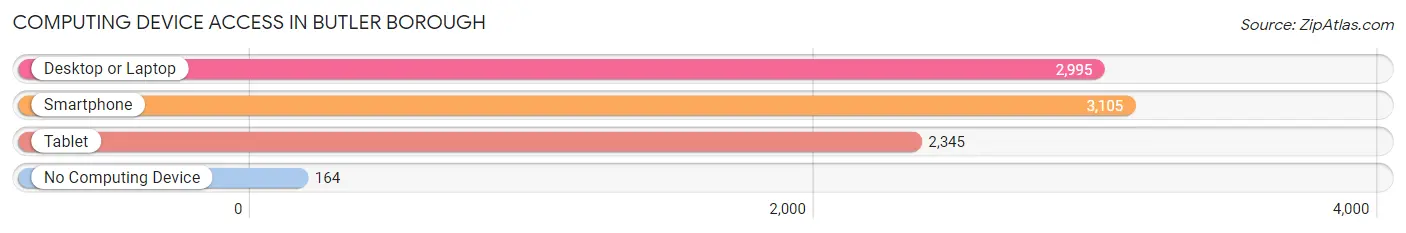
| Device Type | # Households | % Households |
| Desktop or Laptop | 2,995 | 86.0% |
| Smartphone | 3,105 | 89.2% |
| Tablet | 2,345 | 67.3% |
| No Computing Device | 164 | 4.7% |
| Total | 3,482 | 100.0% |
Internet Access in Butler borough
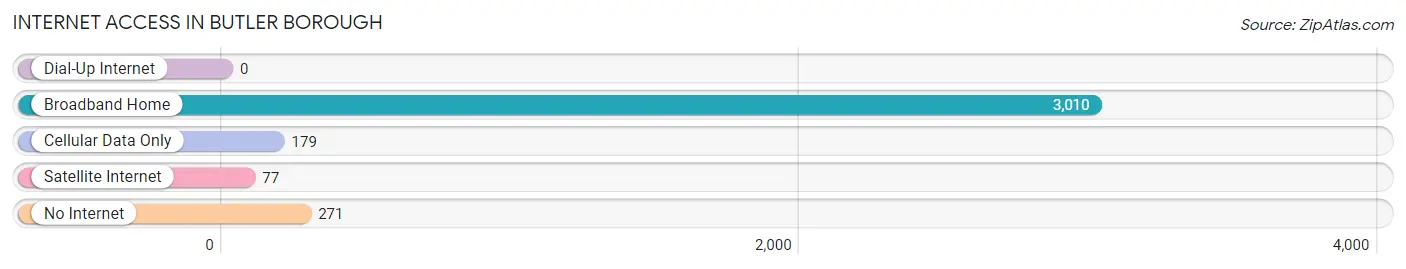
| Internet Type | # Households | % Households |
| Dial-Up Internet | 0 | 0.0% |
| Broadband Home | 3,010 | 86.4% |
| Cellular Data Only | 179 | 5.1% |
| Satellite Internet | 77 | 2.2% |
| No Internet | 271 | 7.8% |
| Total | 3,482 | 100.0% |
Butler borough Summary
Butler Borough is a small borough located in Morris County, New Jersey. It is situated in the northern part of the state, about 25 miles from New York City. The borough was incorporated in 1904 and has a population of about 8,000 people.
Geography
Butler Borough is located in the northern part of Morris County, New Jersey. It is situated between the towns of Kinnelon and Bloomingdale. The borough is bordered by the Passaic River to the east and the Pequannock River to the west. The borough is approximately 25 miles from New York City and is accessible by car via Route 23.
The borough is made up of two distinct areas: the downtown area and the residential area. The downtown area is located in the center of the borough and is home to a variety of businesses, including restaurants, shops, and offices. The residential area is located in the northern part of the borough and is made up of single-family homes, townhouses, and condominiums.
History
Butler Borough was originally part of the Lenape Native American territory. The area was first settled by Europeans in the late 17th century. The borough was officially incorporated in 1904 and was named after General Richard Butler, a Revolutionary War hero.
In the early 20th century, Butler Borough was a rural farming community. The borough began to grow in the 1950s and 1960s, as more people moved to the area. The borough experienced a population boom in the 1970s and 1980s, as more people moved to the area for its proximity to New York City.
Economy
Butler Borough has a diverse economy. The borough is home to a variety of businesses, including restaurants, shops, and offices. The borough is also home to several manufacturing companies, including a paper mill and a plastics factory.
The borough is also home to several large employers, including a hospital, a college, and a shopping mall. The borough is also home to several small businesses, including restaurants, shops, and offices.
Demographics
As of the 2010 census, the population of Butler Borough was 8,000. The racial makeup of the borough was 79.3% White, 11.2% African American, 0.3% Native American, 4.2% Asian, and 4.9% from other races. The median household income was $76,000, and the median family income was $90,000.
Conclusion
Butler Borough is a small borough located in Morris County, New Jersey. It is situated in the northern part of the state, about 25 miles from New York City. The borough was incorporated in 1904 and has a population of about 8,000 people. The borough has a diverse economy, with a variety of businesses, including restaurants, shops, and offices. The borough is also home to several large employers, including a hospital, a college, and a shopping mall. The racial makeup of the borough is 79.3% White, 11.2% African American, 0.3% Native American, 4.2% Asian, and 4.9% from other races. The median household income was $76,000, and the median family income was $90,000.
Common Questions
What is Per Capita Income in Butler borough?
Per Capita income in Butler borough is $52,221.
What is the Median Family Income in Butler borough?
Median Family Income in Butler borough is $134,432.
What is the Median Household income in Butler borough?
Median Household Income in Butler borough is $108,378.
What is Income or Wage Gap in Butler borough?
Income or Wage Gap in Butler borough is 15.4%.
Women in Butler borough earn 84.6 cents for every dollar earned by a man.
What is Inequality or Gini Index in Butler borough?
Inequality or Gini Index in Butler borough is 0.36.
What is the Total Population of Butler borough?
Total Population of Butler borough is 8,045.
What is the Total Male Population of Butler borough?
Total Male Population of Butler borough is 4,077.
What is the Total Female Population of Butler borough?
Total Female Population of Butler borough is 3,968.
What is the Ratio of Males per 100 Females in Butler borough?
There are 102.75 Males per 100 Females in Butler borough.
What is the Ratio of Females per 100 Males in Butler borough?
There are 97.33 Females per 100 Males in Butler borough.
What is the Median Population Age in Butler borough?
Median Population Age in Butler borough is 43.9 Years.
What is the Average Family Size in Butler borough
Average Family Size in Butler borough is 2.8 People.
What is the Average Household Size in Butler borough
Average Household Size in Butler borough is 2.3 People.
How Large is the Labor Force in Butler borough?
There are 5,010 People in the Labor Forcein in Butler borough.
What is the Percentage of People in the Labor Force in Butler borough?
72.0% of People are in the Labor Force in Butler borough.
What is the Unemployment Rate in Butler borough?
Unemployment Rate in Butler borough is 4.5%.