Lincoln Park borough, NJ Map & Demographics
Lincoln Park borough Overview
$50,438
PER CAPITA INCOME
$133,506
AVG FAMILY INCOME
$112,056
AVG HOUSEHOLD INCOME
39.9%
WAGE / INCOME GAP [ % ]
60.1¢/ $1
WAGE / INCOME GAP [ $ ]
0.37
INEQUALITY / GINI INDEX
10,884
TOTAL POPULATION
5,376
MALE POPULATION
5,508
FEMALE POPULATION
97.60
MALES / 100 FEMALES
102.46
FEMALES / 100 MALES
46.8
MEDIAN AGE
3.1
AVG FAMILY SIZE
2.5
AVG HOUSEHOLD SIZE
6,404
LABOR FORCE [ PEOPLE ]
67.4%
PERCENT IN LABOR FORCE
10.8%
UNEMPLOYMENT RATE
Income in Lincoln Park borough
Income Overview in Lincoln Park borough
Per Capita Income in Lincoln Park borough is $50,438, while median incomes of families and households are $133,506 and $112,056 respectively.
| Characteristic | Number | Measure |
| Per Capita Income | 10,884 | $50,438 |
| Median Family Income | 2,723 | $133,506 |
| Mean Family Income | 2,723 | $147,801 |
| Median Household Income | 4,117 | $112,056 |
| Mean Household Income | 4,117 | $128,620 |
| Income Deficit | 2,723 | $0 |
| Wage / Income Gap (%) | 10,884 | 39.88% |
| Wage / Income Gap ($) | 10,884 | 60.12¢ per $1 |
| Gini / Inequality Index | 10,884 | 0.37 |
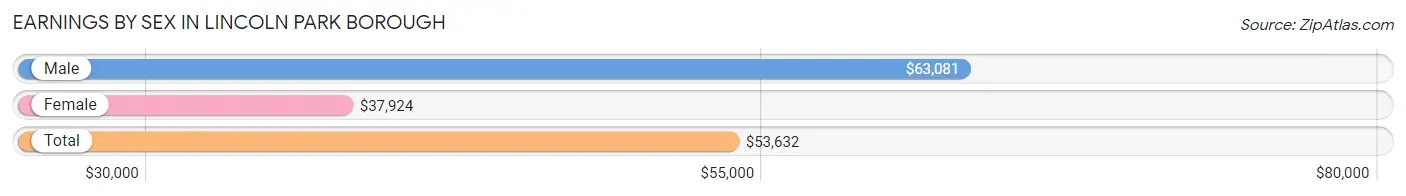
Earnings by Sex in Lincoln Park borough
Average Earnings in Lincoln Park borough are $53,632, $63,081 for men and $37,924 for women, a difference of 39.9%.
| Sex | Number | Average Earnings |
| Male | 3,460 (52.4%) | $63,081 |
| Female | 3,148 (47.6%) | $37,924 |
| Total | 6,608 (100.0%) | $53,632 |
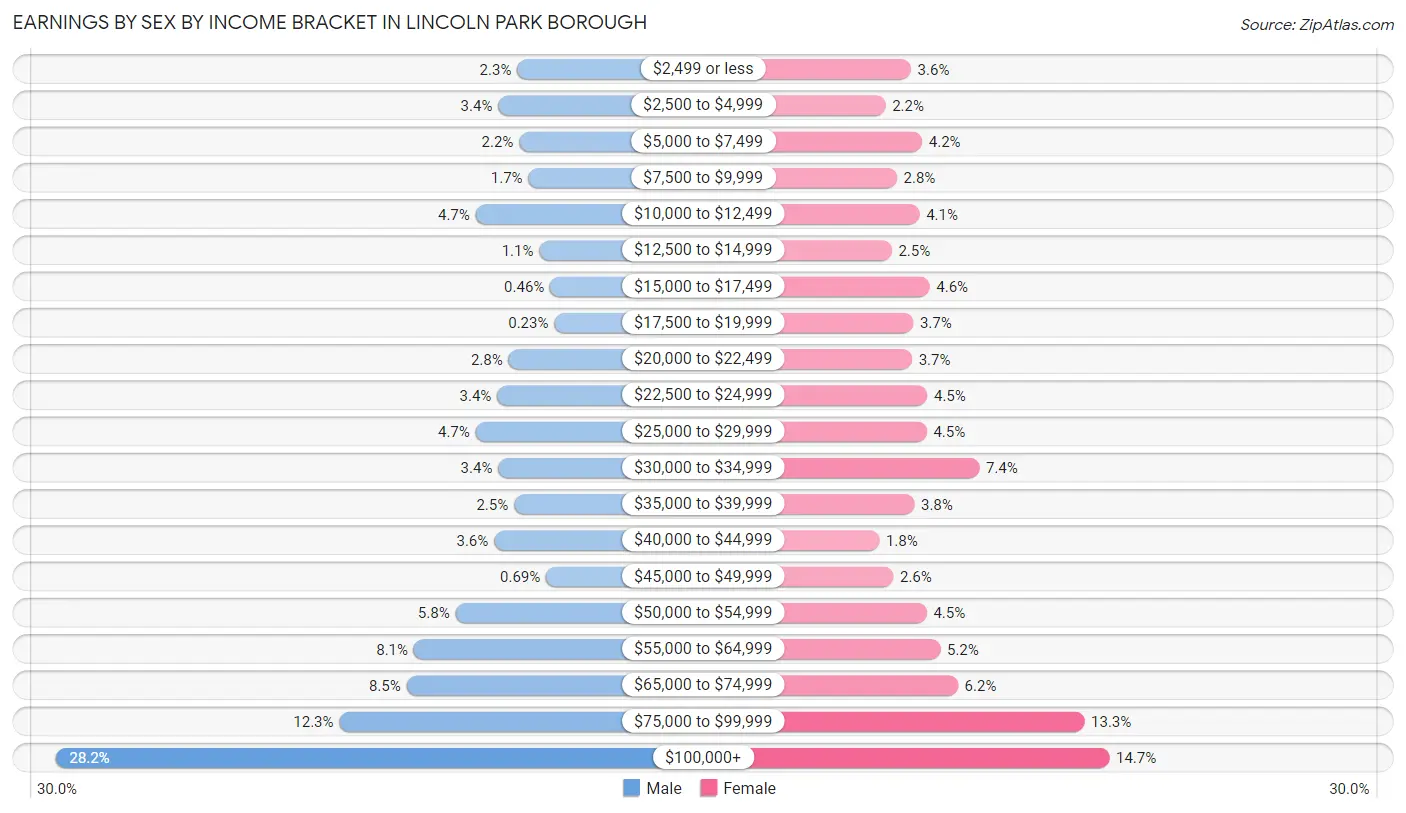
Earnings by Sex by Income Bracket in Lincoln Park borough
The most common earnings brackets in Lincoln Park borough are $100,000+ for men (976 | 28.2%) and $100,000+ for women (464 | 14.7%).
| Income | Male | Female |
| $2,499 or less | 80 (2.3%) | 113 (3.6%) |
| $2,500 to $4,999 | 117 (3.4%) | 68 (2.2%) |
| $5,000 to $7,499 | 76 (2.2%) | 133 (4.2%) |
| $7,500 to $9,999 | 58 (1.7%) | 88 (2.8%) |
| $10,000 to $12,499 | 161 (4.6%) | 128 (4.1%) |
| $12,500 to $14,999 | 37 (1.1%) | 79 (2.5%) |
| $15,000 to $17,499 | 16 (0.5%) | 146 (4.6%) |
| $17,500 to $19,999 | 8 (0.2%) | 117 (3.7%) |
| $20,000 to $22,499 | 97 (2.8%) | 115 (3.6%) |
| $22,500 to $24,999 | 119 (3.4%) | 142 (4.5%) |
| $25,000 to $29,999 | 161 (4.6%) | 141 (4.5%) |
| $30,000 to $34,999 | 117 (3.4%) | 234 (7.4%) |
| $35,000 to $39,999 | 86 (2.5%) | 119 (3.8%) |
| $40,000 to $44,999 | 125 (3.6%) | 57 (1.8%) |
| $45,000 to $49,999 | 24 (0.7%) | 82 (2.6%) |
| $50,000 to $54,999 | 200 (5.8%) | 141 (4.5%) |
| $55,000 to $64,999 | 281 (8.1%) | 165 (5.2%) |
| $65,000 to $74,999 | 295 (8.5%) | 196 (6.2%) |
| $75,000 to $99,999 | 426 (12.3%) | 420 (13.3%) |
| $100,000+ | 976 (28.2%) | 464 (14.7%) |
| Total | 3,460 (100.0%) | 3,148 (100.0%) |
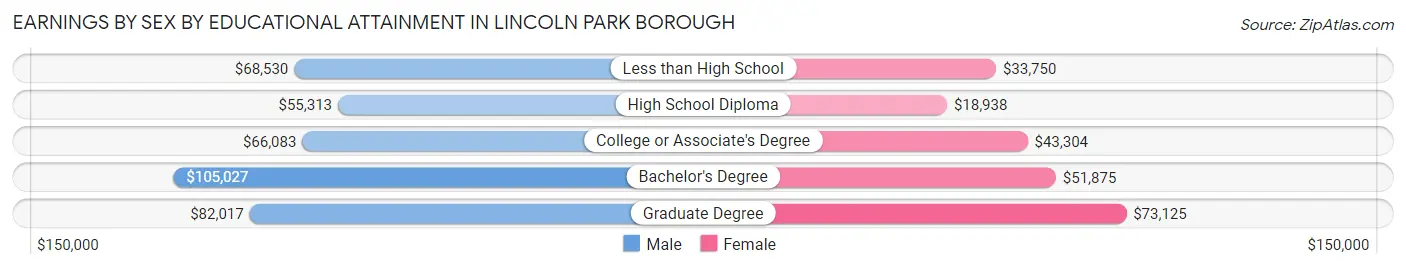
Earnings by Sex by Educational Attainment in Lincoln Park borough
Average earnings in Lincoln Park borough are $70,214 for men and $44,825 for women, a difference of 36.2%. Men with an educational attainment of bachelor's degree enjoy the highest average annual earnings of $105,027, while those with high school diploma education earn the least with $55,313. Women with an educational attainment of graduate degree earn the most with the average annual earnings of $73,125, while those with high school diploma education have the smallest earnings of $18,938.
| Educational Attainment | Male Income | Female Income |
| Less than High School | $68,530 | $33,750 |
| High School Diploma | $55,313 | $18,938 |
| College or Associate's Degree | $66,083 | $43,304 |
| Bachelor's Degree | $105,027 | $51,875 |
| Graduate Degree | $82,017 | $73,125 |
| Total | $70,214 | $44,825 |
Family Income in Lincoln Park borough
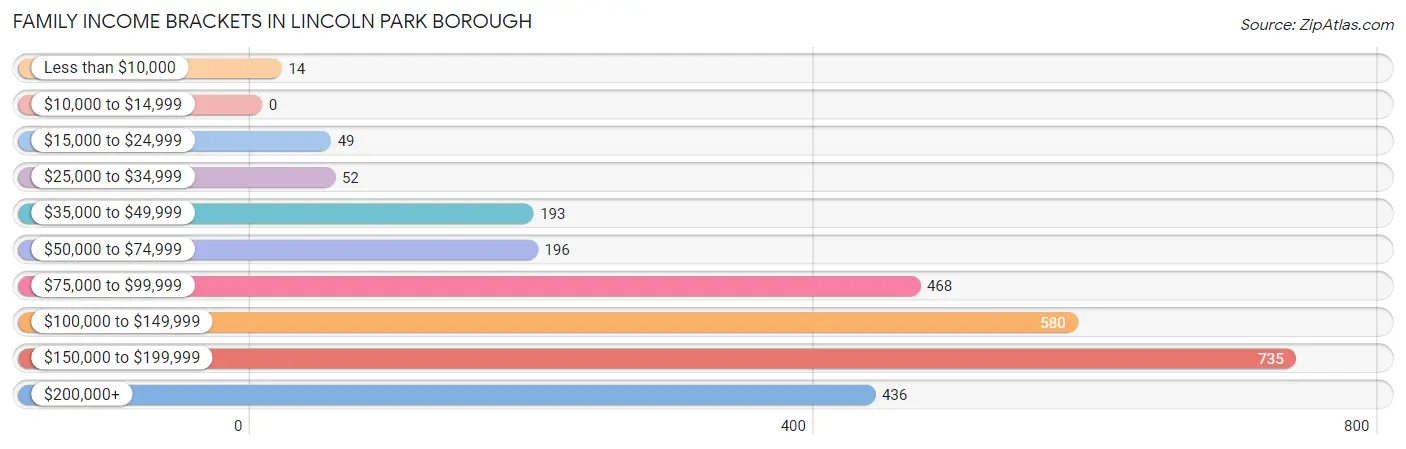
Family Income Brackets in Lincoln Park borough
According to the Lincoln Park borough family income data, there are 735 families falling into the $150,000 to $199,999 income range, which is the most common income bracket and makes up 27.0% of all families.
| Income Bracket | # Families | % Families |
| Less than $10,000 | 14 | 0.5% |
| $10,000 to $14,999 | 0 | 0.0% |
| $15,000 to $24,999 | 49 | 1.8% |
| $25,000 to $34,999 | 52 | 1.9% |
| $35,000 to $49,999 | 193 | 7.1% |
| $50,000 to $74,999 | 196 | 7.2% |
| $75,000 to $99,999 | 468 | 17.2% |
| $100,000 to $149,999 | 580 | 21.3% |
| $150,000 to $199,999 | 735 | 27.0% |
| $200,000+ | 436 | 16.0% |
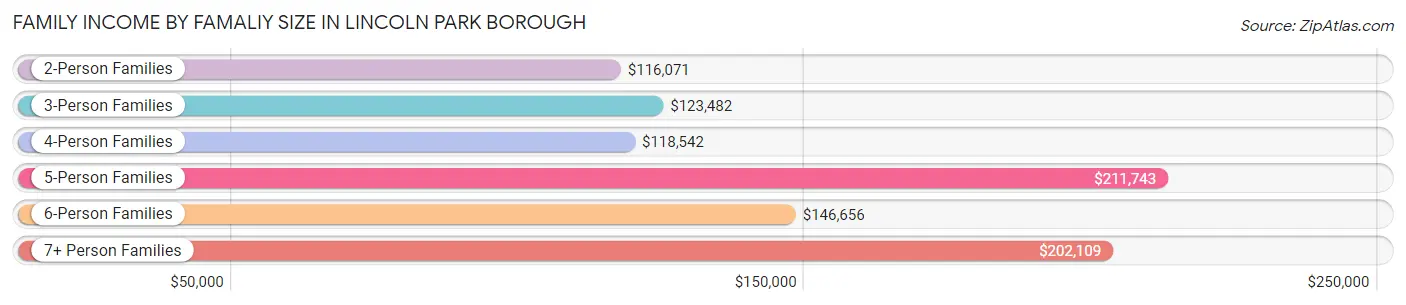
Family Income by Famaliy Size in Lincoln Park borough
5-person families (157 | 5.8%) account for the highest median family income in Lincoln Park borough with $211,743 per family, while 2-person families (1,248 | 45.8%) have the highest median income of $58,036 per family member.
| Income Bracket | # Families | Median Income |
| 2-Person Families | 1,248 (45.8%) | $116,071 |
| 3-Person Families | 609 (22.4%) | $123,482 |
| 4-Person Families | 595 (21.8%) | $118,542 |
| 5-Person Families | 157 (5.8%) | $211,743 |
| 6-Person Families | 87 (3.2%) | $146,656 |
| 7+ Person Families | 27 (1.0%) | $202,109 |
| Total | 2,723 (100.0%) | $133,506 |
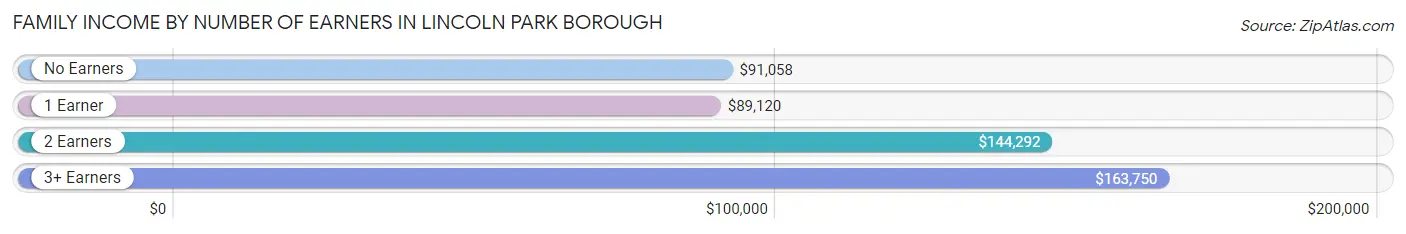
Family Income by Number of Earners in Lincoln Park borough
The median family income in Lincoln Park borough is $133,506, with families comprising 3+ earners (436) having the highest median family income of $163,750, while families with 1 earner (545) have the lowest median family income of $89,120, accounting for 16.0% and 20.0% of families, respectively.
| Number of Earners | # Families | Median Income |
| No Earners | 245 (9.0%) | $91,058 |
| 1 Earner | 545 (20.0%) | $89,120 |
| 2 Earners | 1,497 (55.0%) | $144,292 |
| 3+ Earners | 436 (16.0%) | $163,750 |
| Total | 2,723 (100.0%) | $133,506 |
Household Income in Lincoln Park borough
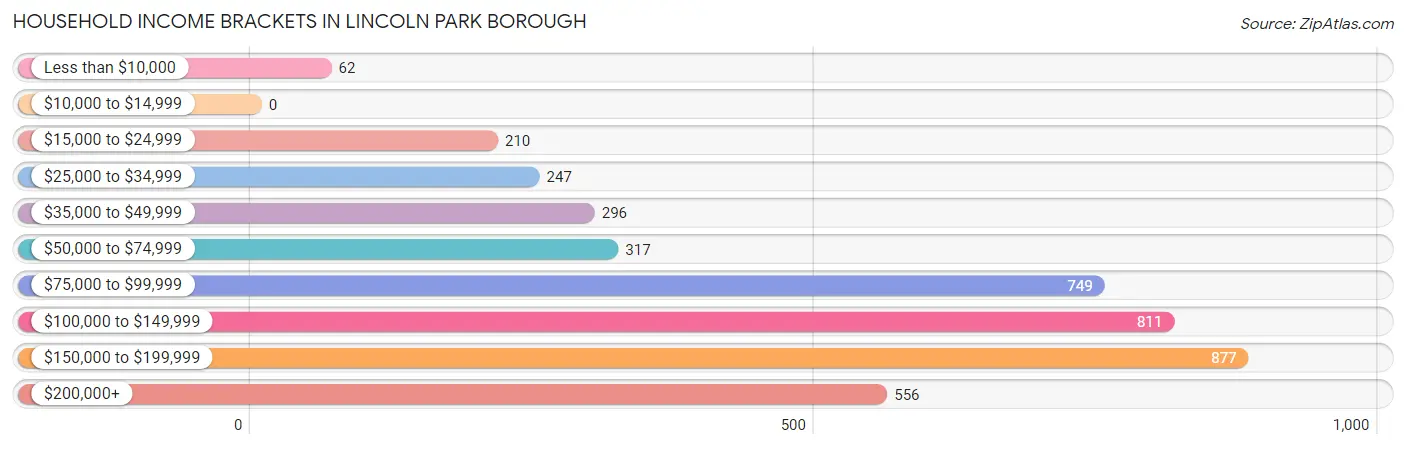
Household Income Brackets in Lincoln Park borough
With 877 households falling in the category, the $150,000 to $199,999 income range is the most frequent in Lincoln Park borough, accounting for 21.3% of all households.
| Income Bracket | # Households | % Households |
| Less than $10,000 | 62 | 1.5% |
| $10,000 to $14,999 | 0 | 0.0% |
| $15,000 to $24,999 | 210 | 5.1% |
| $25,000 to $34,999 | 247 | 6.0% |
| $35,000 to $49,999 | 296 | 7.2% |
| $50,000 to $74,999 | 317 | 7.7% |
| $75,000 to $99,999 | 749 | 18.2% |
| $100,000 to $149,999 | 811 | 19.7% |
| $150,000 to $199,999 | 877 | 21.3% |
| $200,000+ | 556 | 13.5% |
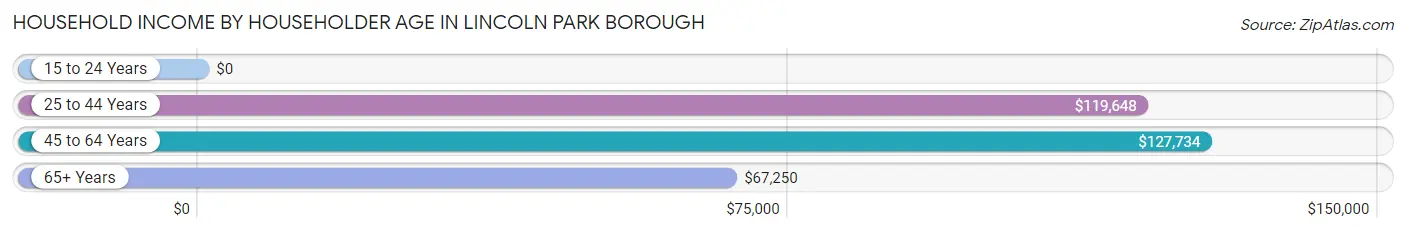
Household Income by Householder Age in Lincoln Park borough
The median household income in Lincoln Park borough is $112,056, with the highest median household income of $127,734 found in the 45 to 64 years age bracket for the primary householder. A total of 2,031 households (49.3%) fall into this category.
| Income Bracket | # Households | Median Income |
| 15 to 24 Years | 0 (0.0%) | $0 |
| 25 to 44 Years | 1,083 (26.3%) | $119,648 |
| 45 to 64 Years | 2,031 (49.3%) | $127,734 |
| 65+ Years | 1,003 (24.4%) | $67,250 |
| Total | 4,117 (100.0%) | $112,056 |
Poverty in Lincoln Park borough
Income Below Poverty by Sex and Age in Lincoln Park borough
With 1.6% poverty level for males and 2.5% for females among the residents of Lincoln Park borough, 12 to 14 year old males and 16 and 17 year old females are the most vulnerable to poverty, with 30 males (28.6%) and 14 females (9.5%) in their respective age groups living below the poverty level.
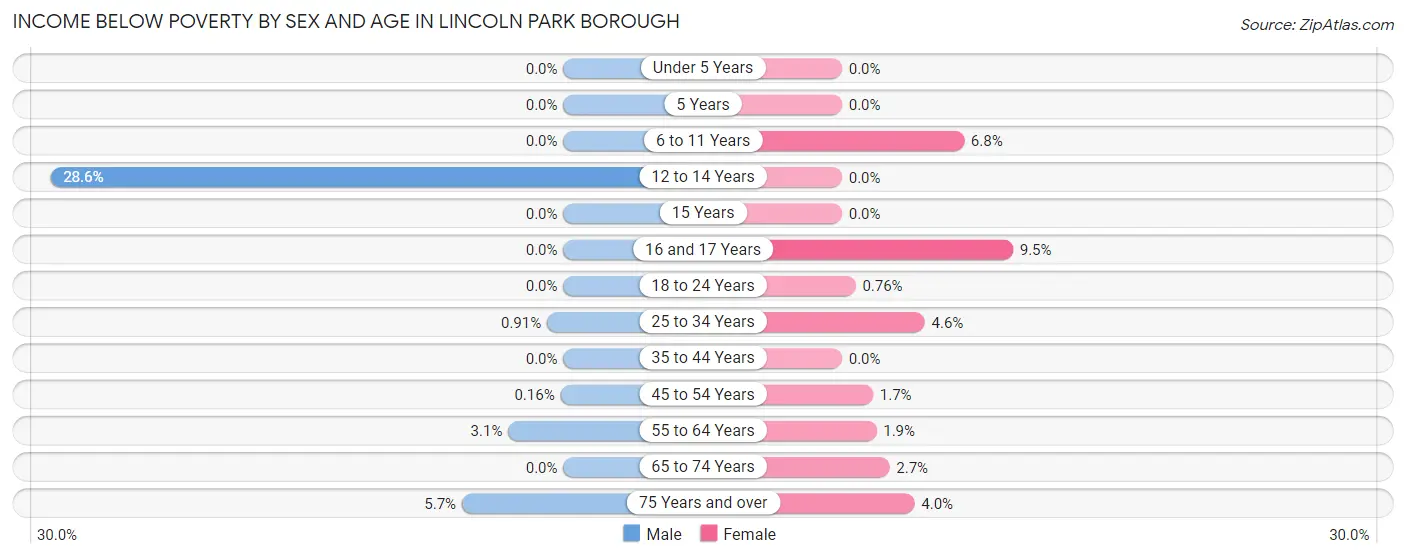
| Age Bracket | Male | Female |
| Under 5 Years | 0 (0.0%) | 0 (0.0%) |
| 5 Years | 0 (0.0%) | 0 (0.0%) |
| 6 to 11 Years | 0 (0.0%) | 14 (6.8%) |
| 12 to 14 Years | 30 (28.6%) | 0 (0.0%) |
| 15 Years | 0 (0.0%) | 0 (0.0%) |
| 16 and 17 Years | 0 (0.0%) | 14 (9.5%) |
| 18 to 24 Years | 0 (0.0%) | 3 (0.8%) |
| 25 to 34 Years | 6 (0.9%) | 35 (4.6%) |
| 35 to 44 Years | 0 (0.0%) | 0 (0.0%) |
| 45 to 54 Years | 1 (0.2%) | 14 (1.7%) |
| 55 to 64 Years | 31 (3.1%) | 17 (1.9%) |
| 65 to 74 Years | 0 (0.0%) | 18 (2.6%) |
| 75 Years and over | 13 (5.7%) | 16 (4.0%) |
| Total | 81 (1.6%) | 131 (2.5%) |
Income Above Poverty by Sex and Age in Lincoln Park borough
According to the poverty statistics in Lincoln Park borough, males aged under 5 years and females aged under 5 years are the age groups that are most secure financially, with 100.0% of males and 100.0% of females in these age groups living above the poverty line.
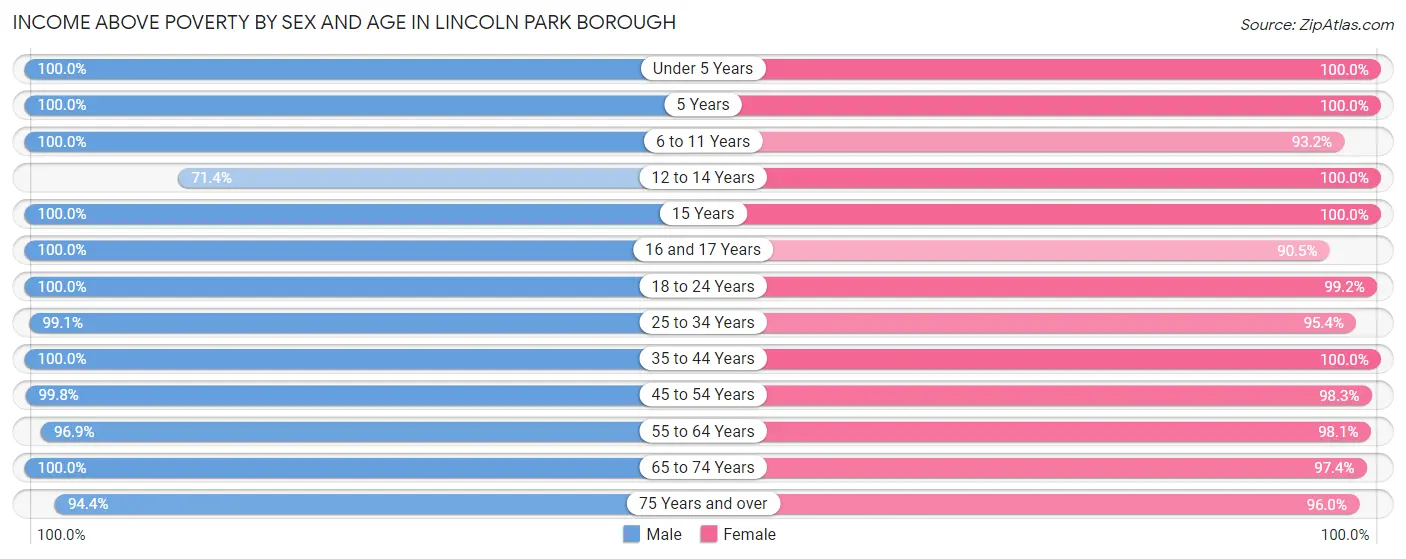
| Age Bracket | Male | Female |
| Under 5 Years | 289 (100.0%) | 272 (100.0%) |
| 5 Years | 8 (100.0%) | 4 (100.0%) |
| 6 to 11 Years | 252 (100.0%) | 192 (93.2%) |
| 12 to 14 Years | 75 (71.4%) | 122 (100.0%) |
| 15 Years | 64 (100.0%) | 60 (100.0%) |
| 16 and 17 Years | 105 (100.0%) | 133 (90.5%) |
| 18 to 24 Years | 486 (100.0%) | 390 (99.2%) |
| 25 to 34 Years | 656 (99.1%) | 724 (95.4%) |
| 35 to 44 Years | 780 (100.0%) | 487 (100.0%) |
| 45 to 54 Years | 644 (99.8%) | 793 (98.3%) |
| 55 to 64 Years | 978 (96.9%) | 868 (98.1%) |
| 65 to 74 Years | 378 (100.0%) | 661 (97.4%) |
| 75 Years and over | 217 (94.4%) | 380 (96.0%) |
| Total | 4,932 (98.4%) | 5,086 (97.5%) |
Income Below Poverty Among Married-Couple Families in Lincoln Park borough
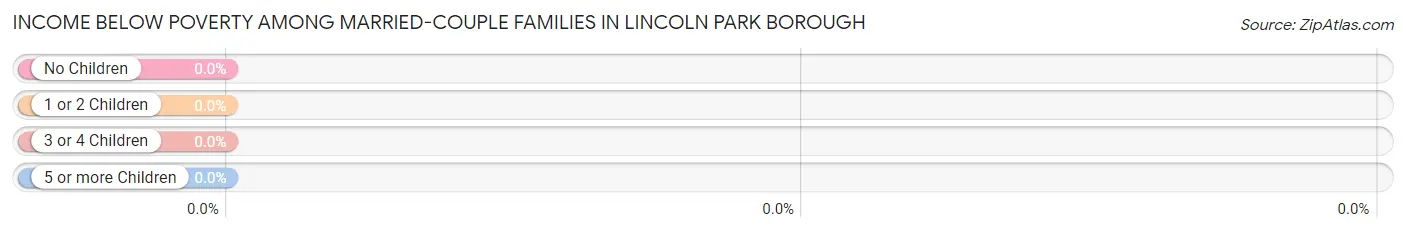
| Children | Above Poverty | Below Poverty |
| No Children | 1,340 (100.0%) | 0 (0.0%) |
| 1 or 2 Children | 693 (100.0%) | 0 (0.0%) |
| 3 or 4 Children | 120 (100.0%) | 0 (0.0%) |
| 5 or more Children | 0 (0.0%) | 0 (0.0%) |
| Total | 2,153 (100.0%) | 0 (0.0%) |
Income Below Poverty Among Single-Parent Households in Lincoln Park borough
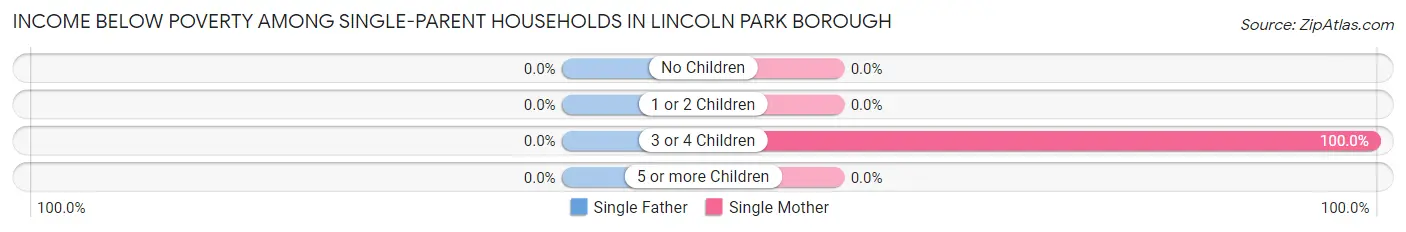
| Children | Single Father | Single Mother |
| No Children | 0 (0.0%) | 0 (0.0%) |
| 1 or 2 Children | 0 (0.0%) | 0 (0.0%) |
| 3 or 4 Children | 0 (0.0%) | 14 (100.0%) |
| 5 or more Children | 0 (0.0%) | 0 (0.0%) |
| Total | 0 (0.0%) | 14 (3.0%) |
Income Below Poverty Among Married-Couple vs Single-Parent Households in Lincoln Park borough
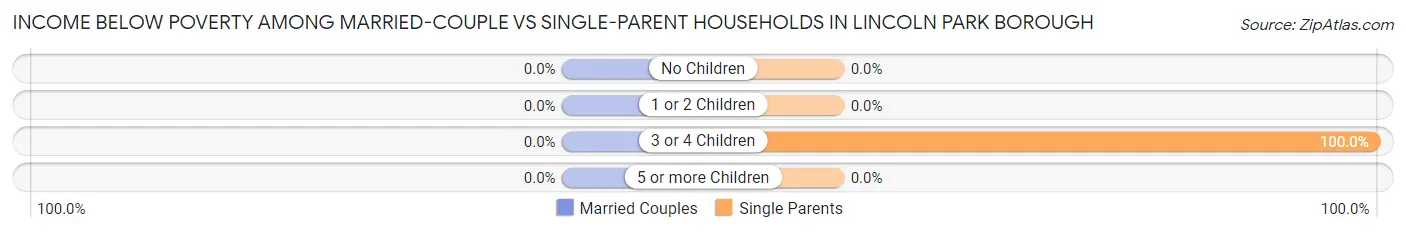
| Children | Married-Couple Families | Single-Parent Households |
| No Children | 0 (0.0%) | 0 (0.0%) |
| 1 or 2 Children | 0 (0.0%) | 0 (0.0%) |
| 3 or 4 Children | 0 (0.0%) | 14 (100.0%) |
| 5 or more Children | 0 (0.0%) | 0 (0.0%) |
| Total | 0 (0.0%) | 14 (2.5%) |
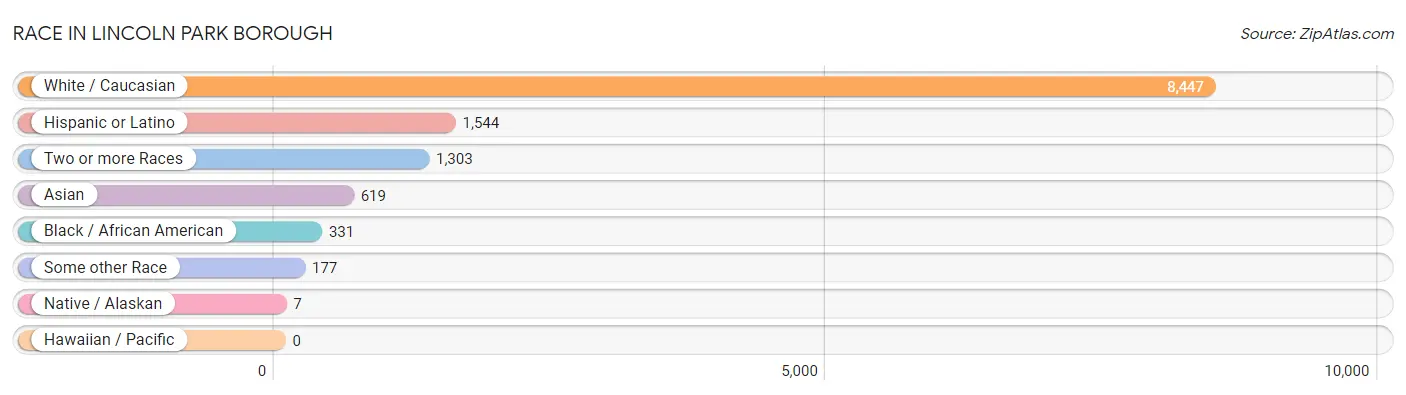
Race in Lincoln Park borough
The most populous races in Lincoln Park borough are White / Caucasian (8,447 | 77.6%), Hispanic or Latino (1,544 | 14.2%), and Two or more Races (1,303 | 12.0%).
| Race | # Population | % Population |
| Asian | 619 | 5.7% |
| Black / African American | 331 | 3.0% |
| Hawaiian / Pacific | 0 | 0.0% |
| Hispanic or Latino | 1,544 | 14.2% |
| Native / Alaskan | 7 | 0.1% |
| White / Caucasian | 8,447 | 77.6% |
| Two or more Races | 1,303 | 12.0% |
| Some other Race | 177 | 1.6% |
| Total | 10,884 | 100.0% |
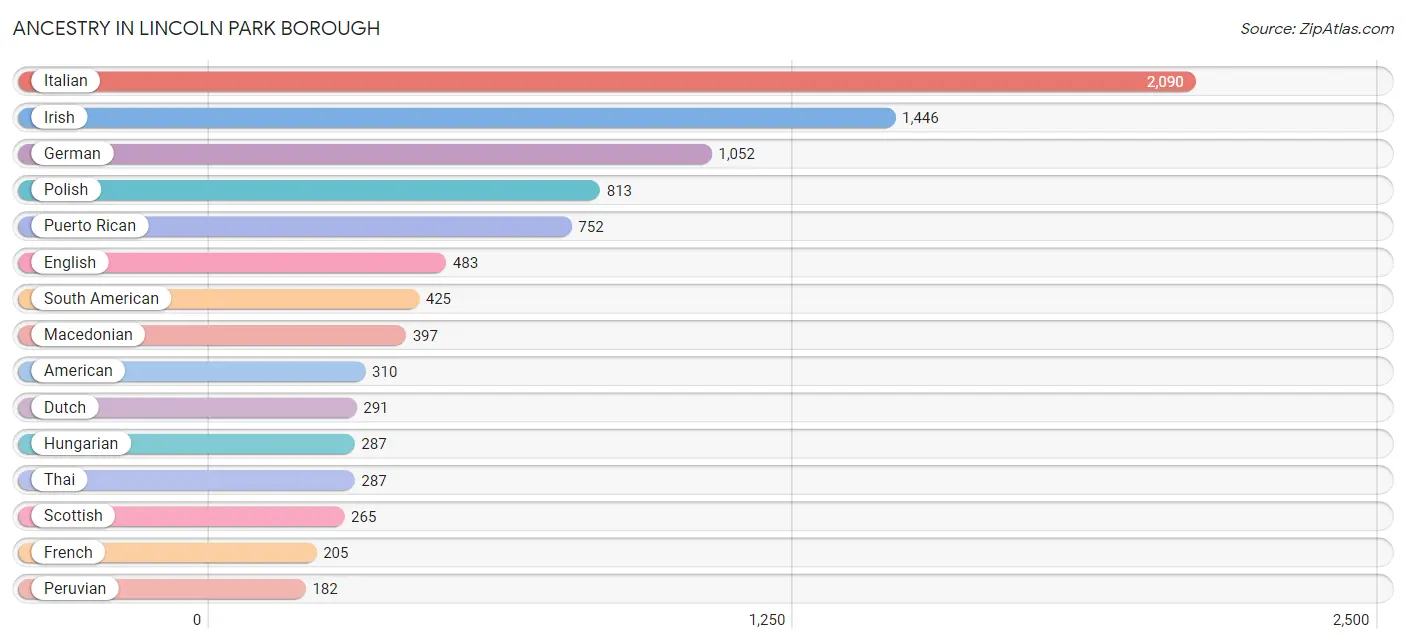
Ancestry in Lincoln Park borough
The most populous ancestries reported in Lincoln Park borough are Italian (2,090 | 19.2%), Irish (1,446 | 13.3%), German (1,052 | 9.7%), Polish (813 | 7.5%), and Puerto Rican (752 | 6.9%), together accounting for 56.5% of all Lincoln Park borough residents.
| Ancestry | # Population | % Population |
| Albanian | 23 | 0.2% |
| American | 310 | 2.9% |
| Arab | 161 | 1.5% |
| Armenian | 61 | 0.6% |
| Assyrian / Chaldean / Syriac | 49 | 0.4% |
| Austrian | 34 | 0.3% |
| Bolivian | 34 | 0.3% |
| Brazilian | 55 | 0.5% |
| British | 16 | 0.2% |
| Burmese | 19 | 0.2% |
| Central American | 122 | 1.1% |
| Cherokee | 22 | 0.2% |
| Chilean | 19 | 0.2% |
| Colombian | 44 | 0.4% |
| Cuban | 95 | 0.9% |
| Czech | 18 | 0.2% |
| Czechoslovakian | 21 | 0.2% |
| Dominican | 63 | 0.6% |
| Dutch | 291 | 2.7% |
| Eastern European | 53 | 0.5% |
| Ecuadorian | 52 | 0.5% |
| Egyptian | 65 | 0.6% |
| English | 483 | 4.4% |
| European | 39 | 0.4% |
| French | 205 | 1.9% |
| French Canadian | 20 | 0.2% |
| German | 1,052 | 9.7% |
| Greek | 99 | 0.9% |
| Honduran | 93 | 0.9% |
| Hungarian | 287 | 2.6% |
| Icelander | 25 | 0.2% |
| Indian (Asian) | 108 | 1.0% |
| Irish | 1,446 | 13.3% |
| Italian | 2,090 | 19.2% |
| Jamaican | 56 | 0.5% |
| Korean | 89 | 0.8% |
| Lebanese | 27 | 0.3% |
| Lithuanian | 55 | 0.5% |
| Macedonian | 397 | 3.6% |
| Maltese | 3 | 0.0% |
| Mexican | 47 | 0.4% |
| Nicaraguan | 17 | 0.2% |
| Northern European | 88 | 0.8% |
| Norwegian | 80 | 0.7% |
| Peruvian | 182 | 1.7% |
| Polish | 813 | 7.5% |
| Portuguese | 32 | 0.3% |
| Puerto Rican | 752 | 6.9% |
| Russian | 133 | 1.2% |
| Salvadoran | 12 | 0.1% |
| Scandinavian | 45 | 0.4% |
| Scotch-Irish | 46 | 0.4% |
| Scottish | 265 | 2.4% |
| Serbian | 18 | 0.2% |
| Slovak | 84 | 0.8% |
| South American | 425 | 3.9% |
| Spaniard | 13 | 0.1% |
| Spanish | 10 | 0.1% |
| Sri Lankan | 8 | 0.1% |
| Swedish | 26 | 0.2% |
| Swiss | 169 | 1.5% |
| Syrian | 69 | 0.6% |
| Thai | 287 | 2.6% |
| Turkish | 18 | 0.2% |
| Ukrainian | 15 | 0.1% |
| Uruguayan | 94 | 0.9% |
| Welsh | 28 | 0.3% |
| Yugoslavian | 18 | 0.2% | View All 68 Rows |
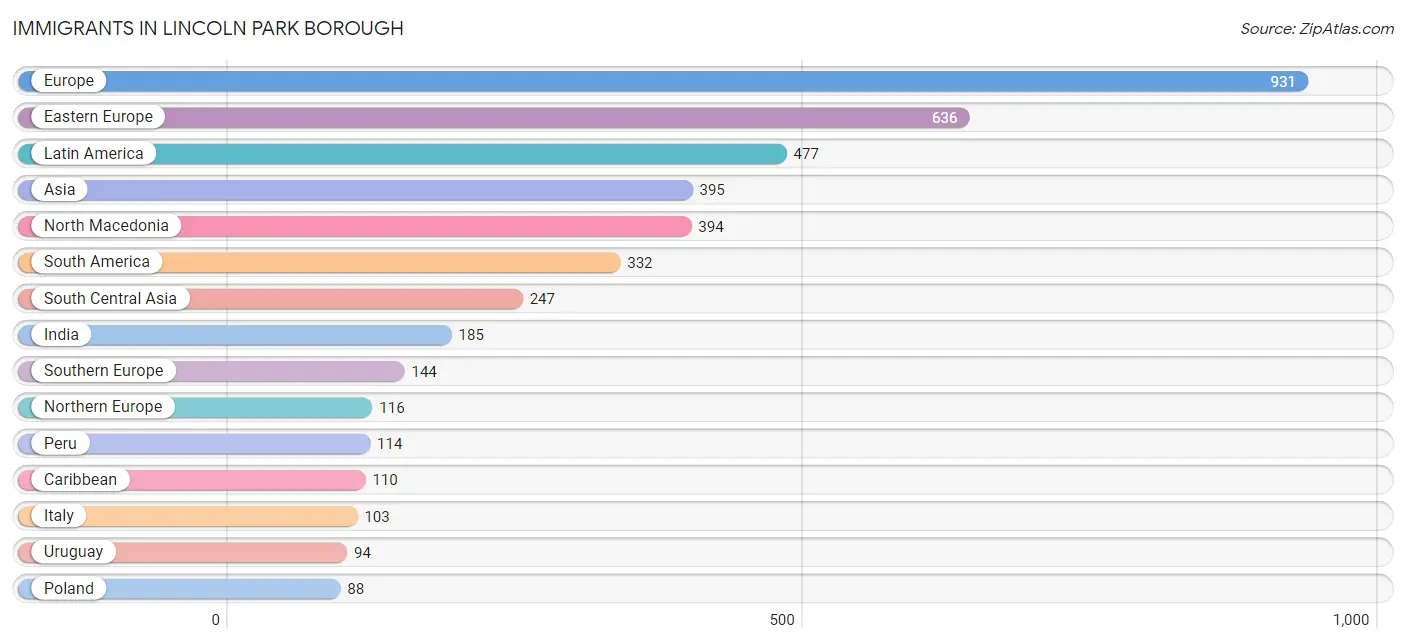
Immigrants in Lincoln Park borough
The most numerous immigrant groups reported in Lincoln Park borough came from Europe (931 | 8.6%), Eastern Europe (636 | 5.8%), Latin America (477 | 4.4%), Asia (395 | 3.6%), and North Macedonia (394 | 3.6%), together accounting for 26.0% of all Lincoln Park borough residents.
| Immigration Origin | # Population | % Population |
| Africa | 80 | 0.7% |
| Asia | 395 | 3.6% |
| Belarus | 24 | 0.2% |
| Brazil | 24 | 0.2% |
| Canada | 9 | 0.1% |
| Caribbean | 110 | 1.0% |
| Central America | 35 | 0.3% |
| Chile | 20 | 0.2% |
| China | 19 | 0.2% |
| Colombia | 28 | 0.3% |
| Cuba | 63 | 0.6% |
| Czechoslovakia | 68 | 0.6% |
| Dominican Republic | 22 | 0.2% |
| Eastern Asia | 20 | 0.2% |
| Eastern Europe | 636 | 5.8% |
| Ecuador | 52 | 0.5% |
| Egypt | 35 | 0.3% |
| England | 62 | 0.6% |
| Europe | 931 | 8.6% |
| France | 18 | 0.2% |
| Greece | 38 | 0.4% |
| Honduras | 35 | 0.3% |
| Hong Kong | 19 | 0.2% |
| Hungary | 28 | 0.3% |
| India | 185 | 1.7% |
| Iraq | 13 | 0.1% |
| Ireland | 13 | 0.1% |
| Italy | 103 | 0.9% |
| Jamaica | 25 | 0.2% |
| Korea | 1 | 0.0% |
| Latin America | 477 | 4.4% |
| Lebanon | 10 | 0.1% |
| North Macedonia | 394 | 3.6% |
| Northern Africa | 35 | 0.3% |
| Northern Europe | 116 | 1.1% |
| Pakistan | 62 | 0.6% |
| Peru | 114 | 1.1% |
| Philippines | 53 | 0.5% |
| Poland | 88 | 0.8% |
| Russia | 6 | 0.1% |
| South Africa | 45 | 0.4% |
| South America | 332 | 3.0% |
| South Central Asia | 247 | 2.3% |
| South Eastern Asia | 76 | 0.7% |
| Southern Europe | 144 | 1.3% |
| Switzerland | 17 | 0.2% |
| Syria | 11 | 0.1% |
| Turkey | 18 | 0.2% |
| Uruguay | 94 | 0.9% |
| Vietnam | 23 | 0.2% |
| Western Asia | 52 | 0.5% |
| Western Europe | 35 | 0.3% | View All 52 Rows |
Sex and Age in Lincoln Park borough
Sex and Age in Lincoln Park borough
The most populous age groups in Lincoln Park borough are 60 to 64 Years (706 | 13.1%) for men and 60 to 64 Years (533 | 9.7%) for women.
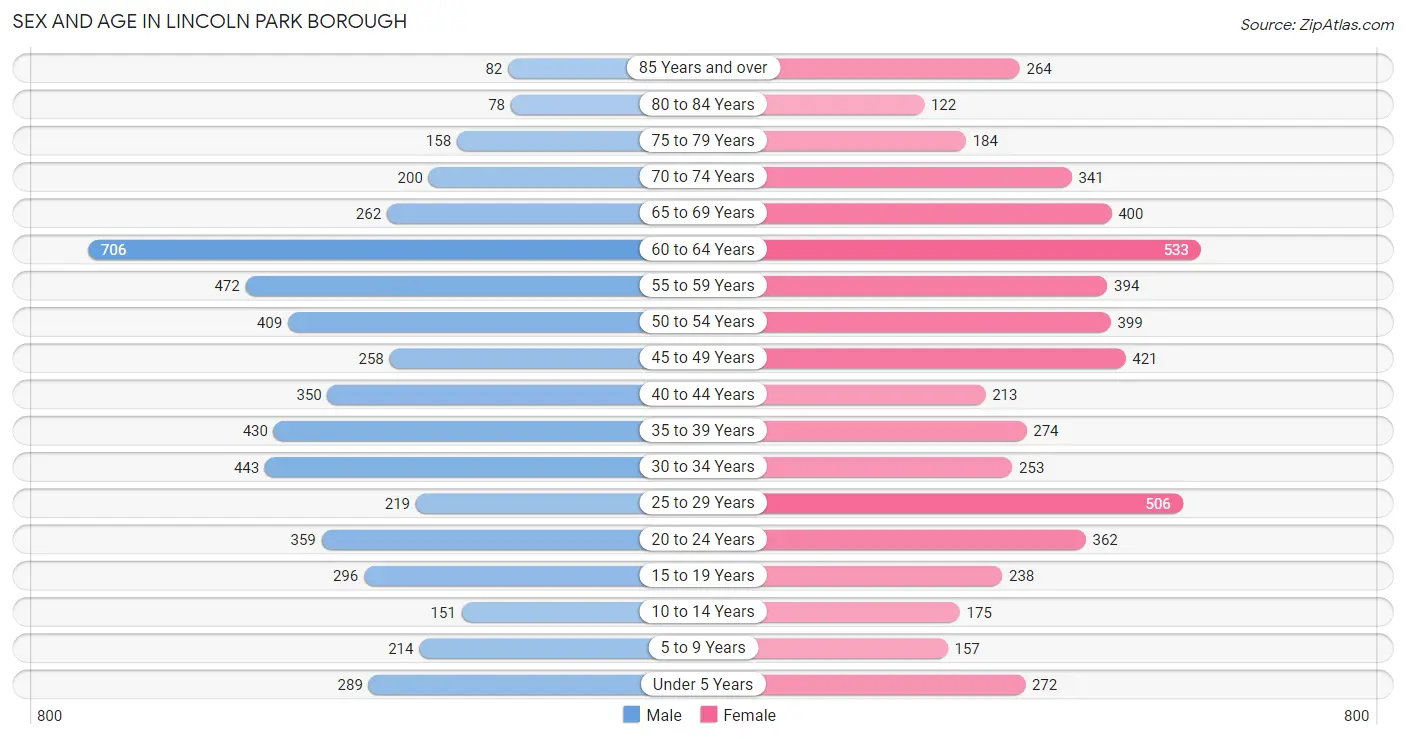
| Age Bracket | Male | Female |
| Under 5 Years | 289 (5.4%) | 272 (4.9%) |
| 5 to 9 Years | 214 (4.0%) | 157 (2.9%) |
| 10 to 14 Years | 151 (2.8%) | 175 (3.2%) |
| 15 to 19 Years | 296 (5.5%) | 238 (4.3%) |
| 20 to 24 Years | 359 (6.7%) | 362 (6.6%) |
| 25 to 29 Years | 219 (4.1%) | 506 (9.2%) |
| 30 to 34 Years | 443 (8.2%) | 253 (4.6%) |
| 35 to 39 Years | 430 (8.0%) | 274 (5.0%) |
| 40 to 44 Years | 350 (6.5%) | 213 (3.9%) |
| 45 to 49 Years | 258 (4.8%) | 421 (7.6%) |
| 50 to 54 Years | 409 (7.6%) | 399 (7.2%) |
| 55 to 59 Years | 472 (8.8%) | 394 (7.1%) |
| 60 to 64 Years | 706 (13.1%) | 533 (9.7%) |
| 65 to 69 Years | 262 (4.9%) | 400 (7.3%) |
| 70 to 74 Years | 200 (3.7%) | 341 (6.2%) |
| 75 to 79 Years | 158 (2.9%) | 184 (3.3%) |
| 80 to 84 Years | 78 (1.5%) | 122 (2.2%) |
| 85 Years and over | 82 (1.5%) | 264 (4.8%) |
| Total | 5,376 (100.0%) | 5,508 (100.0%) |
Families and Households in Lincoln Park borough
Median Family Size in Lincoln Park borough
The median family size in Lincoln Park borough is 3.11 persons per family, with married-couple families (2,153 | 79.1%) accounting for the largest median family size of 3.2 persons per family. On the other hand, single male/father families (110 | 4.0%) represent the smallest median family size with 2.39 persons per family.
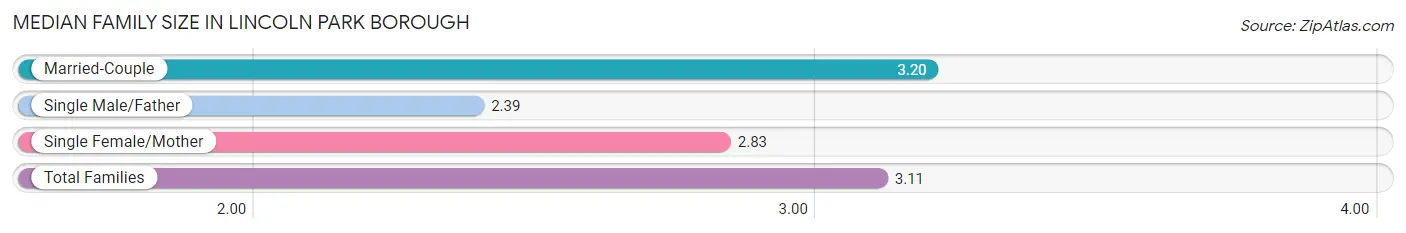
| Family Type | # Families | Family Size |
| Married-Couple | 2,153 (79.1%) | 3.20 |
| Single Male/Father | 110 (4.0%) | 2.39 |
| Single Female/Mother | 460 (16.9%) | 2.83 |
| Total Families | 2,723 (100.0%) | 3.11 |
Median Household Size in Lincoln Park borough
The median household size in Lincoln Park borough is 2.48 persons per household, with married-couple households (2,153 | 52.3%) accounting for the largest median household size of 3.22 persons per household. non-family households (1,394 | 33.9%) represent the smallest median household size with 1.16 persons per household.
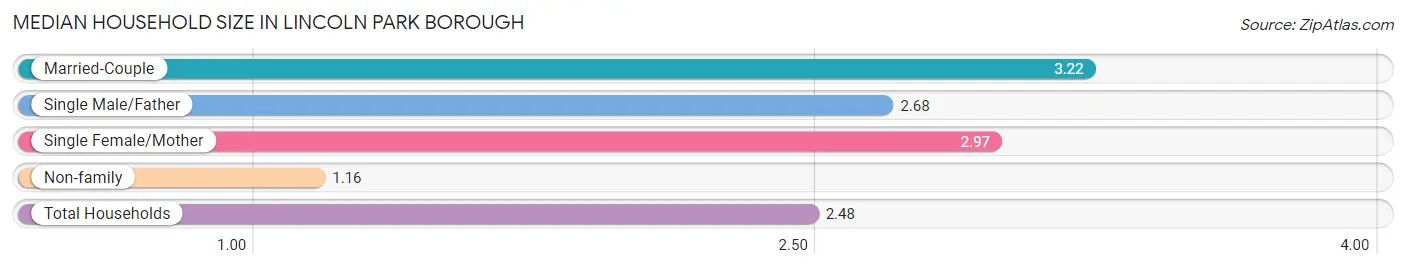
| Household Type | # Households | Household Size |
| Married-Couple | 2,153 (52.3%) | 3.22 |
| Single Male/Father | 110 (2.7%) | 2.68 |
| Single Female/Mother | 460 (11.2%) | 2.97 |
| Non-family | 1,394 (33.9%) | 1.16 |
| Total Households | 4,117 (100.0%) | 2.48 |
Household Size by Marriage Status in Lincoln Park borough
Out of a total of 4,117 households in Lincoln Park borough, 2,723 (66.1%) are family households, while 1,394 (33.9%) are nonfamily households. The most numerous type of family households are 2-person households, comprising 1,194, and the most common type of nonfamily households are 1-person households, comprising 1,202.
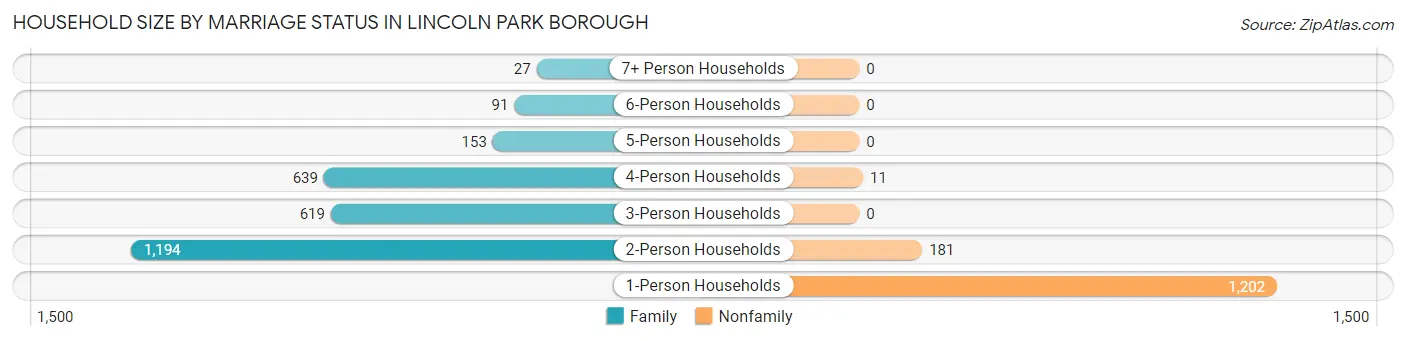
| Household Size | Family Households | Nonfamily Households |
| 1-Person Households | - | 1,202 (29.2%) |
| 2-Person Households | 1,194 (29.0%) | 181 (4.4%) |
| 3-Person Households | 619 (15.0%) | 0 (0.0%) |
| 4-Person Households | 639 (15.5%) | 11 (0.3%) |
| 5-Person Households | 153 (3.7%) | 0 (0.0%) |
| 6-Person Households | 91 (2.2%) | 0 (0.0%) |
| 7+ Person Households | 27 (0.7%) | 0 (0.0%) |
| Total | 2,723 (66.1%) | 1,394 (33.9%) |
Female Fertility in Lincoln Park borough
Fertility by Age in Lincoln Park borough
Average fertility rate in Lincoln Park borough is 31.0 births per 1,000 women. Women in the age bracket of 20 to 34 years have the highest fertility rate with 64.0 births per 1,000 women. Women in the age bracket of 20 to 34 years acount for 100.0% of all women with births.
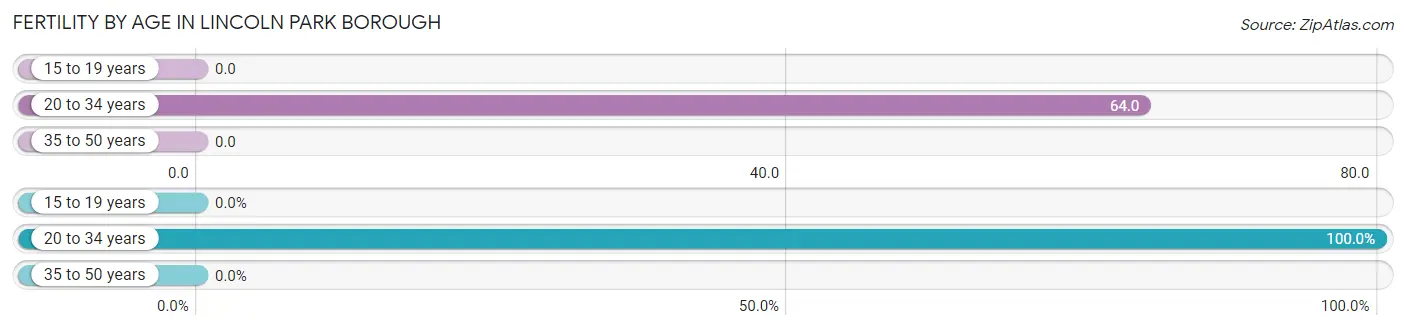
| Age Bracket | Women with Births | Births / 1,000 Women |
| 15 to 19 years | 0 (0.0%) | 0.0 |
| 20 to 34 years | 72 (100.0%) | 64.0 |
| 35 to 50 years | 0 (0.0%) | 0.0 |
| Total | 72 (100.0%) | 31.0 |
Fertility by Age by Marriage Status in Lincoln Park borough
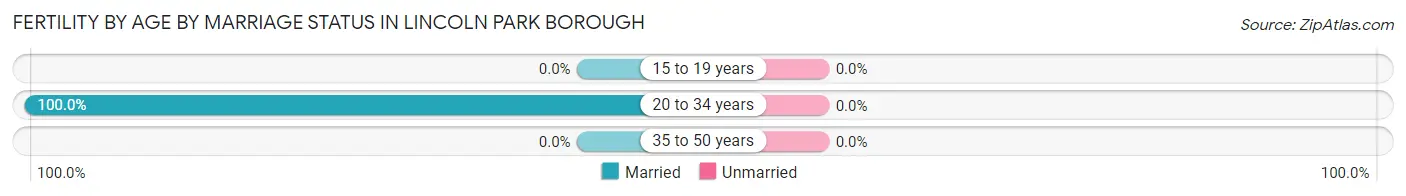
| Age Bracket | Married | Unmarried |
| 15 to 19 years | 0 (0.0%) | 0 (0.0%) |
| 20 to 34 years | 72 (100.0%) | 0 (0.0%) |
| 35 to 50 years | 0 (0.0%) | 0 (0.0%) |
| Total | 72 (100.0%) | 0 (0.0%) |
Fertility by Education in Lincoln Park borough
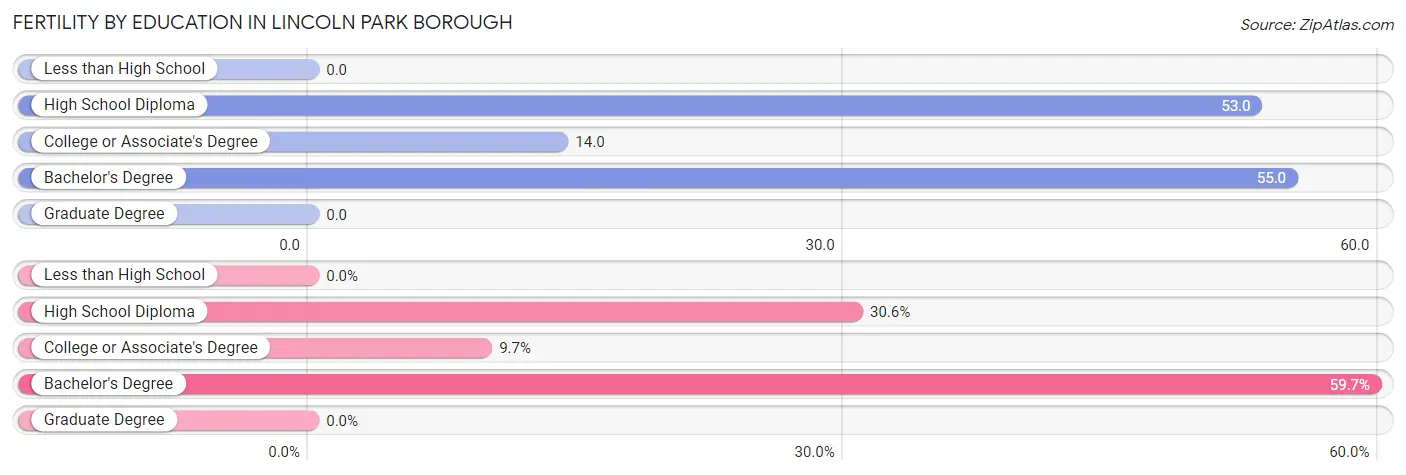
| Educational Attainment | Women with Births | Births / 1,000 Women |
| Less than High School | 0 (0.0%) | 0.0 |
| High School Diploma | 22 (30.6%) | 53.0 |
| College or Associate's Degree | 7 (9.7%) | 14.0 |
| Bachelor's Degree | 43 (59.7%) | 55.0 |
| Graduate Degree | 0 (0.0%) | 0.0 |
| Total | 72 (100.0%) | 31.0 |
Fertility by Education by Marriage Status in Lincoln Park borough
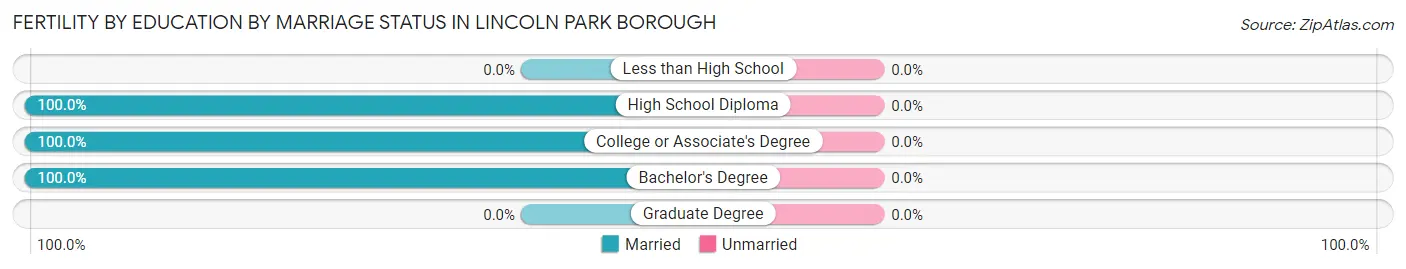
| Educational Attainment | Married | Unmarried |
| Less than High School | 0 (0.0%) | 0 (0.0%) |
| High School Diploma | 22 (100.0%) | 0 (0.0%) |
| College or Associate's Degree | 7 (100.0%) | 0 (0.0%) |
| Bachelor's Degree | 43 (100.0%) | 0 (0.0%) |
| Graduate Degree | 0 (0.0%) | 0 (0.0%) |
| Total | 72 (100.0%) | 0 (0.0%) |
Employment Characteristics in Lincoln Park borough
Employment by Class of Employer in Lincoln Park borough
Among the 5,654 employed individuals in Lincoln Park borough, private company employees (4,416 | 78.1%), local government employees (444 | 7.9%), and not-for-profit organizations (287 | 5.1%) make up the most common classes of employment.
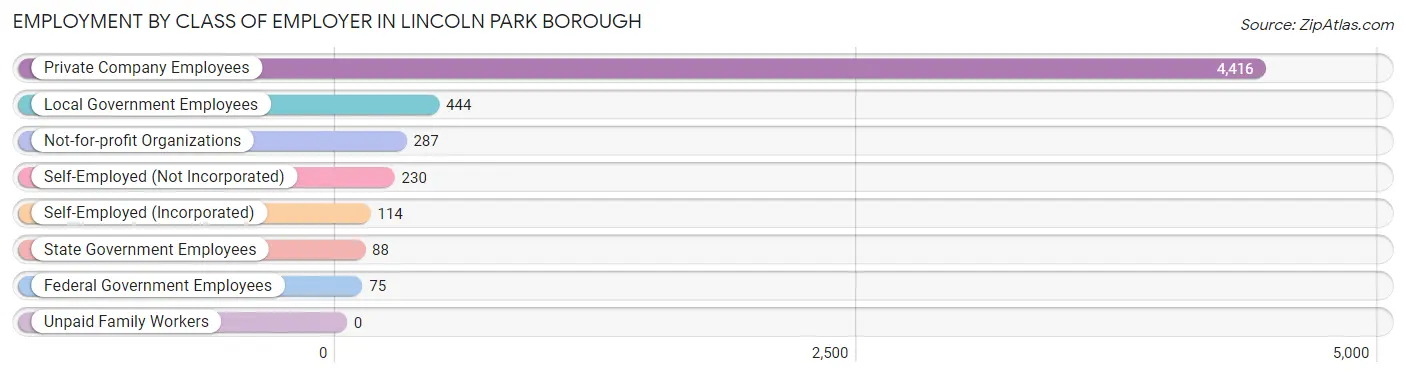
| Employer Class | # Employees | % Employees |
| Private Company Employees | 4,416 | 78.1% |
| Self-Employed (Incorporated) | 114 | 2.0% |
| Self-Employed (Not Incorporated) | 230 | 4.1% |
| Not-for-profit Organizations | 287 | 5.1% |
| Local Government Employees | 444 | 7.9% |
| State Government Employees | 88 | 1.6% |
| Federal Government Employees | 75 | 1.3% |
| Unpaid Family Workers | 0 | 0.0% |
| Total | 5,654 | 100.0% |
Employment Status by Age in Lincoln Park borough
According to the labor force statistics for Lincoln Park borough, out of the total population over 16 years of age (9,502), 67.4% or 6,404 individuals are in the labor force, with 10.8% or 692 of them unemployed. The age group with the highest labor force participation rate is 30 to 34 years, with 96.8% or 674 individuals in the labor force. Within the labor force, the 60 to 64 years age range has the highest percentage of unemployed individuals, with 26.6% or 252 of them being unemployed.
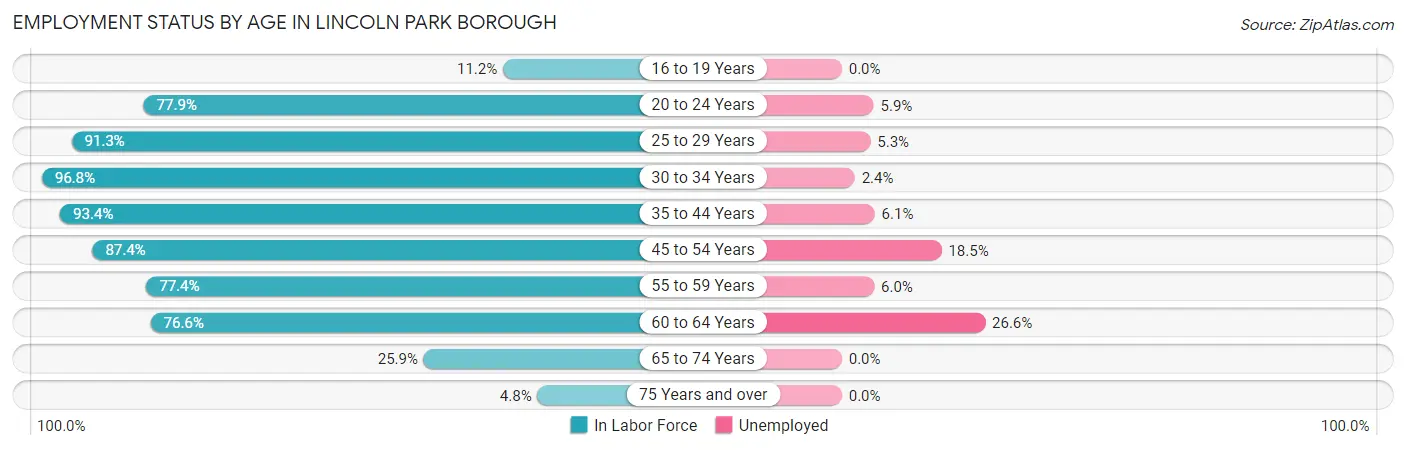
| Age Bracket | In Labor Force | Unemployed |
| 16 to 19 Years | 46 (11.2%) | 0 (0.0%) |
| 20 to 24 Years | 562 (77.9%) | 33 (5.9%) |
| 25 to 29 Years | 662 (91.3%) | 35 (5.3%) |
| 30 to 34 Years | 674 (96.8%) | 16 (2.4%) |
| 35 to 44 Years | 1,183 (93.4%) | 72 (6.1%) |
| 45 to 54 Years | 1,300 (87.4%) | 240 (18.5%) |
| 55 to 59 Years | 670 (77.4%) | 40 (6.0%) |
| 60 to 64 Years | 949 (76.6%) | 252 (26.6%) |
| 65 to 74 Years | 312 (25.9%) | 0 (0.0%) |
| 75 Years and over | 43 (4.8%) | 0 (0.0%) |
| Total | 6,404 (67.4%) | 692 (10.8%) |
Employment Status by Educational Attainment in Lincoln Park borough
According to labor force statistics for Lincoln Park borough, 86.6% of individuals (5,438) out of the total population between 25 and 64 years of age (6,280) are in the labor force, with 12.1% or 658 of them being unemployed. The group with the highest labor force participation rate are those with the educational attainment of bachelor's degree or higher, with 93.9% or 3,016 individuals in the labor force. Within the labor force, individuals with college / associate degree education have the highest percentage of unemployment, with 17.0% or 175 of them being unemployed.
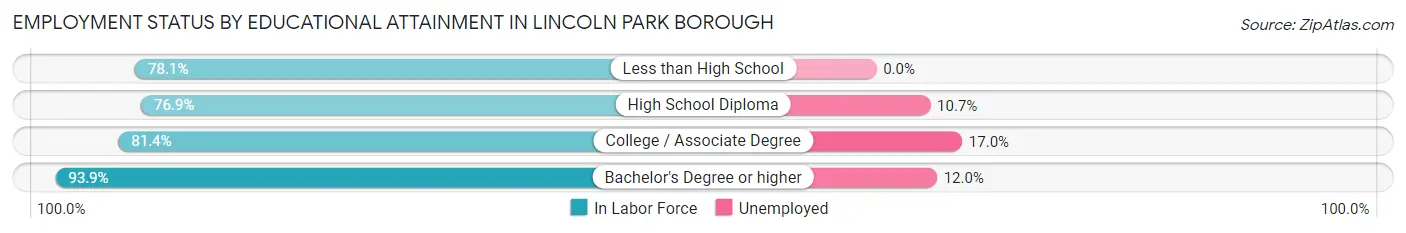
| Educational Attainment | In Labor Force | Unemployed |
| Less than High School | 268 (78.1%) | 0 (0.0%) |
| High School Diploma | 1,124 (76.9%) | 156 (10.7%) |
| College / Associate Degree | 1,029 (81.4%) | 215 (17.0%) |
| Bachelor's Degree or higher | 3,016 (93.9%) | 385 (12.0%) |
| Total | 5,438 (86.6%) | 760 (12.1%) |
Employment Occupations by Sex in Lincoln Park borough
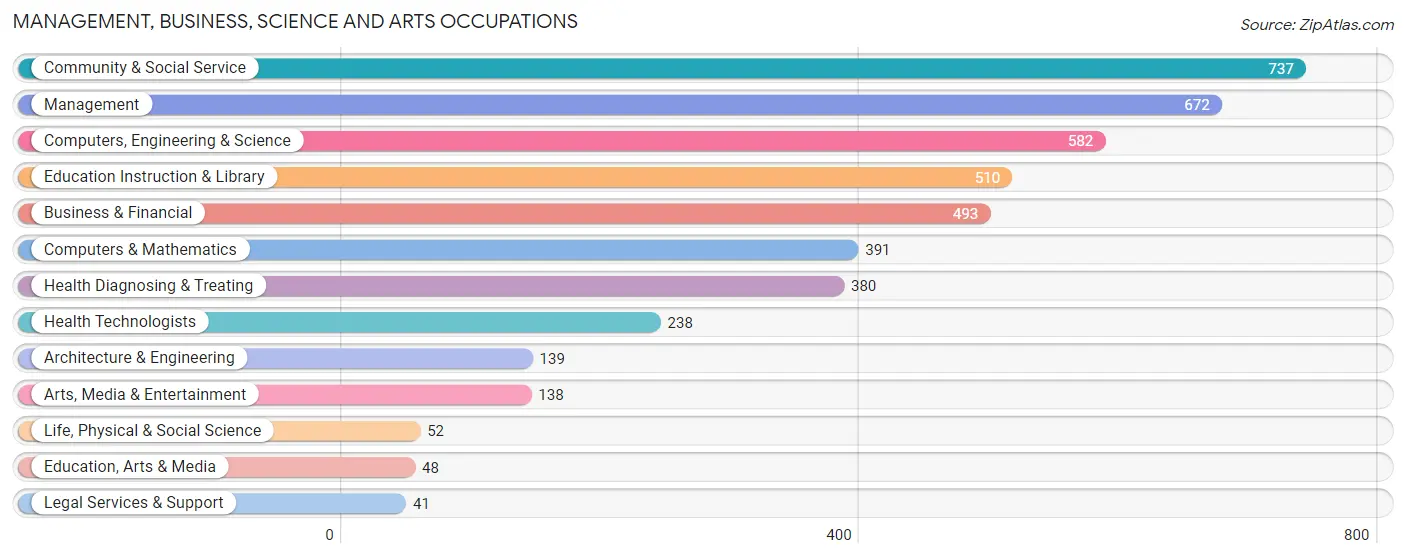
Management, Business, Science and Arts Occupations
The most common Management, Business, Science and Arts occupations in Lincoln Park borough are Community & Social Service (737 | 12.9%), Management (672 | 11.8%), Computers, Engineering & Science (582 | 10.2%), Education Instruction & Library (510 | 8.9%), and Business & Financial (493 | 8.6%).
Management, Business, Science and Arts Occupations by Sex
Within the Management, Business, Science and Arts occupations in Lincoln Park borough, the most male-oriented occupations are Legal Services & Support (100.0%), Computers & Mathematics (76.0%), and Management (64.9%), while the most female-oriented occupations are Life, Physical & Social Science (100.0%), Education, Arts & Media (89.6%), and Education Instruction & Library (86.7%).
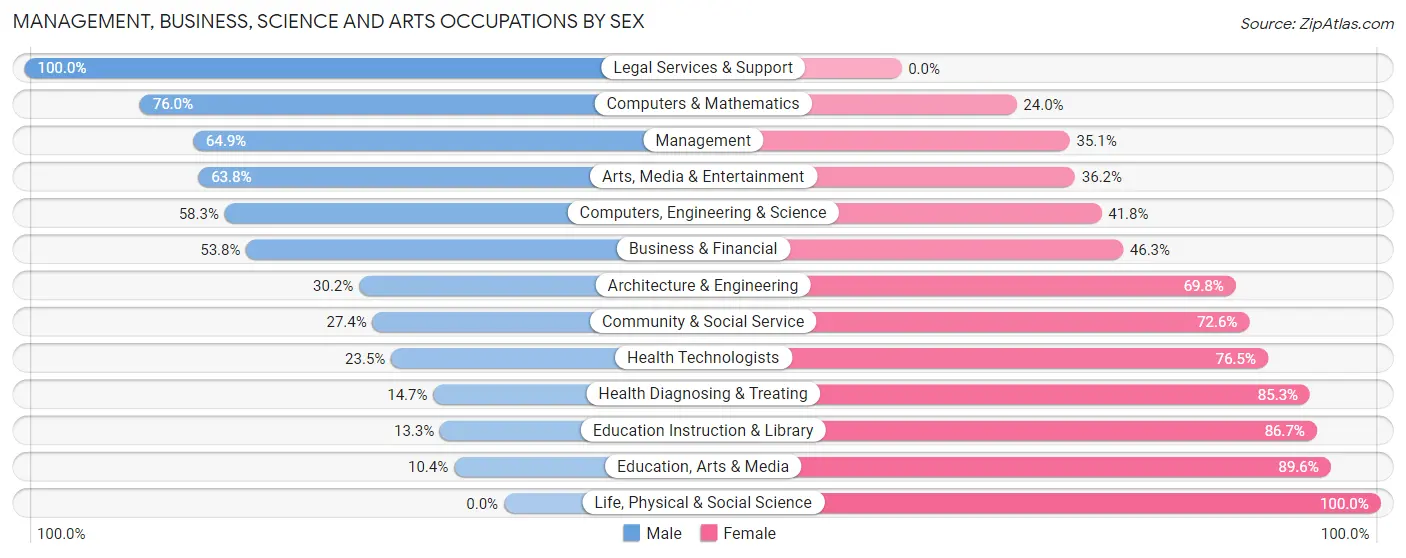
| Occupation | Male | Female |
| Management | 436 (64.9%) | 236 (35.1%) |
| Business & Financial | 265 (53.7%) | 228 (46.3%) |
| Computers, Engineering & Science | 339 (58.3%) | 243 (41.7%) |
| Computers & Mathematics | 297 (76.0%) | 94 (24.0%) |
| Architecture & Engineering | 42 (30.2%) | 97 (69.8%) |
| Life, Physical & Social Science | 0 (0.0%) | 52 (100.0%) |
| Community & Social Service | 202 (27.4%) | 535 (72.6%) |
| Education, Arts & Media | 5 (10.4%) | 43 (89.6%) |
| Legal Services & Support | 41 (100.0%) | 0 (0.0%) |
| Education Instruction & Library | 68 (13.3%) | 442 (86.7%) |
| Arts, Media & Entertainment | 88 (63.8%) | 50 (36.2%) |
| Health Diagnosing & Treating | 56 (14.7%) | 324 (85.3%) |
| Health Technologists | 56 (23.5%) | 182 (76.5%) |
| Total (Category) | 1,298 (45.3%) | 1,566 (54.7%) |
| Total (Overall) | 2,984 (52.2%) | 2,728 (47.8%) |
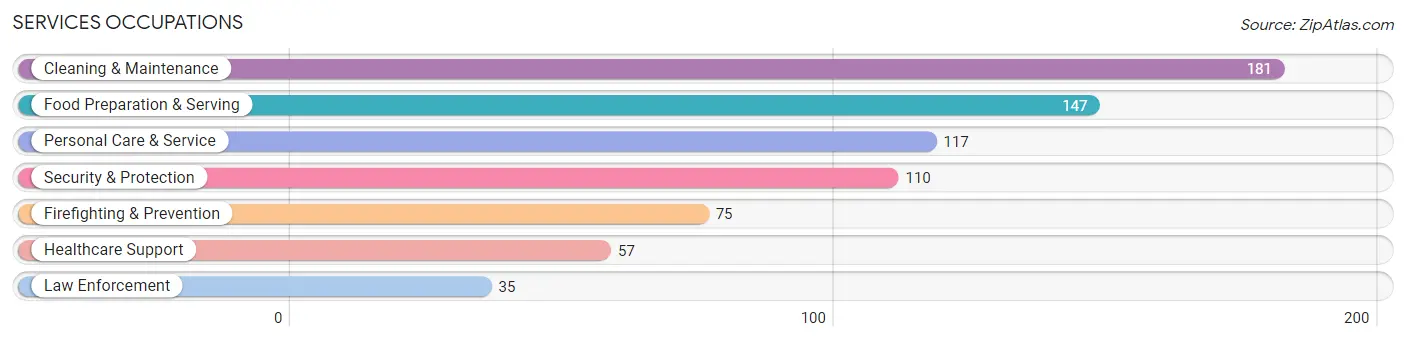
Services Occupations
The most common Services occupations in Lincoln Park borough are Cleaning & Maintenance (181 | 3.2%), Food Preparation & Serving (147 | 2.6%), Personal Care & Service (117 | 2.1%), Security & Protection (110 | 1.9%), and Firefighting & Prevention (75 | 1.3%).
Services Occupations by Sex
Within the Services occupations in Lincoln Park borough, the most male-oriented occupations are Security & Protection (100.0%), Firefighting & Prevention (100.0%), and Law Enforcement (100.0%), while the most female-oriented occupations are Healthcare Support (100.0%), Personal Care & Service (64.1%), and Food Preparation & Serving (52.4%).
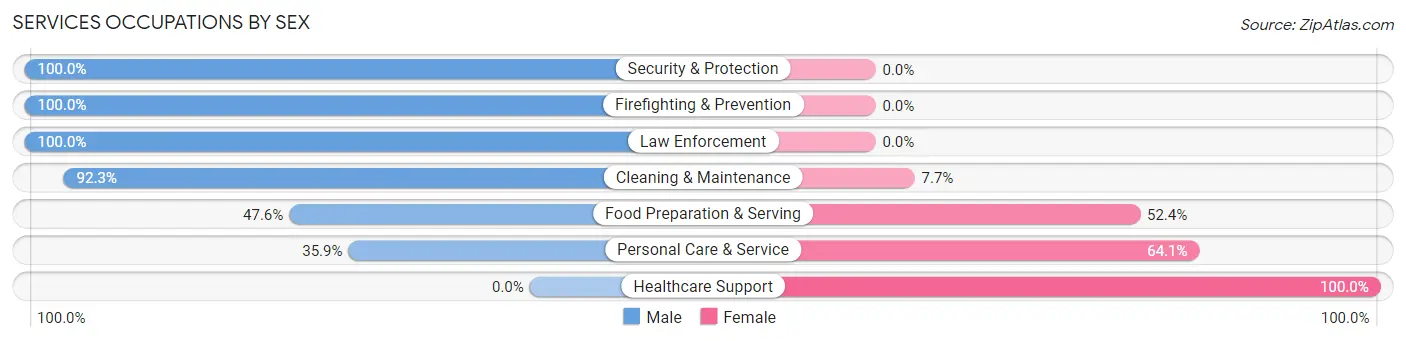
| Occupation | Male | Female |
| Healthcare Support | 0 (0.0%) | 57 (100.0%) |
| Security & Protection | 110 (100.0%) | 0 (0.0%) |
| Firefighting & Prevention | 75 (100.0%) | 0 (0.0%) |
| Law Enforcement | 35 (100.0%) | 0 (0.0%) |
| Food Preparation & Serving | 70 (47.6%) | 77 (52.4%) |
| Cleaning & Maintenance | 167 (92.3%) | 14 (7.7%) |
| Personal Care & Service | 42 (35.9%) | 75 (64.1%) |
| Total (Category) | 389 (63.6%) | 223 (36.4%) |
| Total (Overall) | 2,984 (52.2%) | 2,728 (47.8%) |
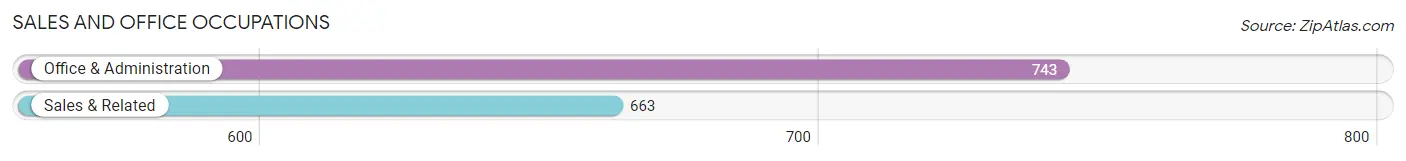
Sales and Office Occupations
The most common Sales and Office occupations in Lincoln Park borough are Office & Administration (743 | 13.0%), and Sales & Related (663 | 11.6%).
Sales and Office Occupations by Sex
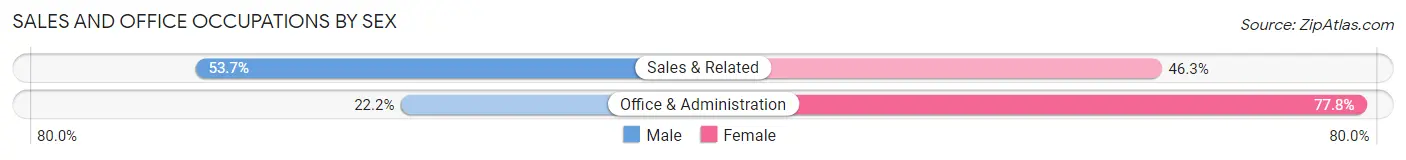
| Occupation | Male | Female |
| Sales & Related | 356 (53.7%) | 307 (46.3%) |
| Office & Administration | 165 (22.2%) | 578 (77.8%) |
| Total (Category) | 521 (37.1%) | 885 (62.9%) |
| Total (Overall) | 2,984 (52.2%) | 2,728 (47.8%) |
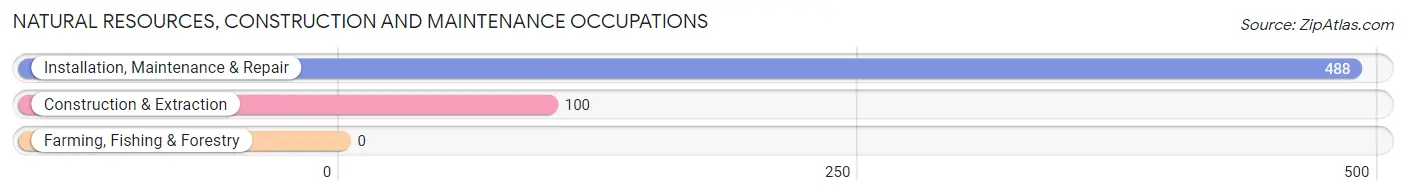
Natural Resources, Construction and Maintenance Occupations
The most common Natural Resources, Construction and Maintenance occupations in Lincoln Park borough are Installation, Maintenance & Repair (488 | 8.5%), and Construction & Extraction (100 | 1.8%).
Natural Resources, Construction and Maintenance Occupations by Sex
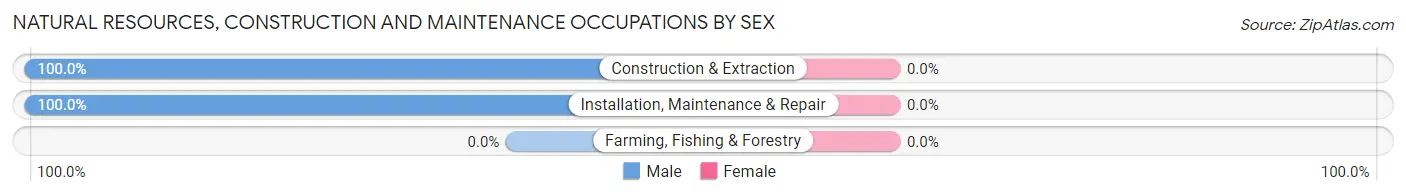
| Occupation | Male | Female |
| Farming, Fishing & Forestry | 0 (0.0%) | 0 (0.0%) |
| Construction & Extraction | 100 (100.0%) | 0 (0.0%) |
| Installation, Maintenance & Repair | 488 (100.0%) | 0 (0.0%) |
| Total (Category) | 588 (100.0%) | 0 (0.0%) |
| Total (Overall) | 2,984 (52.2%) | 2,728 (47.8%) |
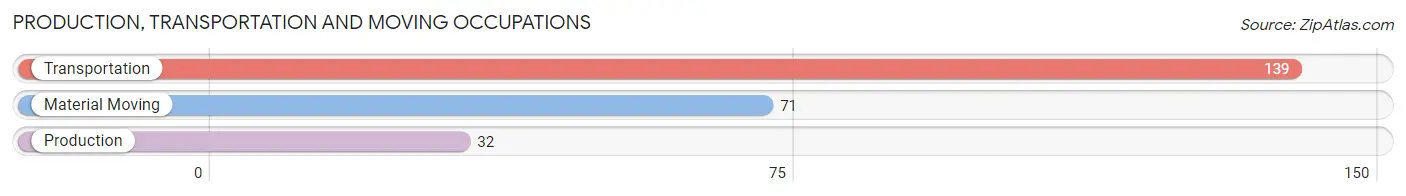
Production, Transportation and Moving Occupations
The most common Production, Transportation and Moving occupations in Lincoln Park borough are Transportation (139 | 2.4%), Material Moving (71 | 1.2%), and Production (32 | 0.6%).
Production, Transportation and Moving Occupations by Sex
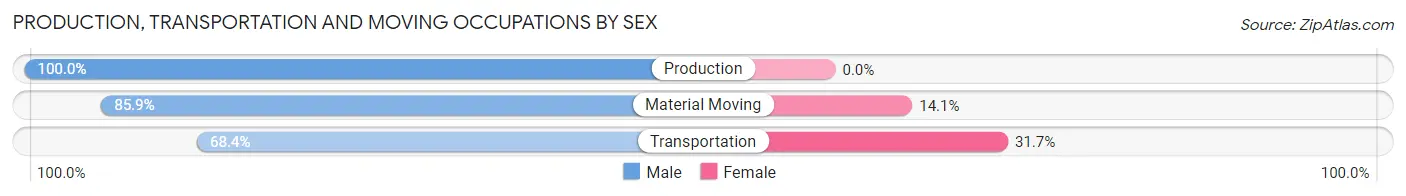
| Occupation | Male | Female |
| Production | 32 (100.0%) | 0 (0.0%) |
| Transportation | 95 (68.3%) | 44 (31.7%) |
| Material Moving | 61 (85.9%) | 10 (14.1%) |
| Total (Category) | 188 (77.7%) | 54 (22.3%) |
| Total (Overall) | 2,984 (52.2%) | 2,728 (47.8%) |
Employment Industries by Sex in Lincoln Park borough
Employment Industries in Lincoln Park borough
The major employment industries in Lincoln Park borough include Retail Trade (942 | 16.5%), Health Care & Social Assistance (742 | 13.0%), Educational Services (605 | 10.6%), Manufacturing (558 | 9.8%), and Professional & Scientific (548 | 9.6%).

Employment Industries by Sex in Lincoln Park borough
The Lincoln Park borough industries that see more men than women are Enterprise Management (100.0%), Information (89.5%), and Construction (83.7%), whereas the industries that tend to have a higher number of women are Utilities (85.7%), Educational Services (80.0%), and Health Care & Social Assistance (71.8%).
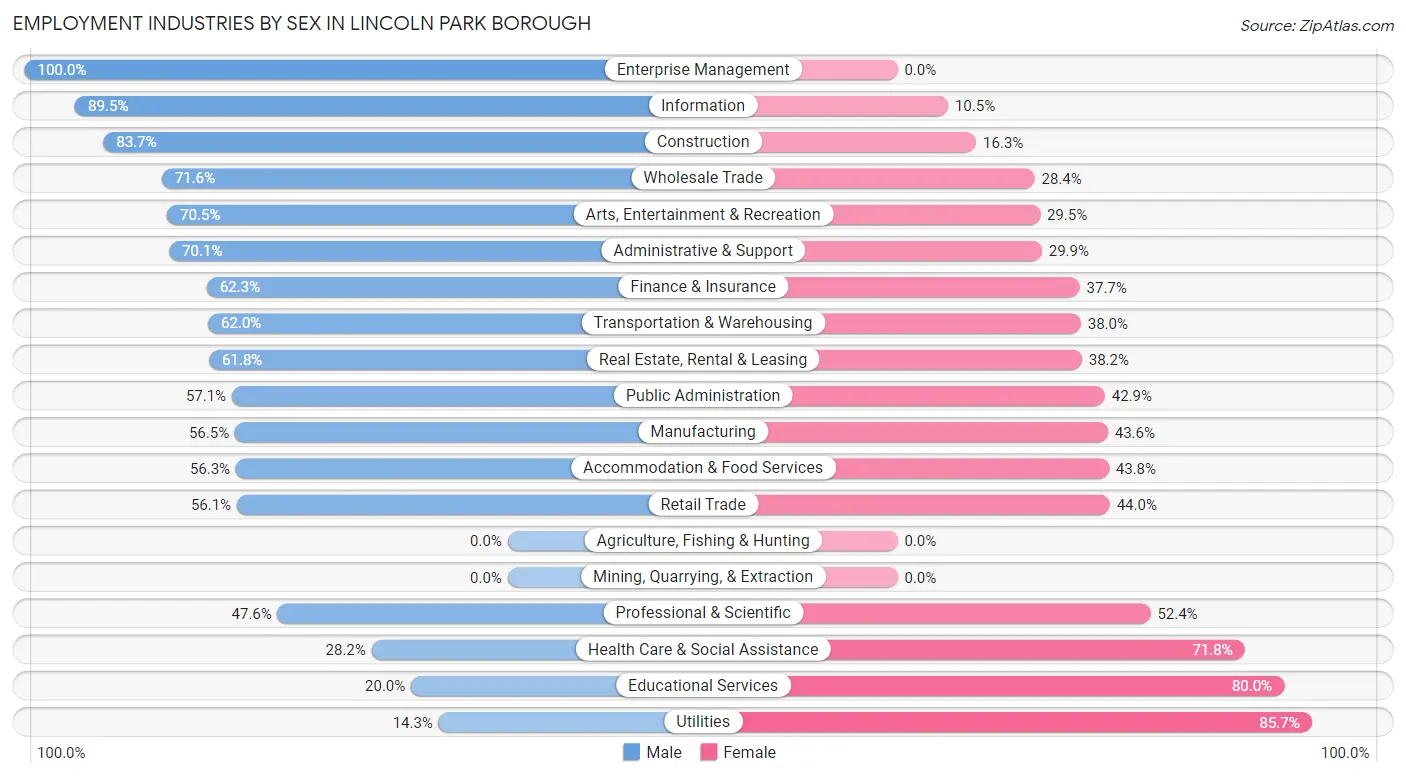
| Industry | Male | Female |
| Agriculture, Fishing & Hunting | 0 (0.0%) | 0 (0.0%) |
| Mining, Quarrying, & Extraction | 0 (0.0%) | 0 (0.0%) |
| Construction | 154 (83.7%) | 30 (16.3%) |
| Manufacturing | 315 (56.5%) | 243 (43.5%) |
| Wholesale Trade | 169 (71.6%) | 67 (28.4%) |
| Retail Trade | 528 (56.0%) | 414 (44.0%) |
| Transportation & Warehousing | 134 (62.0%) | 82 (38.0%) |
| Utilities | 8 (14.3%) | 48 (85.7%) |
| Information | 171 (89.5%) | 20 (10.5%) |
| Finance & Insurance | 147 (62.3%) | 89 (37.7%) |
| Real Estate, Rental & Leasing | 141 (61.8%) | 87 (38.2%) |
| Professional & Scientific | 261 (47.6%) | 287 (52.4%) |
| Enterprise Management | 14 (100.0%) | 0 (0.0%) |
| Administrative & Support | 61 (70.1%) | 26 (29.9%) |
| Educational Services | 121 (20.0%) | 484 (80.0%) |
| Health Care & Social Assistance | 209 (28.2%) | 533 (71.8%) |
| Arts, Entertainment & Recreation | 129 (70.5%) | 54 (29.5%) |
| Accommodation & Food Services | 144 (56.2%) | 112 (43.8%) |
| Public Administration | 125 (57.1%) | 94 (42.9%) |
| Total | 2,984 (52.2%) | 2,728 (47.8%) |
Education in Lincoln Park borough
School Enrollment in Lincoln Park borough
The most common levels of schooling among the 1,849 students in Lincoln Park borough are college / undergraduate (581 | 31.4%), high school (391 | 21.1%), and elementary school (304 | 16.4%).
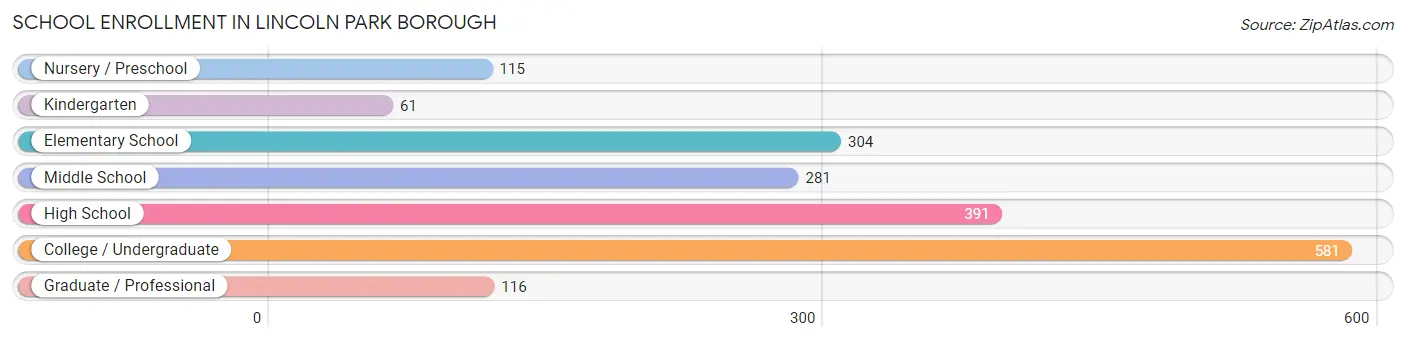
| School Level | # Students | % Students |
| Nursery / Preschool | 115 | 6.2% |
| Kindergarten | 61 | 3.3% |
| Elementary School | 304 | 16.4% |
| Middle School | 281 | 15.2% |
| High School | 391 | 21.1% |
| College / Undergraduate | 581 | 31.4% |
| Graduate / Professional | 116 | 6.3% |
| Total | 1,849 | 100.0% |
School Enrollment by Age by Funding Source in Lincoln Park borough
Out of a total of 1,849 students who are enrolled in schools in Lincoln Park borough, 431 (23.3%) attend a private institution, while the remaining 1,418 (76.7%) are enrolled in public schools. The age group of 3 to 4 year olds has the highest likelihood of being enrolled in private schools, with 90 (78.3% in the age bracket) enrolled. Conversely, the age group of 10 to 14 year olds has the lowest likelihood of being enrolled in a private school, with 291 (96.7% in the age bracket) attending a public institution.
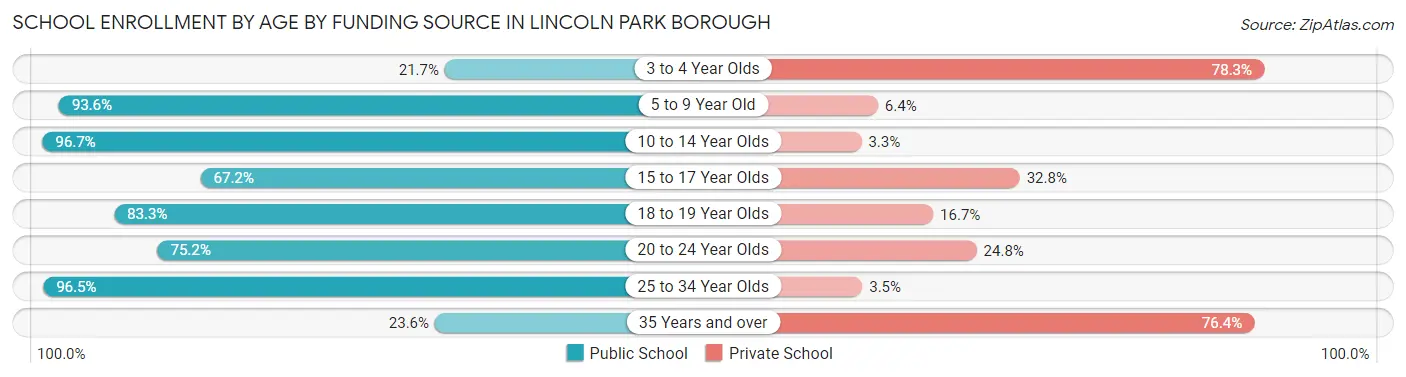
| Age Bracket | Public School | Private School |
| 3 to 4 Year Olds | 25 (21.7%) | 90 (78.3%) |
| 5 to 9 Year Old | 323 (93.6%) | 22 (6.4%) |
| 10 to 14 Year Olds | 291 (96.7%) | 10 (3.3%) |
| 15 to 17 Year Olds | 205 (67.2%) | 100 (32.8%) |
| 18 to 19 Year Olds | 130 (83.3%) | 26 (16.7%) |
| 20 to 24 Year Olds | 249 (75.2%) | 82 (24.8%) |
| 25 to 34 Year Olds | 167 (96.5%) | 6 (3.5%) |
| 35 Years and over | 29 (23.6%) | 94 (76.4%) |
| Total | 1,418 (76.7%) | 431 (23.3%) |
Educational Attainment by Field of Study in Lincoln Park borough
Business (861 | 21.1%), education (748 | 18.4%), psychology (298 | 7.3%), social sciences (288 | 7.1%), and science & technology (252 | 6.2%) are the most common fields of study among 4,074 individuals in Lincoln Park borough who have obtained a bachelor's degree or higher.
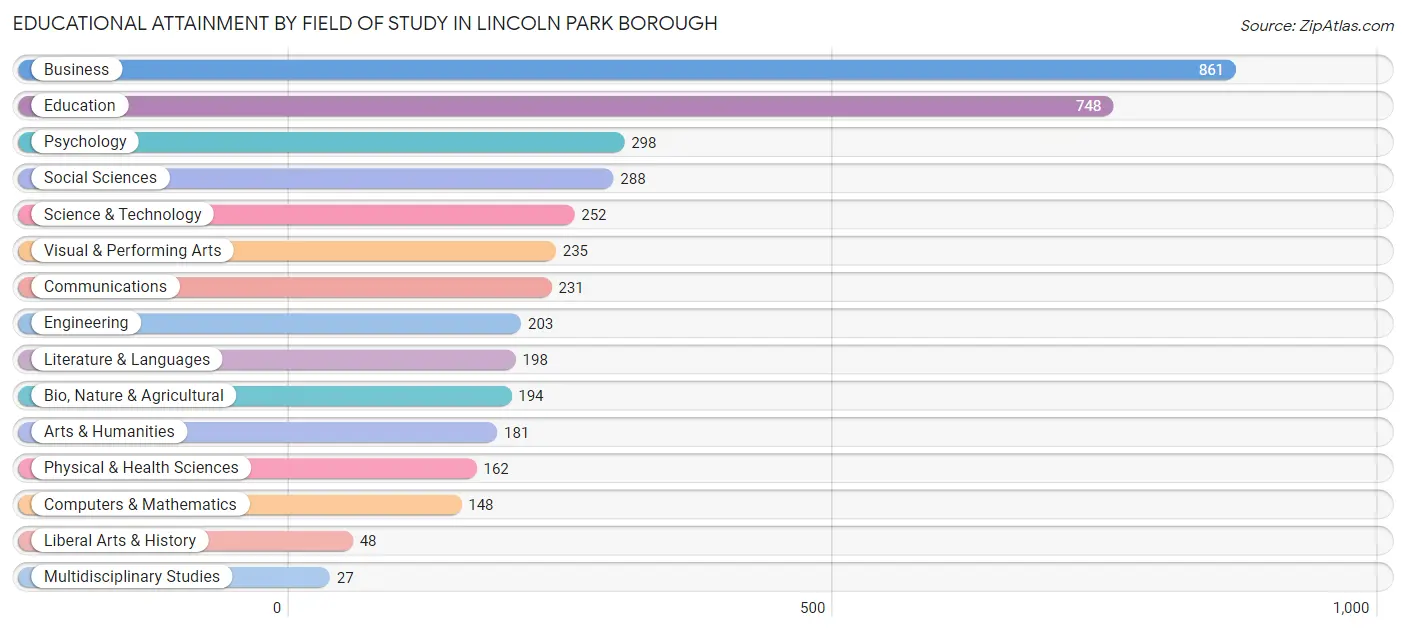
| Field of Study | # Graduates | % Graduates |
| Computers & Mathematics | 148 | 3.6% |
| Bio, Nature & Agricultural | 194 | 4.8% |
| Physical & Health Sciences | 162 | 4.0% |
| Psychology | 298 | 7.3% |
| Social Sciences | 288 | 7.1% |
| Engineering | 203 | 5.0% |
| Multidisciplinary Studies | 27 | 0.7% |
| Science & Technology | 252 | 6.2% |
| Business | 861 | 21.1% |
| Education | 748 | 18.4% |
| Literature & Languages | 198 | 4.9% |
| Liberal Arts & History | 48 | 1.2% |
| Visual & Performing Arts | 235 | 5.8% |
| Communications | 231 | 5.7% |
| Arts & Humanities | 181 | 4.4% |
| Total | 4,074 | 100.0% |
Transportation & Commute in Lincoln Park borough
Vehicle Availability by Sex in Lincoln Park borough
The most prevalent vehicle ownership categories in Lincoln Park borough are males with 2 vehicles (1,245, accounting for 42.1%) and females with 2 vehicles (1,099, making up 46.3%).
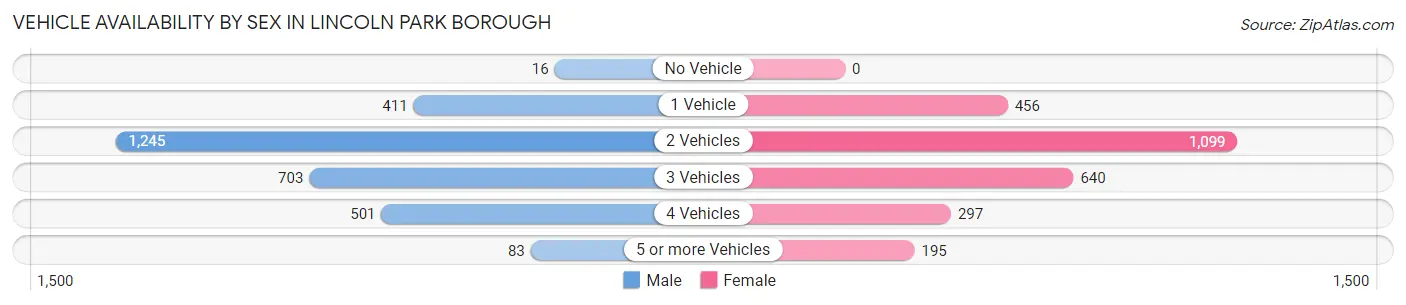
| Vehicles Available | Male | Female |
| No Vehicle | 16 (0.5%) | 0 (0.0%) |
| 1 Vehicle | 411 (13.9%) | 456 (17.0%) |
| 2 Vehicles | 1,245 (42.1%) | 1,099 (40.9%) |
| 3 Vehicles | 703 (23.8%) | 640 (23.8%) |
| 4 Vehicles | 501 (16.9%) | 297 (11.1%) |
| 5 or more Vehicles | 83 (2.8%) | 195 (7.3%) |
| Total | 2,959 (100.0%) | 2,687 (100.0%) |
Commute Time in Lincoln Park borough
The most frequently occuring commute durations in Lincoln Park borough are 30 to 34 minutes (827 commuters, 16.4%), 20 to 24 minutes (704 commuters, 14.0%), and 15 to 19 minutes (596 commuters, 11.8%).
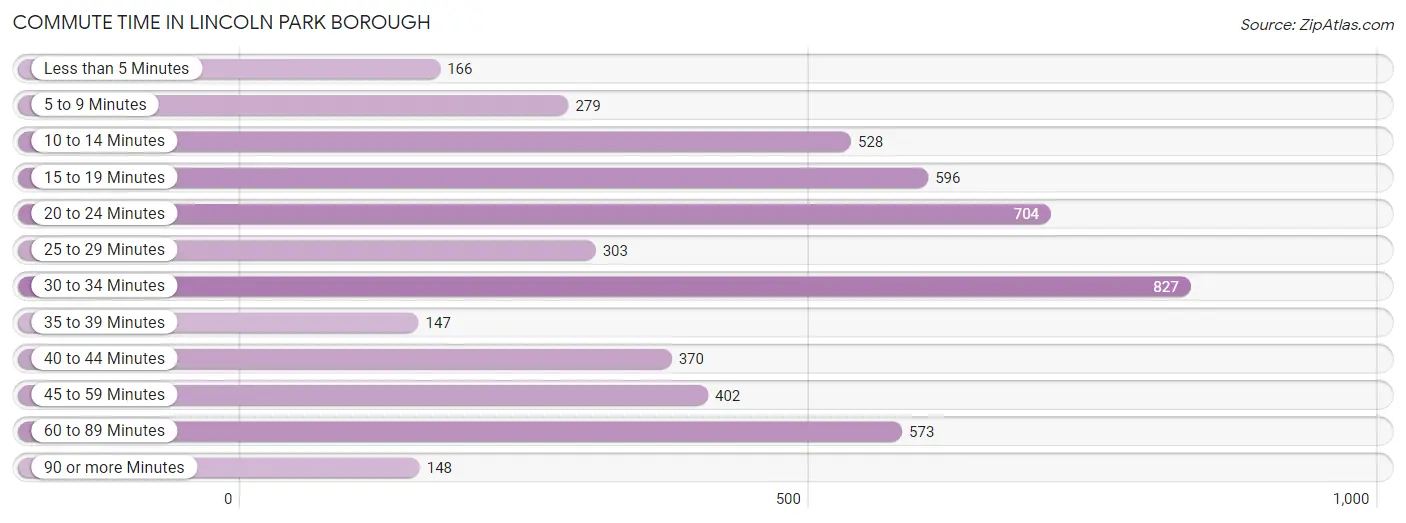
| Commute Time | # Commuters | % Commuters |
| Less than 5 Minutes | 166 | 3.3% |
| 5 to 9 Minutes | 279 | 5.5% |
| 10 to 14 Minutes | 528 | 10.5% |
| 15 to 19 Minutes | 596 | 11.8% |
| 20 to 24 Minutes | 704 | 14.0% |
| 25 to 29 Minutes | 303 | 6.0% |
| 30 to 34 Minutes | 827 | 16.4% |
| 35 to 39 Minutes | 147 | 2.9% |
| 40 to 44 Minutes | 370 | 7.3% |
| 45 to 59 Minutes | 402 | 8.0% |
| 60 to 89 Minutes | 573 | 11.4% |
| 90 or more Minutes | 148 | 2.9% |
Commute Time by Sex in Lincoln Park borough
The most common commute times in Lincoln Park borough are 30 to 34 minutes (443 commuters, 16.4%) for males and 20 to 24 minutes (471 commuters, 20.1%) for females.
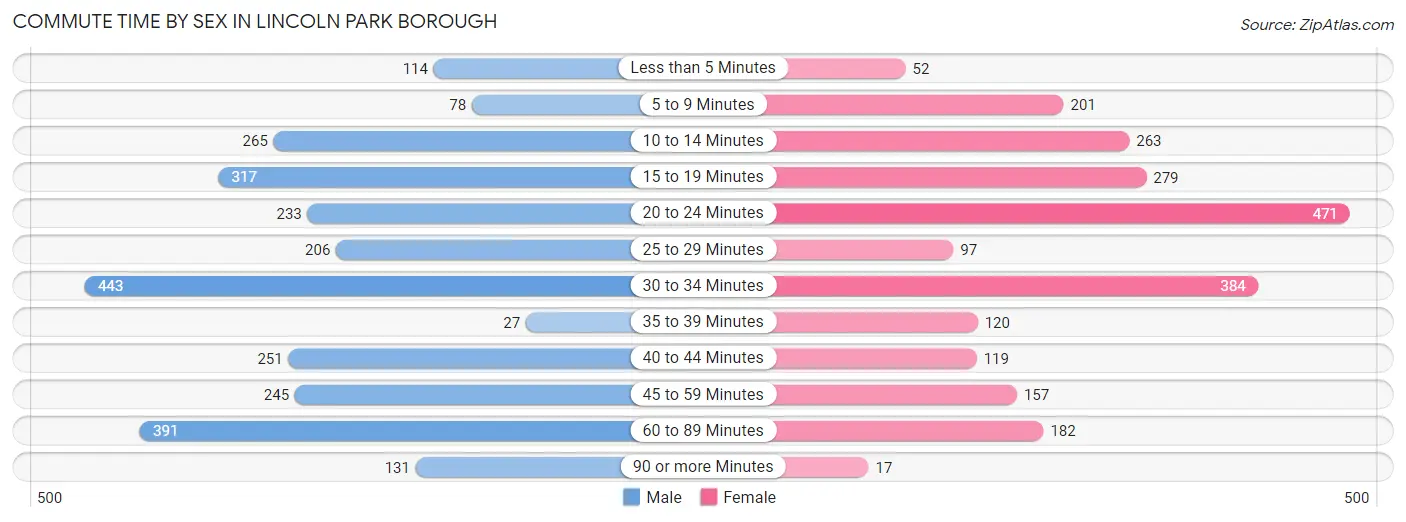
| Commute Time | Male | Female |
| Less than 5 Minutes | 114 (4.2%) | 52 (2.2%) |
| 5 to 9 Minutes | 78 (2.9%) | 201 (8.6%) |
| 10 to 14 Minutes | 265 (9.8%) | 263 (11.2%) |
| 15 to 19 Minutes | 317 (11.7%) | 279 (11.9%) |
| 20 to 24 Minutes | 233 (8.6%) | 471 (20.1%) |
| 25 to 29 Minutes | 206 (7.6%) | 97 (4.1%) |
| 30 to 34 Minutes | 443 (16.4%) | 384 (16.4%) |
| 35 to 39 Minutes | 27 (1.0%) | 120 (5.1%) |
| 40 to 44 Minutes | 251 (9.3%) | 119 (5.1%) |
| 45 to 59 Minutes | 245 (9.1%) | 157 (6.7%) |
| 60 to 89 Minutes | 391 (14.5%) | 182 (7.8%) |
| 90 or more Minutes | 131 (4.9%) | 17 (0.7%) |
Time of Departure to Work by Sex in Lincoln Park borough
The most frequent times of departure to work in Lincoln Park borough are 7:30 AM to 7:59 AM (397, 14.7%) for males and 8:00 AM to 8:29 AM (507, 21.6%) for females.
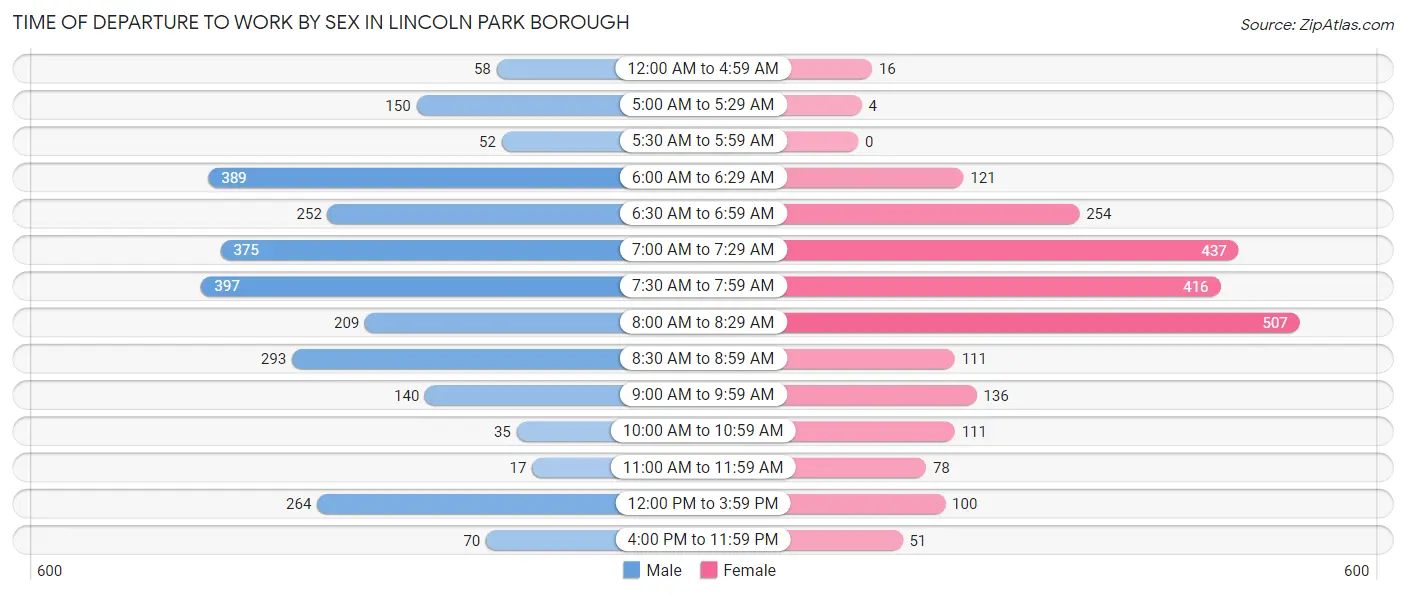
| Time of Departure | Male | Female |
| 12:00 AM to 4:59 AM | 58 (2.1%) | 16 (0.7%) |
| 5:00 AM to 5:29 AM | 150 (5.6%) | 4 (0.2%) |
| 5:30 AM to 5:59 AM | 52 (1.9%) | 0 (0.0%) |
| 6:00 AM to 6:29 AM | 389 (14.4%) | 121 (5.2%) |
| 6:30 AM to 6:59 AM | 252 (9.3%) | 254 (10.8%) |
| 7:00 AM to 7:29 AM | 375 (13.9%) | 437 (18.7%) |
| 7:30 AM to 7:59 AM | 397 (14.7%) | 416 (17.8%) |
| 8:00 AM to 8:29 AM | 209 (7.7%) | 507 (21.6%) |
| 8:30 AM to 8:59 AM | 293 (10.8%) | 111 (4.7%) |
| 9:00 AM to 9:59 AM | 140 (5.2%) | 136 (5.8%) |
| 10:00 AM to 10:59 AM | 35 (1.3%) | 111 (4.7%) |
| 11:00 AM to 11:59 AM | 17 (0.6%) | 78 (3.3%) |
| 12:00 PM to 3:59 PM | 264 (9.8%) | 100 (4.3%) |
| 4:00 PM to 11:59 PM | 70 (2.6%) | 51 (2.2%) |
| Total | 2,701 (100.0%) | 2,342 (100.0%) |
Housing Occupancy in Lincoln Park borough
Occupancy by Ownership in Lincoln Park borough
Of the total 4,117 dwellings in Lincoln Park borough, owner-occupied units account for 3,189 (77.5%), while renter-occupied units make up 928 (22.5%).
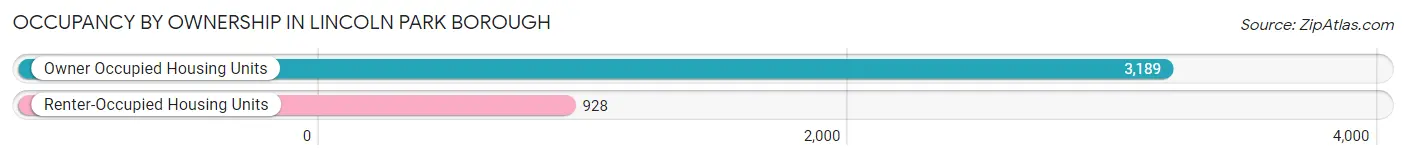
| Occupancy | # Housing Units | % Housing Units |
| Owner Occupied Housing Units | 3,189 | 77.5% |
| Renter-Occupied Housing Units | 928 | 22.5% |
| Total Occupied Housing Units | 4,117 | 100.0% |
Occupancy by Household Size in Lincoln Park borough
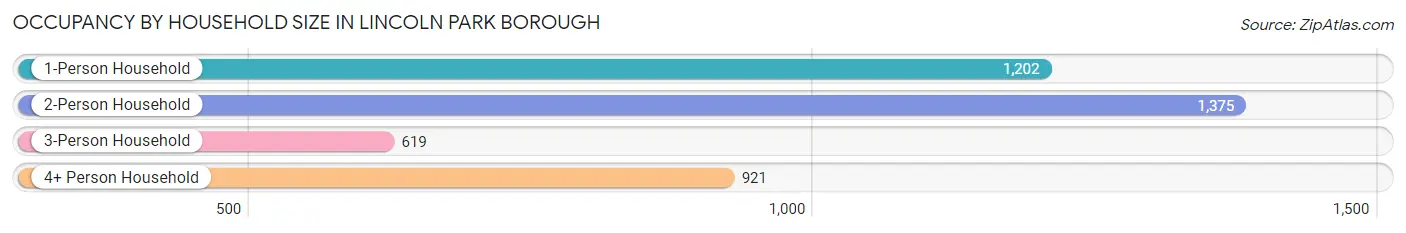
| Household Size | # Housing Units | % Housing Units |
| 1-Person Household | 1,202 | 29.2% |
| 2-Person Household | 1,375 | 33.4% |
| 3-Person Household | 619 | 15.0% |
| 4+ Person Household | 921 | 22.4% |
| Total Housing Units | 4,117 | 100.0% |
Occupancy by Ownership by Household Size in Lincoln Park borough
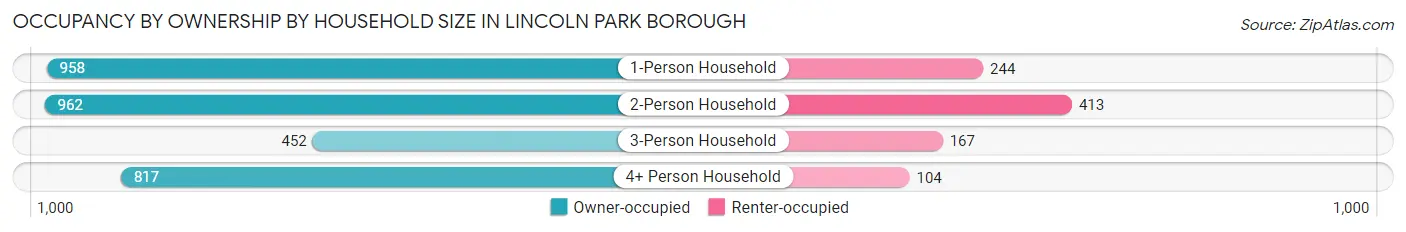
| Household Size | Owner-occupied | Renter-occupied |
| 1-Person Household | 958 (79.7%) | 244 (20.3%) |
| 2-Person Household | 962 (70.0%) | 413 (30.0%) |
| 3-Person Household | 452 (73.0%) | 167 (27.0%) |
| 4+ Person Household | 817 (88.7%) | 104 (11.3%) |
| Total Housing Units | 3,189 (77.5%) | 928 (22.5%) |
Occupancy by Educational Attainment in Lincoln Park borough
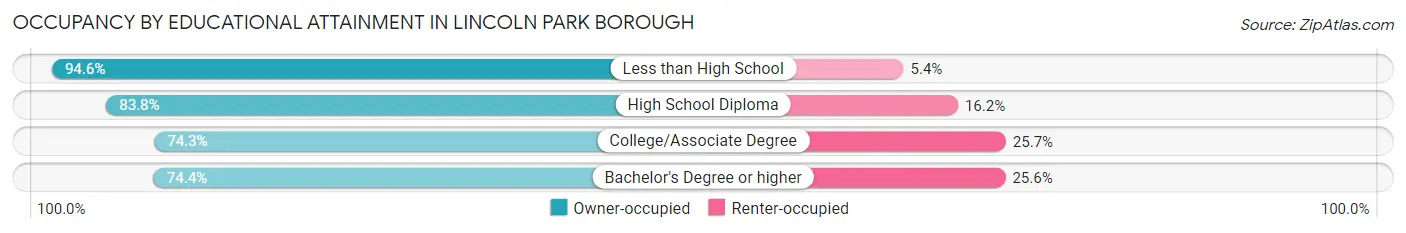
| Household Size | Owner-occupied | Renter-occupied |
| Less than High School | 226 (94.6%) | 13 (5.4%) |
| High School Diploma | 713 (83.8%) | 138 (16.2%) |
| College/Associate Degree | 693 (74.3%) | 240 (25.7%) |
| Bachelor's Degree or higher | 1,557 (74.4%) | 537 (25.6%) |
Occupancy by Age of Householder in Lincoln Park borough
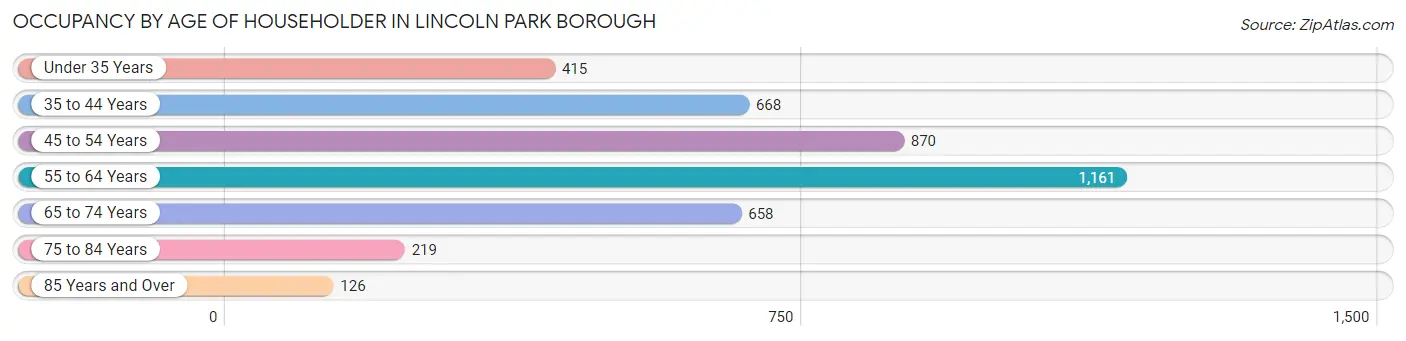
| Age Bracket | # Households | % Households |
| Under 35 Years | 415 | 10.1% |
| 35 to 44 Years | 668 | 16.2% |
| 45 to 54 Years | 870 | 21.1% |
| 55 to 64 Years | 1,161 | 28.2% |
| 65 to 74 Years | 658 | 16.0% |
| 75 to 84 Years | 219 | 5.3% |
| 85 Years and Over | 126 | 3.1% |
| Total | 4,117 | 100.0% |
Housing Finances in Lincoln Park borough
Median Income by Occupancy in Lincoln Park borough
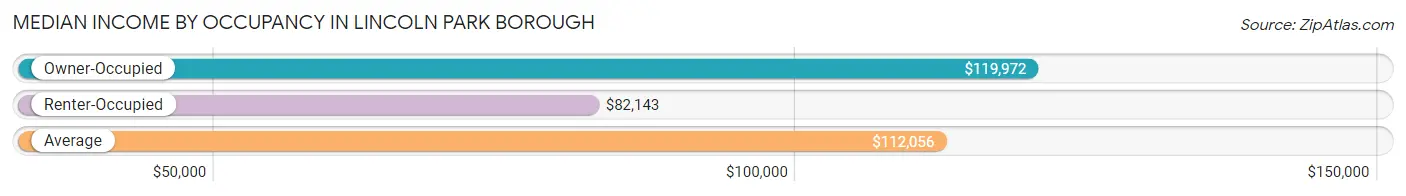
| Occupancy Type | # Households | Median Income |
| Owner-Occupied | 3,189 (77.5%) | $119,972 |
| Renter-Occupied | 928 (22.5%) | $82,143 |
| Average | 4,117 (100.0%) | $112,056 |
Occupancy by Householder Income Bracket in Lincoln Park borough
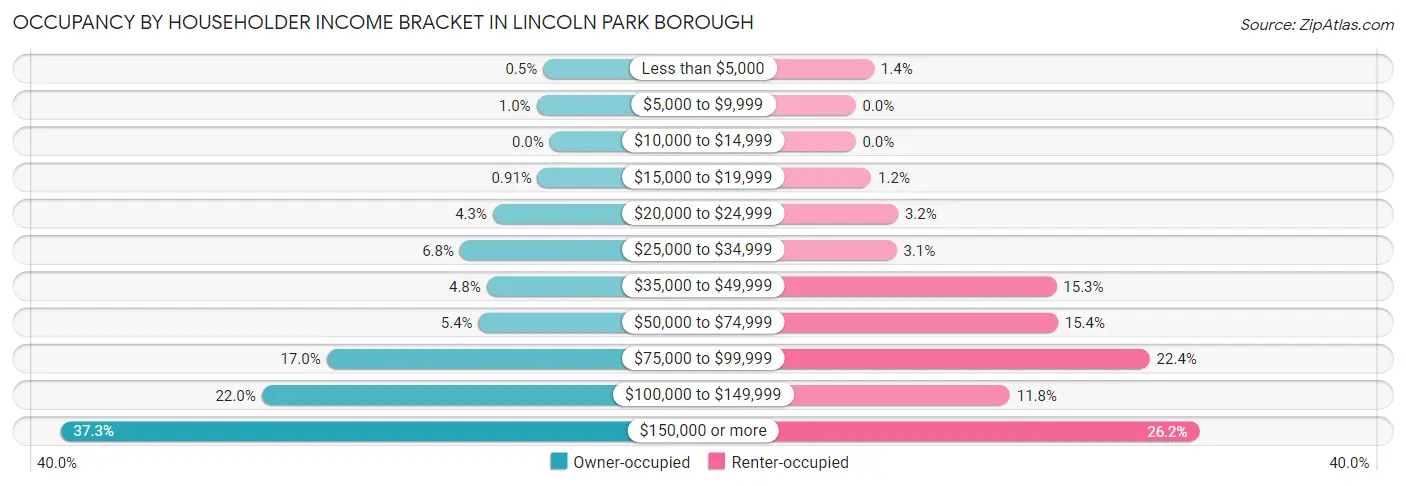
| Income Bracket | Owner-occupied | Renter-occupied |
| Less than $5,000 | 16 (0.5%) | 13 (1.4%) |
| $5,000 to $9,999 | 32 (1.0%) | 0 (0.0%) |
| $10,000 to $14,999 | 0 (0.0%) | 0 (0.0%) |
| $15,000 to $19,999 | 29 (0.9%) | 11 (1.2%) |
| $20,000 to $24,999 | 138 (4.3%) | 30 (3.2%) |
| $25,000 to $34,999 | 218 (6.8%) | 29 (3.1%) |
| $35,000 to $49,999 | 153 (4.8%) | 142 (15.3%) |
| $50,000 to $74,999 | 173 (5.4%) | 143 (15.4%) |
| $75,000 to $99,999 | 542 (17.0%) | 208 (22.4%) |
| $100,000 to $149,999 | 700 (22.0%) | 109 (11.7%) |
| $150,000 or more | 1,188 (37.2%) | 243 (26.2%) |
| Total | 3,189 (100.0%) | 928 (100.0%) |
Monthly Housing Cost Tiers in Lincoln Park borough
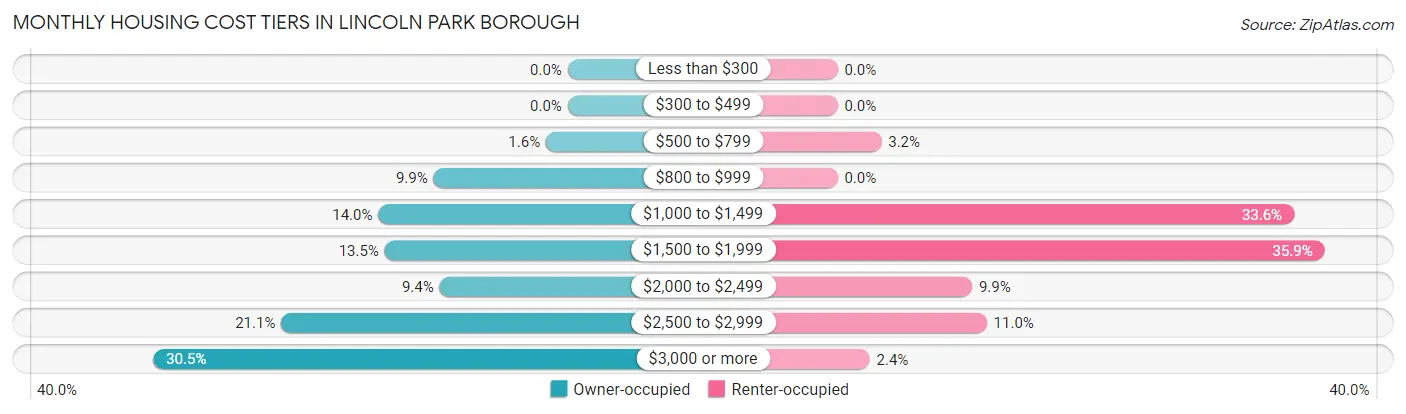
| Monthly Cost | Owner-occupied | Renter-occupied |
| Less than $300 | 0 (0.0%) | 0 (0.0%) |
| $300 to $499 | 0 (0.0%) | 0 (0.0%) |
| $500 to $799 | 51 (1.6%) | 30 (3.2%) |
| $800 to $999 | 315 (9.9%) | 0 (0.0%) |
| $1,000 to $1,499 | 445 (14.0%) | 312 (33.6%) |
| $1,500 to $1,999 | 430 (13.5%) | 333 (35.9%) |
| $2,000 to $2,499 | 301 (9.4%) | 92 (9.9%) |
| $2,500 to $2,999 | 673 (21.1%) | 102 (11.0%) |
| $3,000 or more | 974 (30.5%) | 22 (2.4%) |
| Total | 3,189 (100.0%) | 928 (100.0%) |
Physical Housing Characteristics in Lincoln Park borough
Housing Structures in Lincoln Park borough
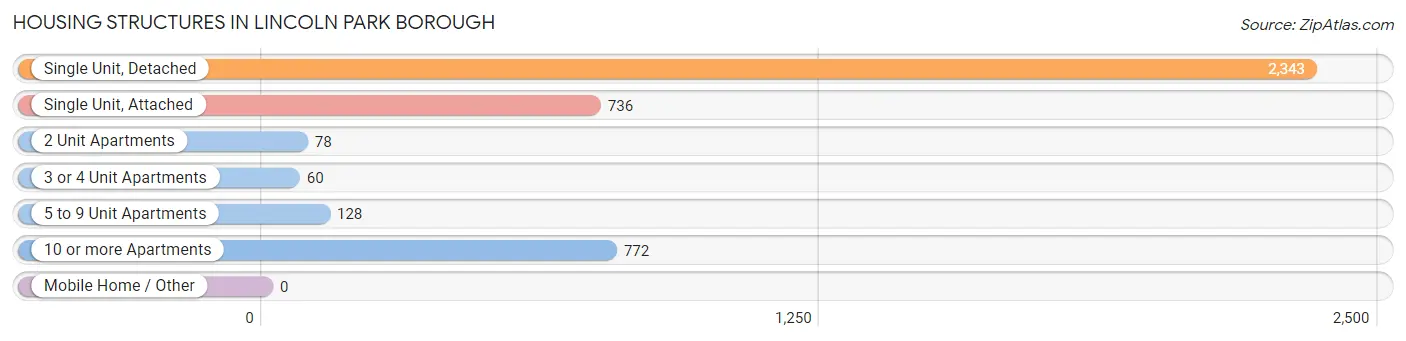
| Structure Type | # Housing Units | % Housing Units |
| Single Unit, Detached | 2,343 | 56.9% |
| Single Unit, Attached | 736 | 17.9% |
| 2 Unit Apartments | 78 | 1.9% |
| 3 or 4 Unit Apartments | 60 | 1.5% |
| 5 to 9 Unit Apartments | 128 | 3.1% |
| 10 or more Apartments | 772 | 18.8% |
| Mobile Home / Other | 0 | 0.0% |
| Total | 4,117 | 100.0% |
Housing Structures by Occupancy in Lincoln Park borough
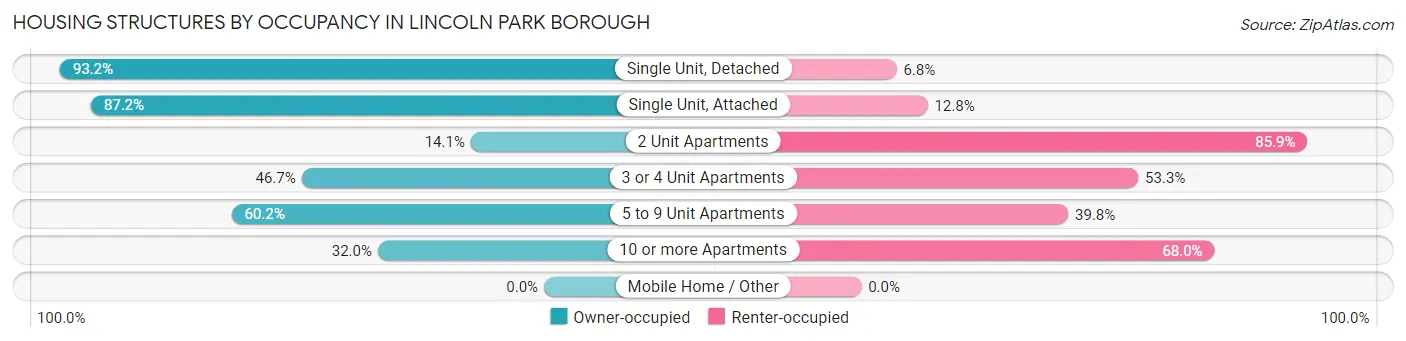
| Structure Type | Owner-occupied | Renter-occupied |
| Single Unit, Detached | 2,184 (93.2%) | 159 (6.8%) |
| Single Unit, Attached | 642 (87.2%) | 94 (12.8%) |
| 2 Unit Apartments | 11 (14.1%) | 67 (85.9%) |
| 3 or 4 Unit Apartments | 28 (46.7%) | 32 (53.3%) |
| 5 to 9 Unit Apartments | 77 (60.2%) | 51 (39.8%) |
| 10 or more Apartments | 247 (32.0%) | 525 (68.0%) |
| Mobile Home / Other | 0 (0.0%) | 0 (0.0%) |
| Total | 3,189 (77.5%) | 928 (22.5%) |
Housing Structures by Number of Rooms in Lincoln Park borough
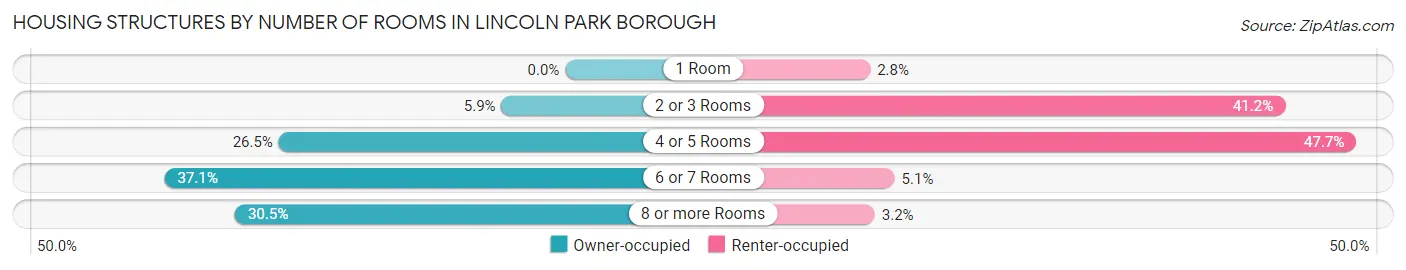
| Number of Rooms | Owner-occupied | Renter-occupied |
| 1 Room | 0 (0.0%) | 26 (2.8%) |
| 2 or 3 Rooms | 188 (5.9%) | 382 (41.2%) |
| 4 or 5 Rooms | 845 (26.5%) | 443 (47.7%) |
| 6 or 7 Rooms | 1,182 (37.1%) | 47 (5.1%) |
| 8 or more Rooms | 974 (30.5%) | 30 (3.2%) |
| Total | 3,189 (100.0%) | 928 (100.0%) |
Housing Structure by Heating Type in Lincoln Park borough
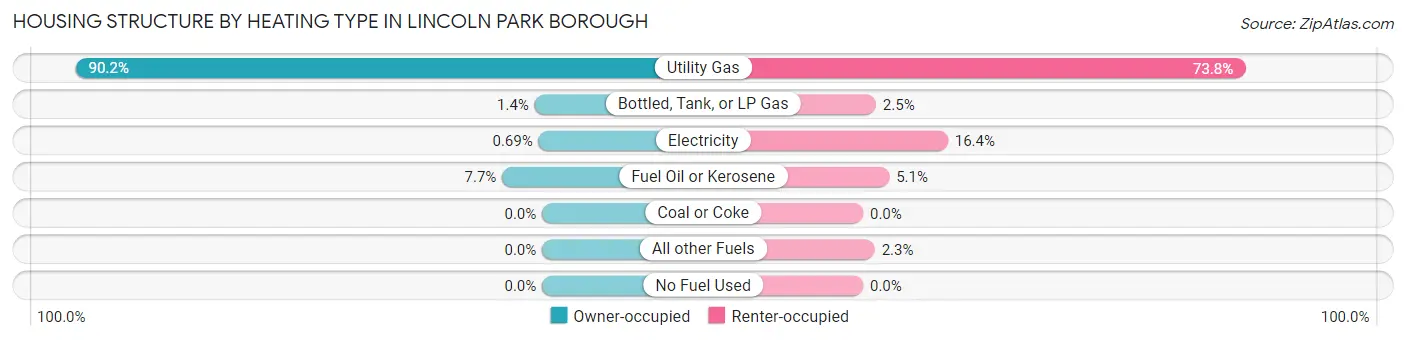
| Heating Type | Owner-occupied | Renter-occupied |
| Utility Gas | 2,875 (90.1%) | 685 (73.8%) |
| Bottled, Tank, or LP Gas | 46 (1.4%) | 23 (2.5%) |
| Electricity | 22 (0.7%) | 152 (16.4%) |
| Fuel Oil or Kerosene | 246 (7.7%) | 47 (5.1%) |
| Coal or Coke | 0 (0.0%) | 0 (0.0%) |
| All other Fuels | 0 (0.0%) | 21 (2.3%) |
| No Fuel Used | 0 (0.0%) | 0 (0.0%) |
| Total | 3,189 (100.0%) | 928 (100.0%) |
Household Vehicle Usage in Lincoln Park borough
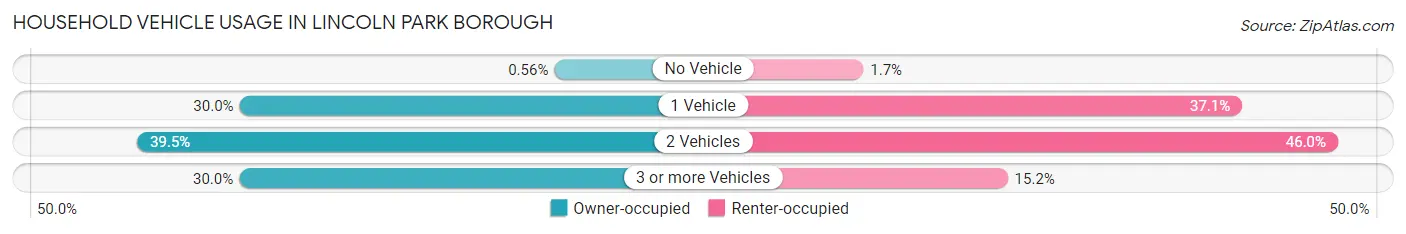
| Vehicles per Household | Owner-occupied | Renter-occupied |
| No Vehicle | 18 (0.6%) | 16 (1.7%) |
| 1 Vehicle | 955 (29.9%) | 344 (37.1%) |
| 2 Vehicles | 1,260 (39.5%) | 427 (46.0%) |
| 3 or more Vehicles | 956 (30.0%) | 141 (15.2%) |
| Total | 3,189 (100.0%) | 928 (100.0%) |
Real Estate & Mortgages in Lincoln Park borough
Real Estate and Mortgage Overview in Lincoln Park borough
| Characteristic | Without Mortgage | With Mortgage |
| Housing Units | 1,042 | 2,147 |
| Median Property Value | $347,800 | $424,900 |
| Median Household Income | $90,174 | $946 |
| Monthly Housing Costs | $1,188 | $942 |
| Real Estate Taxes | $8,608 | $0 |
Property Value by Mortgage Status in Lincoln Park borough
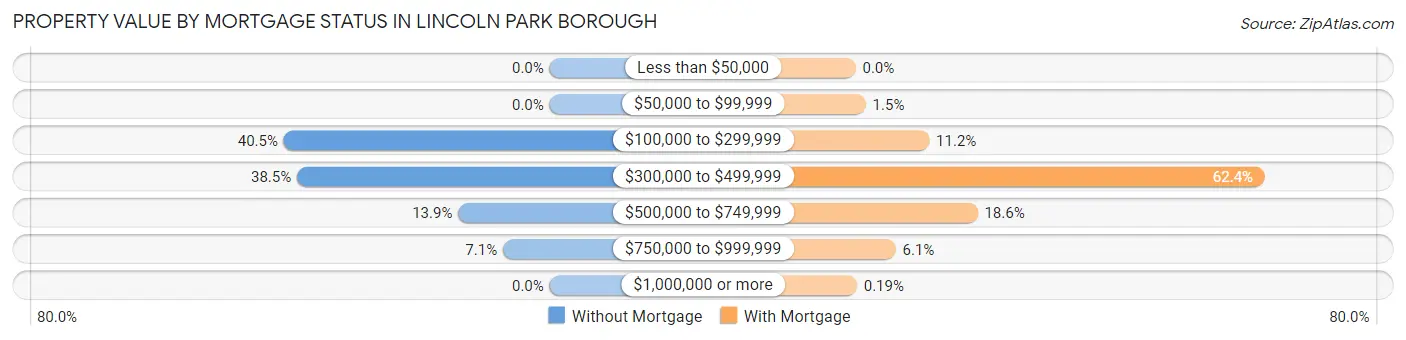
| Property Value | Without Mortgage | With Mortgage |
| Less than $50,000 | 0 (0.0%) | 0 (0.0%) |
| $50,000 to $99,999 | 0 (0.0%) | 33 (1.5%) |
| $100,000 to $299,999 | 422 (40.5%) | 241 (11.2%) |
| $300,000 to $499,999 | 401 (38.5%) | 1,339 (62.4%) |
| $500,000 to $749,999 | 145 (13.9%) | 399 (18.6%) |
| $750,000 to $999,999 | 74 (7.1%) | 131 (6.1%) |
| $1,000,000 or more | 0 (0.0%) | 4 (0.2%) |
| Total | 1,042 (100.0%) | 2,147 (100.0%) |
Household Income by Mortgage Status in Lincoln Park borough
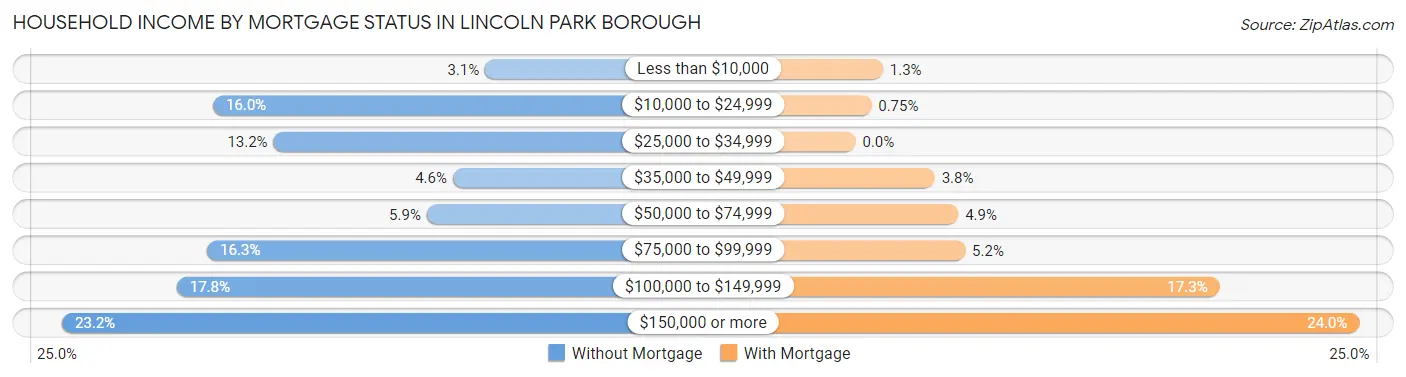
| Household Income | Without Mortgage | With Mortgage |
| Less than $10,000 | 32 (3.1%) | 28 (1.3%) |
| $10,000 to $24,999 | 167 (16.0%) | 16 (0.7%) |
| $25,000 to $34,999 | 137 (13.2%) | 0 (0.0%) |
| $35,000 to $49,999 | 48 (4.6%) | 81 (3.8%) |
| $50,000 to $74,999 | 61 (5.9%) | 105 (4.9%) |
| $75,000 to $99,999 | 170 (16.3%) | 112 (5.2%) |
| $100,000 to $149,999 | 185 (17.7%) | 372 (17.3%) |
| $150,000 or more | 242 (23.2%) | 515 (24.0%) |
| Total | 1,042 (100.0%) | 2,147 (100.0%) |
Property Value to Household Income Ratio in Lincoln Park borough
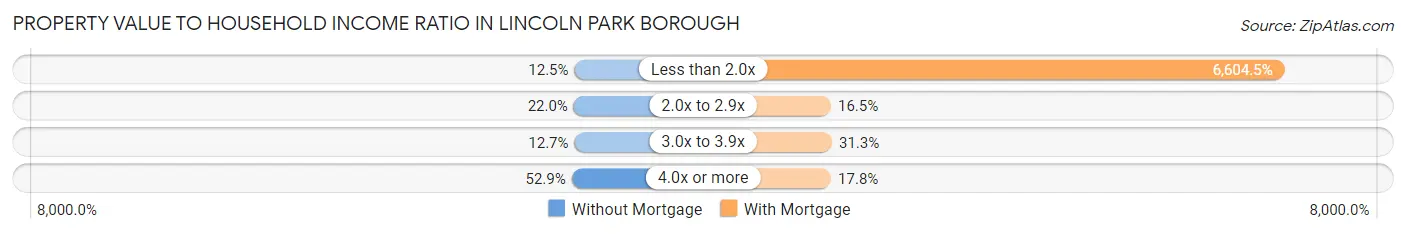
| Value-to-Income Ratio | Without Mortgage | With Mortgage |
| Less than 2.0x | 130 (12.5%) | 141,799 (6,604.5%) |
| 2.0x to 2.9x | 229 (22.0%) | 354 (16.5%) |
| 3.0x to 3.9x | 132 (12.7%) | 672 (31.3%) |
| 4.0x or more | 551 (52.9%) | 381 (17.7%) |
| Total | 1,042 (100.0%) | 2,147 (100.0%) |
Real Estate Taxes by Mortgage Status in Lincoln Park borough
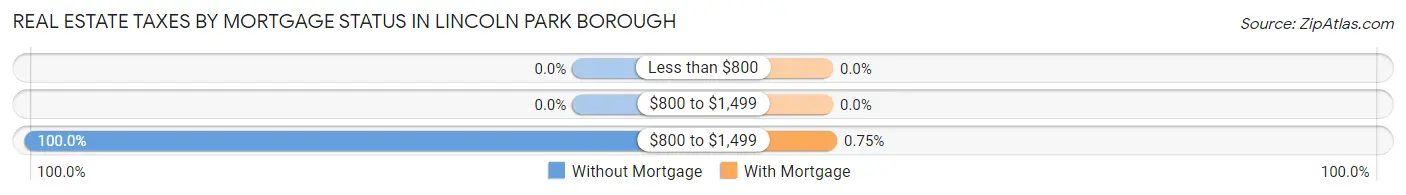
| Property Taxes | Without Mortgage | With Mortgage |
| Less than $800 | 0 (0.0%) | 0 (0.0%) |
| $800 to $1,499 | 0 (0.0%) | 0 (0.0%) |
| $800 to $1,499 | 1,042 (100.0%) | 16 (0.7%) |
| Total | 1,042 (100.0%) | 2,147 (100.0%) |
Health & Disability in Lincoln Park borough
Health Insurance Coverage by Age in Lincoln Park borough
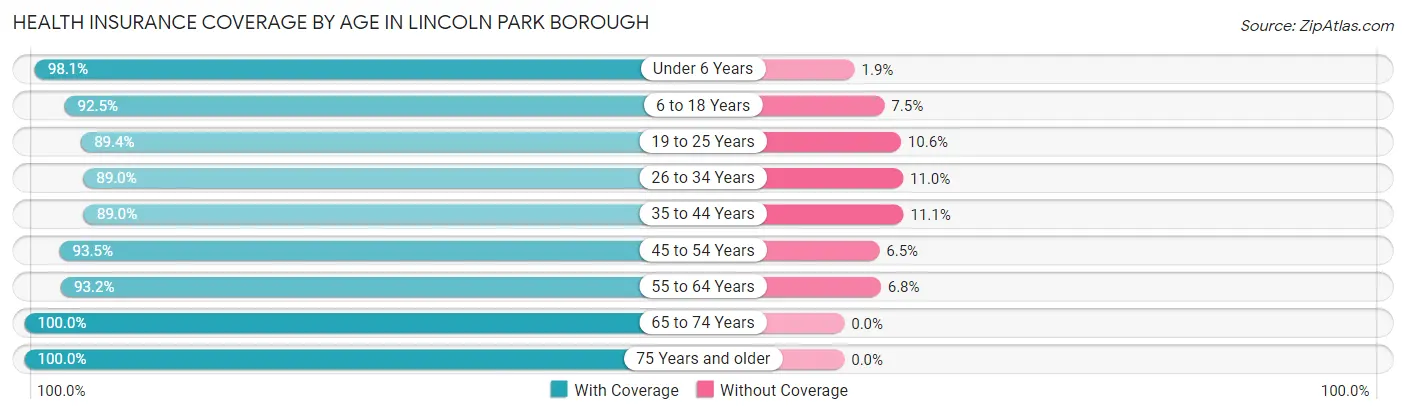
| Age Bracket | With Coverage | Without Coverage |
| Under 6 Years | 562 (98.1%) | 11 (1.9%) |
| 6 to 18 Years | 1,063 (92.5%) | 86 (7.5%) |
| 19 to 25 Years | 813 (89.4%) | 96 (10.6%) |
| 26 to 34 Years | 1,160 (89.0%) | 143 (11.0%) |
| 35 to 44 Years | 1,127 (88.9%) | 140 (11.1%) |
| 45 to 54 Years | 1,357 (93.5%) | 95 (6.5%) |
| 55 to 64 Years | 1,765 (93.2%) | 129 (6.8%) |
| 65 to 74 Years | 1,057 (100.0%) | 0 (0.0%) |
| 75 Years and older | 626 (100.0%) | 0 (0.0%) |
| Total | 9,530 (93.2%) | 700 (6.8%) |
Health Insurance Coverage by Citizenship Status in Lincoln Park borough
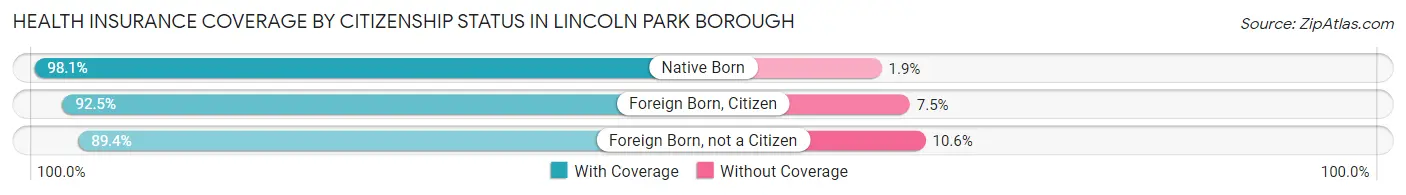
| Citizenship Status | With Coverage | Without Coverage |
| Native Born | 562 (98.1%) | 11 (1.9%) |
| Foreign Born, Citizen | 1,063 (92.5%) | 86 (7.5%) |
| Foreign Born, not a Citizen | 813 (89.4%) | 96 (10.6%) |
Health Insurance Coverage by Household Income in Lincoln Park borough
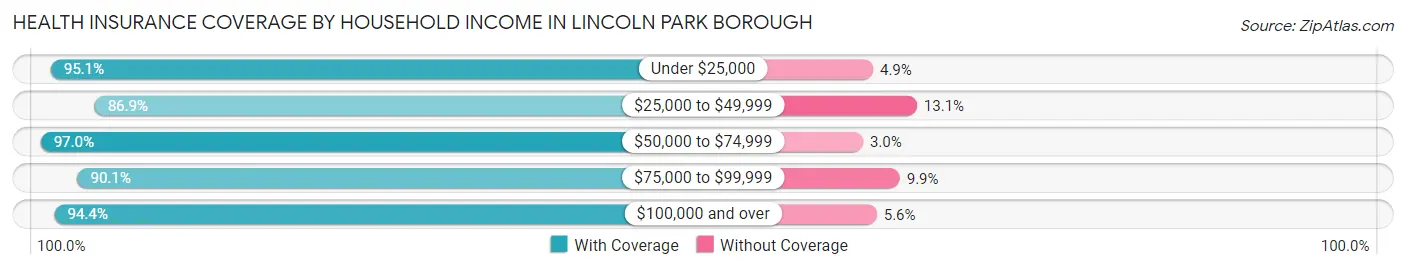
| Household Income | With Coverage | Without Coverage |
| Under $25,000 | 348 (95.1%) | 18 (4.9%) |
| $25,000 to $49,999 | 886 (86.9%) | 134 (13.1%) |
| $50,000 to $74,999 | 672 (97.0%) | 21 (3.0%) |
| $75,000 to $99,999 | 1,397 (90.1%) | 154 (9.9%) |
| $100,000 and over | 6,210 (94.4%) | 370 (5.6%) |
Public vs Private Health Insurance Coverage by Age in Lincoln Park borough
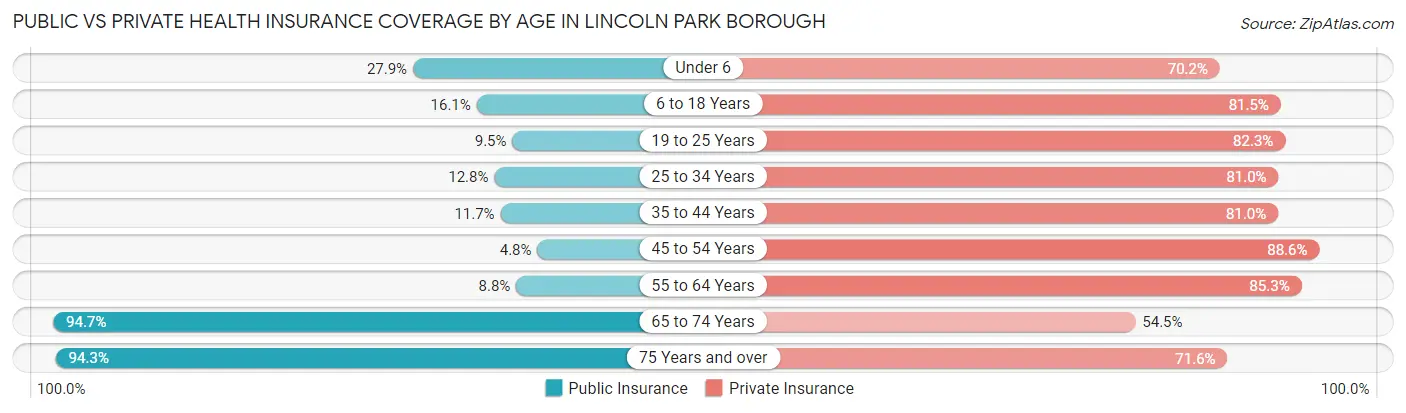
| Age Bracket | Public Insurance | Private Insurance |
| Under 6 | 160 (27.9%) | 402 (70.2%) |
| 6 to 18 Years | 185 (16.1%) | 936 (81.5%) |
| 19 to 25 Years | 86 (9.5%) | 748 (82.3%) |
| 25 to 34 Years | 167 (12.8%) | 1,056 (81.0%) |
| 35 to 44 Years | 148 (11.7%) | 1,026 (81.0%) |
| 45 to 54 Years | 70 (4.8%) | 1,287 (88.6%) |
| 55 to 64 Years | 166 (8.8%) | 1,616 (85.3%) |
| 65 to 74 Years | 1,001 (94.7%) | 576 (54.5%) |
| 75 Years and over | 590 (94.3%) | 448 (71.6%) |
| Total | 2,573 (25.2%) | 8,095 (79.1%) |
Disability Status by Sex by Age in Lincoln Park borough
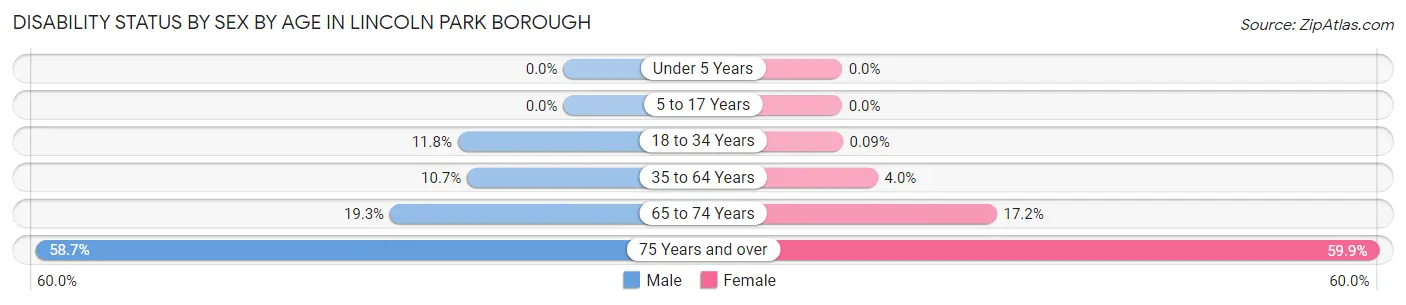
| Age Bracket | Male | Female |
| Under 5 Years | 0 (0.0%) | 0 (0.0%) |
| 5 to 17 Years | 0 (0.0%) | 0 (0.0%) |
| 18 to 34 Years | 135 (11.8%) | 1 (0.1%) |
| 35 to 64 Years | 261 (10.7%) | 87 (4.0%) |
| 65 to 74 Years | 73 (19.3%) | 117 (17.2%) |
| 75 Years and over | 135 (58.7%) | 237 (59.9%) |
Disability Class by Sex by Age in Lincoln Park borough
Disability Class: Hearing Difficulty
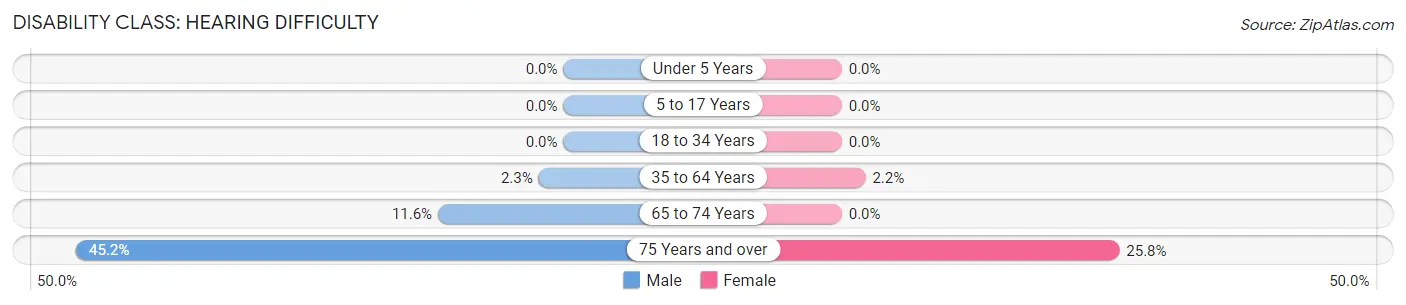
| Age Bracket | Male | Female |
| Under 5 Years | 0 (0.0%) | 0 (0.0%) |
| 5 to 17 Years | 0 (0.0%) | 0 (0.0%) |
| 18 to 34 Years | 0 (0.0%) | 0 (0.0%) |
| 35 to 64 Years | 56 (2.3%) | 48 (2.2%) |
| 65 to 74 Years | 44 (11.6%) | 0 (0.0%) |
| 75 Years and over | 104 (45.2%) | 102 (25.8%) |
Disability Class: Vision Difficulty
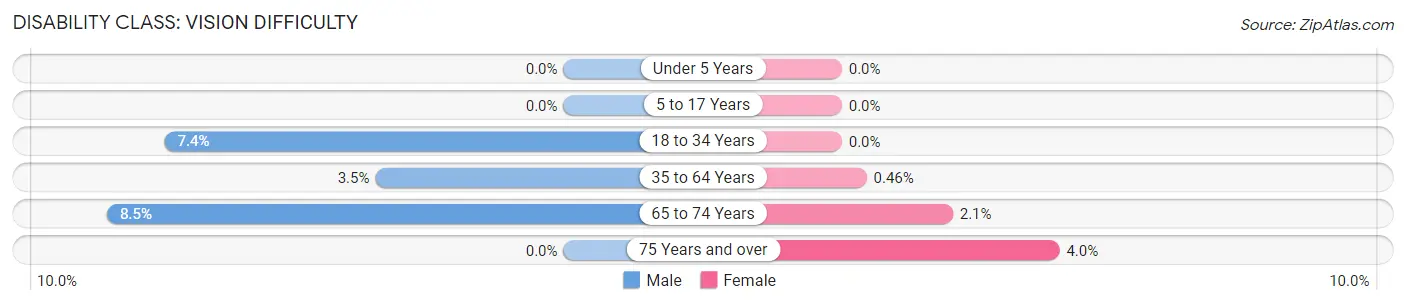
| Age Bracket | Male | Female |
| Under 5 Years | 0 (0.0%) | 0 (0.0%) |
| 5 to 17 Years | 0 (0.0%) | 0 (0.0%) |
| 18 to 34 Years | 85 (7.4%) | 0 (0.0%) |
| 35 to 64 Years | 85 (3.5%) | 10 (0.5%) |
| 65 to 74 Years | 32 (8.5%) | 14 (2.1%) |
| 75 Years and over | 0 (0.0%) | 16 (4.0%) |
Disability Class: Cognitive Difficulty
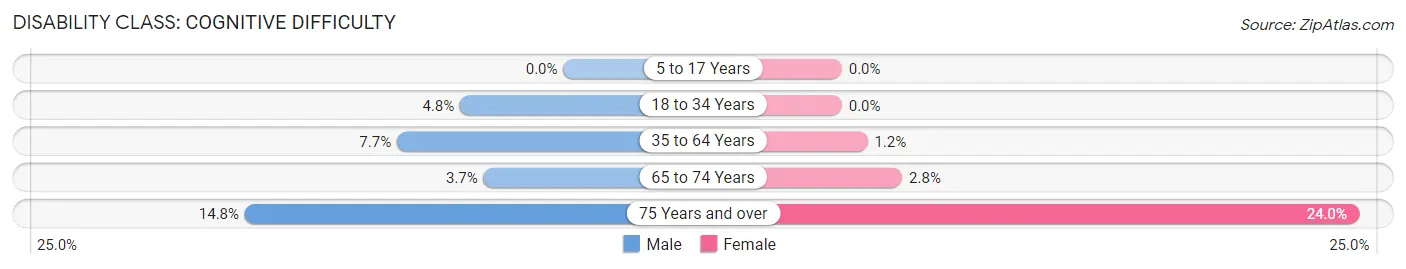
| Age Bracket | Male | Female |
| 5 to 17 Years | 0 (0.0%) | 0 (0.0%) |
| 18 to 34 Years | 55 (4.8%) | 0 (0.0%) |
| 35 to 64 Years | 188 (7.7%) | 26 (1.2%) |
| 65 to 74 Years | 14 (3.7%) | 19 (2.8%) |
| 75 Years and over | 34 (14.8%) | 95 (24.0%) |
Disability Class: Ambulatory Difficulty
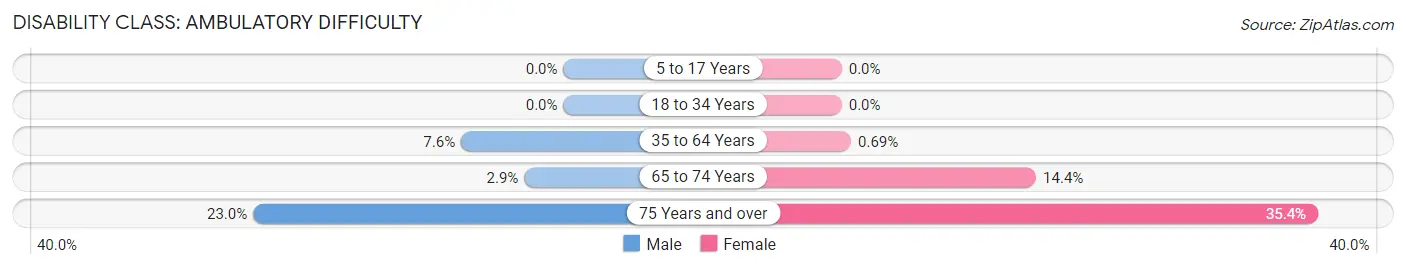
| Age Bracket | Male | Female |
| 5 to 17 Years | 0 (0.0%) | 0 (0.0%) |
| 18 to 34 Years | 0 (0.0%) | 0 (0.0%) |
| 35 to 64 Years | 185 (7.6%) | 15 (0.7%) |
| 65 to 74 Years | 11 (2.9%) | 98 (14.4%) |
| 75 Years and over | 53 (23.0%) | 140 (35.3%) |
Disability Class: Self-Care Difficulty
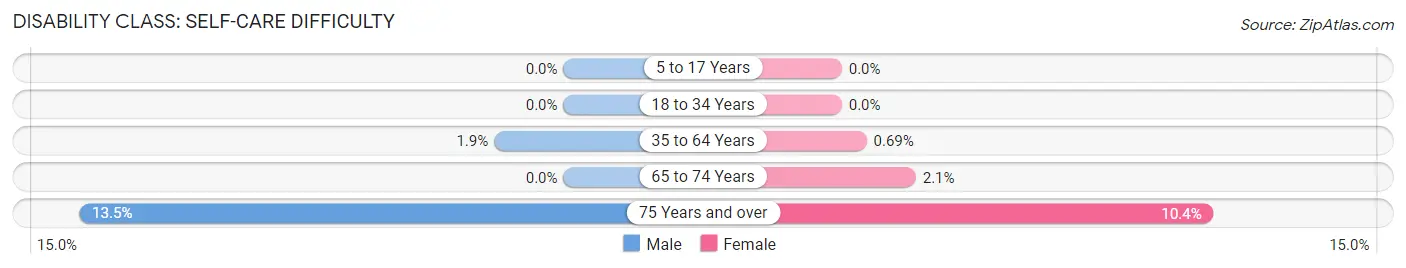
| Age Bracket | Male | Female |
| 5 to 17 Years | 0 (0.0%) | 0 (0.0%) |
| 18 to 34 Years | 0 (0.0%) | 0 (0.0%) |
| 35 to 64 Years | 47 (1.9%) | 15 (0.7%) |
| 65 to 74 Years | 0 (0.0%) | 14 (2.1%) |
| 75 Years and over | 31 (13.5%) | 41 (10.3%) |
Technology Access in Lincoln Park borough
Computing Device Access in Lincoln Park borough
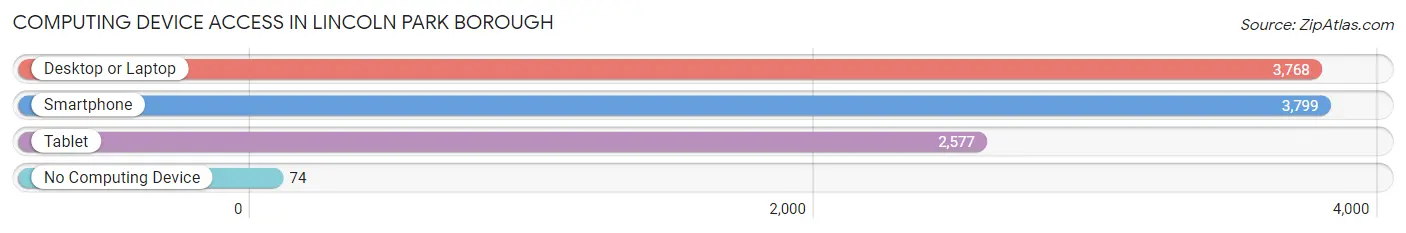
| Device Type | # Households | % Households |
| Desktop or Laptop | 3,768 | 91.5% |
| Smartphone | 3,799 | 92.3% |
| Tablet | 2,577 | 62.6% |
| No Computing Device | 74 | 1.8% |
| Total | 4,117 | 100.0% |
Internet Access in Lincoln Park borough
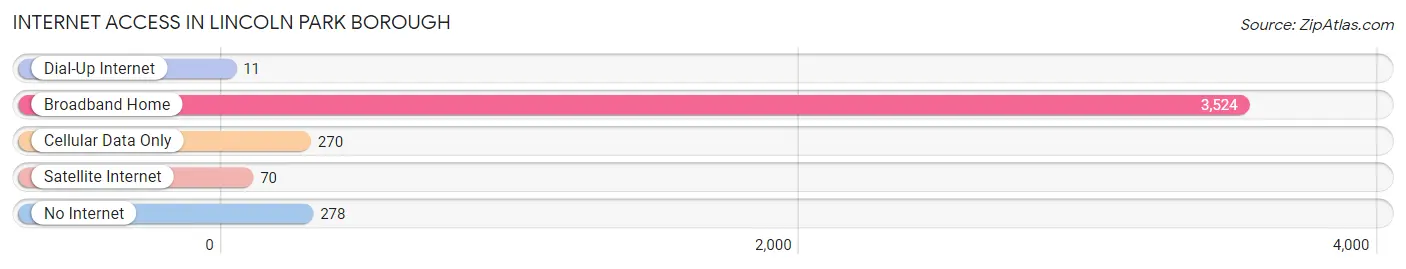
| Internet Type | # Households | % Households |
| Dial-Up Internet | 11 | 0.3% |
| Broadband Home | 3,524 | 85.6% |
| Cellular Data Only | 270 | 6.6% |
| Satellite Internet | 70 | 1.7% |
| No Internet | 278 | 6.8% |
| Total | 4,117 | 100.0% |
Lincoln Park borough Summary
Lincoln Park Borough is a small borough located in Morris County, New Jersey. It is situated in the northern part of the state, approximately 25 miles west of New York City. The borough is bordered by the towns of Pequannock, Riverdale, and Fairfield. The population of Lincoln Park Borough was 8,818 as of the 2010 census.
History
Lincoln Park Borough was originally part of Pequannock Township, which was established in 1740. In 1922, the area that is now Lincoln Park Borough was incorporated as a separate municipality. The borough was named after Abraham Lincoln, the 16th President of the United States.
Geography
Lincoln Park Borough is located at 40°54'N 74°20'W. It has a total area of 2.3 square miles, all of which is land. The borough is located in the northern part of Morris County, approximately 25 miles west of New York City. It is bordered by the towns of Pequannock, Riverdale, and Fairfield.
The borough is located in the Great Appalachian Valley, which is a large valley that stretches from Canada to Alabama. The valley is bordered by the Appalachian Mountains to the east and the Allegheny Plateau to the west. The borough is located in the Ramapo River watershed, which is part of the larger Delaware River watershed.
Economy
The economy of Lincoln Park Borough is largely based on the service industry. The borough is home to several small businesses, including restaurants, retail stores, and professional services. The borough also has a few manufacturing companies, including a plastics manufacturer and a metal fabrication company.
The borough is also home to several large employers, including a hospital, a pharmaceutical company, and a telecommunications company. The borough is also home to a large shopping center, which includes a grocery store, a department store, and several other retail stores.
Demographics
As of the 2010 census, the population of Lincoln Park Borough was 8,818. The racial makeup of the borough was 87.3% White, 5.2% African American, 0.3% Native American, 3.2% Asian, and 3.9% from other races. Hispanic or Latino of any race were 8.7% of the population.
The median household income in Lincoln Park Borough was $76,944, and the median family income was $90,917. The per capita income was $35,945. About 4.2% of families and 5.3% of the population were below the poverty line, including 6.2% of those under age 18 and 4.2% of those age 65 or over.
The borough is served by the Lincoln Park Public Schools, which includes two elementary schools, one middle school, and one high school. The borough is also home to several private schools, including a Catholic school and a Montessori school.
Common Questions
What is Per Capita Income in Lincoln Park borough?
Per Capita income in Lincoln Park borough is $50,438.
What is the Median Family Income in Lincoln Park borough?
Median Family Income in Lincoln Park borough is $133,506.
What is the Median Household income in Lincoln Park borough?
Median Household Income in Lincoln Park borough is $112,056.
What is Income or Wage Gap in Lincoln Park borough?
Income or Wage Gap in Lincoln Park borough is 39.9%.
Women in Lincoln Park borough earn 60.1 cents for every dollar earned by a man.
What is Inequality or Gini Index in Lincoln Park borough?
Inequality or Gini Index in Lincoln Park borough is 0.37.
What is the Total Population of Lincoln Park borough?
Total Population of Lincoln Park borough is 10,884.
What is the Total Male Population of Lincoln Park borough?
Total Male Population of Lincoln Park borough is 5,376.
What is the Total Female Population of Lincoln Park borough?
Total Female Population of Lincoln Park borough is 5,508.
What is the Ratio of Males per 100 Females in Lincoln Park borough?
There are 97.60 Males per 100 Females in Lincoln Park borough.
What is the Ratio of Females per 100 Males in Lincoln Park borough?
There are 102.46 Females per 100 Males in Lincoln Park borough.
What is the Median Population Age in Lincoln Park borough?
Median Population Age in Lincoln Park borough is 46.8 Years.
What is the Average Family Size in Lincoln Park borough
Average Family Size in Lincoln Park borough is 3.1 People.
What is the Average Household Size in Lincoln Park borough
Average Household Size in Lincoln Park borough is 2.5 People.
How Large is the Labor Force in Lincoln Park borough?
There are 6,404 People in the Labor Forcein in Lincoln Park borough.
What is the Percentage of People in the Labor Force in Lincoln Park borough?
67.4% of People are in the Labor Force in Lincoln Park borough.
What is the Unemployment Rate in Lincoln Park borough?
Unemployment Rate in Lincoln Park borough is 10.8%.