Laurel Springs borough, NJ Map & Demographics
Laurel Springs borough Overview
$42,094
PER CAPITA INCOME
$140,179
AVG FAMILY INCOME
$113,500
AVG HOUSEHOLD INCOME
15.1%
WAGE / INCOME GAP [ % ]
84.9¢/ $1
WAGE / INCOME GAP [ $ ]
0.39
INEQUALITY / GINI INDEX
2,004
TOTAL POPULATION
983
MALE POPULATION
1,021
FEMALE POPULATION
96.28
MALES / 100 FEMALES
103.87
FEMALES / 100 MALES
35.8
MEDIAN AGE
3.7
AVG FAMILY SIZE
3.0
AVG HOUSEHOLD SIZE
1,111
LABOR FORCE [ PEOPLE ]
68.2%
PERCENT IN LABOR FORCE
4.5%
UNEMPLOYMENT RATE
Income in Laurel Springs borough
Income Overview in Laurel Springs borough
Per Capita Income in Laurel Springs borough is $42,094, while median incomes of families and households are $140,179 and $113,500 respectively.
| Characteristic | Number | Measure |
| Per Capita Income | 2,004 | $42,094 |
| Median Family Income | 451 | $140,179 |
| Mean Family Income | 451 | $152,450 |
| Median Household Income | 680 | $113,500 |
| Mean Household Income | 680 | $123,153 |
| Income Deficit | 451 | $0 |
| Wage / Income Gap (%) | 2,004 | 15.15% |
| Wage / Income Gap ($) | 2,004 | 84.85¢ per $1 |
| Gini / Inequality Index | 2,004 | 0.39 |
Earnings by Sex in Laurel Springs borough
Average Earnings in Laurel Springs borough are $46,080, $50,313 for men and $42,692 for women, a difference of 15.1%.
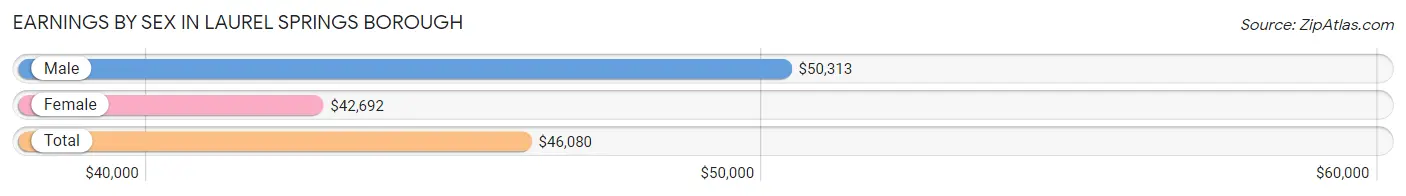
| Sex | Number | Average Earnings |
| Male | 613 (52.1%) | $50,313 |
| Female | 564 (47.9%) | $42,692 |
| Total | 1,177 (100.0%) | $46,080 |
Earnings by Sex by Income Bracket in Laurel Springs borough
The most common earnings brackets in Laurel Springs borough are $100,000+ for men (155 | 25.3%) and $12,500 to $14,999 for women (82 | 14.5%).
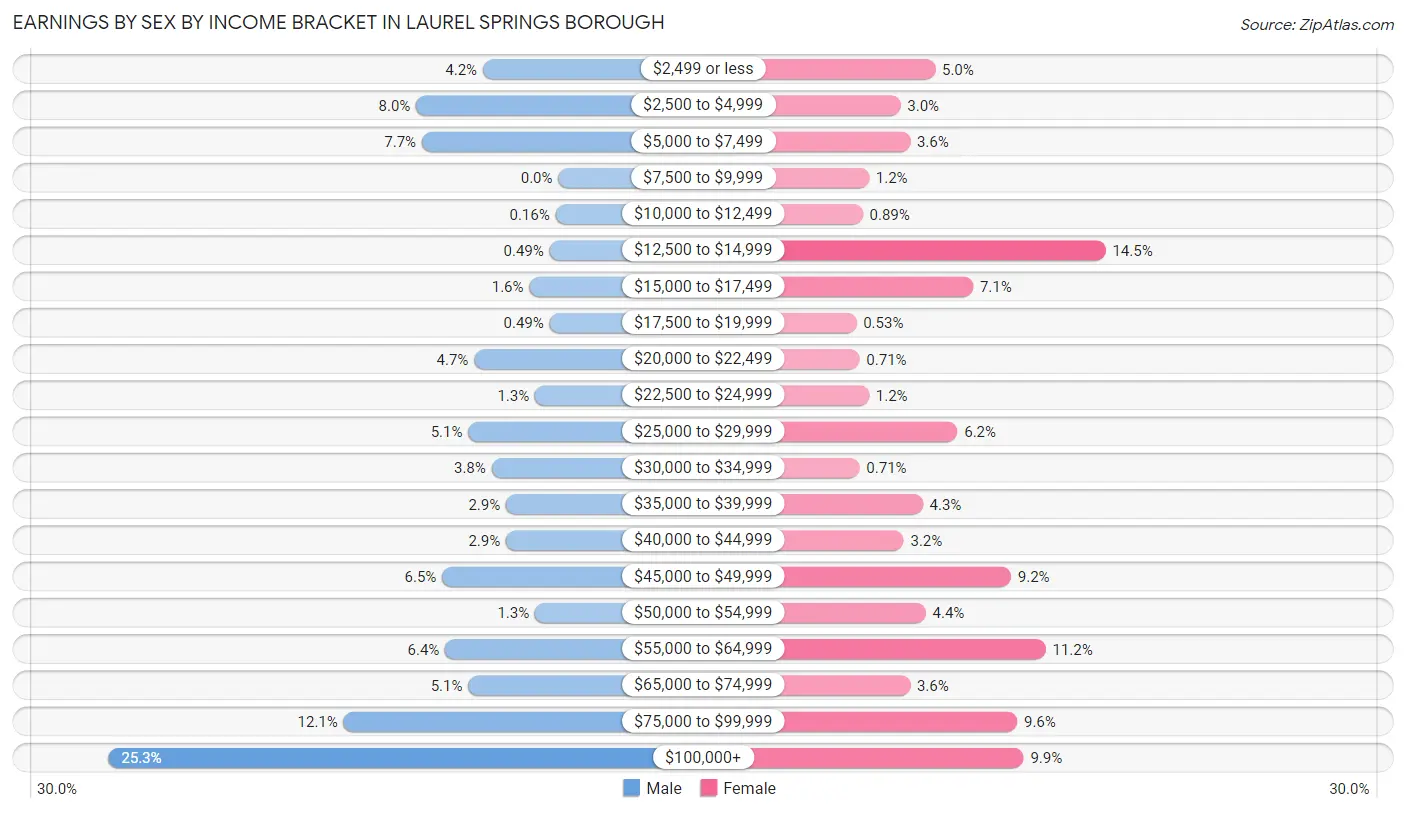
| Income | Male | Female |
| $2,499 or less | 26 (4.2%) | 28 (5.0%) |
| $2,500 to $4,999 | 49 (8.0%) | 17 (3.0%) |
| $5,000 to $7,499 | 47 (7.7%) | 20 (3.5%) |
| $7,500 to $9,999 | 0 (0.0%) | 7 (1.2%) |
| $10,000 to $12,499 | 1 (0.2%) | 5 (0.9%) |
| $12,500 to $14,999 | 3 (0.5%) | 82 (14.5%) |
| $15,000 to $17,499 | 10 (1.6%) | 40 (7.1%) |
| $17,500 to $19,999 | 3 (0.5%) | 3 (0.5%) |
| $20,000 to $22,499 | 29 (4.7%) | 4 (0.7%) |
| $22,500 to $24,999 | 8 (1.3%) | 7 (1.2%) |
| $25,000 to $29,999 | 31 (5.1%) | 35 (6.2%) |
| $30,000 to $34,999 | 23 (3.7%) | 4 (0.7%) |
| $35,000 to $39,999 | 18 (2.9%) | 24 (4.3%) |
| $40,000 to $44,999 | 18 (2.9%) | 18 (3.2%) |
| $45,000 to $49,999 | 40 (6.5%) | 52 (9.2%) |
| $50,000 to $54,999 | 8 (1.3%) | 25 (4.4%) |
| $55,000 to $64,999 | 39 (6.4%) | 63 (11.2%) |
| $65,000 to $74,999 | 31 (5.1%) | 20 (3.5%) |
| $75,000 to $99,999 | 74 (12.1%) | 54 (9.6%) |
| $100,000+ | 155 (25.3%) | 56 (9.9%) |
| Total | 613 (100.0%) | 564 (100.0%) |
Earnings by Sex by Educational Attainment in Laurel Springs borough
Average earnings in Laurel Springs borough are $71,563 for men and $46,563 for women, a difference of 34.9%. Men with an educational attainment of bachelor's degree enjoy the highest average annual earnings of $103,750, while those with less than high school education earn the least with $4,063. Women with an educational attainment of bachelor's degree earn the most with the average annual earnings of $60,000, while those with high school diploma education have the smallest earnings of $29,643.
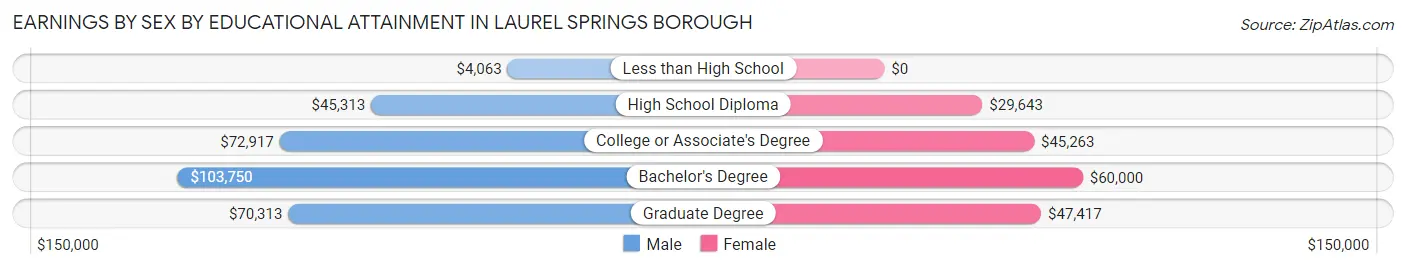
| Educational Attainment | Male Income | Female Income |
| Less than High School | $4,063 | $0 |
| High School Diploma | $45,313 | $29,643 |
| College or Associate's Degree | $72,917 | $45,263 |
| Bachelor's Degree | $103,750 | $60,000 |
| Graduate Degree | $70,313 | $47,417 |
| Total | $71,563 | $46,563 |
Family Income in Laurel Springs borough
Family Income Brackets in Laurel Springs borough
According to the Laurel Springs borough family income data, there are 121 families falling into the $100,000 to $149,999 income range, which is the most common income bracket and makes up 26.8% of all families.
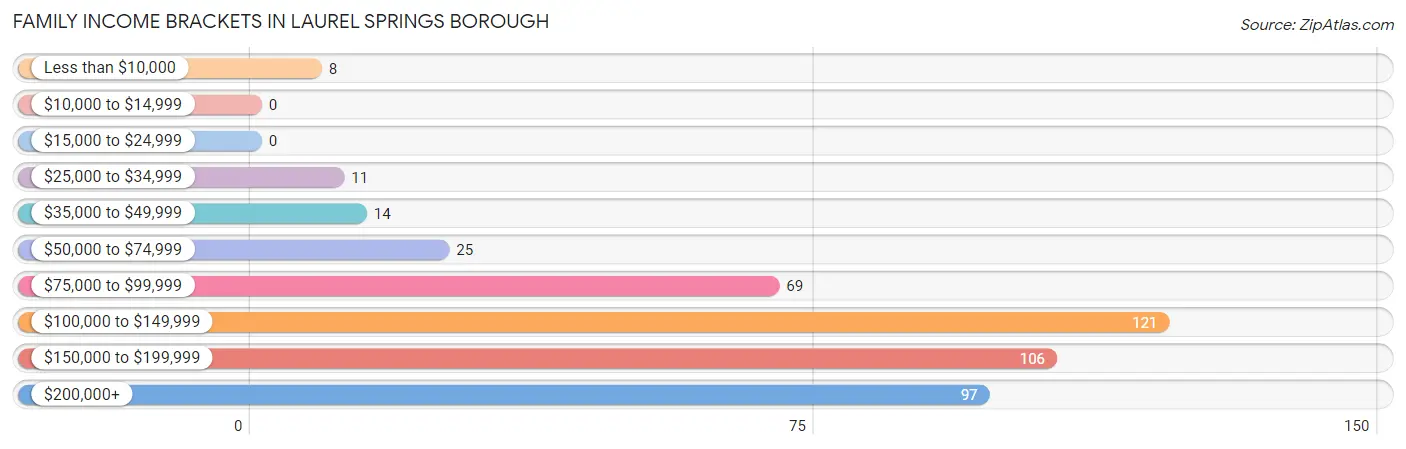
| Income Bracket | # Families | % Families |
| Less than $10,000 | 8 | 1.8% |
| $10,000 to $14,999 | 0 | 0.0% |
| $15,000 to $24,999 | 0 | 0.0% |
| $25,000 to $34,999 | 11 | 2.4% |
| $35,000 to $49,999 | 14 | 3.1% |
| $50,000 to $74,999 | 25 | 5.5% |
| $75,000 to $99,999 | 69 | 15.3% |
| $100,000 to $149,999 | 121 | 26.8% |
| $150,000 to $199,999 | 106 | 23.5% |
| $200,000+ | 97 | 21.5% |
Family Income by Famaliy Size in Laurel Springs borough
6-person families (33 | 7.3%) account for the highest median family income in Laurel Springs borough with $250,001 per family, while 2-person families (127 | 28.2%) have the highest median income of $47,836 per family member.
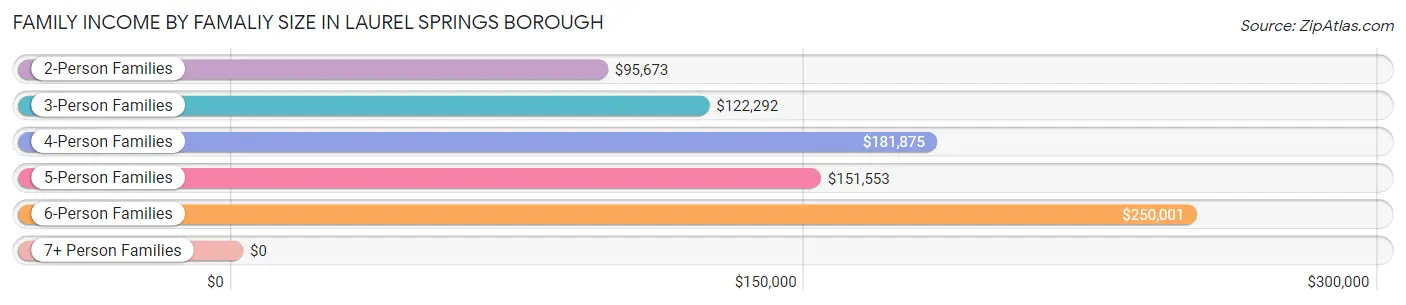
| Income Bracket | # Families | Median Income |
| 2-Person Families | 127 (28.2%) | $95,673 |
| 3-Person Families | 107 (23.7%) | $122,292 |
| 4-Person Families | 91 (20.2%) | $181,875 |
| 5-Person Families | 77 (17.1%) | $151,553 |
| 6-Person Families | 33 (7.3%) | $250,001 |
| 7+ Person Families | 16 (3.5%) | $0 |
| Total | 451 (100.0%) | $140,179 |
Family Income by Number of Earners in Laurel Springs borough
The median family income in Laurel Springs borough is $140,179, with families comprising 3+ earners (155) having the highest median family income of $153,125, while families with no earners (34) have the lowest median family income of $50,500, accounting for 34.4% and 7.5% of families, respectively.
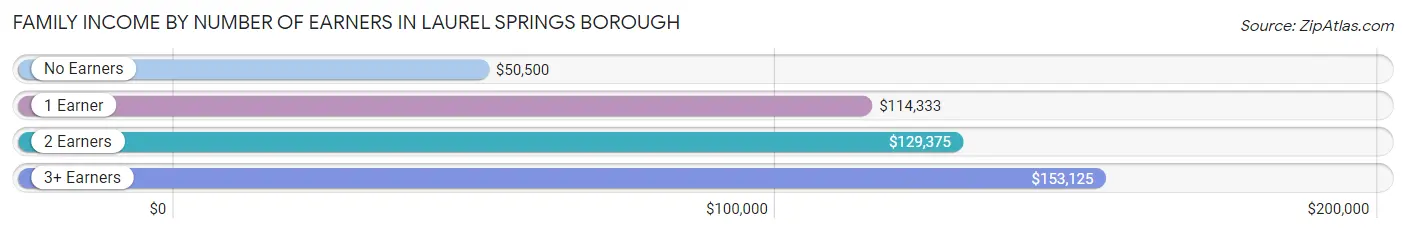
| Number of Earners | # Families | Median Income |
| No Earners | 34 (7.5%) | $50,500 |
| 1 Earner | 94 (20.8%) | $114,333 |
| 2 Earners | 168 (37.2%) | $129,375 |
| 3+ Earners | 155 (34.4%) | $153,125 |
| Total | 451 (100.0%) | $140,179 |
Household Income in Laurel Springs borough
Household Income Brackets in Laurel Springs borough
With 141 households falling in the category, the $100,000 to $149,999 income range is the most frequent in Laurel Springs borough, accounting for 20.7% of all households. In contrast, only 17 households (2.5%) fall into the $10,000 to $14,999 income bracket, making it the least populous group.
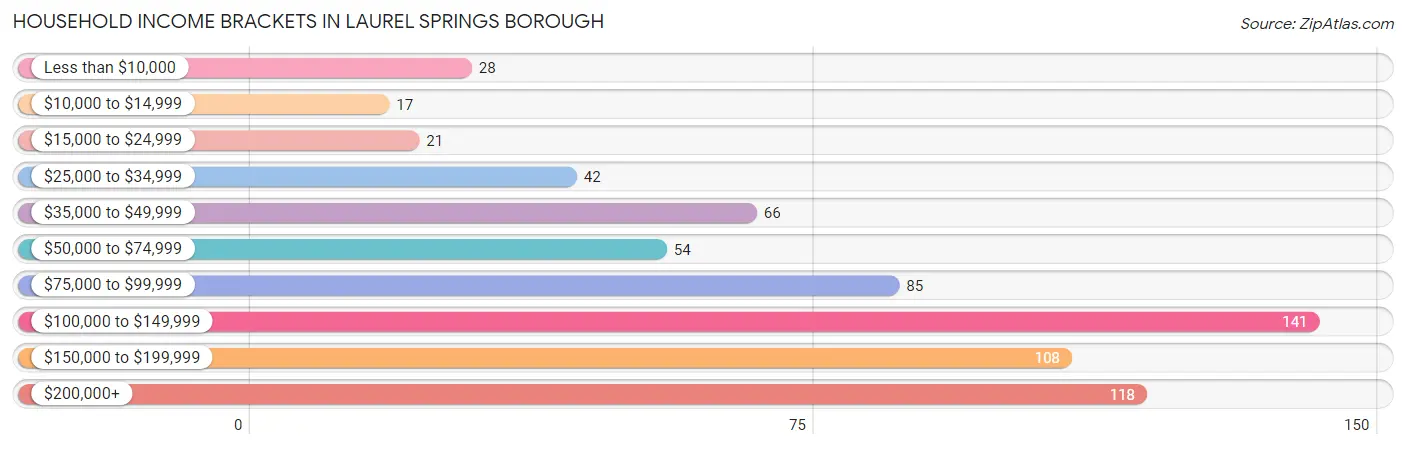
| Income Bracket | # Households | % Households |
| Less than $10,000 | 28 | 4.1% |
| $10,000 to $14,999 | 17 | 2.5% |
| $15,000 to $24,999 | 21 | 3.1% |
| $25,000 to $34,999 | 42 | 6.2% |
| $35,000 to $49,999 | 66 | 9.7% |
| $50,000 to $74,999 | 54 | 7.9% |
| $75,000 to $99,999 | 85 | 12.5% |
| $100,000 to $149,999 | 141 | 20.7% |
| $150,000 to $199,999 | 108 | 15.9% |
| $200,000+ | 118 | 17.4% |
Household Income by Householder Age in Laurel Springs borough
The median household income in Laurel Springs borough is $113,500, with the highest median household income of $137,857 found in the 45 to 64 years age bracket for the primary householder. A total of 334 households (49.1%) fall into this category. Meanwhile, the 15 to 24 years age bracket for the primary householder has the lowest median household income of $0, with 33 households (4.9%) in this group.
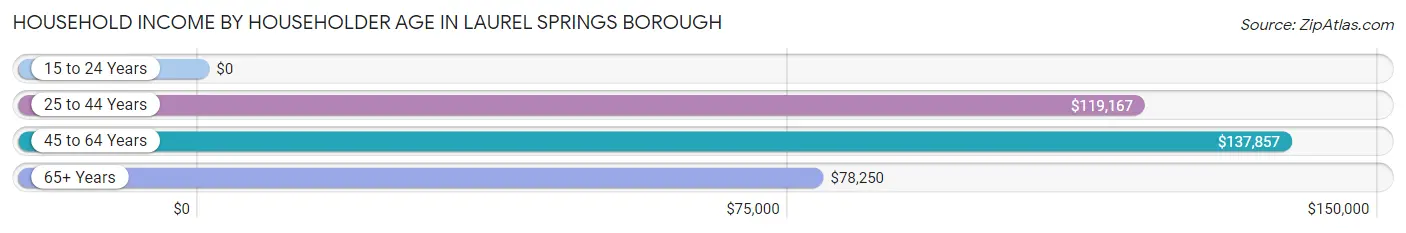
| Income Bracket | # Households | Median Income |
| 15 to 24 Years | 33 (4.9%) | $0 |
| 25 to 44 Years | 174 (25.6%) | $119,167 |
| 45 to 64 Years | 334 (49.1%) | $137,857 |
| 65+ Years | 139 (20.4%) | $78,250 |
| Total | 680 (100.0%) | $113,500 |
Poverty in Laurel Springs borough
Income Below Poverty by Sex and Age in Laurel Springs borough
With 5.2% poverty level for males and 8.0% for females among the residents of Laurel Springs borough, 5 year old males and 18 to 24 year old females are the most vulnerable to poverty, with 7 males (50.0%) and 21 females (18.6%) in their respective age groups living below the poverty level.
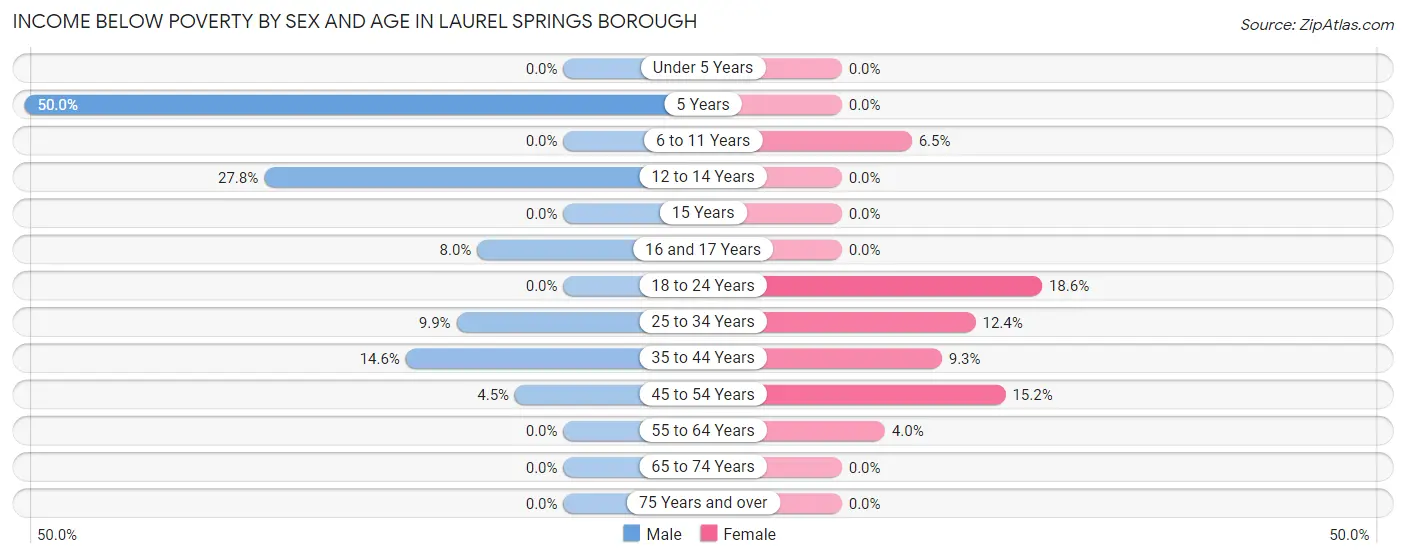
| Age Bracket | Male | Female |
| Under 5 Years | 0 (0.0%) | 0 (0.0%) |
| 5 Years | 7 (50.0%) | 0 (0.0%) |
| 6 to 11 Years | 0 (0.0%) | 5 (6.5%) |
| 12 to 14 Years | 5 (27.8%) | 0 (0.0%) |
| 15 Years | 0 (0.0%) | 0 (0.0%) |
| 16 and 17 Years | 6 (8.0%) | 0 (0.0%) |
| 18 to 24 Years | 0 (0.0%) | 21 (18.6%) |
| 25 to 34 Years | 13 (9.9%) | 17 (12.4%) |
| 35 to 44 Years | 12 (14.6%) | 9 (9.3%) |
| 45 to 54 Years | 8 (4.5%) | 24 (15.2%) |
| 55 to 64 Years | 0 (0.0%) | 6 (4.0%) |
| 65 to 74 Years | 0 (0.0%) | 0 (0.0%) |
| 75 Years and over | 0 (0.0%) | 0 (0.0%) |
| Total | 51 (5.2%) | 82 (8.0%) |
Income Above Poverty by Sex and Age in Laurel Springs borough
According to the poverty statistics in Laurel Springs borough, males aged under 5 years and females aged under 5 years are the age groups that are most secure financially, with 100.0% of males and 100.0% of females in these age groups living above the poverty line.
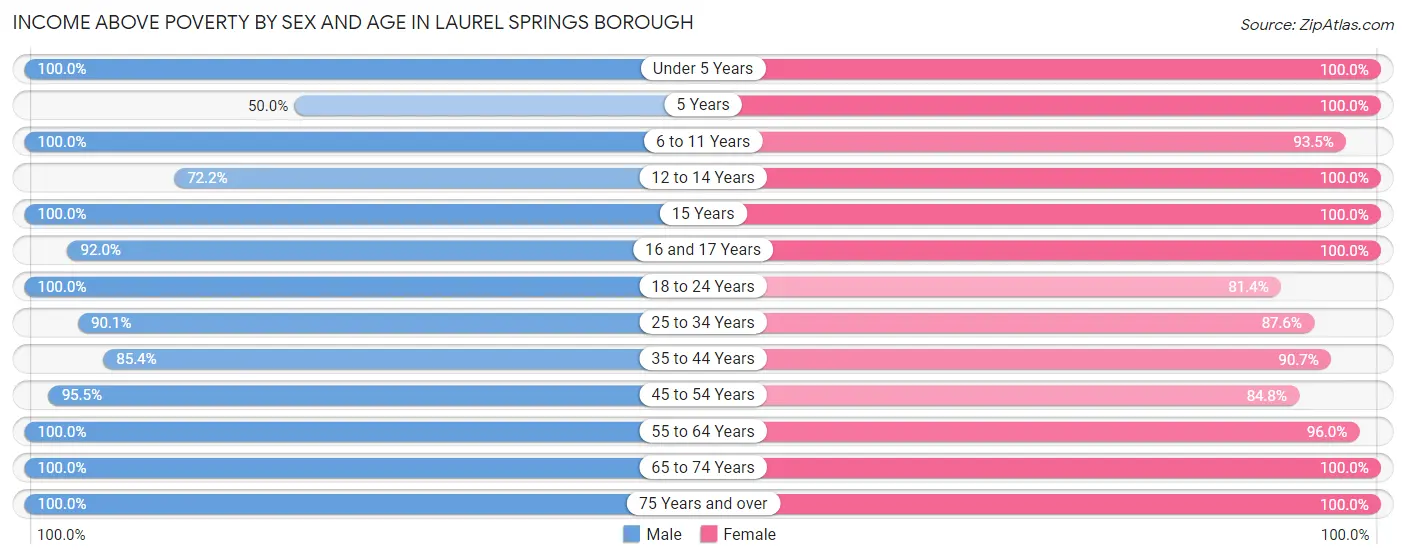
| Age Bracket | Male | Female |
| Under 5 Years | 52 (100.0%) | 47 (100.0%) |
| 5 Years | 7 (50.0%) | 12 (100.0%) |
| 6 to 11 Years | 81 (100.0%) | 72 (93.5%) |
| 12 to 14 Years | 13 (72.2%) | 66 (100.0%) |
| 15 Years | 5 (100.0%) | 3 (100.0%) |
| 16 and 17 Years | 69 (92.0%) | 26 (100.0%) |
| 18 to 24 Years | 116 (100.0%) | 92 (81.4%) |
| 25 to 34 Years | 118 (90.1%) | 120 (87.6%) |
| 35 to 44 Years | 70 (85.4%) | 88 (90.7%) |
| 45 to 54 Years | 170 (95.5%) | 134 (84.8%) |
| 55 to 64 Years | 107 (100.0%) | 144 (96.0%) |
| 65 to 74 Years | 81 (100.0%) | 81 (100.0%) |
| 75 Years and over | 43 (100.0%) | 54 (100.0%) |
| Total | 932 (94.8%) | 939 (92.0%) |
Income Below Poverty Among Married-Couple Families in Laurel Springs borough
The poverty statistics for married-couple families in Laurel Springs borough show that 1.1% or 4 of the total 374 families live below the poverty line. Families with 3 or 4 children have the highest poverty rate of 9.1%, comprising of 4 families. On the other hand, families with no children have the lowest poverty rate of 0.0%, which includes 0 families.
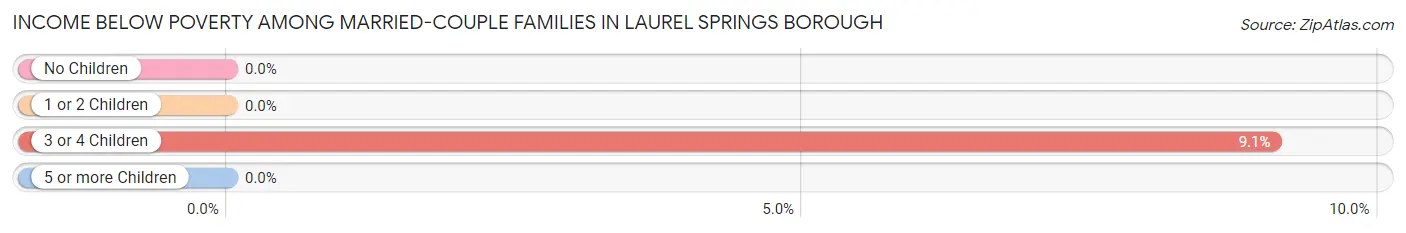
| Children | Above Poverty | Below Poverty |
| No Children | 149 (100.0%) | 0 (0.0%) |
| 1 or 2 Children | 181 (100.0%) | 0 (0.0%) |
| 3 or 4 Children | 40 (90.9%) | 4 (9.1%) |
| 5 or more Children | 0 (0.0%) | 0 (0.0%) |
| Total | 370 (98.9%) | 4 (1.1%) |
Income Below Poverty Among Single-Parent Households in Laurel Springs borough
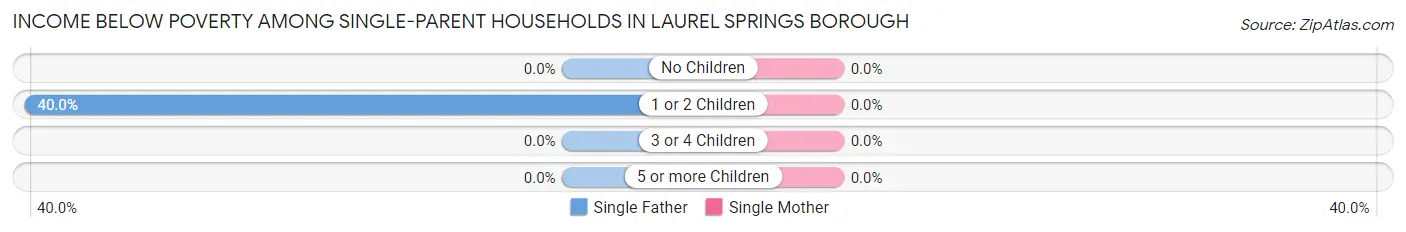
| Children | Single Father | Single Mother |
| No Children | 0 (0.0%) | 0 (0.0%) |
| 1 or 2 Children | 8 (40.0%) | 0 (0.0%) |
| 3 or 4 Children | 0 (0.0%) | 0 (0.0%) |
| 5 or more Children | 0 (0.0%) | 0 (0.0%) |
| Total | 8 (25.0%) | 0 (0.0%) |
Income Below Poverty Among Married-Couple vs Single-Parent Households in Laurel Springs borough
The poverty data for Laurel Springs borough shows that 4 of the married-couple family households (1.1%) and 8 of the single-parent households (10.4%) are living below the poverty level. Within the married-couple family households, those with 3 or 4 children have the highest poverty rate, with 4 households (9.1%) falling below the poverty line. Among the single-parent households, those with 1 or 2 children have the highest poverty rate, with 8 household (24.2%) living below poverty.
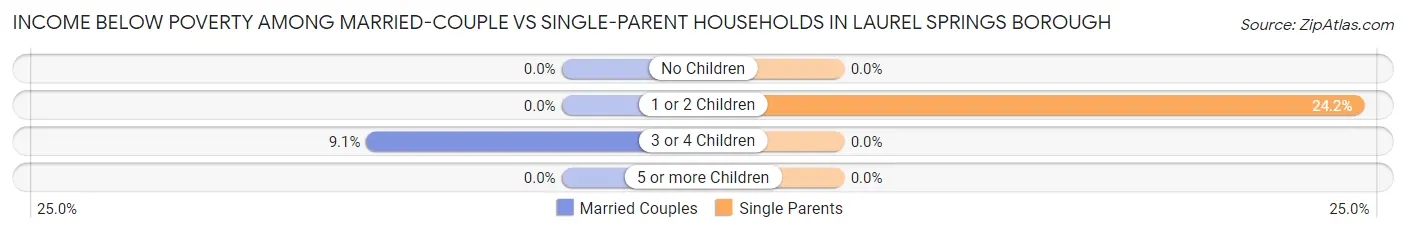
| Children | Married-Couple Families | Single-Parent Households |
| No Children | 0 (0.0%) | 0 (0.0%) |
| 1 or 2 Children | 0 (0.0%) | 8 (24.2%) |
| 3 or 4 Children | 4 (9.1%) | 0 (0.0%) |
| 5 or more Children | 0 (0.0%) | 0 (0.0%) |
| Total | 4 (1.1%) | 8 (10.4%) |
Race in Laurel Springs borough
The most populous races in Laurel Springs borough are White / Caucasian (1,765 | 88.1%), Asian (95 | 4.7%), and Black / African American (79 | 3.9%).
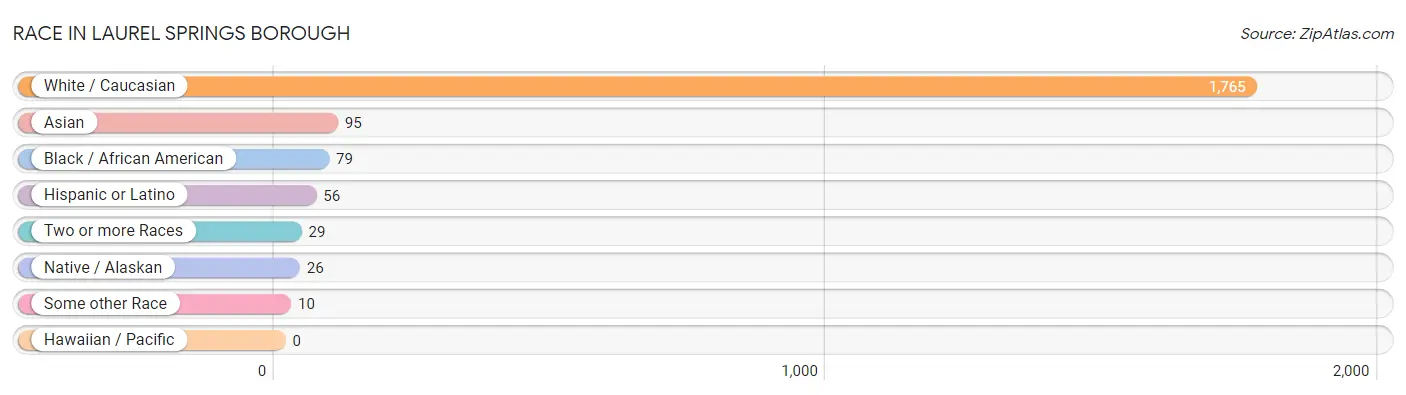
| Race | # Population | % Population |
| Asian | 95 | 4.7% |
| Black / African American | 79 | 3.9% |
| Hawaiian / Pacific | 0 | 0.0% |
| Hispanic or Latino | 56 | 2.8% |
| Native / Alaskan | 26 | 1.3% |
| White / Caucasian | 1,765 | 88.1% |
| Two or more Races | 29 | 1.5% |
| Some other Race | 10 | 0.5% |
| Total | 2,004 | 100.0% |
Ancestry in Laurel Springs borough
The most populous ancestries reported in Laurel Springs borough are Irish (689 | 34.4%), Italian (497 | 24.8%), English (446 | 22.3%), German (351 | 17.5%), and Polish (87 | 4.3%), together accounting for 103.3% of all Laurel Springs borough residents.
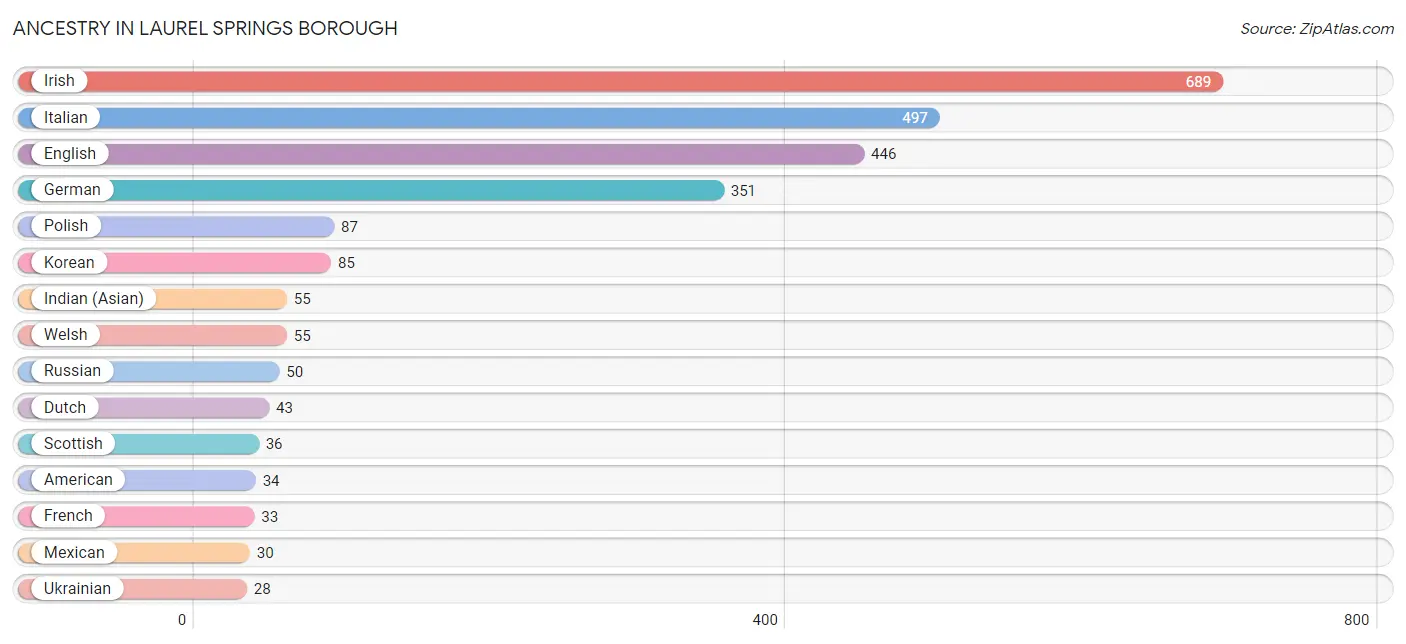
| Ancestry | # Population | % Population |
| African | 6 | 0.3% |
| Albanian | 2 | 0.1% |
| American | 34 | 1.7% |
| Armenian | 3 | 0.2% |
| British | 13 | 0.6% |
| Carpatho Rusyn | 4 | 0.2% |
| Czech | 3 | 0.2% |
| Czechoslovakian | 14 | 0.7% |
| Dutch | 43 | 2.1% |
| Eastern European | 2 | 0.1% |
| English | 446 | 22.3% |
| European | 4 | 0.2% |
| French | 33 | 1.7% |
| German | 351 | 17.5% |
| Greek | 7 | 0.4% |
| Hungarian | 10 | 0.5% |
| Icelander | 13 | 0.6% |
| Indian (Asian) | 55 | 2.7% |
| Irish | 689 | 34.4% |
| Italian | 497 | 24.8% |
| Korean | 85 | 4.2% |
| Lumbee | 8 | 0.4% |
| Mexican | 30 | 1.5% |
| Mexican American Indian | 26 | 1.3% |
| Norwegian | 6 | 0.3% |
| Pakistani | 6 | 0.3% |
| Polish | 87 | 4.3% |
| Puerto Rican | 20 | 1.0% |
| Russian | 50 | 2.5% |
| Scotch-Irish | 1 | 0.1% |
| Scottish | 36 | 1.8% |
| Slovak | 3 | 0.2% |
| Spanish | 6 | 0.3% |
| Sri Lankan | 3 | 0.2% |
| Subsaharan African | 6 | 0.3% |
| Swedish | 22 | 1.1% |
| Swiss | 4 | 0.2% |
| Ukrainian | 28 | 1.4% |
| Welsh | 55 | 2.7% | View All 39 Rows |
Immigrants in Laurel Springs borough
The most numerous immigrant groups reported in Laurel Springs borough came from Asia (47 | 2.4%), South Eastern Asia (44 | 2.2%), Eastern Europe (39 | 1.9%), Europe (39 | 1.9%), and Philippines (29 | 1.5%), together accounting for 9.9% of all Laurel Springs borough residents.
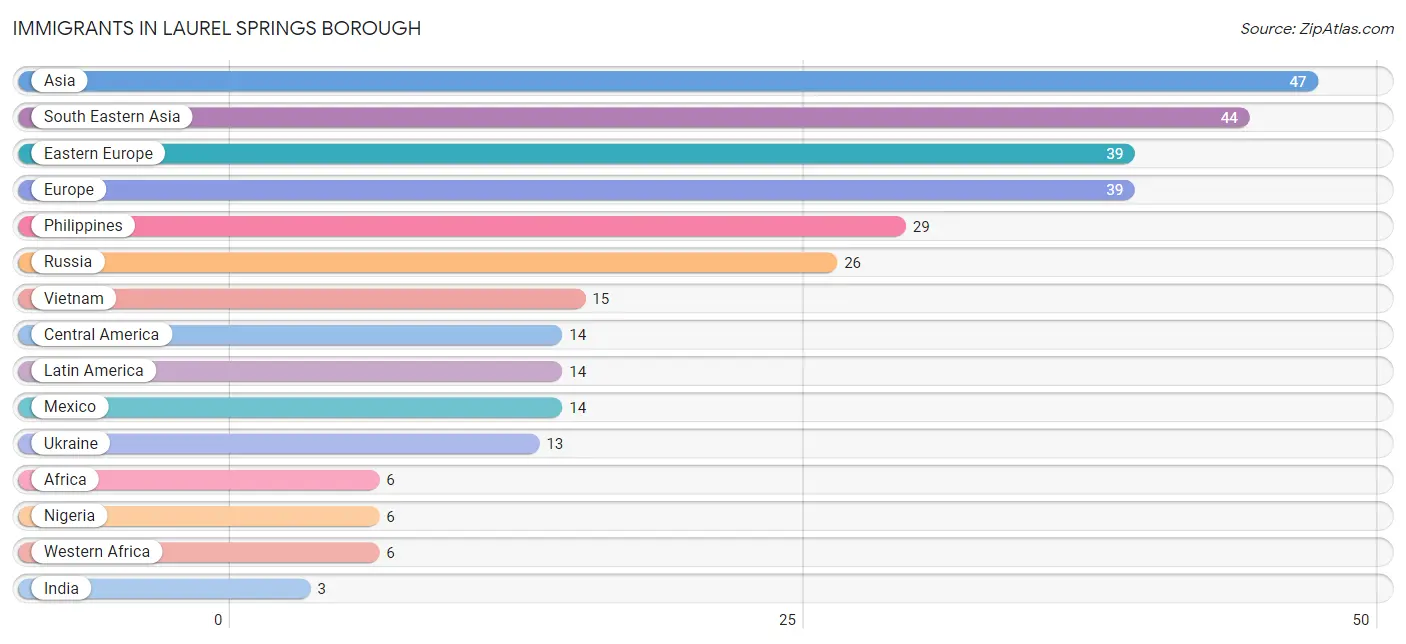
| Immigration Origin | # Population | % Population |
| Africa | 6 | 0.3% |
| Asia | 47 | 2.4% |
| Central America | 14 | 0.7% |
| Eastern Europe | 39 | 1.9% |
| Europe | 39 | 1.9% |
| India | 3 | 0.2% |
| Latin America | 14 | 0.7% |
| Mexico | 14 | 0.7% |
| Nigeria | 6 | 0.3% |
| Philippines | 29 | 1.5% |
| Russia | 26 | 1.3% |
| South Central Asia | 3 | 0.2% |
| South Eastern Asia | 44 | 2.2% |
| Ukraine | 13 | 0.6% |
| Vietnam | 15 | 0.7% |
| Western Africa | 6 | 0.3% | View All 16 Rows |
Sex and Age in Laurel Springs borough
Sex and Age in Laurel Springs borough
The most populous age groups in Laurel Springs borough are 20 to 24 Years (107 | 10.9%) for men and 45 to 49 Years (107 | 10.5%) for women.
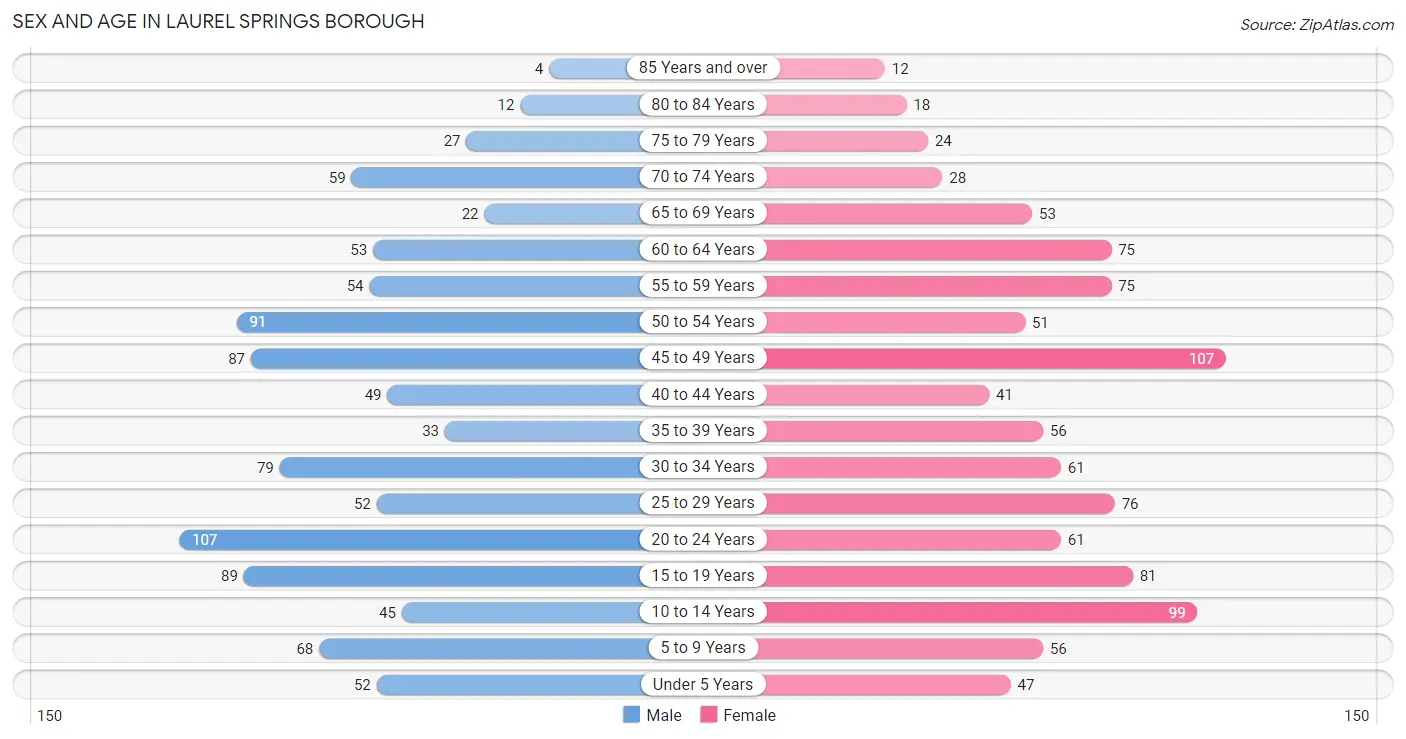
| Age Bracket | Male | Female |
| Under 5 Years | 52 (5.3%) | 47 (4.6%) |
| 5 to 9 Years | 68 (6.9%) | 56 (5.5%) |
| 10 to 14 Years | 45 (4.6%) | 99 (9.7%) |
| 15 to 19 Years | 89 (9.0%) | 81 (7.9%) |
| 20 to 24 Years | 107 (10.9%) | 61 (6.0%) |
| 25 to 29 Years | 52 (5.3%) | 76 (7.4%) |
| 30 to 34 Years | 79 (8.0%) | 61 (6.0%) |
| 35 to 39 Years | 33 (3.4%) | 56 (5.5%) |
| 40 to 44 Years | 49 (5.0%) | 41 (4.0%) |
| 45 to 49 Years | 87 (8.8%) | 107 (10.5%) |
| 50 to 54 Years | 91 (9.3%) | 51 (5.0%) |
| 55 to 59 Years | 54 (5.5%) | 75 (7.3%) |
| 60 to 64 Years | 53 (5.4%) | 75 (7.3%) |
| 65 to 69 Years | 22 (2.2%) | 53 (5.2%) |
| 70 to 74 Years | 59 (6.0%) | 28 (2.7%) |
| 75 to 79 Years | 27 (2.8%) | 24 (2.4%) |
| 80 to 84 Years | 12 (1.2%) | 18 (1.8%) |
| 85 Years and over | 4 (0.4%) | 12 (1.2%) |
| Total | 983 (100.0%) | 1,021 (100.0%) |
Families and Households in Laurel Springs borough
Median Family Size in Laurel Springs borough
The median family size in Laurel Springs borough is 3.71 persons per family, with married-couple families (374 | 82.9%) accounting for the largest median family size of 3.93 persons per family. On the other hand, single male/father families (32 | 7.1%) represent the smallest median family size with 2.47 persons per family.
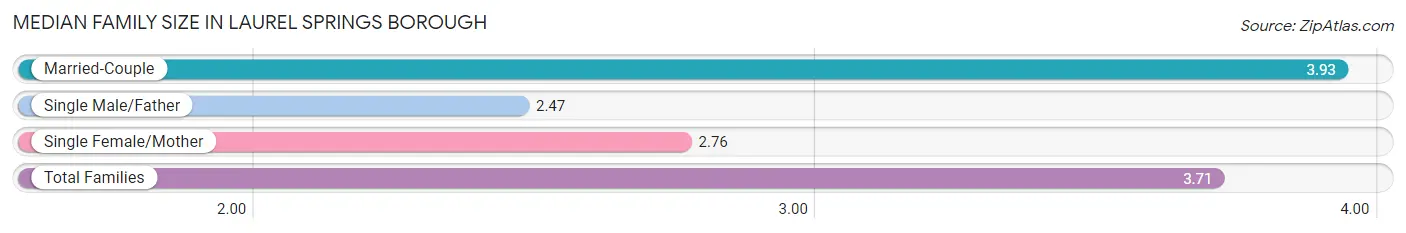
| Family Type | # Families | Family Size |
| Married-Couple | 374 (82.9%) | 3.93 |
| Single Male/Father | 32 (7.1%) | 2.47 |
| Single Female/Mother | 45 (10.0%) | 2.76 |
| Total Families | 451 (100.0%) | 3.71 |
Median Household Size in Laurel Springs borough
The median household size in Laurel Springs borough is 2.95 persons per household, with married-couple households (374 | 55.0%) accounting for the largest median household size of 3.93 persons per household. non-family households (229 | 33.7%) represent the smallest median household size with 1.25 persons per household.
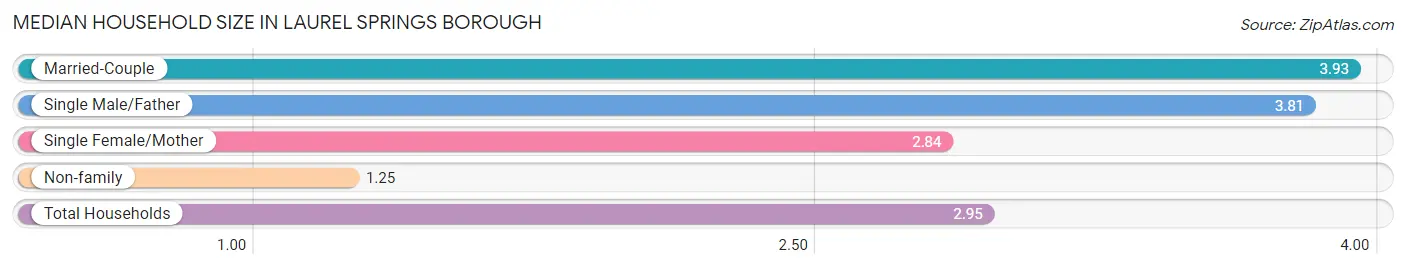
| Household Type | # Households | Household Size |
| Married-Couple | 374 (55.0%) | 3.93 |
| Single Male/Father | 32 (4.7%) | 3.81 |
| Single Female/Mother | 45 (6.6%) | 2.84 |
| Non-family | 229 (33.7%) | 1.25 |
| Total Households | 680 (100.0%) | 2.95 |
Household Size by Marriage Status in Laurel Springs borough
Out of a total of 680 households in Laurel Springs borough, 451 (66.3%) are family households, while 229 (33.7%) are nonfamily households. The most numerous type of family households are 3-person households, comprising 114, and the most common type of nonfamily households are 1-person households, comprising 175.
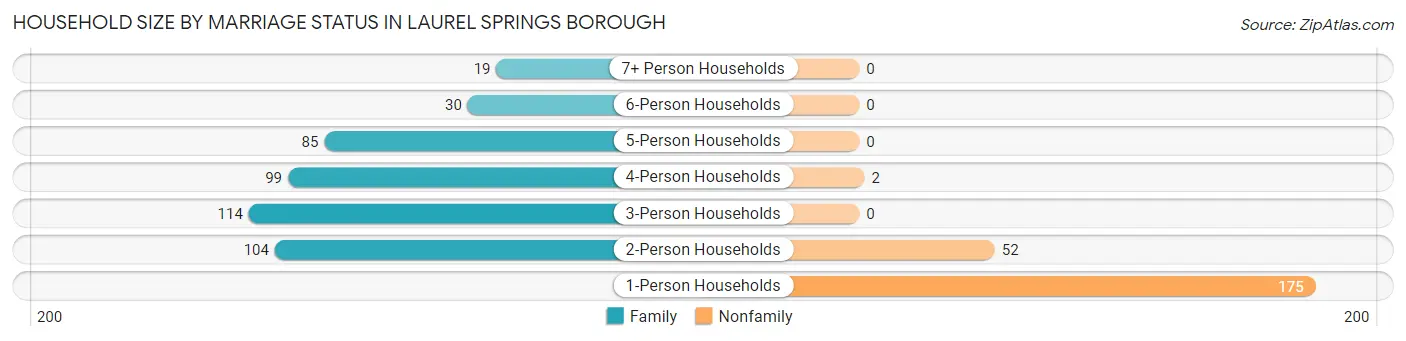
| Household Size | Family Households | Nonfamily Households |
| 1-Person Households | - | 175 (25.7%) |
| 2-Person Households | 104 (15.3%) | 52 (7.6%) |
| 3-Person Households | 114 (16.8%) | 0 (0.0%) |
| 4-Person Households | 99 (14.6%) | 2 (0.3%) |
| 5-Person Households | 85 (12.5%) | 0 (0.0%) |
| 6-Person Households | 30 (4.4%) | 0 (0.0%) |
| 7+ Person Households | 19 (2.8%) | 0 (0.0%) |
| Total | 451 (66.3%) | 229 (33.7%) |
Female Fertility in Laurel Springs borough
Fertility by Age in Laurel Springs borough
Average fertility rate in Laurel Springs borough is 43.0 births per 1,000 women. Women in the age bracket of 15 to 19 years have the highest fertility rate with 86.0 births per 1,000 women. Women in the age bracket of 20 to 34 years acount for 47.6% of all women with births.
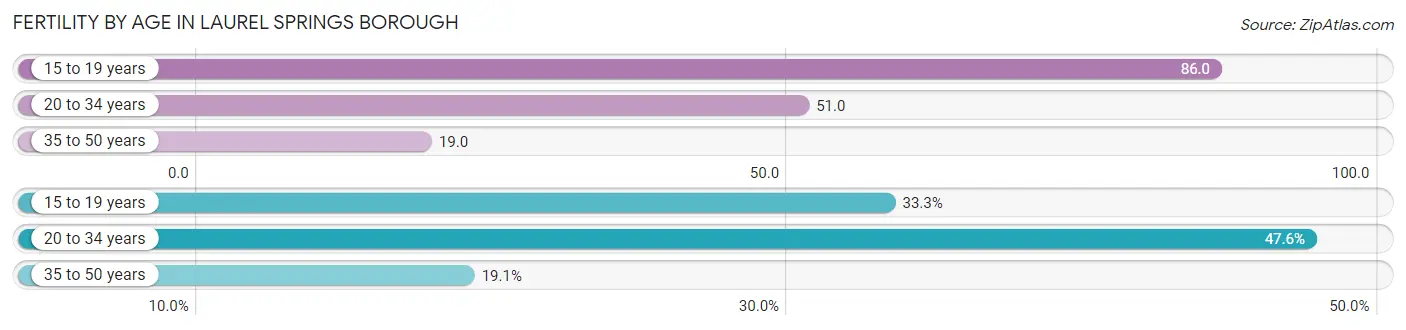
| Age Bracket | Women with Births | Births / 1,000 Women |
| 15 to 19 years | 7 (33.3%) | 86.0 |
| 20 to 34 years | 10 (47.6%) | 51.0 |
| 35 to 50 years | 4 (19.1%) | 19.0 |
| Total | 21 (100.0%) | 43.0 |
Fertility by Age by Marriage Status in Laurel Springs borough
66.7% of women with births (21) in Laurel Springs borough are married. The highest percentage of unmarried women with births falls into 15 to 19 years age bracket with 100.0% of them unmarried at the time of birth, while the lowest percentage of unmarried women with births belong to 20 to 34 years age bracket with 0.0% of them unmarried.
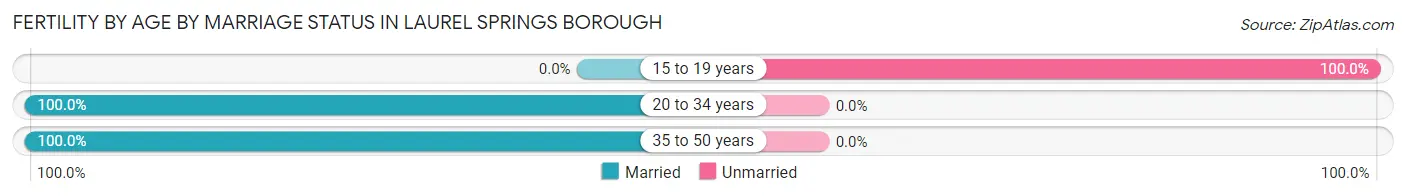
| Age Bracket | Married | Unmarried |
| 15 to 19 years | 0 (0.0%) | 7 (100.0%) |
| 20 to 34 years | 10 (100.0%) | 0 (0.0%) |
| 35 to 50 years | 4 (100.0%) | 0 (0.0%) |
| Total | 14 (66.7%) | 7 (33.3%) |
Fertility by Education in Laurel Springs borough
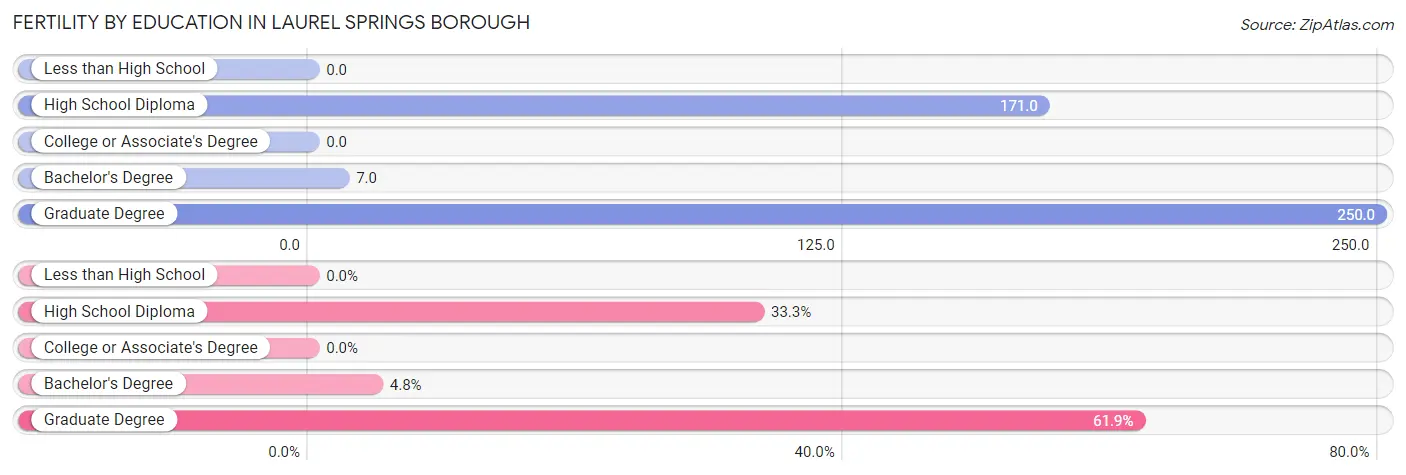
| Educational Attainment | Women with Births | Births / 1,000 Women |
| Less than High School | 0 (0.0%) | 0.0 |
| High School Diploma | 7 (33.3%) | 171.0 |
| College or Associate's Degree | 0 (0.0%) | 0.0 |
| Bachelor's Degree | 1 (4.8%) | 7.0 |
| Graduate Degree | 13 (61.9%) | 250.0 |
| Total | 21 (100.0%) | 43.0 |
Fertility by Education by Marriage Status in Laurel Springs borough
33.3% of women with births in Laurel Springs borough are unmarried. Women with the educational attainment of bachelor's degree are most likely to be married with 100.0% of them married at childbirth, while women with the educational attainment of high school diploma are least likely to be married with 100.0% of them unmarried at childbirth.
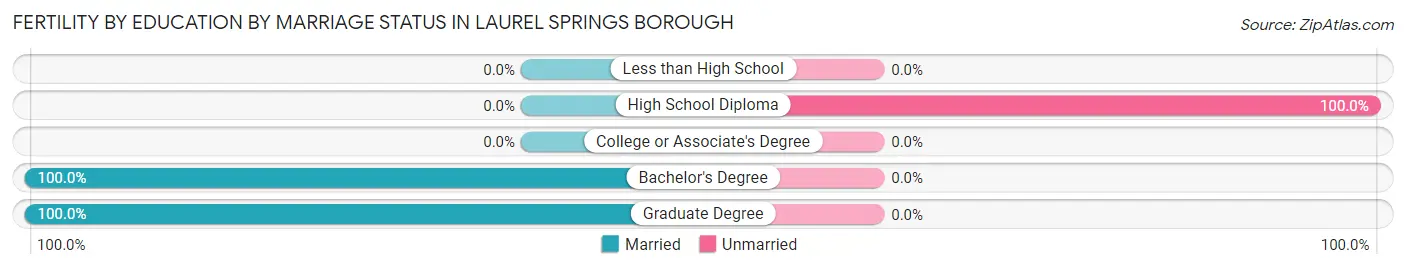
| Educational Attainment | Married | Unmarried |
| Less than High School | 0 (0.0%) | 0 (0.0%) |
| High School Diploma | 0 (0.0%) | 7 (100.0%) |
| College or Associate's Degree | 0 (0.0%) | 0 (0.0%) |
| Bachelor's Degree | 1 (100.0%) | 0 (0.0%) |
| Graduate Degree | 13 (100.0%) | 0 (0.0%) |
| Total | 14 (66.7%) | 7 (33.3%) |
Employment Characteristics in Laurel Springs borough
Employment by Class of Employer in Laurel Springs borough
Among the 1,050 employed individuals in Laurel Springs borough, private company employees (679 | 64.7%), local government employees (142 | 13.5%), and not-for-profit organizations (93 | 8.9%) make up the most common classes of employment.
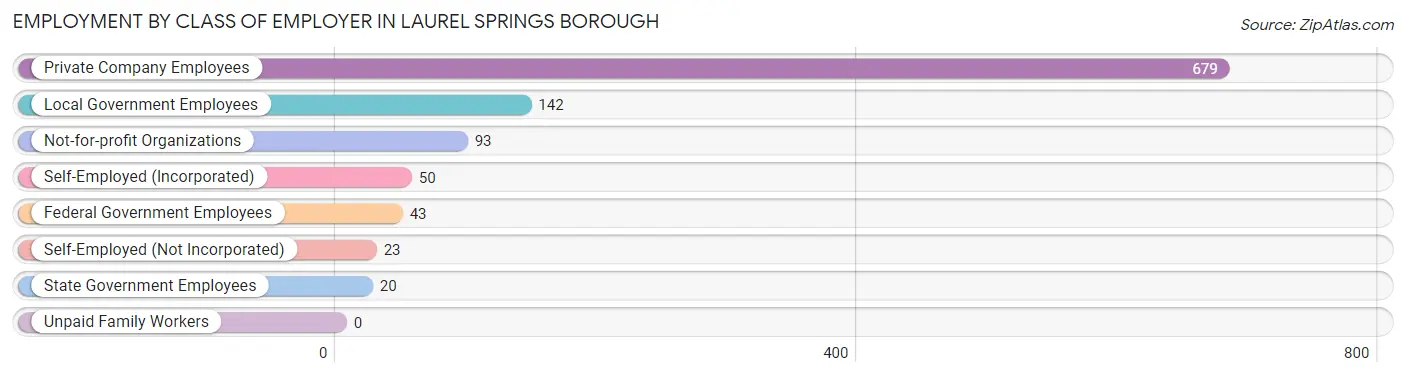
| Employer Class | # Employees | % Employees |
| Private Company Employees | 679 | 64.7% |
| Self-Employed (Incorporated) | 50 | 4.8% |
| Self-Employed (Not Incorporated) | 23 | 2.2% |
| Not-for-profit Organizations | 93 | 8.9% |
| Local Government Employees | 142 | 13.5% |
| State Government Employees | 20 | 1.9% |
| Federal Government Employees | 43 | 4.1% |
| Unpaid Family Workers | 0 | 0.0% |
| Total | 1,050 | 100.0% |
Employment Status by Age in Laurel Springs borough
According to the labor force statistics for Laurel Springs borough, out of the total population over 16 years of age (1,629), 68.2% or 1,111 individuals are in the labor force, with 4.5% or 50 of them unemployed. The age group with the highest labor force participation rate is 20 to 24 years, with 88.7% or 149 individuals in the labor force. Within the labor force, the 20 to 24 years age range has the highest percentage of unemployed individuals, with 13.4% or 20 of them being unemployed.
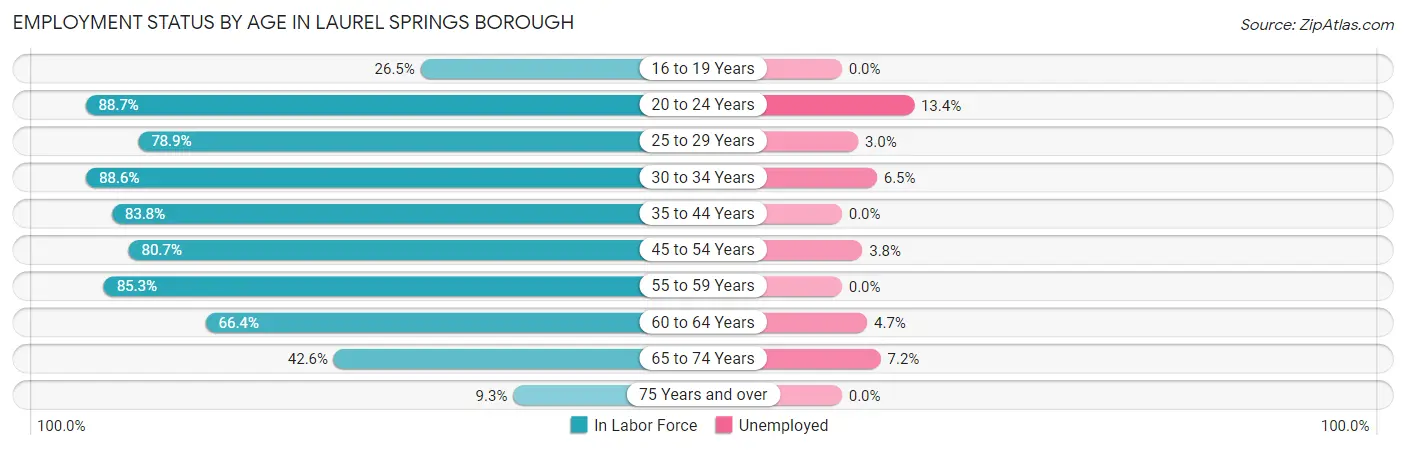
| Age Bracket | In Labor Force | Unemployed |
| 16 to 19 Years | 43 (26.5%) | 0 (0.0%) |
| 20 to 24 Years | 149 (88.7%) | 20 (13.4%) |
| 25 to 29 Years | 101 (78.9%) | 3 (3.0%) |
| 30 to 34 Years | 124 (88.6%) | 8 (6.5%) |
| 35 to 44 Years | 150 (83.8%) | 0 (0.0%) |
| 45 to 54 Years | 271 (80.7%) | 10 (3.8%) |
| 55 to 59 Years | 110 (85.3%) | 0 (0.0%) |
| 60 to 64 Years | 85 (66.4%) | 4 (4.7%) |
| 65 to 74 Years | 69 (42.6%) | 5 (7.2%) |
| 75 Years and over | 9 (9.3%) | 0 (0.0%) |
| Total | 1,111 (68.2%) | 50 (4.5%) |
Employment Status by Educational Attainment in Laurel Springs borough
According to labor force statistics for Laurel Springs borough, 80.9% of individuals (841) out of the total population between 25 and 64 years of age (1,040) are in the labor force, with 3.0% or 25 of them being unemployed. The group with the highest labor force participation rate are those with the educational attainment of college / associate degree, with 85.9% or 269 individuals in the labor force. Within the labor force, individuals with high school diploma education have the highest percentage of unemployment, with 5.9% or 11 of them being unemployed.
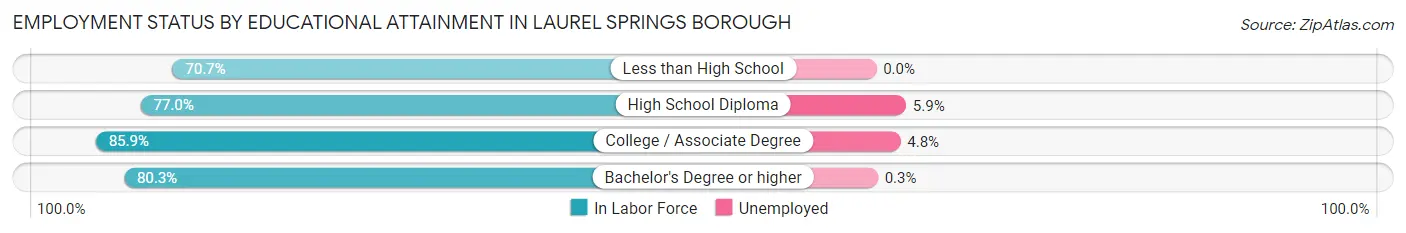
| Educational Attainment | In Labor Force | Unemployed |
| Less than High School | 29 (70.7%) | 0 (0.0%) |
| High School Diploma | 188 (77.0%) | 14 (5.9%) |
| College / Associate Degree | 269 (85.9%) | 15 (4.8%) |
| Bachelor's Degree or higher | 355 (80.3%) | 1 (0.3%) |
| Total | 841 (80.9%) | 31 (3.0%) |
Employment Occupations by Sex in Laurel Springs borough
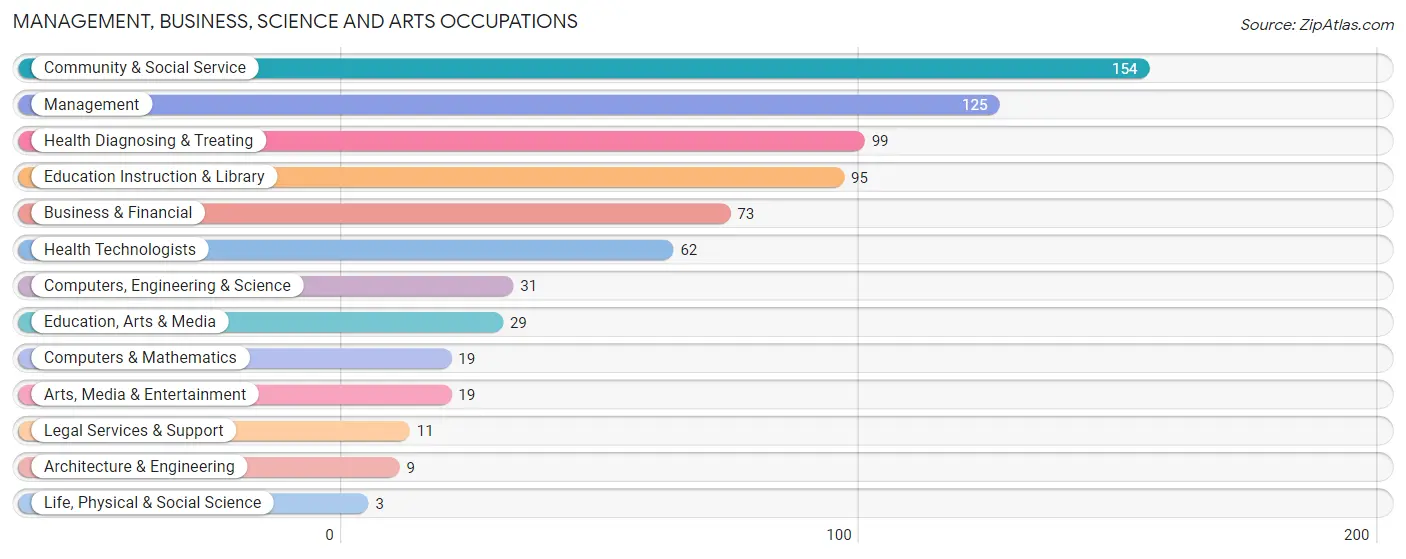
Management, Business, Science and Arts Occupations
The most common Management, Business, Science and Arts occupations in Laurel Springs borough are Community & Social Service (154 | 14.6%), Management (125 | 11.8%), Health Diagnosing & Treating (99 | 9.4%), Education Instruction & Library (95 | 9.0%), and Business & Financial (73 | 6.9%).
Management, Business, Science and Arts Occupations by Sex
Within the Management, Business, Science and Arts occupations in Laurel Springs borough, the most male-oriented occupations are Architecture & Engineering (100.0%), Life, Physical & Social Science (100.0%), and Management (86.4%), while the most female-oriented occupations are Education, Arts & Media (86.2%), Education Instruction & Library (82.1%), and Community & Social Service (78.6%).
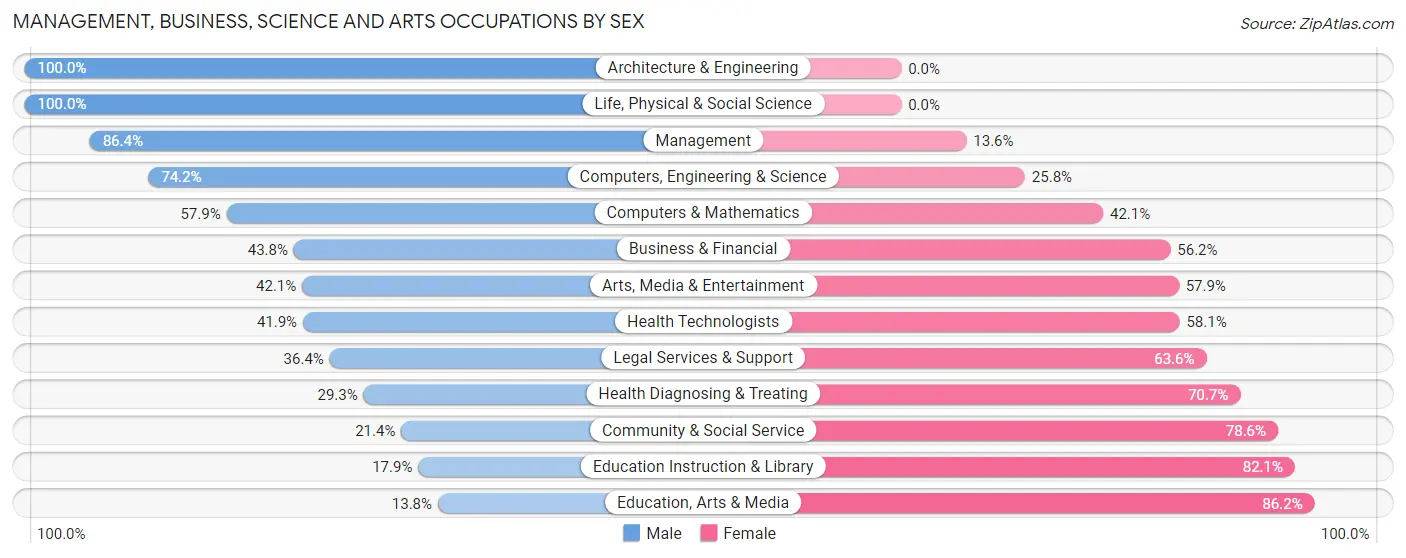
| Occupation | Male | Female |
| Management | 108 (86.4%) | 17 (13.6%) |
| Business & Financial | 32 (43.8%) | 41 (56.2%) |
| Computers, Engineering & Science | 23 (74.2%) | 8 (25.8%) |
| Computers & Mathematics | 11 (57.9%) | 8 (42.1%) |
| Architecture & Engineering | 9 (100.0%) | 0 (0.0%) |
| Life, Physical & Social Science | 3 (100.0%) | 0 (0.0%) |
| Community & Social Service | 33 (21.4%) | 121 (78.6%) |
| Education, Arts & Media | 4 (13.8%) | 25 (86.2%) |
| Legal Services & Support | 4 (36.4%) | 7 (63.6%) |
| Education Instruction & Library | 17 (17.9%) | 78 (82.1%) |
| Arts, Media & Entertainment | 8 (42.1%) | 11 (57.9%) |
| Health Diagnosing & Treating | 29 (29.3%) | 70 (70.7%) |
| Health Technologists | 26 (41.9%) | 36 (58.1%) |
| Total (Category) | 225 (46.7%) | 257 (53.3%) |
| Total (Overall) | 559 (52.9%) | 497 (47.1%) |
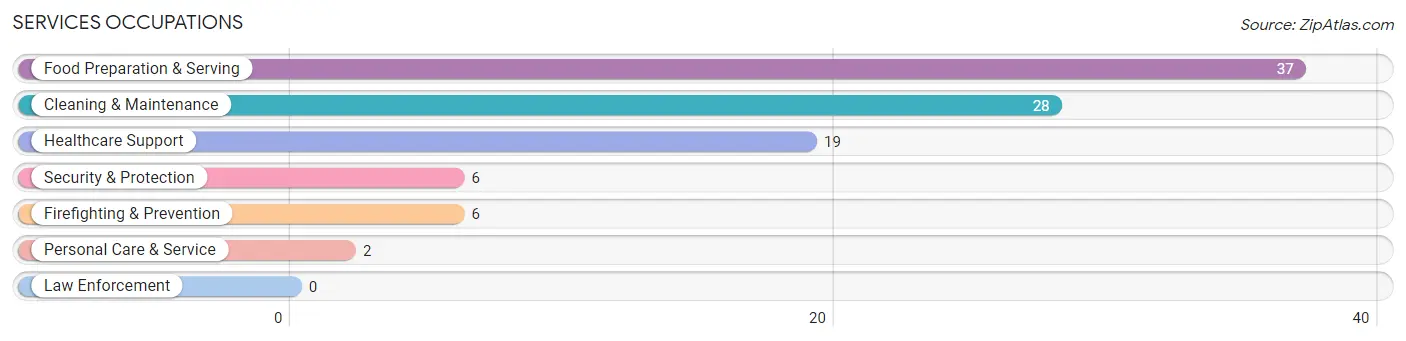
Services Occupations
The most common Services occupations in Laurel Springs borough are Food Preparation & Serving (37 | 3.5%), Cleaning & Maintenance (28 | 2.6%), Healthcare Support (19 | 1.8%), Security & Protection (6 | 0.6%), and Firefighting & Prevention (6 | 0.6%).
Services Occupations by Sex
Within the Services occupations in Laurel Springs borough, the most male-oriented occupations are Cleaning & Maintenance (78.6%), Food Preparation & Serving (73.0%), and Security & Protection (66.7%), while the most female-oriented occupations are Healthcare Support (100.0%), Personal Care & Service (100.0%), and Security & Protection (33.3%).
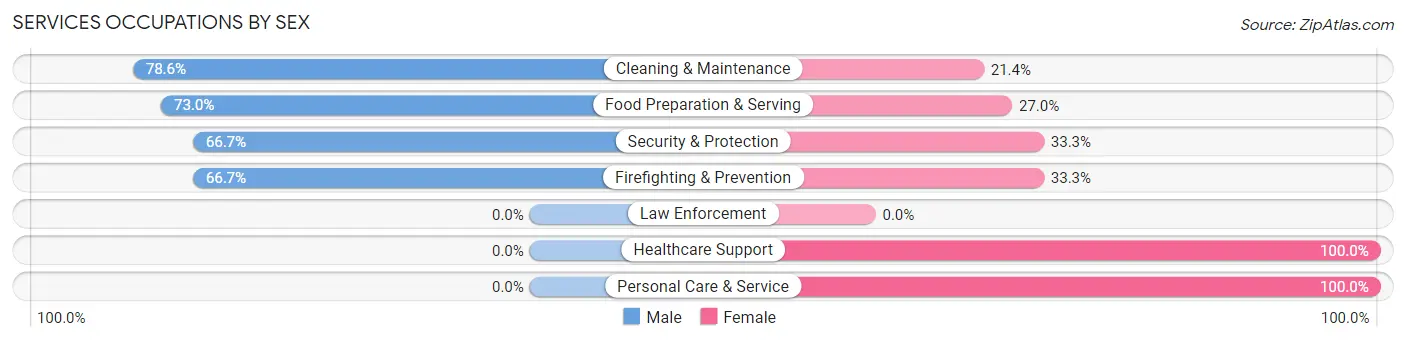
| Occupation | Male | Female |
| Healthcare Support | 0 (0.0%) | 19 (100.0%) |
| Security & Protection | 4 (66.7%) | 2 (33.3%) |
| Firefighting & Prevention | 4 (66.7%) | 2 (33.3%) |
| Law Enforcement | 0 (0.0%) | 0 (0.0%) |
| Food Preparation & Serving | 27 (73.0%) | 10 (27.0%) |
| Cleaning & Maintenance | 22 (78.6%) | 6 (21.4%) |
| Personal Care & Service | 0 (0.0%) | 2 (100.0%) |
| Total (Category) | 53 (57.6%) | 39 (42.4%) |
| Total (Overall) | 559 (52.9%) | 497 (47.1%) |
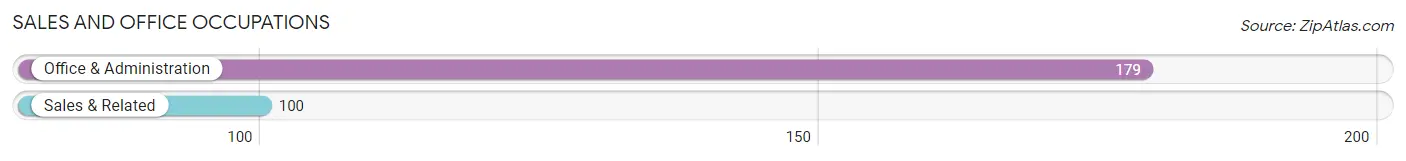
Sales and Office Occupations
The most common Sales and Office occupations in Laurel Springs borough are Office & Administration (179 | 17.0%), and Sales & Related (100 | 9.5%).
Sales and Office Occupations by Sex
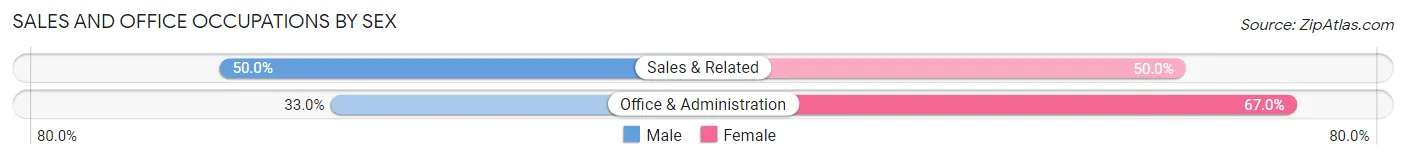
| Occupation | Male | Female |
| Sales & Related | 50 (50.0%) | 50 (50.0%) |
| Office & Administration | 59 (33.0%) | 120 (67.0%) |
| Total (Category) | 109 (39.1%) | 170 (60.9%) |
| Total (Overall) | 559 (52.9%) | 497 (47.1%) |
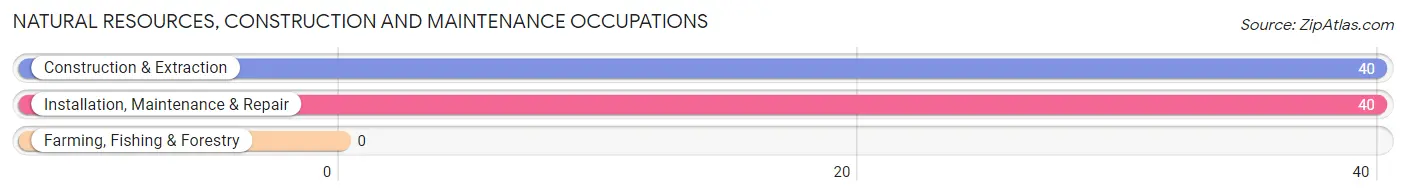
Natural Resources, Construction and Maintenance Occupations
The most common Natural Resources, Construction and Maintenance occupations in Laurel Springs borough are Construction & Extraction (40 | 3.8%), and Installation, Maintenance & Repair (40 | 3.8%).
Natural Resources, Construction and Maintenance Occupations by Sex
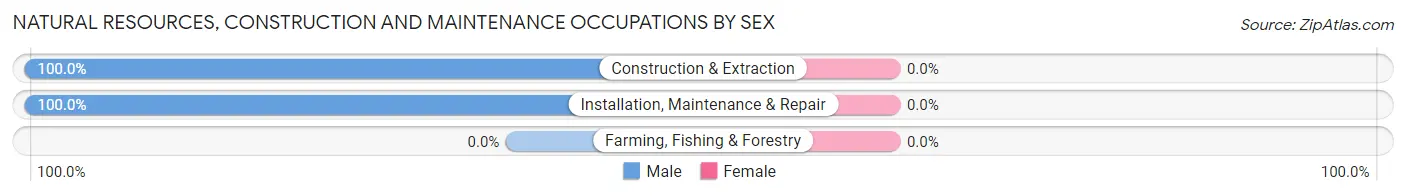
| Occupation | Male | Female |
| Farming, Fishing & Forestry | 0 (0.0%) | 0 (0.0%) |
| Construction & Extraction | 40 (100.0%) | 0 (0.0%) |
| Installation, Maintenance & Repair | 40 (100.0%) | 0 (0.0%) |
| Total (Category) | 80 (100.0%) | 0 (0.0%) |
| Total (Overall) | 559 (52.9%) | 497 (47.1%) |
Production, Transportation and Moving Occupations
The most common Production, Transportation and Moving occupations in Laurel Springs borough are Production (55 | 5.2%), Transportation (45 | 4.3%), and Material Moving (23 | 2.2%).
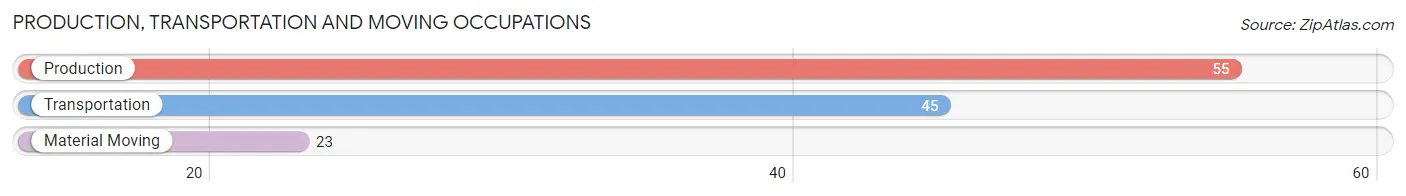
Production, Transportation and Moving Occupations by Sex
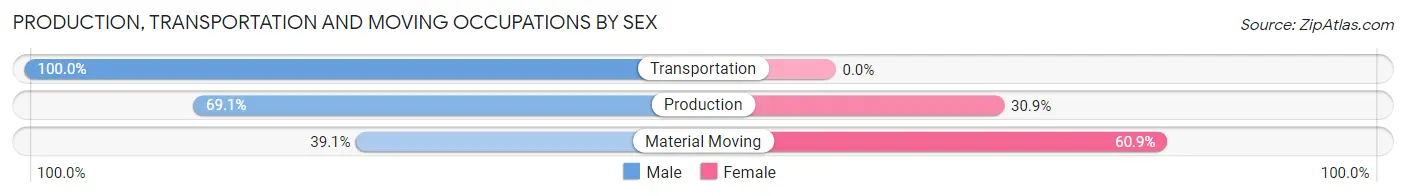
| Occupation | Male | Female |
| Production | 38 (69.1%) | 17 (30.9%) |
| Transportation | 45 (100.0%) | 0 (0.0%) |
| Material Moving | 9 (39.1%) | 14 (60.9%) |
| Total (Category) | 92 (74.8%) | 31 (25.2%) |
| Total (Overall) | 559 (52.9%) | 497 (47.1%) |
Employment Industries by Sex in Laurel Springs borough
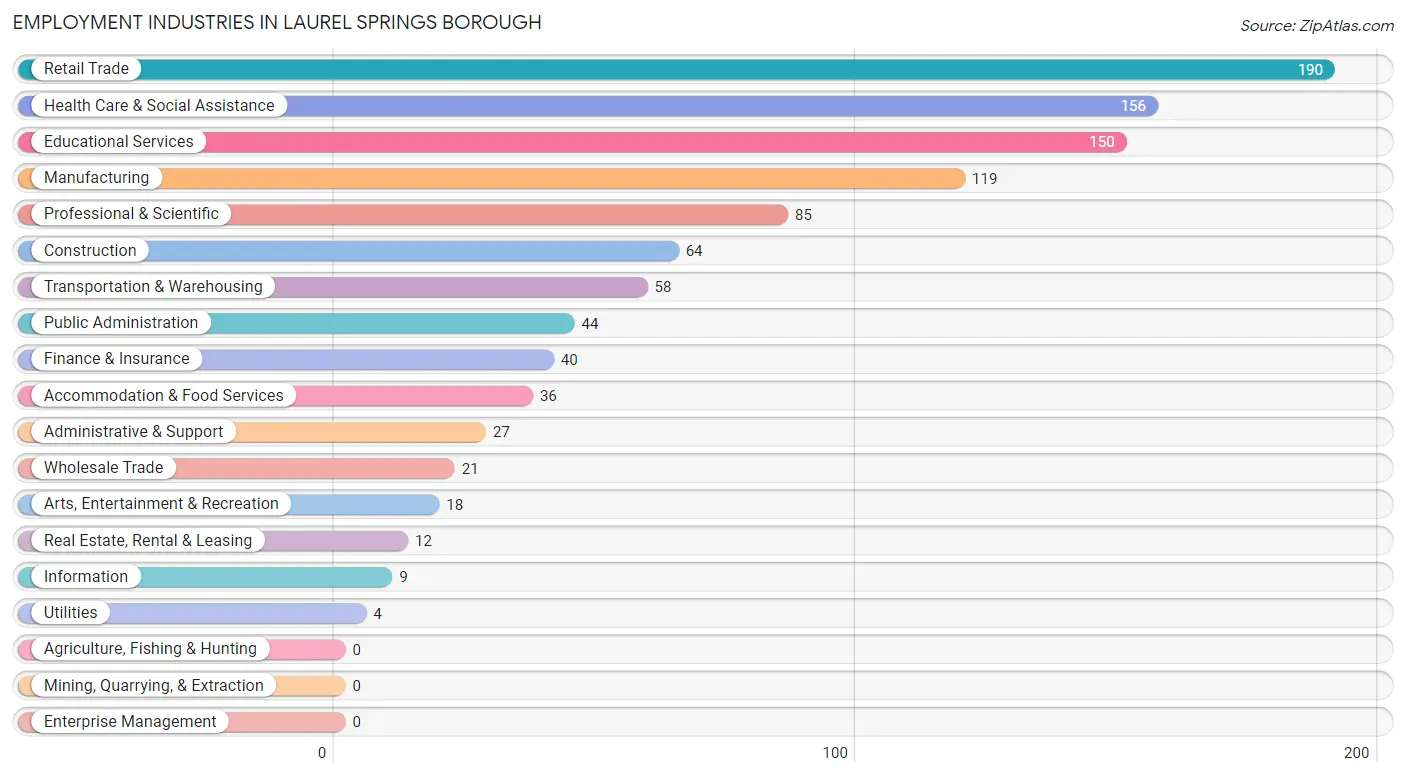
Employment Industries in Laurel Springs borough
The major employment industries in Laurel Springs borough include Retail Trade (190 | 18.0%), Health Care & Social Assistance (156 | 14.8%), Educational Services (150 | 14.2%), Manufacturing (119 | 11.3%), and Professional & Scientific (85 | 8.1%).
Employment Industries by Sex in Laurel Springs borough
The Laurel Springs borough industries that see more men than women are Construction (100.0%), Utilities (100.0%), and Transportation & Warehousing (96.6%), whereas the industries that tend to have a higher number of women are Educational Services (76.0%), Real Estate, Rental & Leasing (75.0%), and Health Care & Social Assistance (73.1%).
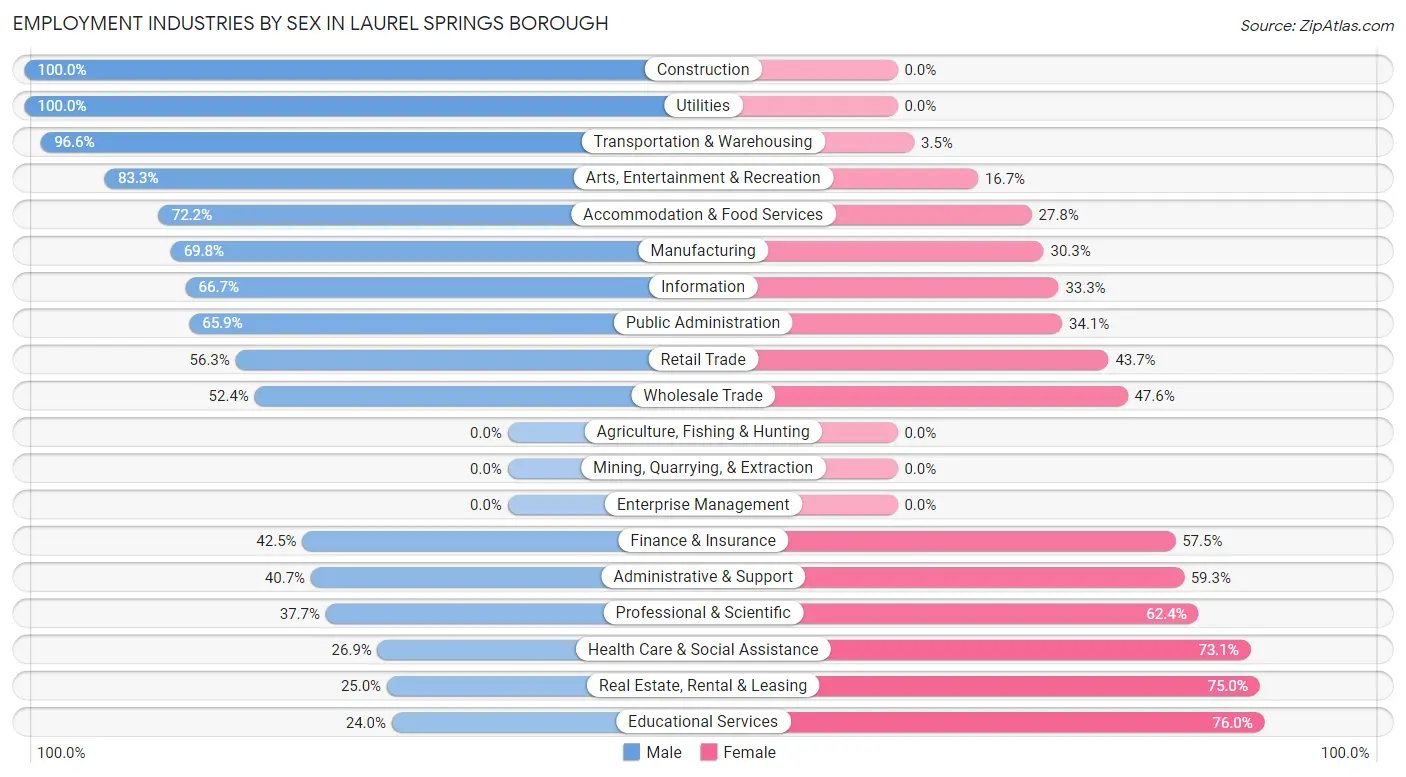
| Industry | Male | Female |
| Agriculture, Fishing & Hunting | 0 (0.0%) | 0 (0.0%) |
| Mining, Quarrying, & Extraction | 0 (0.0%) | 0 (0.0%) |
| Construction | 64 (100.0%) | 0 (0.0%) |
| Manufacturing | 83 (69.8%) | 36 (30.2%) |
| Wholesale Trade | 11 (52.4%) | 10 (47.6%) |
| Retail Trade | 107 (56.3%) | 83 (43.7%) |
| Transportation & Warehousing | 56 (96.6%) | 2 (3.5%) |
| Utilities | 4 (100.0%) | 0 (0.0%) |
| Information | 6 (66.7%) | 3 (33.3%) |
| Finance & Insurance | 17 (42.5%) | 23 (57.5%) |
| Real Estate, Rental & Leasing | 3 (25.0%) | 9 (75.0%) |
| Professional & Scientific | 32 (37.7%) | 53 (62.4%) |
| Enterprise Management | 0 (0.0%) | 0 (0.0%) |
| Administrative & Support | 11 (40.7%) | 16 (59.3%) |
| Educational Services | 36 (24.0%) | 114 (76.0%) |
| Health Care & Social Assistance | 42 (26.9%) | 114 (73.1%) |
| Arts, Entertainment & Recreation | 15 (83.3%) | 3 (16.7%) |
| Accommodation & Food Services | 26 (72.2%) | 10 (27.8%) |
| Public Administration | 29 (65.9%) | 15 (34.1%) |
| Total | 559 (52.9%) | 497 (47.1%) |
Education in Laurel Springs borough
School Enrollment in Laurel Springs borough
The most common levels of schooling among the 539 students in Laurel Springs borough are high school (128 | 23.7%), middle school (116 | 21.5%), and elementary school (113 | 21.0%).
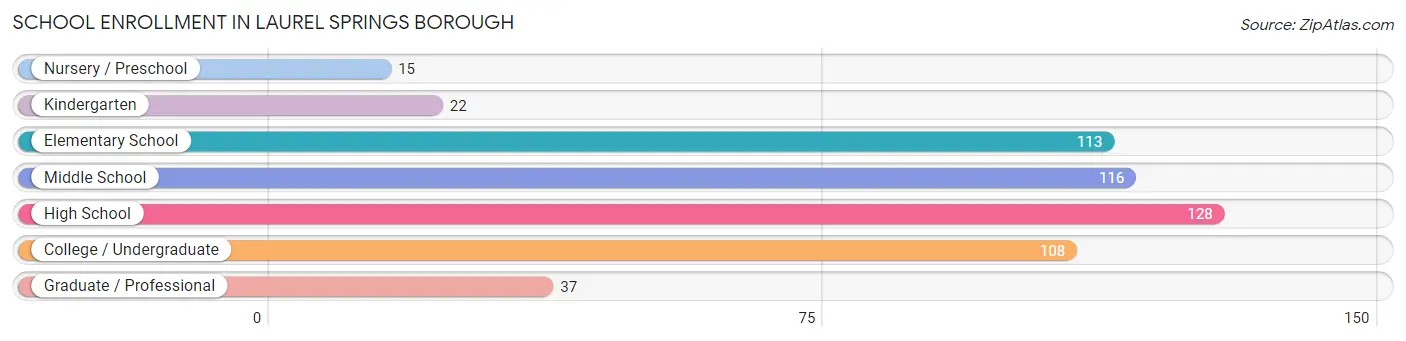
| School Level | # Students | % Students |
| Nursery / Preschool | 15 | 2.8% |
| Kindergarten | 22 | 4.1% |
| Elementary School | 113 | 21.0% |
| Middle School | 116 | 21.5% |
| High School | 128 | 23.7% |
| College / Undergraduate | 108 | 20.0% |
| Graduate / Professional | 37 | 6.9% |
| Total | 539 | 100.0% |
School Enrollment by Age by Funding Source in Laurel Springs borough
Out of a total of 539 students who are enrolled in schools in Laurel Springs borough, 107 (19.9%) attend a private institution, while the remaining 432 (80.1%) are enrolled in public schools. The age group of 3 to 4 year olds has the highest likelihood of being enrolled in private schools, with 13 (86.7% in the age bracket) enrolled. Conversely, the age group of 5 to 9 year old has the lowest likelihood of being enrolled in a private school, with 107 (90.7% in the age bracket) attending a public institution.
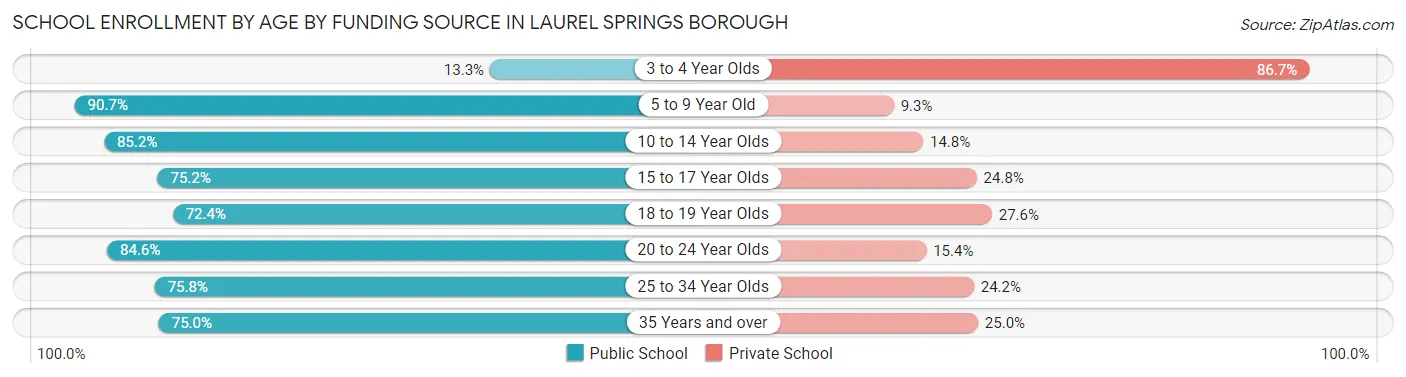
| Age Bracket | Public School | Private School |
| 3 to 4 Year Olds | 2 (13.3%) | 13 (86.7%) |
| 5 to 9 Year Old | 107 (90.7%) | 11 (9.3%) |
| 10 to 14 Year Olds | 121 (85.2%) | 21 (14.8%) |
| 15 to 17 Year Olds | 82 (75.2%) | 27 (24.8%) |
| 18 to 19 Year Olds | 42 (72.4%) | 16 (27.6%) |
| 20 to 24 Year Olds | 44 (84.6%) | 8 (15.4%) |
| 25 to 34 Year Olds | 25 (75.8%) | 8 (24.2%) |
| 35 Years and over | 9 (75.0%) | 3 (25.0%) |
| Total | 432 (80.1%) | 107 (19.9%) |
Educational Attainment by Field of Study in Laurel Springs borough
Education (98 | 18.2%), business (63 | 11.7%), bio, nature & agricultural (62 | 11.5%), visual & performing arts (57 | 10.6%), and engineering (42 | 7.8%) are the most common fields of study among 539 individuals in Laurel Springs borough who have obtained a bachelor's degree or higher.
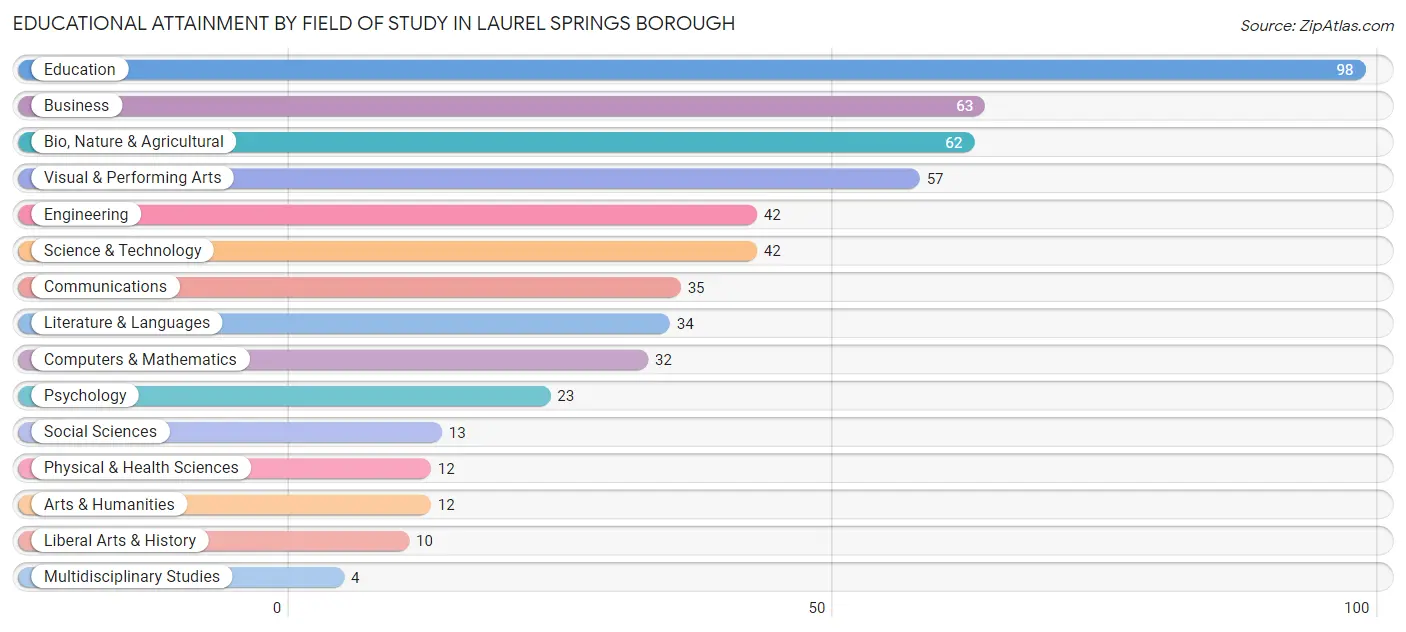
| Field of Study | # Graduates | % Graduates |
| Computers & Mathematics | 32 | 5.9% |
| Bio, Nature & Agricultural | 62 | 11.5% |
| Physical & Health Sciences | 12 | 2.2% |
| Psychology | 23 | 4.3% |
| Social Sciences | 13 | 2.4% |
| Engineering | 42 | 7.8% |
| Multidisciplinary Studies | 4 | 0.7% |
| Science & Technology | 42 | 7.8% |
| Business | 63 | 11.7% |
| Education | 98 | 18.2% |
| Literature & Languages | 34 | 6.3% |
| Liberal Arts & History | 10 | 1.9% |
| Visual & Performing Arts | 57 | 10.6% |
| Communications | 35 | 6.5% |
| Arts & Humanities | 12 | 2.2% |
| Total | 539 | 100.0% |
Transportation & Commute in Laurel Springs borough
Vehicle Availability by Sex in Laurel Springs borough
The most prevalent vehicle ownership categories in Laurel Springs borough are males with 2 vehicles (196, accounting for 34.9%) and females with 2 vehicles (180, making up 40.2%).
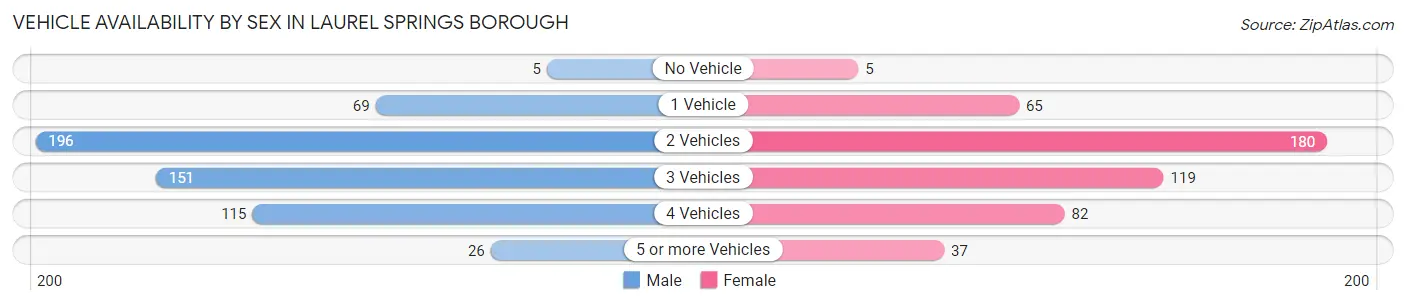
| Vehicles Available | Male | Female |
| No Vehicle | 5 (0.9%) | 5 (1.0%) |
| 1 Vehicle | 69 (12.3%) | 65 (13.3%) |
| 2 Vehicles | 196 (34.9%) | 180 (36.9%) |
| 3 Vehicles | 151 (26.9%) | 119 (24.4%) |
| 4 Vehicles | 115 (20.5%) | 82 (16.8%) |
| 5 or more Vehicles | 26 (4.6%) | 37 (7.6%) |
| Total | 562 (100.0%) | 488 (100.0%) |
Commute Time in Laurel Springs borough
The most frequently occuring commute durations in Laurel Springs borough are 30 to 34 minutes (158 commuters, 16.4%), 5 to 9 minutes (136 commuters, 14.1%), and 15 to 19 minutes (126 commuters, 13.1%).
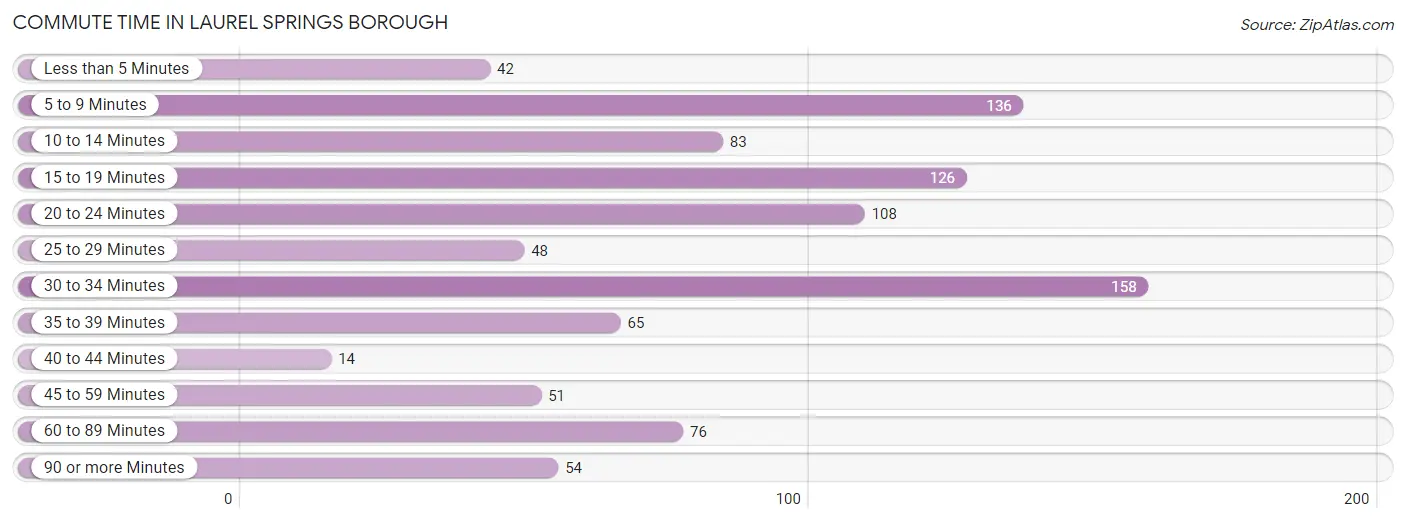
| Commute Time | # Commuters | % Commuters |
| Less than 5 Minutes | 42 | 4.4% |
| 5 to 9 Minutes | 136 | 14.1% |
| 10 to 14 Minutes | 83 | 8.6% |
| 15 to 19 Minutes | 126 | 13.1% |
| 20 to 24 Minutes | 108 | 11.2% |
| 25 to 29 Minutes | 48 | 5.0% |
| 30 to 34 Minutes | 158 | 16.4% |
| 35 to 39 Minutes | 65 | 6.8% |
| 40 to 44 Minutes | 14 | 1.5% |
| 45 to 59 Minutes | 51 | 5.3% |
| 60 to 89 Minutes | 76 | 7.9% |
| 90 or more Minutes | 54 | 5.6% |
Commute Time by Sex in Laurel Springs borough
The most common commute times in Laurel Springs borough are 30 to 34 minutes (114 commuters, 21.5%) for males and 5 to 9 minutes (92 commuters, 21.4%) for females.
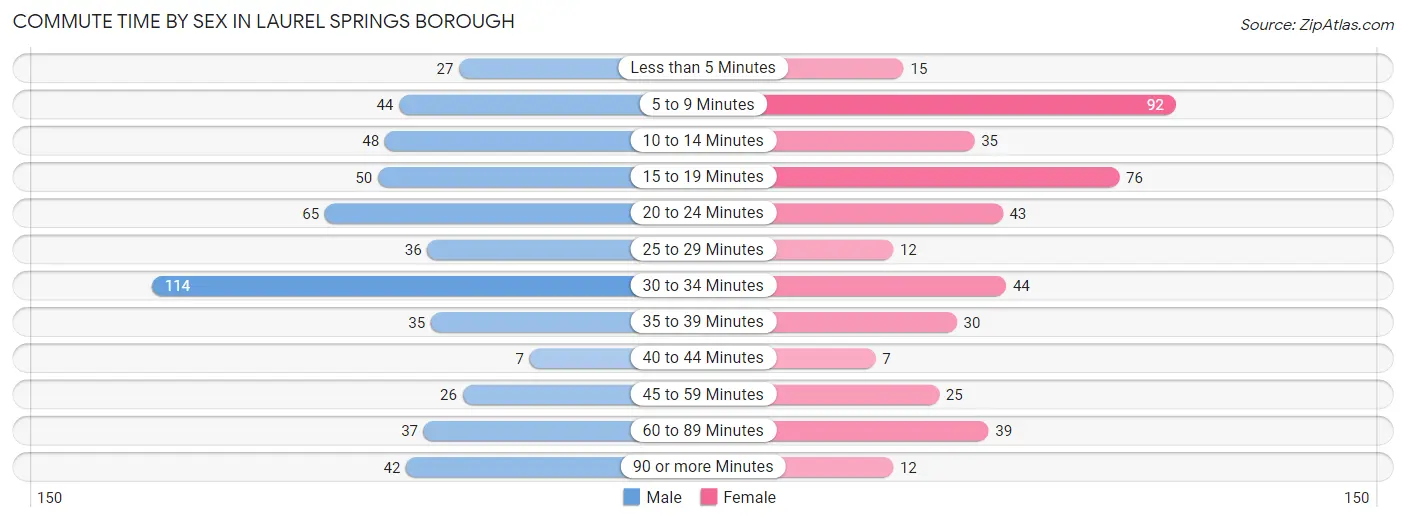
| Commute Time | Male | Female |
| Less than 5 Minutes | 27 (5.1%) | 15 (3.5%) |
| 5 to 9 Minutes | 44 (8.3%) | 92 (21.4%) |
| 10 to 14 Minutes | 48 (9.0%) | 35 (8.1%) |
| 15 to 19 Minutes | 50 (9.4%) | 76 (17.7%) |
| 20 to 24 Minutes | 65 (12.2%) | 43 (10.0%) |
| 25 to 29 Minutes | 36 (6.8%) | 12 (2.8%) |
| 30 to 34 Minutes | 114 (21.5%) | 44 (10.2%) |
| 35 to 39 Minutes | 35 (6.6%) | 30 (7.0%) |
| 40 to 44 Minutes | 7 (1.3%) | 7 (1.6%) |
| 45 to 59 Minutes | 26 (4.9%) | 25 (5.8%) |
| 60 to 89 Minutes | 37 (7.0%) | 39 (9.1%) |
| 90 or more Minutes | 42 (7.9%) | 12 (2.8%) |
Time of Departure to Work by Sex in Laurel Springs borough
The most frequent times of departure to work in Laurel Springs borough are 6:00 AM to 6:29 AM (112, 21.1%) for males and 7:00 AM to 7:29 AM (91, 21.2%) for females.
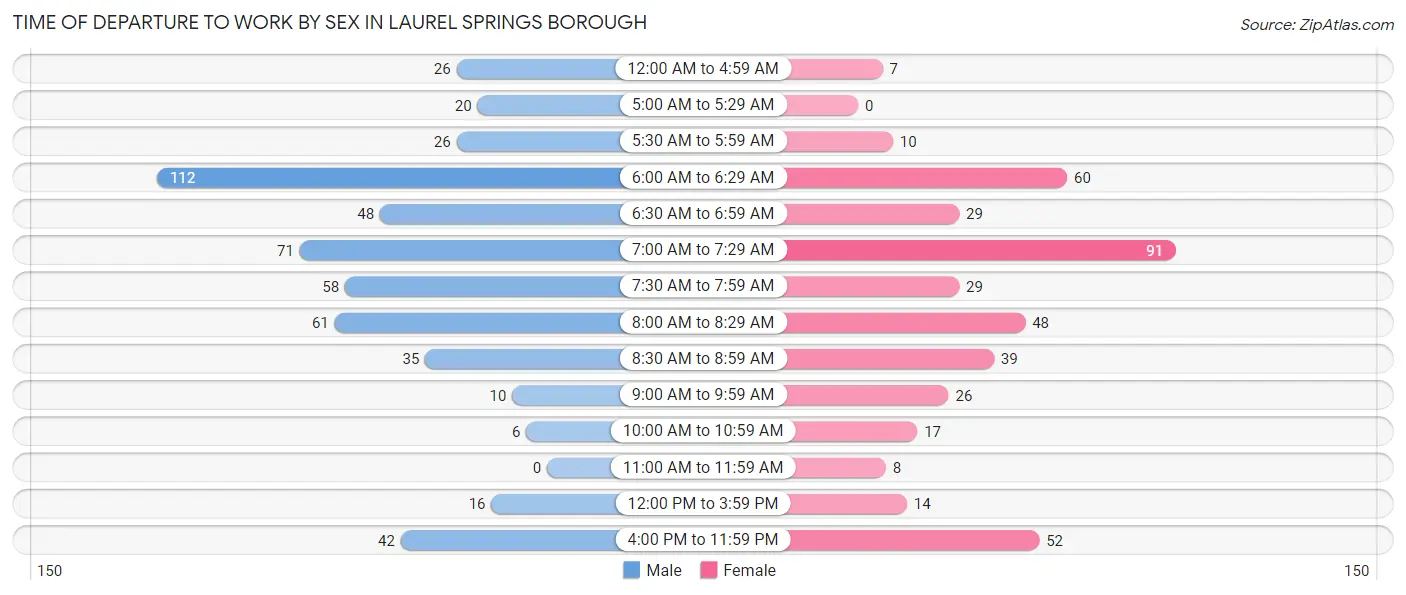
| Time of Departure | Male | Female |
| 12:00 AM to 4:59 AM | 26 (4.9%) | 7 (1.6%) |
| 5:00 AM to 5:29 AM | 20 (3.8%) | 0 (0.0%) |
| 5:30 AM to 5:59 AM | 26 (4.9%) | 10 (2.3%) |
| 6:00 AM to 6:29 AM | 112 (21.1%) | 60 (14.0%) |
| 6:30 AM to 6:59 AM | 48 (9.0%) | 29 (6.7%) |
| 7:00 AM to 7:29 AM | 71 (13.4%) | 91 (21.2%) |
| 7:30 AM to 7:59 AM | 58 (10.9%) | 29 (6.7%) |
| 8:00 AM to 8:29 AM | 61 (11.5%) | 48 (11.2%) |
| 8:30 AM to 8:59 AM | 35 (6.6%) | 39 (9.1%) |
| 9:00 AM to 9:59 AM | 10 (1.9%) | 26 (6.0%) |
| 10:00 AM to 10:59 AM | 6 (1.1%) | 17 (4.0%) |
| 11:00 AM to 11:59 AM | 0 (0.0%) | 8 (1.9%) |
| 12:00 PM to 3:59 PM | 16 (3.0%) | 14 (3.3%) |
| 4:00 PM to 11:59 PM | 42 (7.9%) | 52 (12.1%) |
| Total | 531 (100.0%) | 430 (100.0%) |
Housing Occupancy in Laurel Springs borough
Occupancy by Ownership in Laurel Springs borough
Of the total 680 dwellings in Laurel Springs borough, owner-occupied units account for 547 (80.4%), while renter-occupied units make up 133 (19.6%).
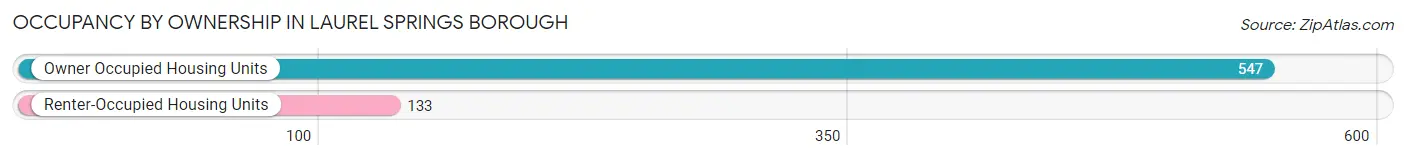
| Occupancy | # Housing Units | % Housing Units |
| Owner Occupied Housing Units | 547 | 80.4% |
| Renter-Occupied Housing Units | 133 | 19.6% |
| Total Occupied Housing Units | 680 | 100.0% |
Occupancy by Household Size in Laurel Springs borough
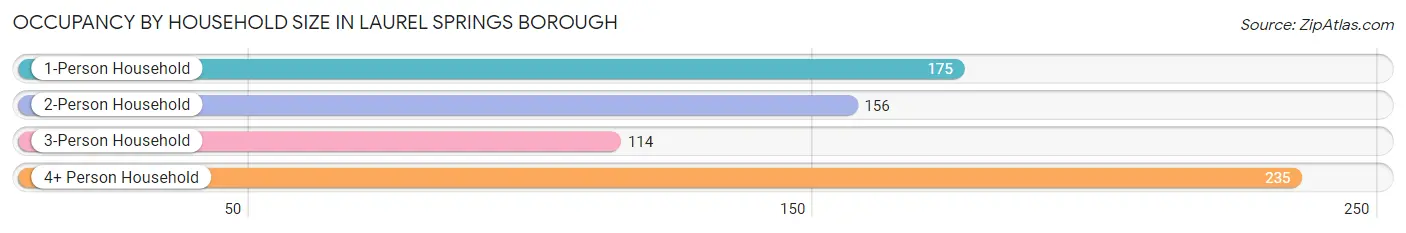
| Household Size | # Housing Units | % Housing Units |
| 1-Person Household | 175 | 25.7% |
| 2-Person Household | 156 | 22.9% |
| 3-Person Household | 114 | 16.8% |
| 4+ Person Household | 235 | 34.6% |
| Total Housing Units | 680 | 100.0% |
Occupancy by Ownership by Household Size in Laurel Springs borough
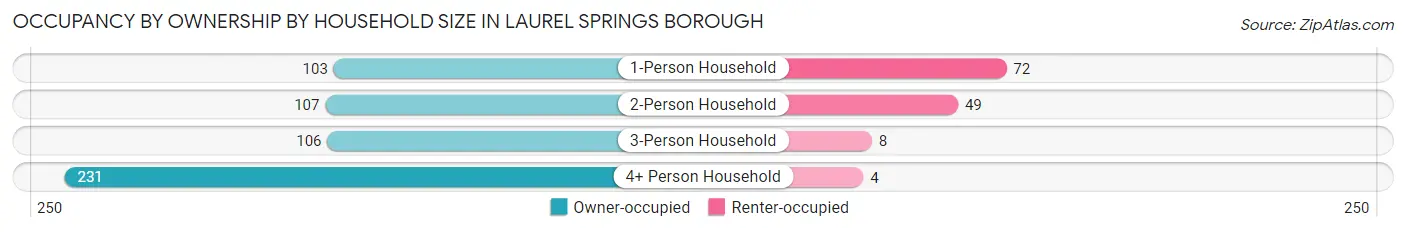
| Household Size | Owner-occupied | Renter-occupied |
| 1-Person Household | 103 (58.9%) | 72 (41.1%) |
| 2-Person Household | 107 (68.6%) | 49 (31.4%) |
| 3-Person Household | 106 (93.0%) | 8 (7.0%) |
| 4+ Person Household | 231 (98.3%) | 4 (1.7%) |
| Total Housing Units | 547 (80.4%) | 133 (19.6%) |
Occupancy by Educational Attainment in Laurel Springs borough
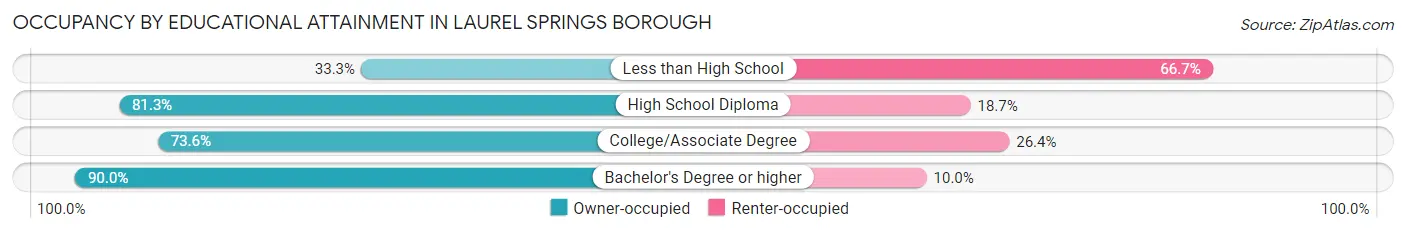
| Household Size | Owner-occupied | Renter-occupied |
| Less than High School | 7 (33.3%) | 14 (66.7%) |
| High School Diploma | 113 (81.3%) | 26 (18.7%) |
| College/Associate Degree | 184 (73.6%) | 66 (26.4%) |
| Bachelor's Degree or higher | 243 (90.0%) | 27 (10.0%) |
Occupancy by Age of Householder in Laurel Springs borough
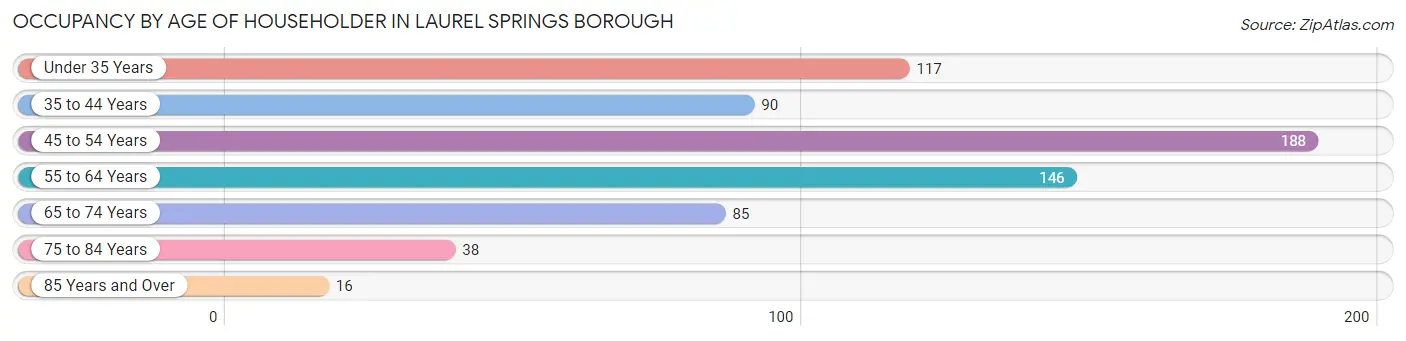
| Age Bracket | # Households | % Households |
| Under 35 Years | 117 | 17.2% |
| 35 to 44 Years | 90 | 13.2% |
| 45 to 54 Years | 188 | 27.7% |
| 55 to 64 Years | 146 | 21.5% |
| 65 to 74 Years | 85 | 12.5% |
| 75 to 84 Years | 38 | 5.6% |
| 85 Years and Over | 16 | 2.4% |
| Total | 680 | 100.0% |
Housing Finances in Laurel Springs borough
Median Income by Occupancy in Laurel Springs borough
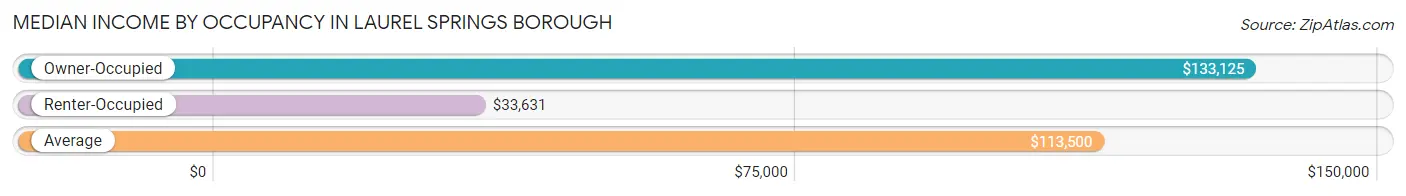
| Occupancy Type | # Households | Median Income |
| Owner-Occupied | 547 (80.4%) | $133,125 |
| Renter-Occupied | 133 (19.6%) | $33,631 |
| Average | 680 (100.0%) | $113,500 |
Occupancy by Householder Income Bracket in Laurel Springs borough
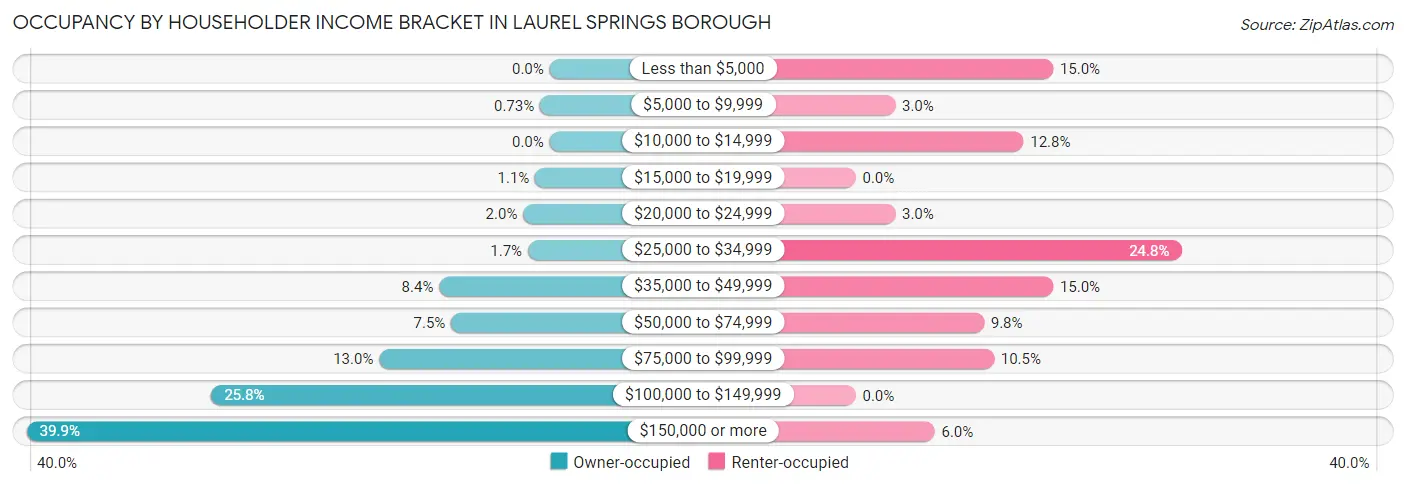
| Income Bracket | Owner-occupied | Renter-occupied |
| Less than $5,000 | 0 (0.0%) | 20 (15.0%) |
| $5,000 to $9,999 | 4 (0.7%) | 4 (3.0%) |
| $10,000 to $14,999 | 0 (0.0%) | 17 (12.8%) |
| $15,000 to $19,999 | 6 (1.1%) | 0 (0.0%) |
| $20,000 to $24,999 | 11 (2.0%) | 4 (3.0%) |
| $25,000 to $34,999 | 9 (1.7%) | 33 (24.8%) |
| $35,000 to $49,999 | 46 (8.4%) | 20 (15.0%) |
| $50,000 to $74,999 | 41 (7.5%) | 13 (9.8%) |
| $75,000 to $99,999 | 71 (13.0%) | 14 (10.5%) |
| $100,000 to $149,999 | 141 (25.8%) | 0 (0.0%) |
| $150,000 or more | 218 (39.9%) | 8 (6.0%) |
| Total | 547 (100.0%) | 133 (100.0%) |
Monthly Housing Cost Tiers in Laurel Springs borough
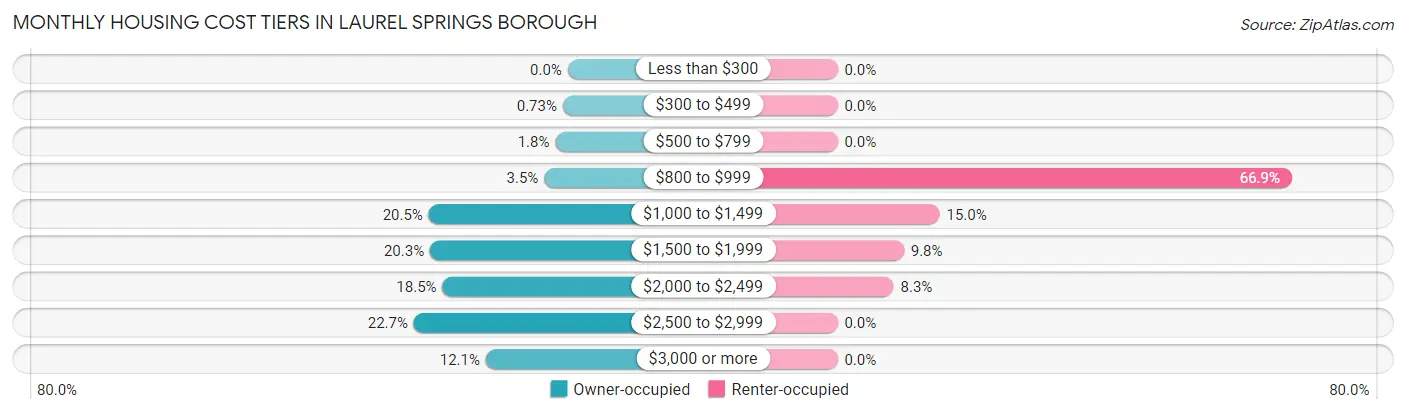
| Monthly Cost | Owner-occupied | Renter-occupied |
| Less than $300 | 0 (0.0%) | 0 (0.0%) |
| $300 to $499 | 4 (0.7%) | 0 (0.0%) |
| $500 to $799 | 10 (1.8%) | 0 (0.0%) |
| $800 to $999 | 19 (3.5%) | 89 (66.9%) |
| $1,000 to $1,499 | 112 (20.5%) | 20 (15.0%) |
| $1,500 to $1,999 | 111 (20.3%) | 13 (9.8%) |
| $2,000 to $2,499 | 101 (18.5%) | 11 (8.3%) |
| $2,500 to $2,999 | 124 (22.7%) | 0 (0.0%) |
| $3,000 or more | 66 (12.1%) | 0 (0.0%) |
| Total | 547 (100.0%) | 133 (100.0%) |
Physical Housing Characteristics in Laurel Springs borough
Housing Structures in Laurel Springs borough
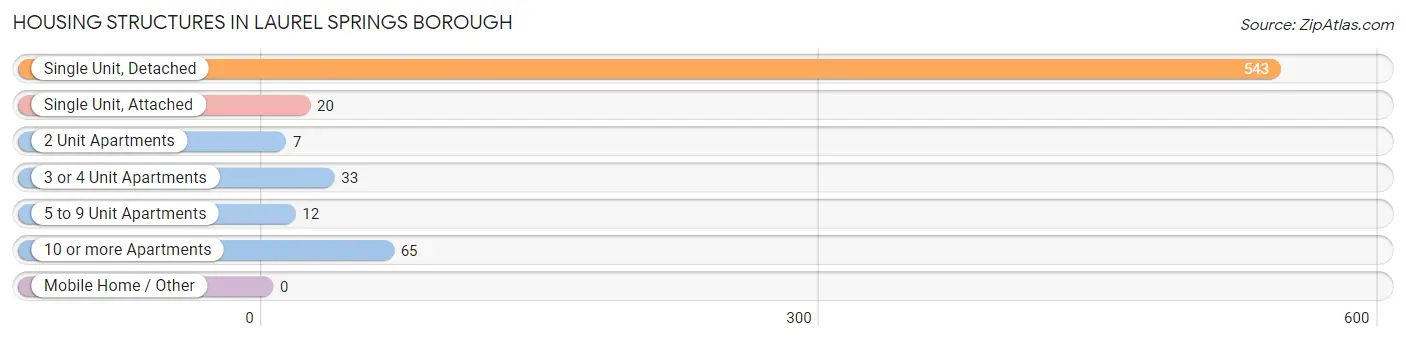
| Structure Type | # Housing Units | % Housing Units |
| Single Unit, Detached | 543 | 79.8% |
| Single Unit, Attached | 20 | 2.9% |
| 2 Unit Apartments | 7 | 1.0% |
| 3 or 4 Unit Apartments | 33 | 4.9% |
| 5 to 9 Unit Apartments | 12 | 1.8% |
| 10 or more Apartments | 65 | 9.6% |
| Mobile Home / Other | 0 | 0.0% |
| Total | 680 | 100.0% |
Housing Structures by Occupancy in Laurel Springs borough
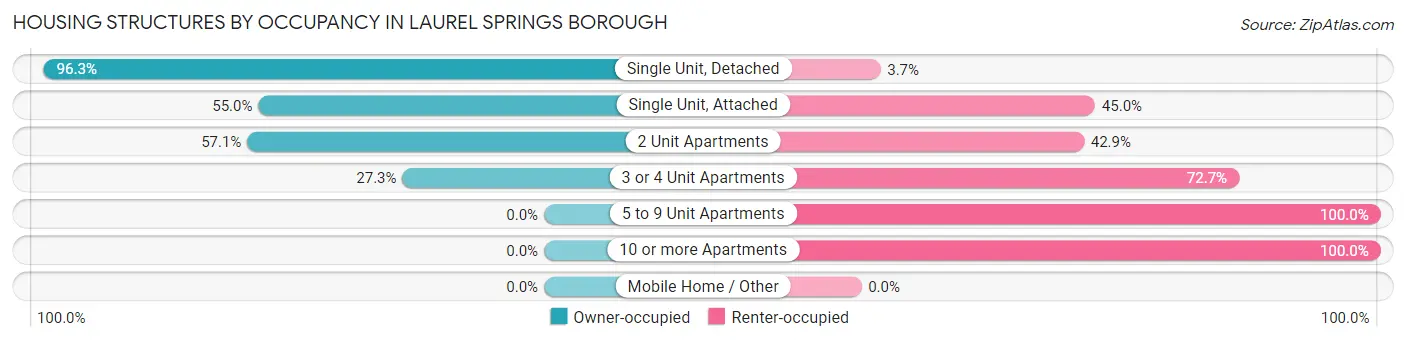
| Structure Type | Owner-occupied | Renter-occupied |
| Single Unit, Detached | 523 (96.3%) | 20 (3.7%) |
| Single Unit, Attached | 11 (55.0%) | 9 (45.0%) |
| 2 Unit Apartments | 4 (57.1%) | 3 (42.9%) |
| 3 or 4 Unit Apartments | 9 (27.3%) | 24 (72.7%) |
| 5 to 9 Unit Apartments | 0 (0.0%) | 12 (100.0%) |
| 10 or more Apartments | 0 (0.0%) | 65 (100.0%) |
| Mobile Home / Other | 0 (0.0%) | 0 (0.0%) |
| Total | 547 (80.4%) | 133 (19.6%) |
Housing Structures by Number of Rooms in Laurel Springs borough
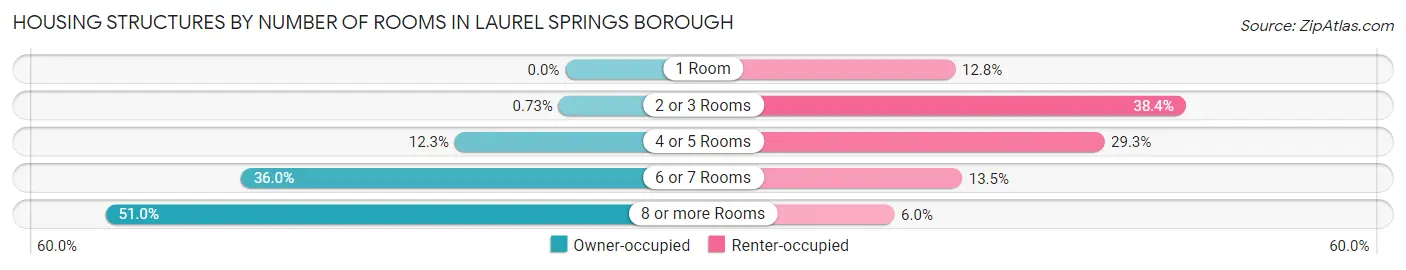
| Number of Rooms | Owner-occupied | Renter-occupied |
| 1 Room | 0 (0.0%) | 17 (12.8%) |
| 2 or 3 Rooms | 4 (0.7%) | 51 (38.4%) |
| 4 or 5 Rooms | 67 (12.2%) | 39 (29.3%) |
| 6 or 7 Rooms | 197 (36.0%) | 18 (13.5%) |
| 8 or more Rooms | 279 (51.0%) | 8 (6.0%) |
| Total | 547 (100.0%) | 133 (100.0%) |
Housing Structure by Heating Type in Laurel Springs borough
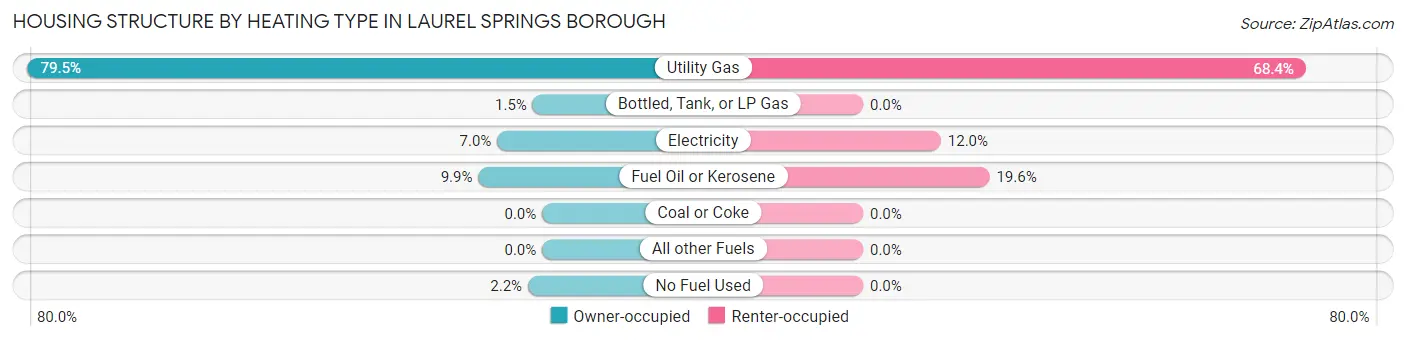
| Heating Type | Owner-occupied | Renter-occupied |
| Utility Gas | 435 (79.5%) | 91 (68.4%) |
| Bottled, Tank, or LP Gas | 8 (1.5%) | 0 (0.0%) |
| Electricity | 38 (7.0%) | 16 (12.0%) |
| Fuel Oil or Kerosene | 54 (9.9%) | 26 (19.6%) |
| Coal or Coke | 0 (0.0%) | 0 (0.0%) |
| All other Fuels | 0 (0.0%) | 0 (0.0%) |
| No Fuel Used | 12 (2.2%) | 0 (0.0%) |
| Total | 547 (100.0%) | 133 (100.0%) |
Household Vehicle Usage in Laurel Springs borough
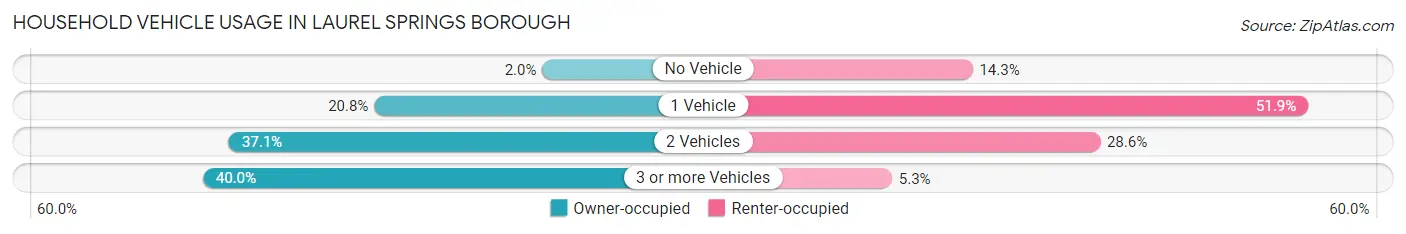
| Vehicles per Household | Owner-occupied | Renter-occupied |
| No Vehicle | 11 (2.0%) | 19 (14.3%) |
| 1 Vehicle | 114 (20.8%) | 69 (51.9%) |
| 2 Vehicles | 203 (37.1%) | 38 (28.6%) |
| 3 or more Vehicles | 219 (40.0%) | 7 (5.3%) |
| Total | 547 (100.0%) | 133 (100.0%) |
Real Estate & Mortgages in Laurel Springs borough
Real Estate and Mortgage Overview in Laurel Springs borough
| Characteristic | Without Mortgage | With Mortgage |
| Housing Units | 134 | 413 |
| Median Property Value | $193,200 | $251,800 |
| Median Household Income | $90,714 | $172 |
| Monthly Housing Costs | $1,120 | $62 |
| Real Estate Taxes | $8,632 | $10 |
Property Value by Mortgage Status in Laurel Springs borough
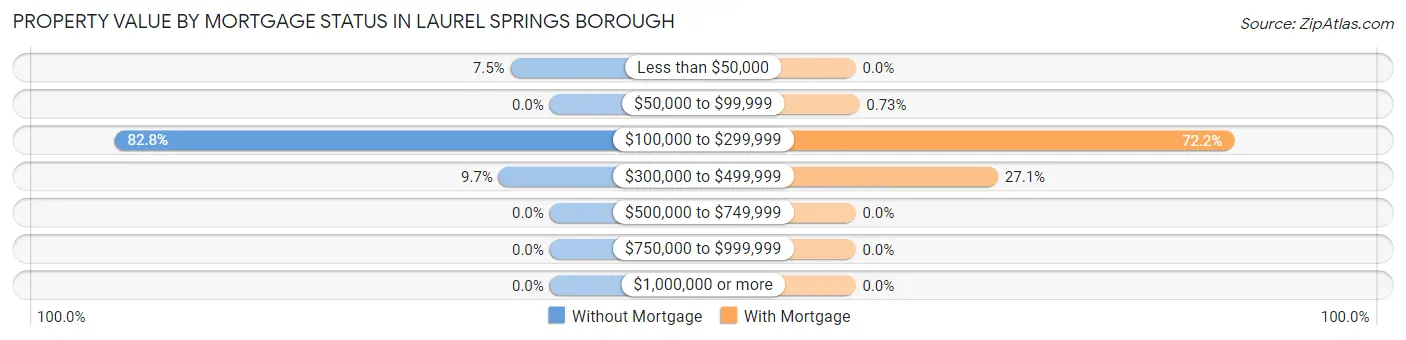
| Property Value | Without Mortgage | With Mortgage |
| Less than $50,000 | 10 (7.5%) | 0 (0.0%) |
| $50,000 to $99,999 | 0 (0.0%) | 3 (0.7%) |
| $100,000 to $299,999 | 111 (82.8%) | 298 (72.2%) |
| $300,000 to $499,999 | 13 (9.7%) | 112 (27.1%) |
| $500,000 to $749,999 | 0 (0.0%) | 0 (0.0%) |
| $750,000 to $999,999 | 0 (0.0%) | 0 (0.0%) |
| $1,000,000 or more | 0 (0.0%) | 0 (0.0%) |
| Total | 134 (100.0%) | 413 (100.0%) |
Household Income by Mortgage Status in Laurel Springs borough
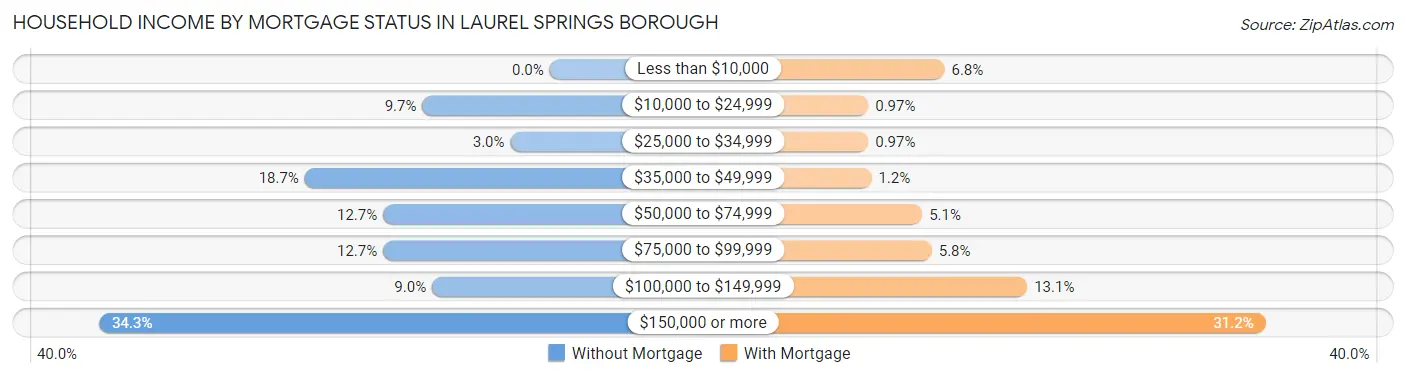
| Household Income | Without Mortgage | With Mortgage |
| Less than $10,000 | 0 (0.0%) | 28 (6.8%) |
| $10,000 to $24,999 | 13 (9.7%) | 4 (1.0%) |
| $25,000 to $34,999 | 4 (3.0%) | 4 (1.0%) |
| $35,000 to $49,999 | 25 (18.7%) | 5 (1.2%) |
| $50,000 to $74,999 | 17 (12.7%) | 21 (5.1%) |
| $75,000 to $99,999 | 17 (12.7%) | 24 (5.8%) |
| $100,000 to $149,999 | 12 (9.0%) | 54 (13.1%) |
| $150,000 or more | 46 (34.3%) | 129 (31.2%) |
| Total | 134 (100.0%) | 413 (100.0%) |
Property Value to Household Income Ratio in Laurel Springs borough
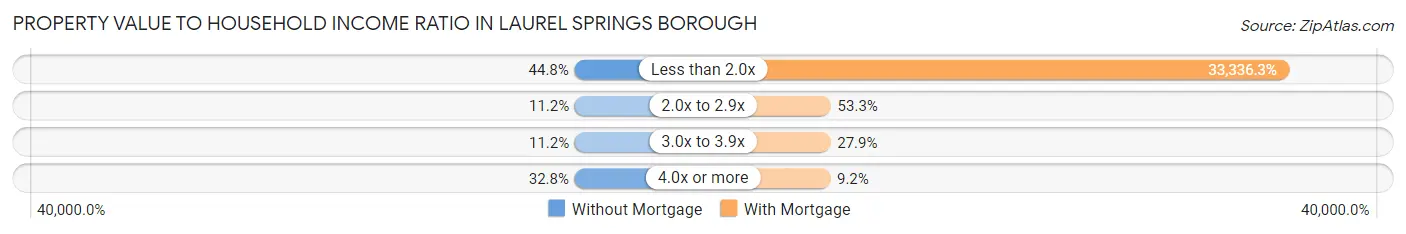
| Value-to-Income Ratio | Without Mortgage | With Mortgage |
| Less than 2.0x | 60 (44.8%) | 137,679 (33,336.3%) |
| 2.0x to 2.9x | 15 (11.2%) | 220 (53.3%) |
| 3.0x to 3.9x | 15 (11.2%) | 115 (27.9%) |
| 4.0x or more | 44 (32.8%) | 38 (9.2%) |
| Total | 134 (100.0%) | 413 (100.0%) |
Real Estate Taxes by Mortgage Status in Laurel Springs borough
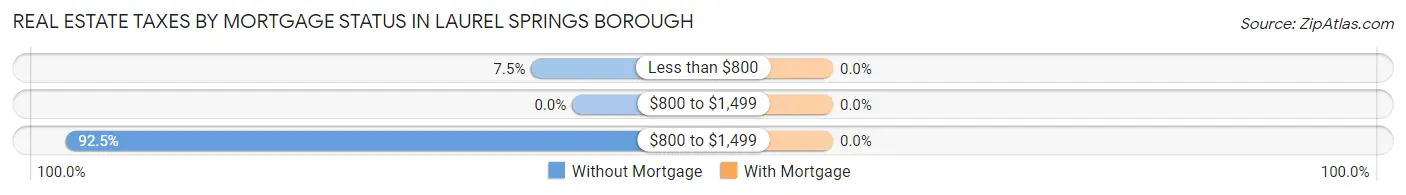
| Property Taxes | Without Mortgage | With Mortgage |
| Less than $800 | 10 (7.5%) | 0 (0.0%) |
| $800 to $1,499 | 0 (0.0%) | 0 (0.0%) |
| $800 to $1,499 | 124 (92.5%) | 0 (0.0%) |
| Total | 134 (100.0%) | 413 (100.0%) |
Health & Disability in Laurel Springs borough
Health Insurance Coverage by Age in Laurel Springs borough
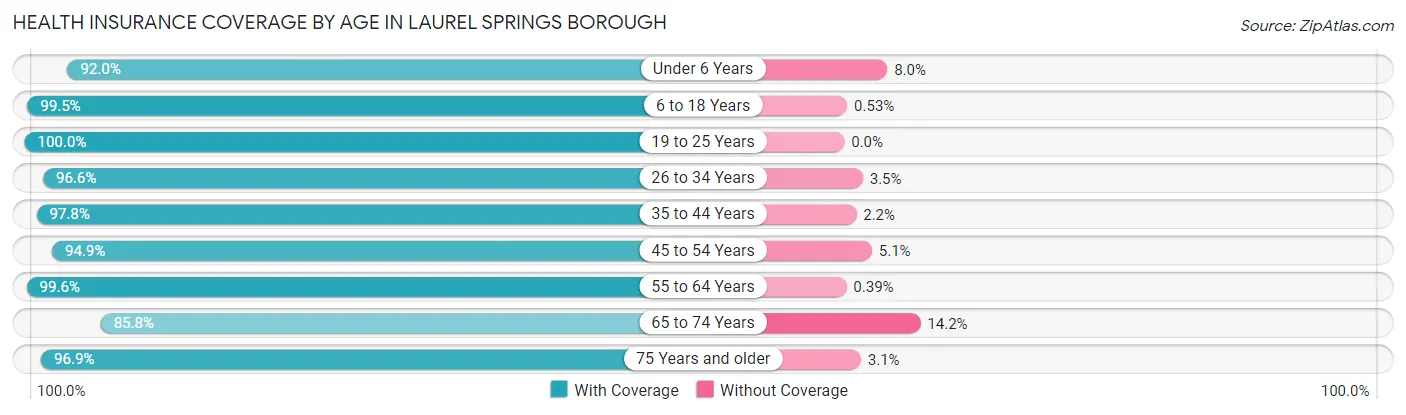
| Age Bracket | With Coverage | Without Coverage |
| Under 6 Years | 115 (92.0%) | 10 (8.0%) |
| 6 to 18 Years | 372 (99.5%) | 2 (0.5%) |
| 19 to 25 Years | 242 (100.0%) | 0 (0.0%) |
| 26 to 34 Years | 224 (96.6%) | 8 (3.5%) |
| 35 to 44 Years | 175 (97.8%) | 4 (2.2%) |
| 45 to 54 Years | 314 (94.9%) | 17 (5.1%) |
| 55 to 64 Years | 256 (99.6%) | 1 (0.4%) |
| 65 to 74 Years | 139 (85.8%) | 23 (14.2%) |
| 75 Years and older | 94 (96.9%) | 3 (3.1%) |
| Total | 1,931 (96.6%) | 68 (3.4%) |
Health Insurance Coverage by Citizenship Status in Laurel Springs borough
| Citizenship Status | With Coverage | Without Coverage |
| Native Born | 115 (92.0%) | 10 (8.0%) |
| Foreign Born, Citizen | 372 (99.5%) | 2 (0.5%) |
| Foreign Born, not a Citizen | 242 (100.0%) | 0 (0.0%) |
Health Insurance Coverage by Household Income in Laurel Springs borough
| Household Income | With Coverage | Without Coverage |
| Under $25,000 | 62 (93.9%) | 4 (6.1%) |
| $25,000 to $49,999 | 182 (96.8%) | 6 (3.2%) |
| $50,000 to $74,999 | 105 (100.0%) | 0 (0.0%) |
| $75,000 to $99,999 | 208 (98.1%) | 4 (1.9%) |
| $100,000 and over | 1,374 (96.2%) | 54 (3.8%) |
Public vs Private Health Insurance Coverage by Age in Laurel Springs borough
| Age Bracket | Public Insurance | Private Insurance |
| Under 6 | 8 (6.4%) | 112 (89.6%) |
| 6 to 18 Years | 114 (30.5%) | 311 (83.2%) |
| 19 to 25 Years | 18 (7.4%) | 225 (93.0%) |
| 25 to 34 Years | 46 (19.8%) | 206 (88.8%) |
| 35 to 44 Years | 23 (12.9%) | 160 (89.4%) |
| 45 to 54 Years | 66 (19.9%) | 265 (80.1%) |
| 55 to 64 Years | 39 (15.2%) | 237 (92.2%) |
| 65 to 74 Years | 134 (82.7%) | 86 (53.1%) |
| 75 Years and over | 89 (91.7%) | 43 (44.3%) |
| Total | 537 (26.9%) | 1,645 (82.3%) |
Disability Status by Sex by Age in Laurel Springs borough
| Age Bracket | Male | Female |
| Under 5 Years | 18 (34.6%) | 0 (0.0%) |
| 5 to 17 Years | 14 (7.2%) | 0 (0.0%) |
| 18 to 34 Years | 43 (17.4%) | 4 (1.6%) |
| 35 to 64 Years | 31 (8.6%) | 37 (9.1%) |
| 65 to 74 Years | 11 (13.6%) | 29 (35.8%) |
| 75 Years and over | 20 (46.5%) | 26 (48.1%) |
Disability Class by Sex by Age in Laurel Springs borough
Disability Class: Hearing Difficulty
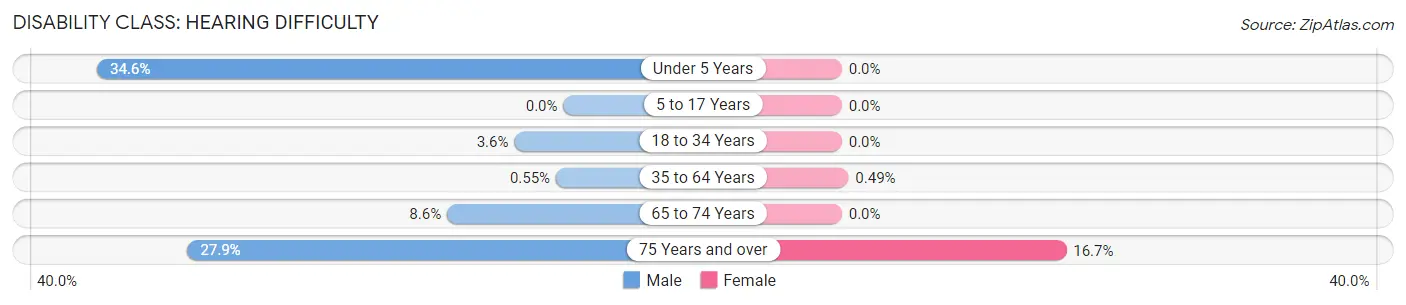
| Age Bracket | Male | Female |
| Under 5 Years | 18 (34.6%) | 0 (0.0%) |
| 5 to 17 Years | 0 (0.0%) | 0 (0.0%) |
| 18 to 34 Years | 9 (3.6%) | 0 (0.0%) |
| 35 to 64 Years | 2 (0.5%) | 2 (0.5%) |
| 65 to 74 Years | 7 (8.6%) | 0 (0.0%) |
| 75 Years and over | 12 (27.9%) | 9 (16.7%) |
Disability Class: Vision Difficulty
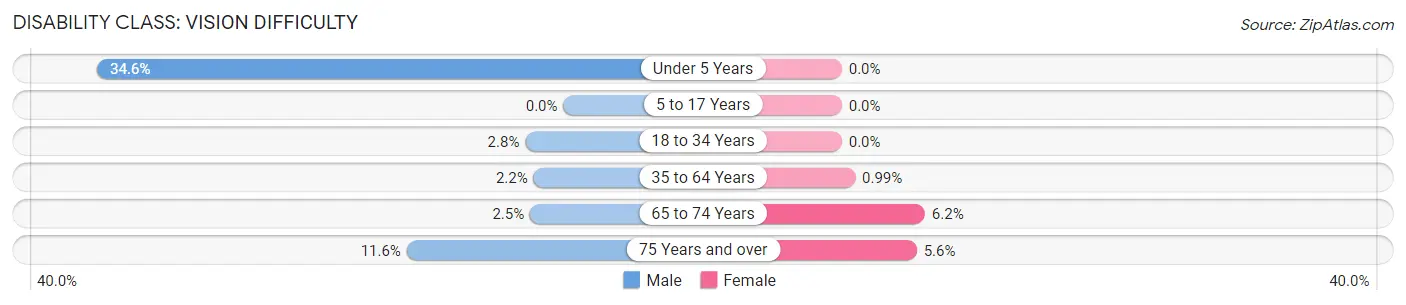
| Age Bracket | Male | Female |
| Under 5 Years | 18 (34.6%) | 0 (0.0%) |
| 5 to 17 Years | 0 (0.0%) | 0 (0.0%) |
| 18 to 34 Years | 7 (2.8%) | 0 (0.0%) |
| 35 to 64 Years | 8 (2.2%) | 4 (1.0%) |
| 65 to 74 Years | 2 (2.5%) | 5 (6.2%) |
| 75 Years and over | 5 (11.6%) | 3 (5.6%) |
Disability Class: Cognitive Difficulty
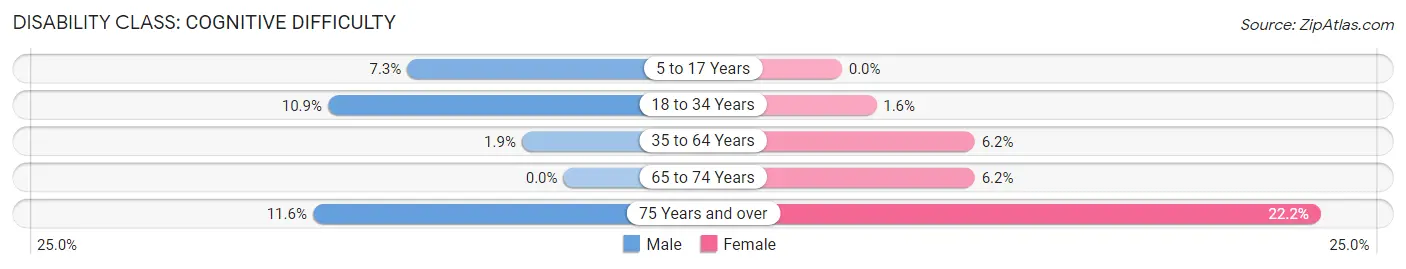
| Age Bracket | Male | Female |
| 5 to 17 Years | 14 (7.2%) | 0 (0.0%) |
| 18 to 34 Years | 27 (10.9%) | 4 (1.6%) |
| 35 to 64 Years | 7 (1.9%) | 25 (6.2%) |
| 65 to 74 Years | 0 (0.0%) | 5 (6.2%) |
| 75 Years and over | 5 (11.6%) | 12 (22.2%) |
Disability Class: Ambulatory Difficulty
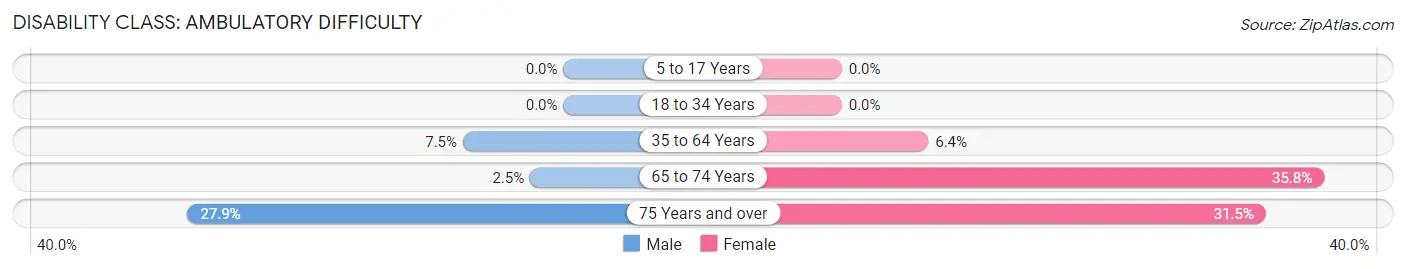
| Age Bracket | Male | Female |
| 5 to 17 Years | 0 (0.0%) | 0 (0.0%) |
| 18 to 34 Years | 0 (0.0%) | 0 (0.0%) |
| 35 to 64 Years | 27 (7.5%) | 26 (6.4%) |
| 65 to 74 Years | 2 (2.5%) | 29 (35.8%) |
| 75 Years and over | 12 (27.9%) | 17 (31.5%) |
Disability Class: Self-Care Difficulty
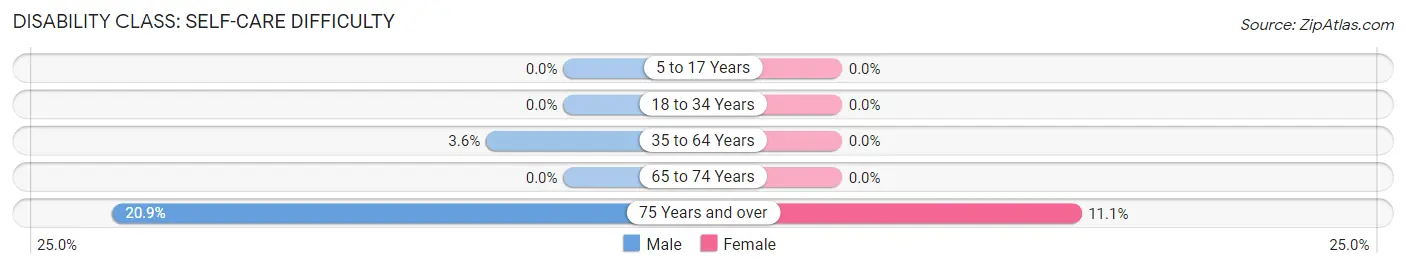
| Age Bracket | Male | Female |
| 5 to 17 Years | 0 (0.0%) | 0 (0.0%) |
| 18 to 34 Years | 0 (0.0%) | 0 (0.0%) |
| 35 to 64 Years | 13 (3.6%) | 0 (0.0%) |
| 65 to 74 Years | 0 (0.0%) | 0 (0.0%) |
| 75 Years and over | 9 (20.9%) | 6 (11.1%) |
Technology Access in Laurel Springs borough
Computing Device Access in Laurel Springs borough
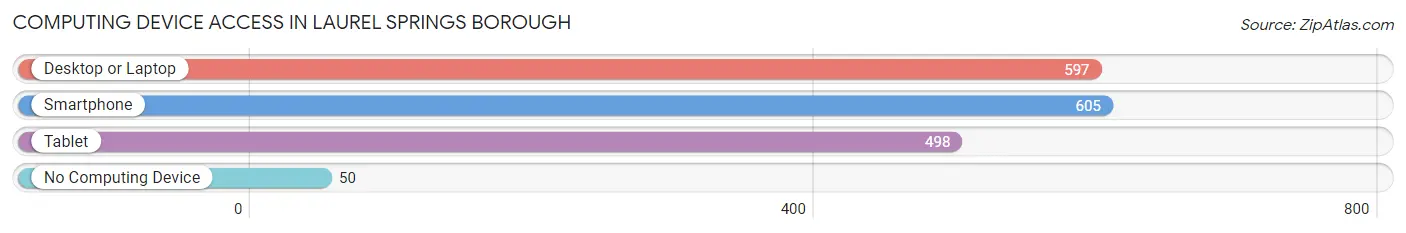
| Device Type | # Households | % Households |
| Desktop or Laptop | 597 | 87.8% |
| Smartphone | 605 | 89.0% |
| Tablet | 498 | 73.2% |
| No Computing Device | 50 | 7.3% |
| Total | 680 | 100.0% |
Internet Access in Laurel Springs borough
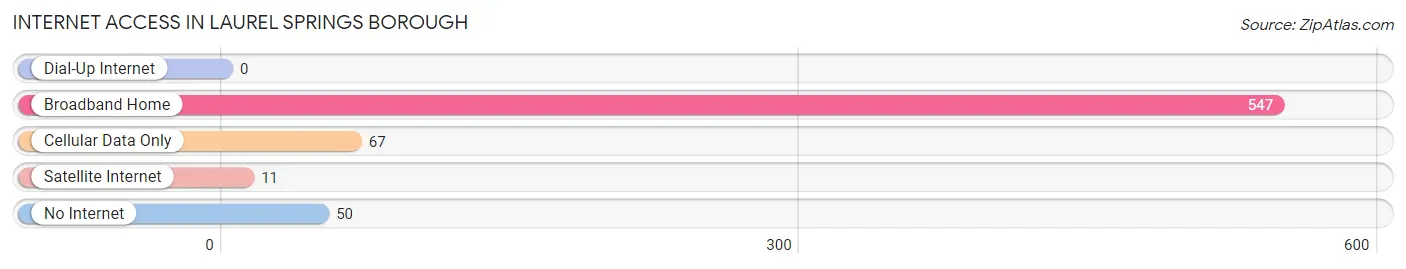
| Internet Type | # Households | % Households |
| Dial-Up Internet | 0 | 0.0% |
| Broadband Home | 547 | 80.4% |
| Cellular Data Only | 67 | 9.9% |
| Satellite Internet | 11 | 1.6% |
| No Internet | 50 | 7.3% |
| Total | 680 | 100.0% |
Laurel Springs borough Summary
Laurel Springs Borough is a small borough located in Camden County, New Jersey. It is situated in the southeastern part of the state, just north of Philadelphia. The borough is bordered by Lindenwold, Stratford, and Berlin Township. As of the 2010 United States Census, the borough had a total population of 2,845.
History
The area that is now Laurel Springs Borough was originally inhabited by the Lenni Lenape Native Americans. The first European settlers arrived in the area in the late 1600s. The area was part of Gloucester County until 1844, when it became part of Camden County.
The area was originally known as “Laurel Hill” and was home to a number of farms. In 1891, the area was incorporated as the Borough of Laurel Springs. The name was chosen to honor the many laurel trees that grew in the area.
Geography
Laurel Springs Borough is located at 39°48'25" North, 75°2'45" West (39.8069, -75.0459). It is situated in the southeastern part of the state, just north of Philadelphia. The borough is bordered by Lindenwold, Stratford, and Berlin Township.
According to the United States Census Bureau, the borough has a total area of 0.9 square miles (2.3 km2), all of which is land.
Economy
The economy of Laurel Springs Borough is largely based on retail and services. The borough is home to a number of small businesses, including restaurants, convenience stores, and auto repair shops. The borough also has a number of industrial and manufacturing businesses.
Demographics
As of the 2010 United States Census, there were 2,845 people, 1,093 households, and 745 families residing in the borough. The population density was 3,093.3 people per square mile (1,192.2/km2). There were 1,164 housing units at an average density of 1,269.2 per square mile (489.3/km2). The racial makeup of the borough was 79.2% White, 13.2% African American, 0.2% Native American, 2.2% Asian, 0.1% Pacific Islander, 3.2% from other races, and 2.1% from two or more races. Hispanic or Latino of any race were 8.2% of the population.
There were 1,093 households, out of which 28.3% had children under the age of 18 living with them, 48.2% were married couples living together, 13.7% had a female householder with no husband present, and 32.2% were non-families. 26.2% of all households were made up of individuals, and 10.2% had someone living alone who was 65 years of age or older. The average household size was 2.60 and the average family size was 3.17.
In the borough, the population was spread out, with 22.7% under the age of 18, 8.2% from 18 to 24, 28.2% from 25 to 44, 27.2% from 45 to 64, and 13.7% who were 65 years of age or older. The median age was 38.7 years. For every 100 females, there were 94.2 males. For every 100 females age 18 and over, there were 91.2 males.
The median income for a household in the borough was $54,917, and the median income for a family was $63,750. Males had a median income of $45,000 versus $35,000 for females. The per capita income for the borough was $25,945. About 4.2% of families and 5.7% of the population were below the poverty line, including 6.3% of those under age 18 and 6.2% of those age 65 or over.
Common Questions
What is Per Capita Income in Laurel Springs borough?
Per Capita income in Laurel Springs borough is $42,094.
What is the Median Family Income in Laurel Springs borough?
Median Family Income in Laurel Springs borough is $140,179.
What is the Median Household income in Laurel Springs borough?
Median Household Income in Laurel Springs borough is $113,500.
What is Income or Wage Gap in Laurel Springs borough?
Income or Wage Gap in Laurel Springs borough is 15.1%.
Women in Laurel Springs borough earn 84.9 cents for every dollar earned by a man.
What is Inequality or Gini Index in Laurel Springs borough?
Inequality or Gini Index in Laurel Springs borough is 0.39.
What is the Total Population of Laurel Springs borough?
Total Population of Laurel Springs borough is 2,004.
What is the Total Male Population of Laurel Springs borough?
Total Male Population of Laurel Springs borough is 983.
What is the Total Female Population of Laurel Springs borough?
Total Female Population of Laurel Springs borough is 1,021.
What is the Ratio of Males per 100 Females in Laurel Springs borough?
There are 96.28 Males per 100 Females in Laurel Springs borough.
What is the Ratio of Females per 100 Males in Laurel Springs borough?
There are 103.87 Females per 100 Males in Laurel Springs borough.
What is the Median Population Age in Laurel Springs borough?
Median Population Age in Laurel Springs borough is 35.8 Years.
What is the Average Family Size in Laurel Springs borough
Average Family Size in Laurel Springs borough is 3.7 People.
What is the Average Household Size in Laurel Springs borough
Average Household Size in Laurel Springs borough is 3.0 People.
How Large is the Labor Force in Laurel Springs borough?
There are 1,111 People in the Labor Forcein in Laurel Springs borough.
What is the Percentage of People in the Labor Force in Laurel Springs borough?
68.2% of People are in the Labor Force in Laurel Springs borough.
What is the Unemployment Rate in Laurel Springs borough?
Unemployment Rate in Laurel Springs borough is 4.5%.