Montvale borough, NJ Map & Demographics
Montvale borough Overview
$74,722
PER CAPITA INCOME
$186,493
AVG FAMILY INCOME
$175,179
AVG HOUSEHOLD INCOME
57.0%
WAGE / INCOME GAP [ % ]
43.0¢/ $1
WAGE / INCOME GAP [ $ ]
0.43
INEQUALITY / GINI INDEX
8,413
TOTAL POPULATION
4,025
MALE POPULATION
4,388
FEMALE POPULATION
91.73
MALES / 100 FEMALES
109.02
FEMALES / 100 MALES
43.4
MEDIAN AGE
3.0
AVG FAMILY SIZE
2.7
AVG HOUSEHOLD SIZE
4,339
LABOR FORCE [ PEOPLE ]
63.0%
PERCENT IN LABOR FORCE
2.9%
UNEMPLOYMENT RATE
Income in Montvale borough
Income Overview in Montvale borough
Per Capita Income in Montvale borough is $74,722, while median incomes of families and households are $186,493 and $175,179 respectively.
| Characteristic | Number | Measure |
| Per Capita Income | 8,413 | $74,722 |
| Median Family Income | 2,493 | $186,493 |
| Mean Family Income | 2,493 | $221,665 |
| Median Household Income | 3,066 | $175,179 |
| Mean Household Income | 3,066 | $202,387 |
| Income Deficit | 2,493 | $0 |
| Wage / Income Gap (%) | 8,413 | 56.98% |
| Wage / Income Gap ($) | 8,413 | 43.02¢ per $1 |
| Gini / Inequality Index | 8,413 | 0.43 |
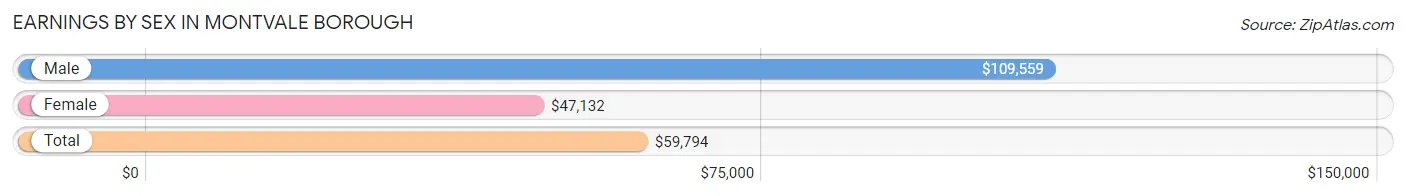
Earnings by Sex in Montvale borough
Average Earnings in Montvale borough are $59,794, $109,559 for men and $47,132 for women, a difference of 57.0%.
| Sex | Number | Average Earnings |
| Male | 2,564 (50.8%) | $109,559 |
| Female | 2,487 (49.2%) | $47,132 |
| Total | 5,051 (100.0%) | $59,794 |
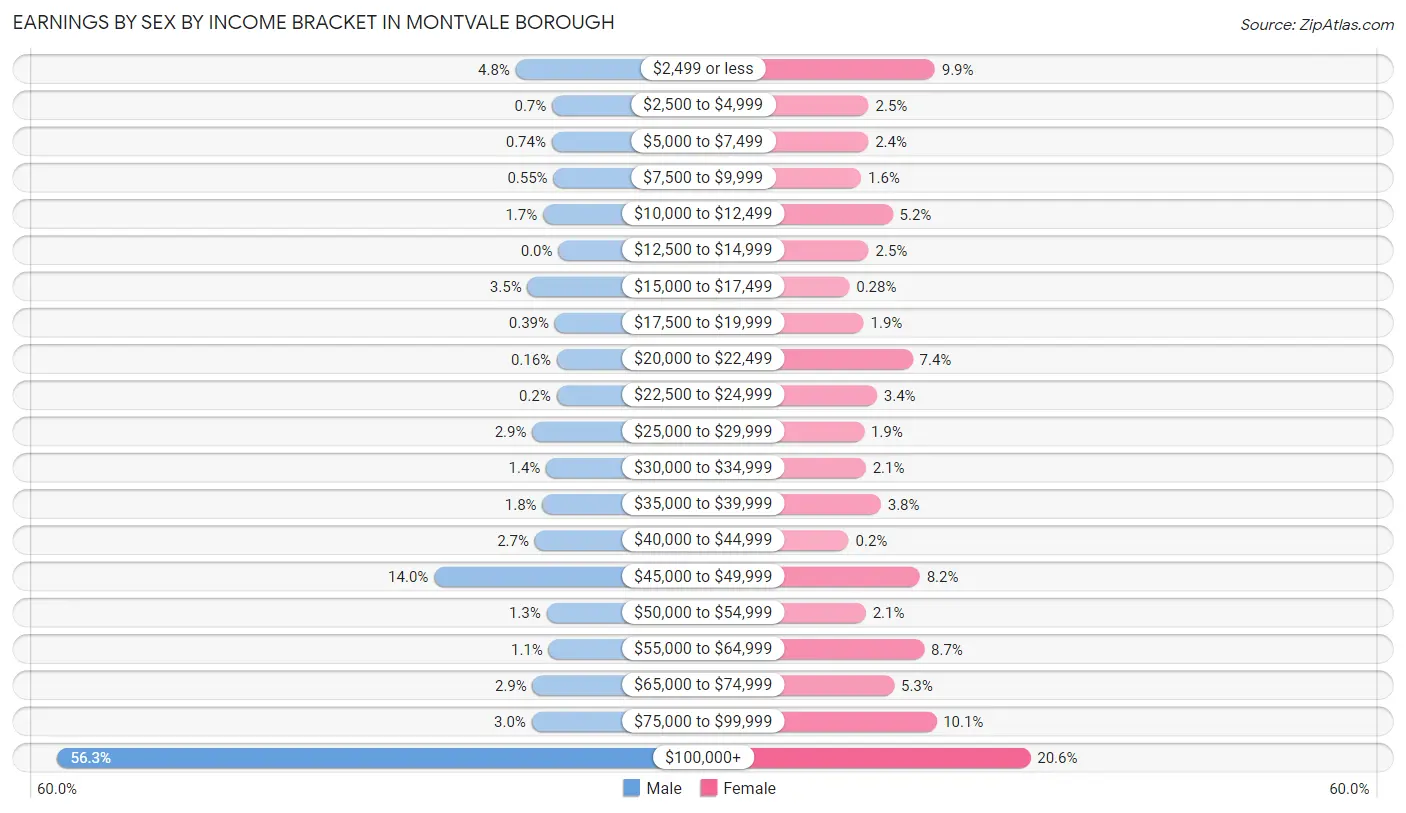
Earnings by Sex by Income Bracket in Montvale borough
The most common earnings brackets in Montvale borough are $100,000+ for men (1,443 | 56.3%) and $100,000+ for women (513 | 20.6%).
| Income | Male | Female |
| $2,499 or less | 123 (4.8%) | 246 (9.9%) |
| $2,500 to $4,999 | 18 (0.7%) | 61 (2.5%) |
| $5,000 to $7,499 | 19 (0.7%) | 60 (2.4%) |
| $7,500 to $9,999 | 14 (0.5%) | 40 (1.6%) |
| $10,000 to $12,499 | 44 (1.7%) | 128 (5.1%) |
| $12,500 to $14,999 | 0 (0.0%) | 61 (2.5%) |
| $15,000 to $17,499 | 89 (3.5%) | 7 (0.3%) |
| $17,500 to $19,999 | 10 (0.4%) | 47 (1.9%) |
| $20,000 to $22,499 | 4 (0.2%) | 184 (7.4%) |
| $22,500 to $24,999 | 5 (0.2%) | 84 (3.4%) |
| $25,000 to $29,999 | 75 (2.9%) | 48 (1.9%) |
| $30,000 to $34,999 | 35 (1.4%) | 53 (2.1%) |
| $35,000 to $39,999 | 46 (1.8%) | 95 (3.8%) |
| $40,000 to $44,999 | 68 (2.6%) | 5 (0.2%) |
| $45,000 to $49,999 | 358 (14.0%) | 204 (8.2%) |
| $50,000 to $54,999 | 34 (1.3%) | 53 (2.1%) |
| $55,000 to $64,999 | 28 (1.1%) | 216 (8.7%) |
| $65,000 to $74,999 | 74 (2.9%) | 132 (5.3%) |
| $75,000 to $99,999 | 77 (3.0%) | 250 (10.1%) |
| $100,000+ | 1,443 (56.3%) | 513 (20.6%) |
| Total | 2,564 (100.0%) | 2,487 (100.0%) |
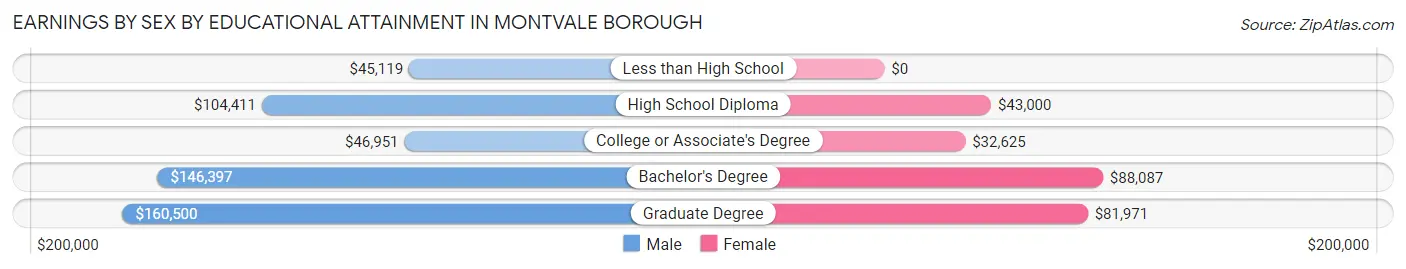
Earnings by Sex by Educational Attainment in Montvale borough
Average earnings in Montvale borough are $119,766 for men and $57,044 for women, a difference of 52.4%. Men with an educational attainment of graduate degree enjoy the highest average annual earnings of $160,500, while those with less than high school education earn the least with $45,119. Women with an educational attainment of bachelor's degree earn the most with the average annual earnings of $88,087, while those with college or associate's degree education have the smallest earnings of $32,625.
| Educational Attainment | Male Income | Female Income |
| Less than High School | $45,119 | $0 |
| High School Diploma | $104,411 | $43,000 |
| College or Associate's Degree | $46,951 | $32,625 |
| Bachelor's Degree | $146,397 | $88,087 |
| Graduate Degree | $160,500 | $81,971 |
| Total | $119,766 | $57,044 |
Family Income in Montvale borough
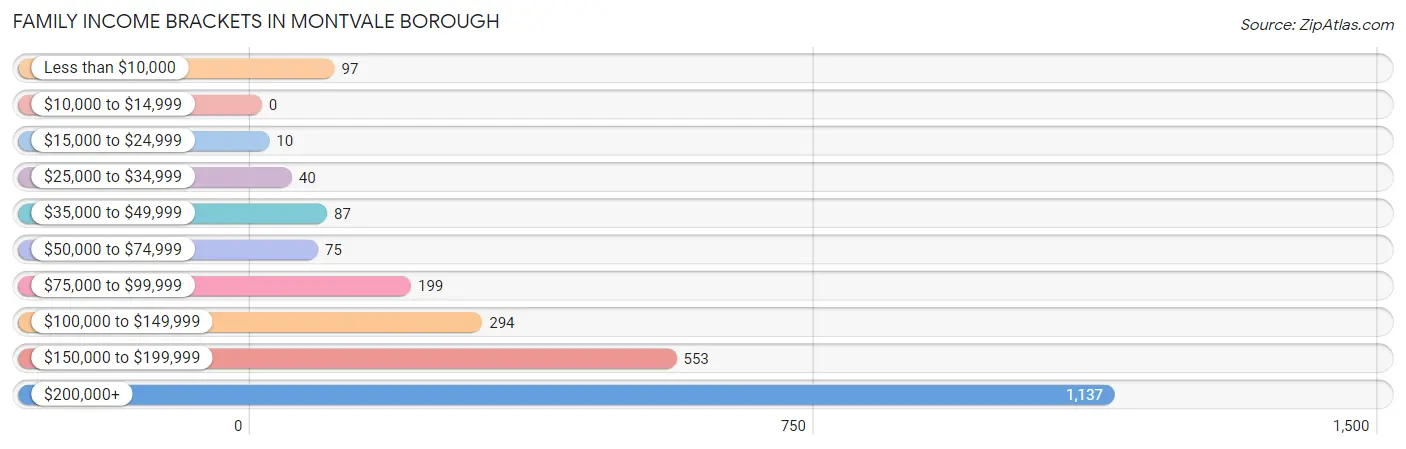
Family Income Brackets in Montvale borough
According to the Montvale borough family income data, there are 1,137 families falling into the $200,000+ income range, which is the most common income bracket and makes up 45.6% of all families.
| Income Bracket | # Families | % Families |
| Less than $10,000 | 97 | 3.9% |
| $10,000 to $14,999 | 0 | 0.0% |
| $15,000 to $24,999 | 10 | 0.4% |
| $25,000 to $34,999 | 40 | 1.6% |
| $35,000 to $49,999 | 87 | 3.5% |
| $50,000 to $74,999 | 75 | 3.0% |
| $75,000 to $99,999 | 199 | 8.0% |
| $100,000 to $149,999 | 294 | 11.8% |
| $150,000 to $199,999 | 553 | 22.2% |
| $200,000+ | 1,137 | 45.6% |
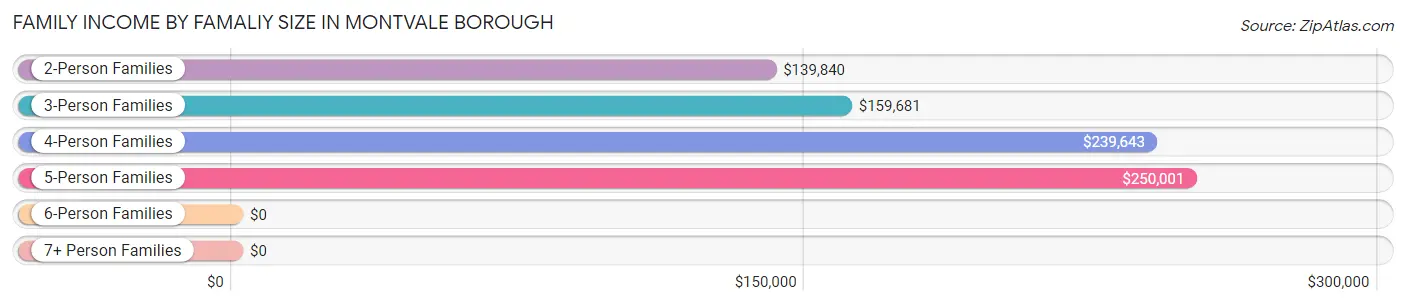
Family Income by Famaliy Size in Montvale borough
5-person families (282 | 11.3%) account for the highest median family income in Montvale borough with $250,001 per family, while 2-person families (1,175 | 47.1%) have the highest median income of $69,920 per family member.
| Income Bracket | # Families | Median Income |
| 2-Person Families | 1,175 (47.1%) | $139,840 |
| 3-Person Families | 622 (24.9%) | $159,681 |
| 4-Person Families | 390 (15.6%) | $239,643 |
| 5-Person Families | 282 (11.3%) | $250,001 |
| 6-Person Families | 24 (1.0%) | $0 |
| 7+ Person Families | 0 (0.0%) | $0 |
| Total | 2,493 (100.0%) | $186,493 |
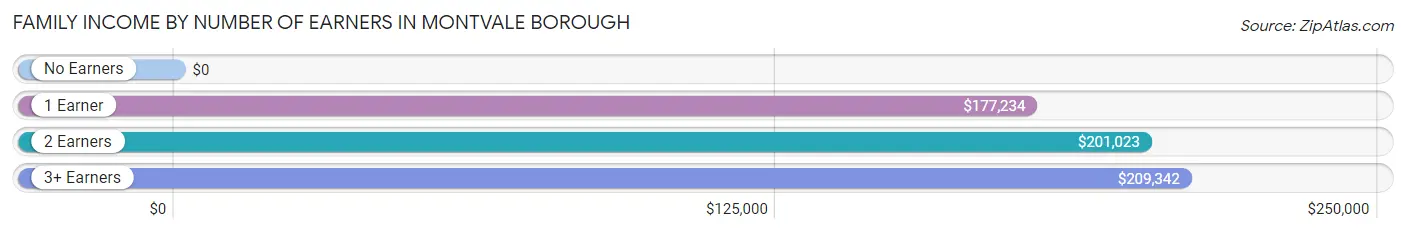
Family Income by Number of Earners in Montvale borough
| Number of Earners | # Families | Median Income |
| No Earners | 281 (11.3%) | $0 |
| 1 Earner | 622 (24.9%) | $177,234 |
| 2 Earners | 1,086 (43.6%) | $201,023 |
| 3+ Earners | 504 (20.2%) | $209,342 |
| Total | 2,493 (100.0%) | $186,493 |
Household Income in Montvale borough
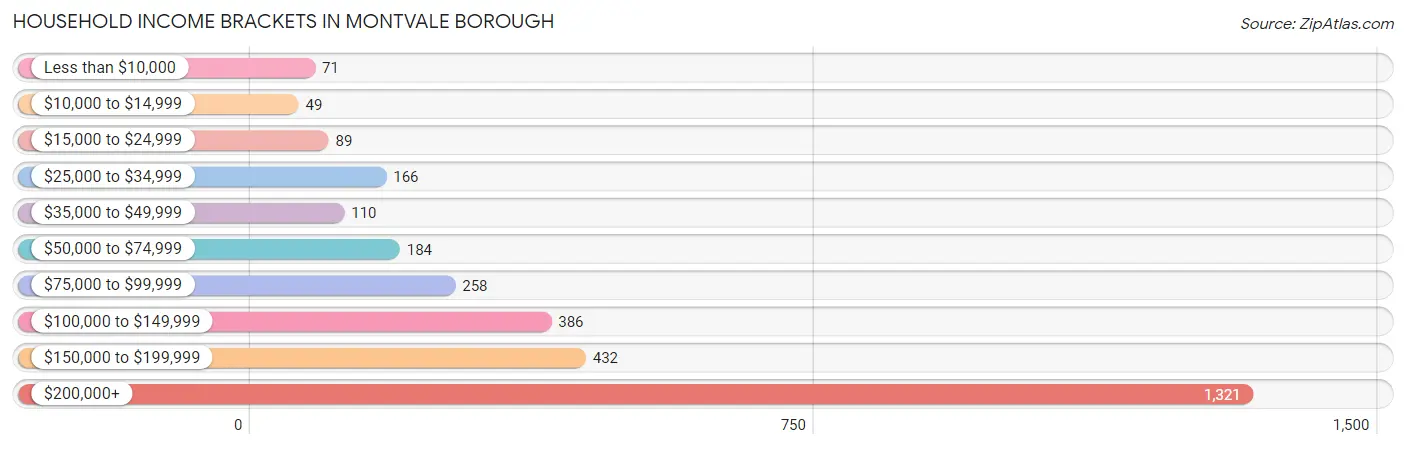
Household Income Brackets in Montvale borough
With 1,321 households falling in the category, the $200,000+ income range is the most frequent in Montvale borough, accounting for 43.1% of all households. In contrast, only 49 households (1.6%) fall into the $10,000 to $14,999 income bracket, making it the least populous group.
| Income Bracket | # Households | % Households |
| Less than $10,000 | 71 | 2.3% |
| $10,000 to $14,999 | 49 | 1.6% |
| $15,000 to $24,999 | 89 | 2.9% |
| $25,000 to $34,999 | 166 | 5.4% |
| $35,000 to $49,999 | 110 | 3.6% |
| $50,000 to $74,999 | 184 | 6.0% |
| $75,000 to $99,999 | 258 | 8.4% |
| $100,000 to $149,999 | 386 | 12.6% |
| $150,000 to $199,999 | 432 | 14.1% |
| $200,000+ | 1,321 | 43.1% |
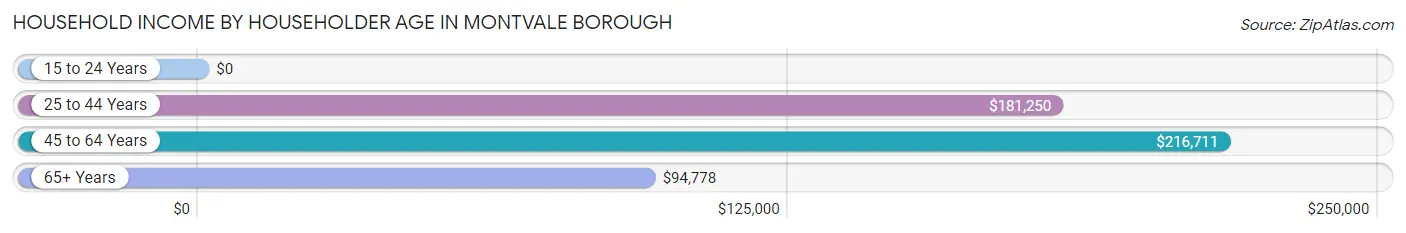
Household Income by Householder Age in Montvale borough
The median household income in Montvale borough is $175,179, with the highest median household income of $216,711 found in the 45 to 64 years age bracket for the primary householder. A total of 1,098 households (35.8%) fall into this category. Meanwhile, the 15 to 24 years age bracket for the primary householder has the lowest median household income of $0, with 5 households (0.2%) in this group.
| Income Bracket | # Households | Median Income |
| 15 to 24 Years | 5 (0.2%) | $0 |
| 25 to 44 Years | 941 (30.7%) | $181,250 |
| 45 to 64 Years | 1,098 (35.8%) | $216,711 |
| 65+ Years | 1,022 (33.3%) | $94,778 |
| Total | 3,066 (100.0%) | $175,179 |
Poverty in Montvale borough
Income Below Poverty by Sex and Age in Montvale borough
With 3.6% poverty level for males and 3.3% for females among the residents of Montvale borough, 12 to 14 year old males and 75 year old and over females are the most vulnerable to poverty, with 40 males (23.8%) and 60 females (10.3%) in their respective age groups living below the poverty level.
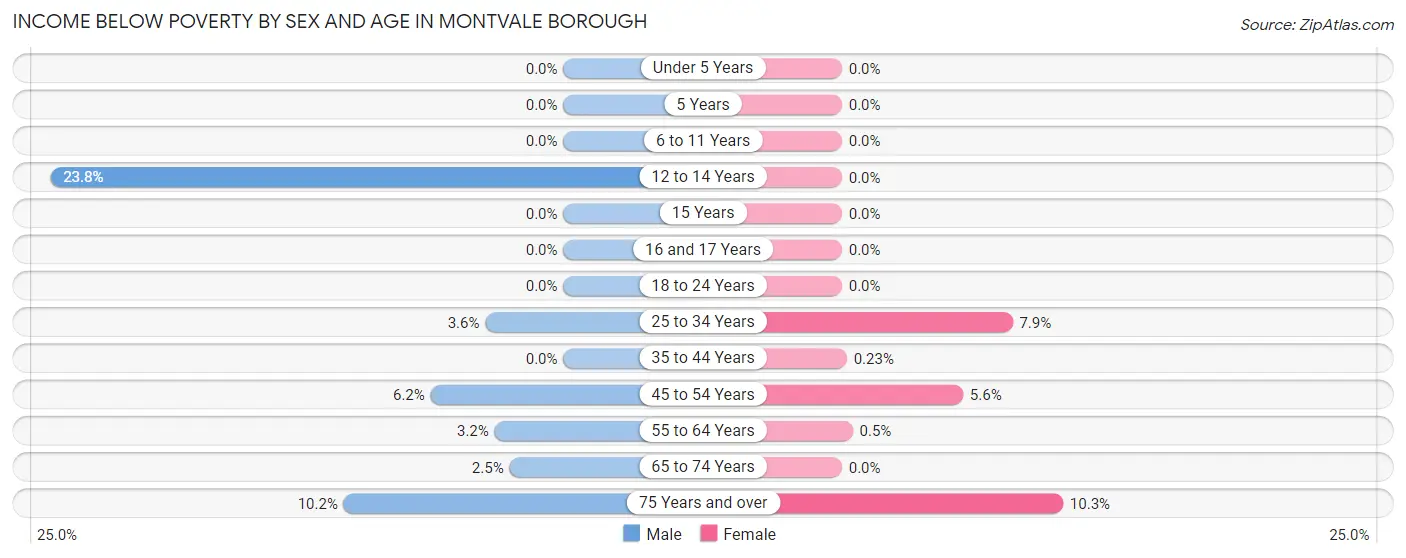
| Age Bracket | Male | Female |
| Under 5 Years | 0 (0.0%) | 0 (0.0%) |
| 5 Years | 0 (0.0%) | 0 (0.0%) |
| 6 to 11 Years | 0 (0.0%) | 0 (0.0%) |
| 12 to 14 Years | 40 (23.8%) | 0 (0.0%) |
| 15 Years | 0 (0.0%) | 0 (0.0%) |
| 16 and 17 Years | 0 (0.0%) | 0 (0.0%) |
| 18 to 24 Years | 0 (0.0%) | 0 (0.0%) |
| 25 to 34 Years | 8 (3.6%) | 40 (7.9%) |
| 35 to 44 Years | 0 (0.0%) | 1 (0.2%) |
| 45 to 54 Years | 45 (6.2%) | 43 (5.6%) |
| 55 to 64 Years | 13 (3.2%) | 2 (0.5%) |
| 65 to 74 Years | 11 (2.5%) | 0 (0.0%) |
| 75 Years and over | 27 (10.2%) | 60 (10.3%) |
| Total | 144 (3.6%) | 146 (3.3%) |
Income Above Poverty by Sex and Age in Montvale borough
According to the poverty statistics in Montvale borough, males aged under 5 years and females aged under 5 years are the age groups that are most secure financially, with 100.0% of males and 100.0% of females in these age groups living above the poverty line.
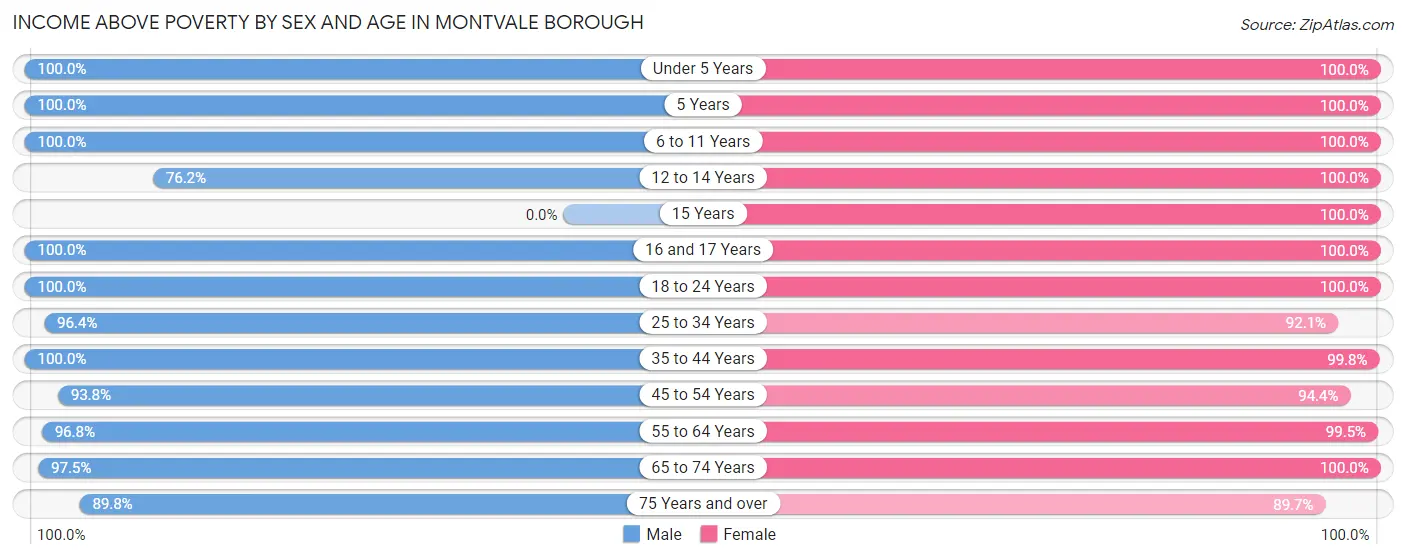
| Age Bracket | Male | Female |
| Under 5 Years | 153 (100.0%) | 145 (100.0%) |
| 5 Years | 65 (100.0%) | 74 (100.0%) |
| 6 to 11 Years | 416 (100.0%) | 290 (100.0%) |
| 12 to 14 Years | 128 (76.2%) | 99 (100.0%) |
| 15 Years | 0 (0.0%) | 115 (100.0%) |
| 16 and 17 Years | 58 (100.0%) | 153 (100.0%) |
| 18 to 24 Years | 260 (100.0%) | 381 (100.0%) |
| 25 to 34 Years | 213 (96.4%) | 465 (92.1%) |
| 35 to 44 Years | 842 (100.0%) | 427 (99.8%) |
| 45 to 54 Years | 685 (93.8%) | 722 (94.4%) |
| 55 to 64 Years | 394 (96.8%) | 395 (99.5%) |
| 65 to 74 Years | 429 (97.5%) | 451 (100.0%) |
| 75 Years and over | 238 (89.8%) | 525 (89.7%) |
| Total | 3,881 (96.4%) | 4,242 (96.7%) |
Income Below Poverty Among Married-Couple Families in Montvale borough
The poverty statistics for married-couple families in Montvale borough show that 3.3% or 66 of the total 2,014 families live below the poverty line. Families with no children have the highest poverty rate of 5.0%, comprising of 66 families. On the other hand, families with 1 or 2 children have the lowest poverty rate of 0.0%, which includes 0 families.
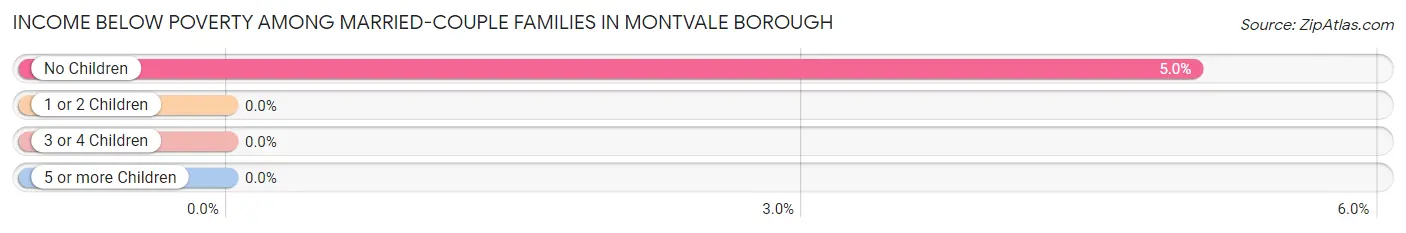
| Children | Above Poverty | Below Poverty |
| No Children | 1,243 (95.0%) | 66 (5.0%) |
| 1 or 2 Children | 579 (100.0%) | 0 (0.0%) |
| 3 or 4 Children | 126 (100.0%) | 0 (0.0%) |
| 5 or more Children | 0 (0.0%) | 0 (0.0%) |
| Total | 1,948 (96.7%) | 66 (3.3%) |
Income Below Poverty Among Single-Parent Households in Montvale borough
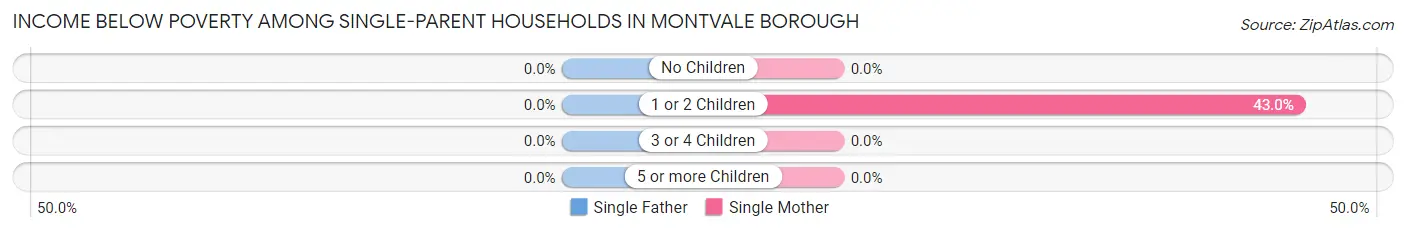
| Children | Single Father | Single Mother |
| No Children | 0 (0.0%) | 0 (0.0%) |
| 1 or 2 Children | 0 (0.0%) | 40 (43.0%) |
| 3 or 4 Children | 0 (0.0%) | 0 (0.0%) |
| 5 or more Children | 0 (0.0%) | 0 (0.0%) |
| Total | 0 (0.0%) | 40 (16.5%) |
Income Below Poverty Among Married-Couple vs Single-Parent Households in Montvale borough
The poverty data for Montvale borough shows that 66 of the married-couple family households (3.3%) and 40 of the single-parent households (8.4%) are living below the poverty level. Within the married-couple family households, those with no children have the highest poverty rate, with 66 households (5.0%) falling below the poverty line. Among the single-parent households, those with 1 or 2 children have the highest poverty rate, with 40 household (16.3%) living below poverty.
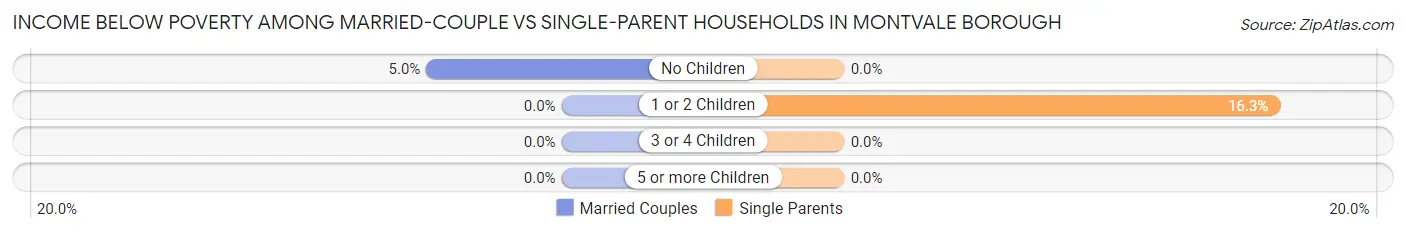
| Children | Married-Couple Families | Single-Parent Households |
| No Children | 66 (5.0%) | 0 (0.0%) |
| 1 or 2 Children | 0 (0.0%) | 40 (16.3%) |
| 3 or 4 Children | 0 (0.0%) | 0 (0.0%) |
| 5 or more Children | 0 (0.0%) | 0 (0.0%) |
| Total | 66 (3.3%) | 40 (8.4%) |
Race in Montvale borough
The most populous races in Montvale borough are White / Caucasian (6,437 | 76.5%), Asian (1,171 | 13.9%), and Hispanic or Latino (983 | 11.7%).
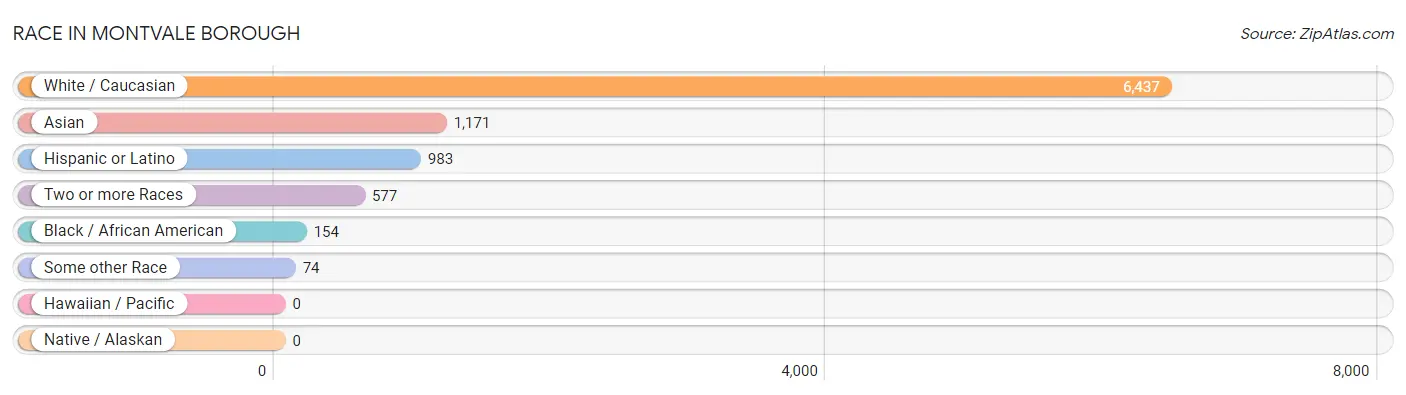
| Race | # Population | % Population |
| Asian | 1,171 | 13.9% |
| Black / African American | 154 | 1.8% |
| Hawaiian / Pacific | 0 | 0.0% |
| Hispanic or Latino | 983 | 11.7% |
| Native / Alaskan | 0 | 0.0% |
| White / Caucasian | 6,437 | 76.5% |
| Two or more Races | 577 | 6.9% |
| Some other Race | 74 | 0.9% |
| Total | 8,413 | 100.0% |
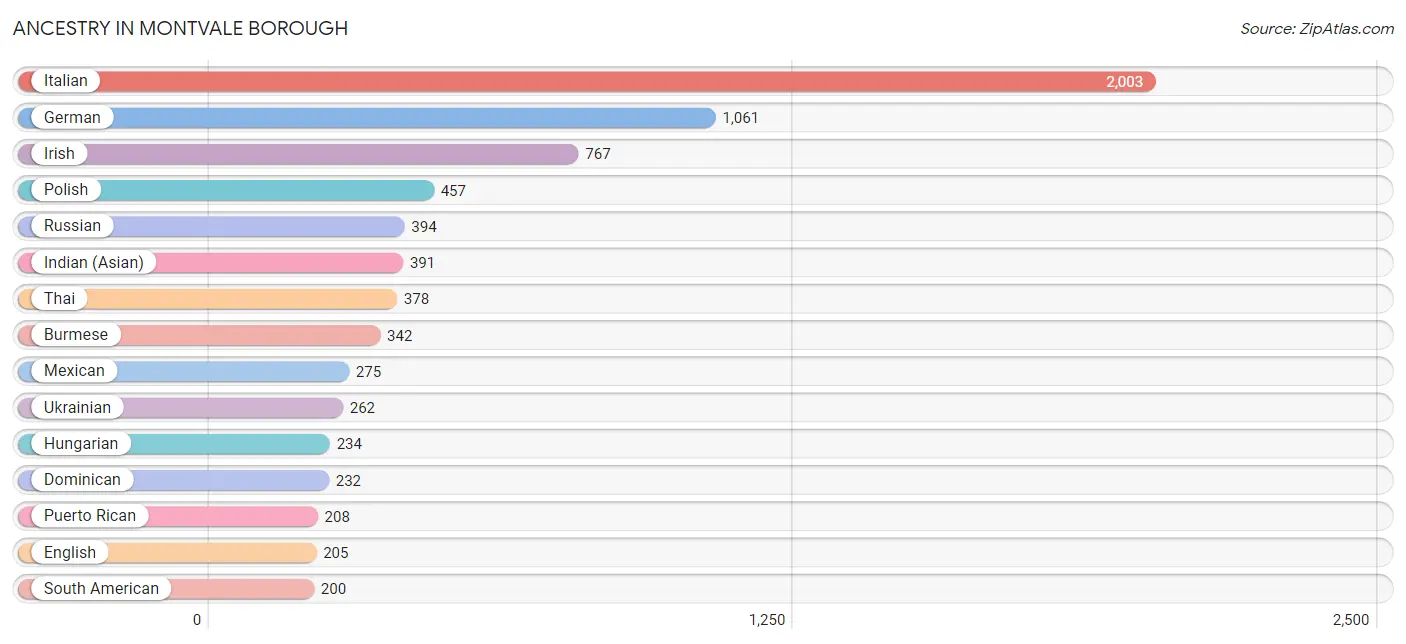
Ancestry in Montvale borough
The most populous ancestries reported in Montvale borough are Italian (2,003 | 23.8%), German (1,061 | 12.6%), Irish (767 | 9.1%), Polish (457 | 5.4%), and Russian (394 | 4.7%), together accounting for 55.6% of all Montvale borough residents.
| Ancestry | # Population | % Population |
| African | 82 | 1.0% |
| American | 145 | 1.7% |
| Arab | 132 | 1.6% |
| Armenian | 79 | 0.9% |
| Australian | 59 | 0.7% |
| Austrian | 60 | 0.7% |
| Belizean | 73 | 0.9% |
| Bhutanese | 71 | 0.8% |
| Brazilian | 15 | 0.2% |
| British | 93 | 1.1% |
| Burmese | 342 | 4.1% |
| Central American | 40 | 0.5% |
| Colombian | 177 | 2.1% |
| Costa Rican | 40 | 0.5% |
| Croatian | 152 | 1.8% |
| Cuban | 18 | 0.2% |
| Czech | 12 | 0.1% |
| Dominican | 232 | 2.8% |
| Dutch | 126 | 1.5% |
| Eastern European | 27 | 0.3% |
| Egyptian | 52 | 0.6% |
| English | 205 | 2.4% |
| European | 42 | 0.5% |
| Filipino | 39 | 0.5% |
| French | 30 | 0.4% |
| German | 1,061 | 12.6% |
| Greek | 68 | 0.8% |
| Hungarian | 234 | 2.8% |
| Indian (Asian) | 391 | 4.6% |
| Irish | 767 | 9.1% |
| Italian | 2,003 | 23.8% |
| Korean | 14 | 0.2% |
| Latvian | 12 | 0.1% |
| Lebanese | 13 | 0.2% |
| Lithuanian | 19 | 0.2% |
| Mexican | 275 | 3.3% |
| Native Hawaiian | 11 | 0.1% |
| Norwegian | 75 | 0.9% |
| Peruvian | 23 | 0.3% |
| Polish | 457 | 5.4% |
| Portuguese | 14 | 0.2% |
| Puerto Rican | 208 | 2.5% |
| Russian | 394 | 4.7% |
| Scotch-Irish | 56 | 0.7% |
| Scottish | 172 | 2.0% |
| South American | 200 | 2.4% |
| Spaniard | 10 | 0.1% |
| Subsaharan African | 82 | 1.0% |
| Swedish | 52 | 0.6% |
| Swiss | 47 | 0.6% |
| Thai | 378 | 4.5% |
| Ukrainian | 262 | 3.1% |
| Welsh | 12 | 0.1% | View All 53 Rows |
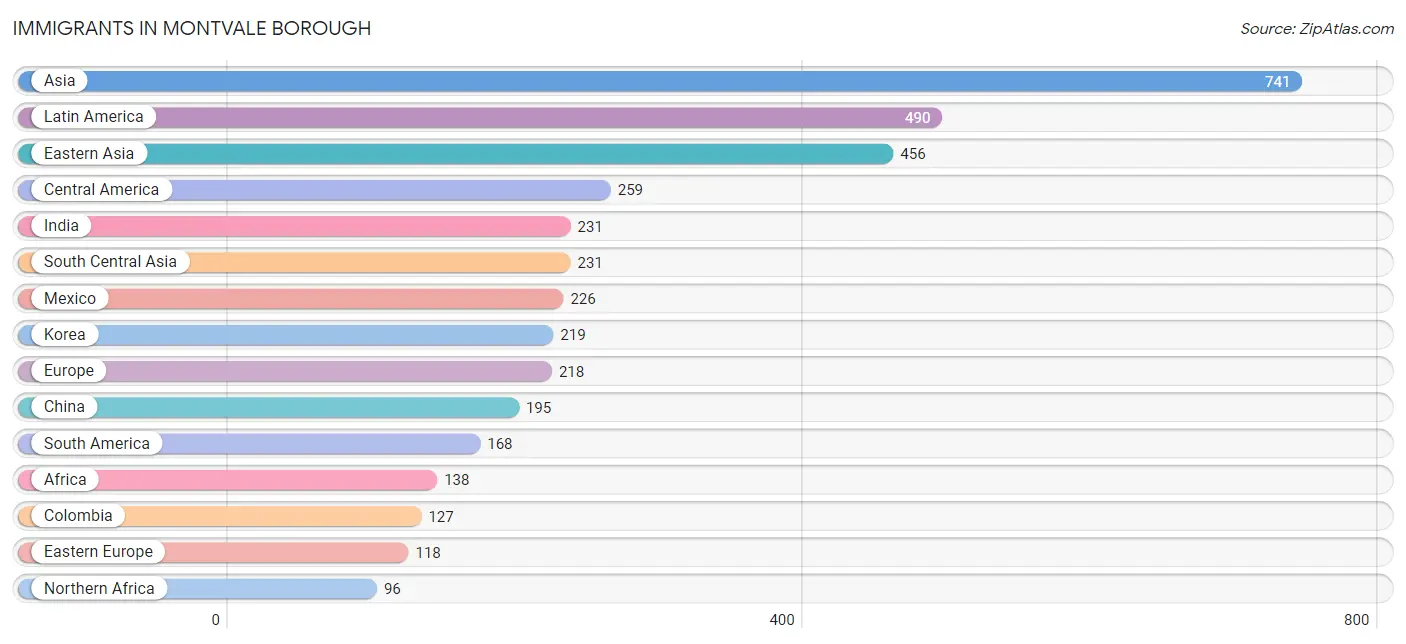
Immigrants in Montvale borough
The most numerous immigrant groups reported in Montvale borough came from Asia (741 | 8.8%), Latin America (490 | 5.8%), Eastern Asia (456 | 5.4%), Central America (259 | 3.1%), and India (231 | 2.8%), together accounting for 25.9% of all Montvale borough residents.
| Immigration Origin | # Population | % Population |
| Africa | 138 | 1.6% |
| Asia | 741 | 8.8% |
| Belarus | 31 | 0.4% |
| Belize | 33 | 0.4% |
| Brazil | 41 | 0.5% |
| Caribbean | 63 | 0.7% |
| Central America | 259 | 3.1% |
| China | 195 | 2.3% |
| Colombia | 127 | 1.5% |
| Dominican Republic | 63 | 0.7% |
| Eastern Asia | 456 | 5.4% |
| Eastern Europe | 118 | 1.4% |
| Egypt | 78 | 0.9% |
| England | 8 | 0.1% |
| Europe | 218 | 2.6% |
| Germany | 10 | 0.1% |
| India | 231 | 2.8% |
| Italy | 58 | 0.7% |
| Japan | 42 | 0.5% |
| Korea | 219 | 2.6% |
| Latin America | 490 | 5.8% |
| Mexico | 226 | 2.7% |
| Northern Africa | 96 | 1.1% |
| Northern Europe | 20 | 0.2% |
| Romania | 26 | 0.3% |
| Russia | 18 | 0.2% |
| South America | 168 | 2.0% |
| South Central Asia | 231 | 2.8% |
| Southern Europe | 70 | 0.8% |
| Spain | 12 | 0.1% |
| Taiwan | 77 | 0.9% |
| Ukraine | 43 | 0.5% |
| Western Europe | 10 | 0.1% | View All 33 Rows |
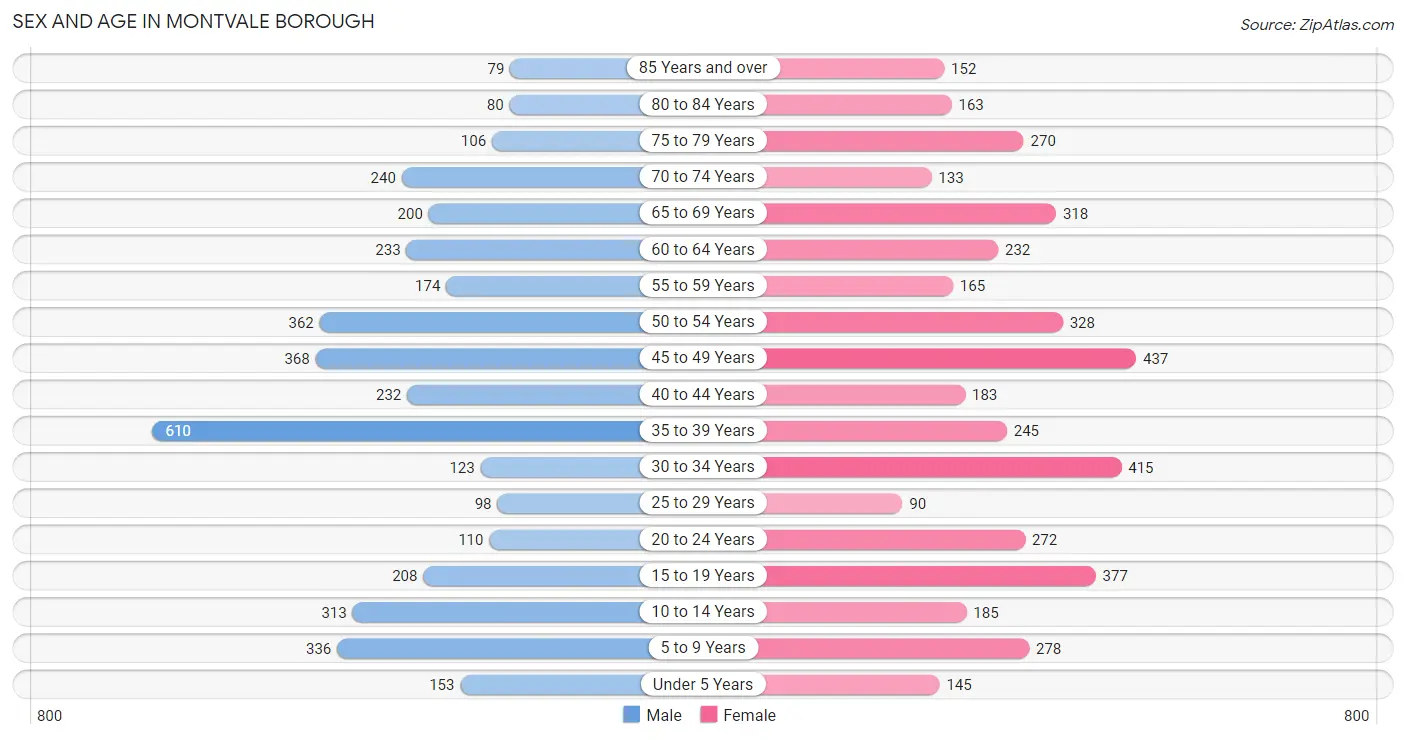
Sex and Age in Montvale borough
Sex and Age in Montvale borough
The most populous age groups in Montvale borough are 35 to 39 Years (610 | 15.2%) for men and 45 to 49 Years (437 | 10.0%) for women.
| Age Bracket | Male | Female |
| Under 5 Years | 153 (3.8%) | 145 (3.3%) |
| 5 to 9 Years | 336 (8.4%) | 278 (6.3%) |
| 10 to 14 Years | 313 (7.8%) | 185 (4.2%) |
| 15 to 19 Years | 208 (5.2%) | 377 (8.6%) |
| 20 to 24 Years | 110 (2.7%) | 272 (6.2%) |
| 25 to 29 Years | 98 (2.4%) | 90 (2.1%) |
| 30 to 34 Years | 123 (3.1%) | 415 (9.5%) |
| 35 to 39 Years | 610 (15.2%) | 245 (5.6%) |
| 40 to 44 Years | 232 (5.8%) | 183 (4.2%) |
| 45 to 49 Years | 368 (9.1%) | 437 (10.0%) |
| 50 to 54 Years | 362 (9.0%) | 328 (7.5%) |
| 55 to 59 Years | 174 (4.3%) | 165 (3.8%) |
| 60 to 64 Years | 233 (5.8%) | 232 (5.3%) |
| 65 to 69 Years | 200 (5.0%) | 318 (7.2%) |
| 70 to 74 Years | 240 (6.0%) | 133 (3.0%) |
| 75 to 79 Years | 106 (2.6%) | 270 (6.1%) |
| 80 to 84 Years | 80 (2.0%) | 163 (3.7%) |
| 85 Years and over | 79 (2.0%) | 152 (3.5%) |
| Total | 4,025 (100.0%) | 4,388 (100.0%) |
Families and Households in Montvale borough
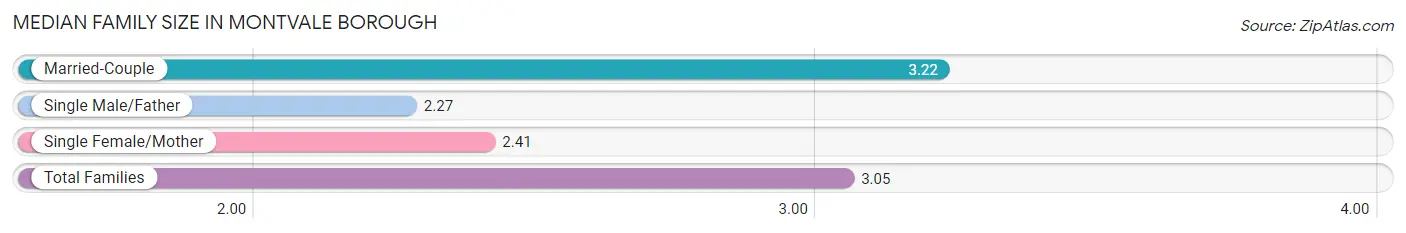
Median Family Size in Montvale borough
The median family size in Montvale borough is 3.05 persons per family, with married-couple families (2,014 | 80.8%) accounting for the largest median family size of 3.22 persons per family. On the other hand, single male/father families (236 | 9.5%) represent the smallest median family size with 2.27 persons per family.
| Family Type | # Families | Family Size |
| Married-Couple | 2,014 (80.8%) | 3.22 |
| Single Male/Father | 236 (9.5%) | 2.27 |
| Single Female/Mother | 243 (9.8%) | 2.41 |
| Total Families | 2,493 (100.0%) | 3.05 |
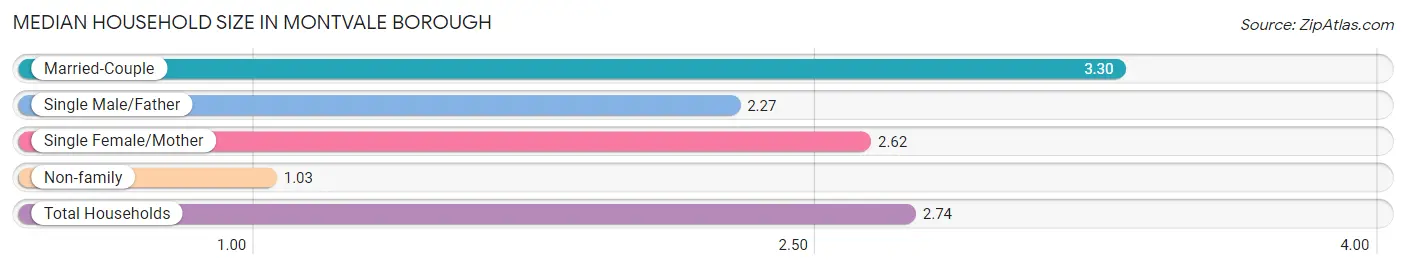
Median Household Size in Montvale borough
The median household size in Montvale borough is 2.74 persons per household, with married-couple households (2,014 | 65.7%) accounting for the largest median household size of 3.3 persons per household. non-family households (573 | 18.7%) represent the smallest median household size with 1.03 persons per household.
| Household Type | # Households | Household Size |
| Married-Couple | 2,014 (65.7%) | 3.30 |
| Single Male/Father | 236 (7.7%) | 2.27 |
| Single Female/Mother | 243 (7.9%) | 2.62 |
| Non-family | 573 (18.7%) | 1.03 |
| Total Households | 3,066 (100.0%) | 2.74 |
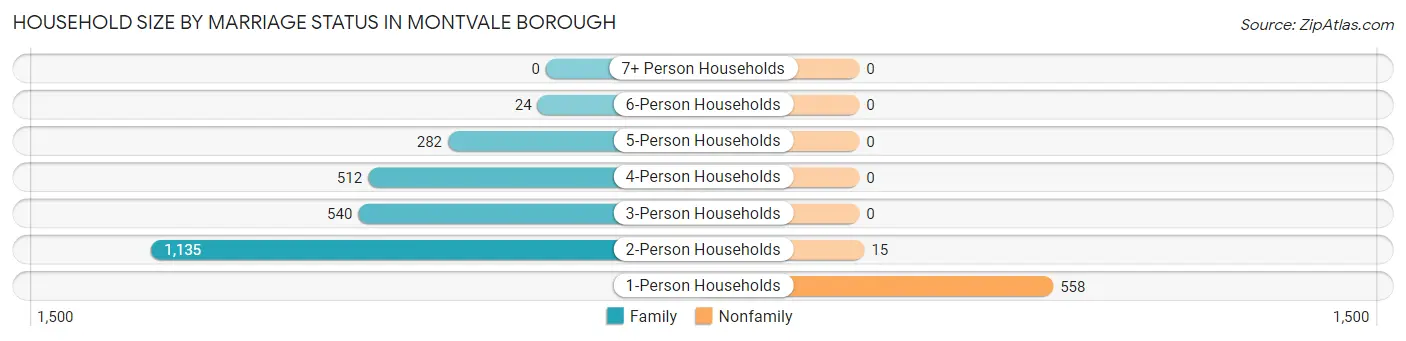
Household Size by Marriage Status in Montvale borough
Out of a total of 3,066 households in Montvale borough, 2,493 (81.3%) are family households, while 573 (18.7%) are nonfamily households. The most numerous type of family households are 2-person households, comprising 1,135, and the most common type of nonfamily households are 1-person households, comprising 558.
| Household Size | Family Households | Nonfamily Households |
| 1-Person Households | - | 558 (18.2%) |
| 2-Person Households | 1,135 (37.0%) | 15 (0.5%) |
| 3-Person Households | 540 (17.6%) | 0 (0.0%) |
| 4-Person Households | 512 (16.7%) | 0 (0.0%) |
| 5-Person Households | 282 (9.2%) | 0 (0.0%) |
| 6-Person Households | 24 (0.8%) | 0 (0.0%) |
| 7+ Person Households | 0 (0.0%) | 0 (0.0%) |
| Total | 2,493 (81.3%) | 573 (18.7%) |
Female Fertility in Montvale borough
Fertility by Age in Montvale borough
| Age Bracket | Women with Births | Births / 1,000 Women |
| 15 to 19 years | 0 (0.0%) | 0.0 |
| 20 to 34 years | 0 (0.0%) | 0.0 |
| 35 to 50 years | 0 (0.0%) | 0.0 |
| Total | 0 (0.0%) | 0.0 |
Fertility by Age by Marriage Status in Montvale borough
| Age Bracket | Married | Unmarried |
| 15 to 19 years | 0 (0.0%) | 0 (0.0%) |
| 20 to 34 years | 0 (0.0%) | 0 (0.0%) |
| 35 to 50 years | 0 (0.0%) | 0 (0.0%) |
| Total | 0 (0.0%) | 0 (0.0%) |
Fertility by Education in Montvale borough
| Educational Attainment | Women with Births | Births / 1,000 Women |
| Less than High School | 0 (0.0%) | 0.0 |
| High School Diploma | 0 (0.0%) | 0.0 |
| College or Associate's Degree | 0 (0.0%) | 0.0 |
| Bachelor's Degree | 0 (0.0%) | 0.0 |
| Graduate Degree | 0 (0.0%) | 0.0 |
| Total | 0 (0.0%) | 0.0 |
Fertility by Education by Marriage Status in Montvale borough
| Educational Attainment | Married | Unmarried |
| Less than High School | 0 (0.0%) | 0 (0.0%) |
| High School Diploma | 0 (0.0%) | 0 (0.0%) |
| College or Associate's Degree | 0 (0.0%) | 0 (0.0%) |
| Bachelor's Degree | 0 (0.0%) | 0 (0.0%) |
| Graduate Degree | 0 (0.0%) | 0 (0.0%) |
| Total | 0 (0.0%) | 0 (0.0%) |
Employment Characteristics in Montvale borough
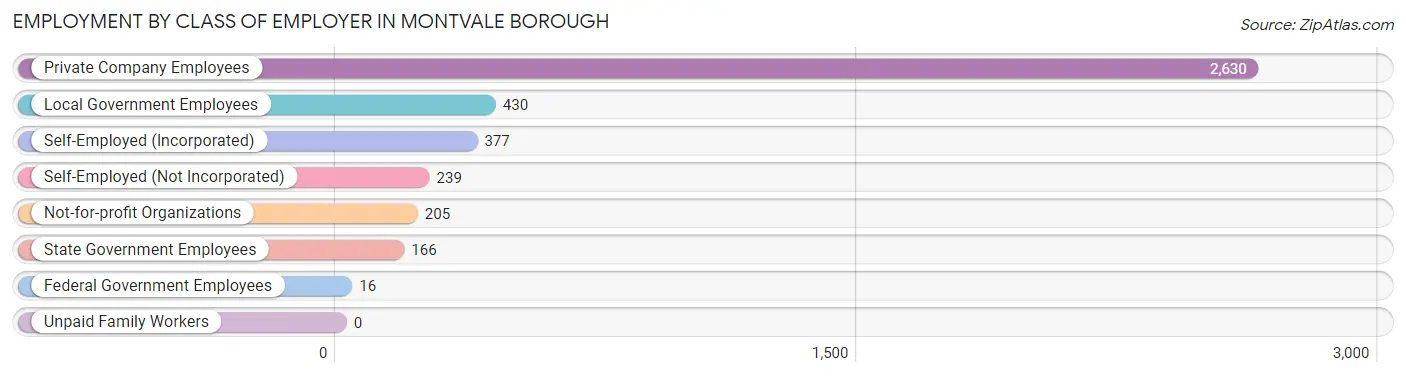
Employment by Class of Employer in Montvale borough
Among the 4,063 employed individuals in Montvale borough, private company employees (2,630 | 64.7%), local government employees (430 | 10.6%), and self-employed (incorporated) (377 | 9.3%) make up the most common classes of employment.
| Employer Class | # Employees | % Employees |
| Private Company Employees | 2,630 | 64.7% |
| Self-Employed (Incorporated) | 377 | 9.3% |
| Self-Employed (Not Incorporated) | 239 | 5.9% |
| Not-for-profit Organizations | 205 | 5.1% |
| Local Government Employees | 430 | 10.6% |
| State Government Employees | 166 | 4.1% |
| Federal Government Employees | 16 | 0.4% |
| Unpaid Family Workers | 0 | 0.0% |
| Total | 4,063 | 100.0% |
Employment Status by Age in Montvale borough
According to the labor force statistics for Montvale borough, out of the total population over 16 years of age (6,888), 63.0% or 4,339 individuals are in the labor force, with 2.9% or 126 of them unemployed. The age group with the highest labor force participation rate is 25 to 29 years, with 84.6% or 159 individuals in the labor force. Within the labor force, the 16 to 19 years age range has the highest percentage of unemployed individuals, with 21.8% or 47 of them being unemployed.
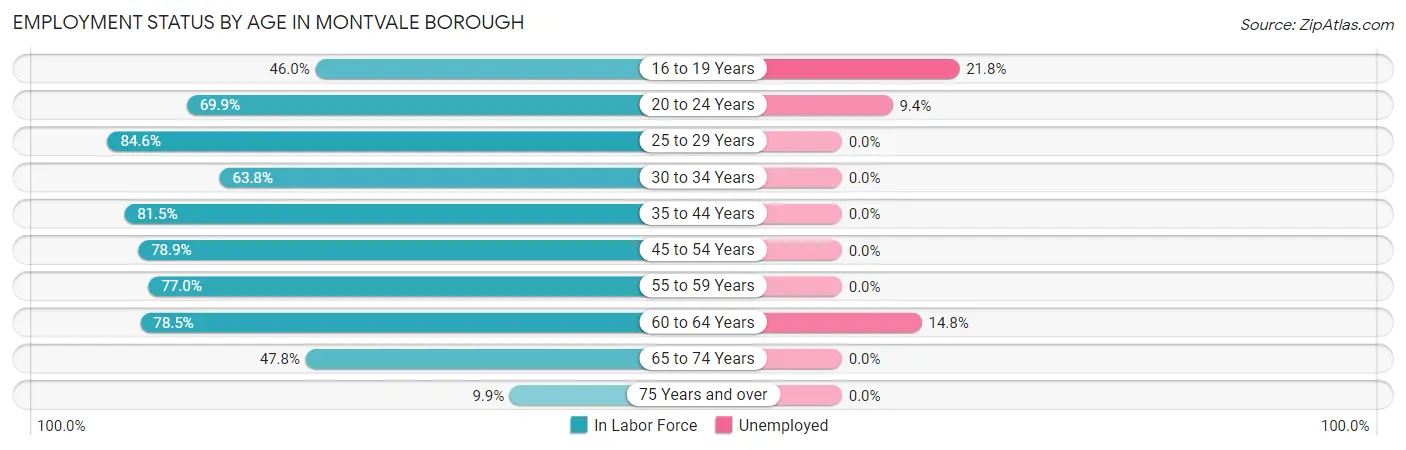
| Age Bracket | In Labor Force | Unemployed |
| 16 to 19 Years | 216 (46.0%) | 47 (21.8%) |
| 20 to 24 Years | 267 (69.9%) | 25 (9.4%) |
| 25 to 29 Years | 159 (84.6%) | 0 (0.0%) |
| 30 to 34 Years | 343 (63.8%) | 0 (0.0%) |
| 35 to 44 Years | 1,035 (81.5%) | 0 (0.0%) |
| 45 to 54 Years | 1,180 (78.9%) | 0 (0.0%) |
| 55 to 59 Years | 261 (77.0%) | 0 (0.0%) |
| 60 to 64 Years | 365 (78.5%) | 54 (14.8%) |
| 65 to 74 Years | 426 (47.8%) | 0 (0.0%) |
| 75 Years and over | 84 (9.9%) | 0 (0.0%) |
| Total | 4,339 (63.0%) | 126 (2.9%) |
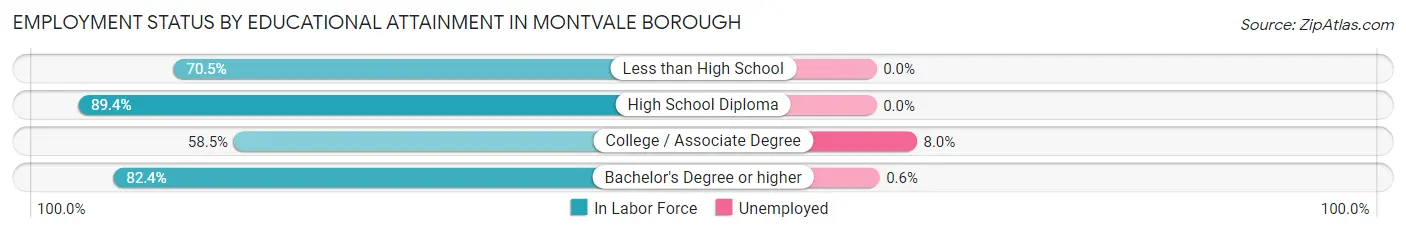
Employment Status by Educational Attainment in Montvale borough
According to labor force statistics for Montvale borough, 77.8% of individuals (3,342) out of the total population between 25 and 64 years of age (4,295) are in the labor force, with 1.6% or 53 of them being unemployed. The group with the highest labor force participation rate are those with the educational attainment of high school diploma, with 89.4% or 448 individuals in the labor force. Within the labor force, individuals with college / associate degree education have the highest percentage of unemployment, with 8.0% or 40 of them being unemployed.
| Educational Attainment | In Labor Force | Unemployed |
| Less than High School | 165 (70.5%) | 0 (0.0%) |
| High School Diploma | 448 (89.4%) | 0 (0.0%) |
| College / Associate Degree | 498 (58.5%) | 68 (8.0%) |
| Bachelor's Degree or higher | 2,231 (82.4%) | 16 (0.6%) |
| Total | 3,342 (77.8%) | 69 (1.6%) |
Employment Occupations by Sex in Montvale borough
Management, Business, Science and Arts Occupations
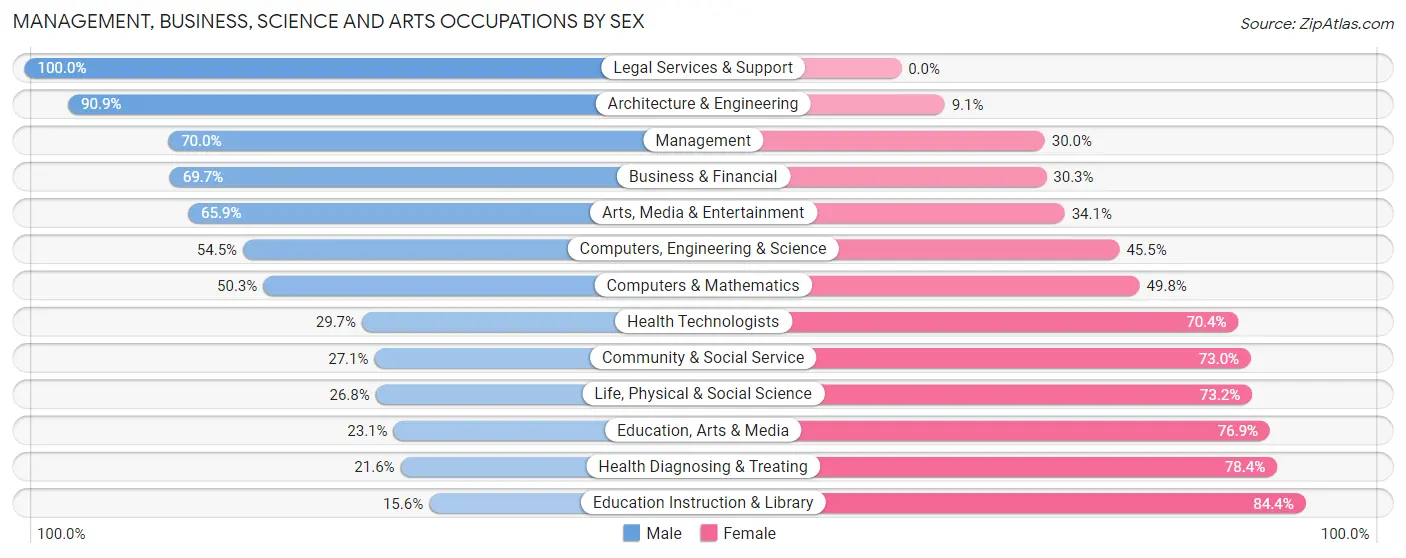
The most common Management, Business, Science and Arts occupations in Montvale borough are Community & Social Service (743 | 17.6%), Management (724 | 17.2%), Education Instruction & Library (537 | 12.8%), Business & Financial (416 | 9.9%), and Computers, Engineering & Science (325 | 7.7%).
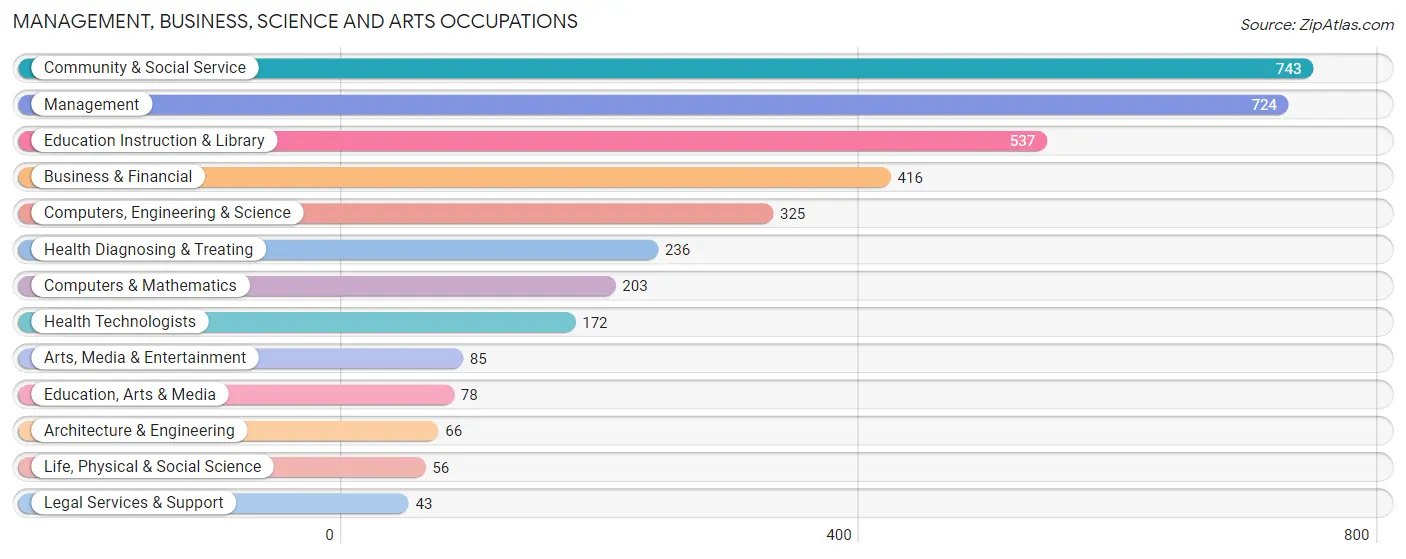
Management, Business, Science and Arts Occupations by Sex
Within the Management, Business, Science and Arts occupations in Montvale borough, the most male-oriented occupations are Legal Services & Support (100.0%), Architecture & Engineering (90.9%), and Management (70.0%), while the most female-oriented occupations are Education Instruction & Library (84.4%), Health Diagnosing & Treating (78.4%), and Education, Arts & Media (76.9%).
| Occupation | Male | Female |
| Management | 507 (70.0%) | 217 (30.0%) |
| Business & Financial | 290 (69.7%) | 126 (30.3%) |
| Computers, Engineering & Science | 177 (54.5%) | 148 (45.5%) |
| Computers & Mathematics | 102 (50.2%) | 101 (49.7%) |
| Architecture & Engineering | 60 (90.9%) | 6 (9.1%) |
| Life, Physical & Social Science | 15 (26.8%) | 41 (73.2%) |
| Community & Social Service | 201 (27.1%) | 542 (73.0%) |
| Education, Arts & Media | 18 (23.1%) | 60 (76.9%) |
| Legal Services & Support | 43 (100.0%) | 0 (0.0%) |
| Education Instruction & Library | 84 (15.6%) | 453 (84.4%) |
| Arts, Media & Entertainment | 56 (65.9%) | 29 (34.1%) |
| Health Diagnosing & Treating | 51 (21.6%) | 185 (78.4%) |
| Health Technologists | 51 (29.6%) | 121 (70.4%) |
| Total (Category) | 1,226 (50.2%) | 1,218 (49.8%) |
| Total (Overall) | 2,224 (52.8%) | 1,986 (47.2%) |
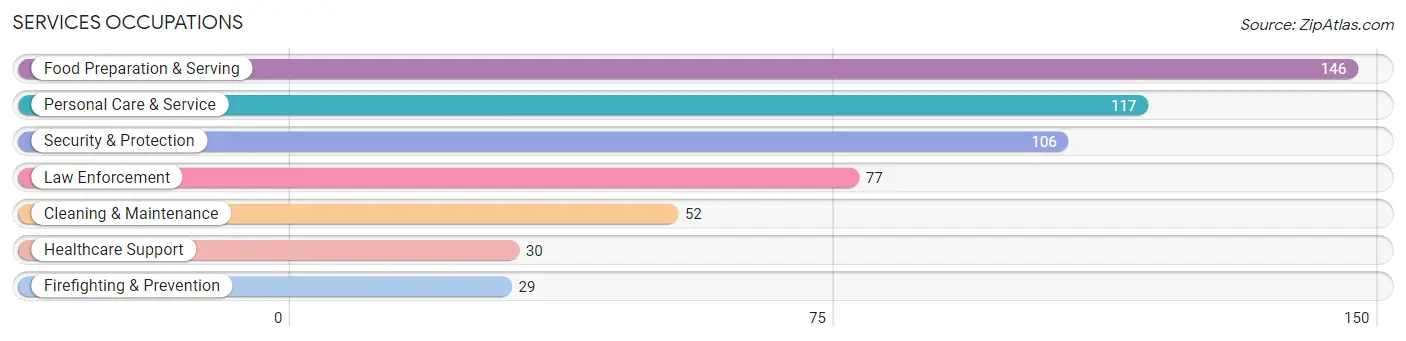
Services Occupations
The most common Services occupations in Montvale borough are Food Preparation & Serving (146 | 3.5%), Personal Care & Service (117 | 2.8%), Security & Protection (106 | 2.5%), Law Enforcement (77 | 1.8%), and Cleaning & Maintenance (52 | 1.2%).
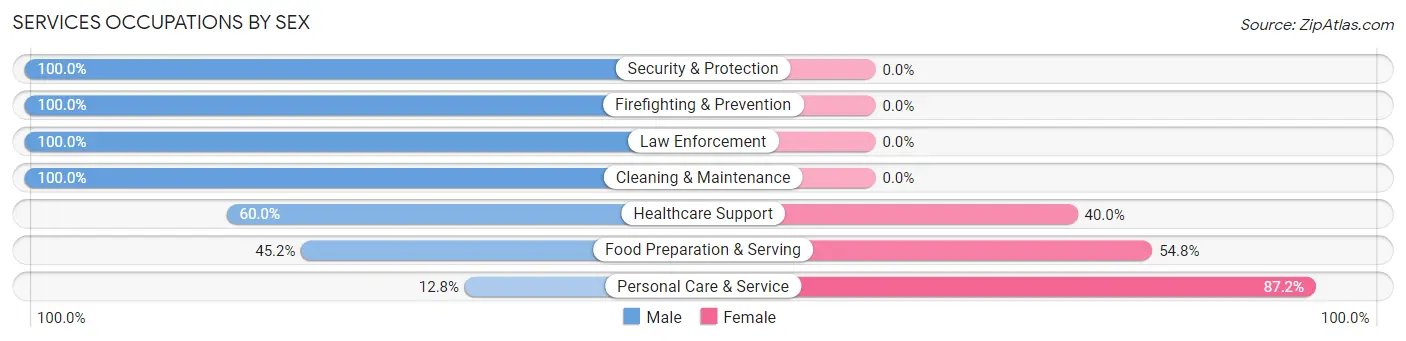
Services Occupations by Sex
Within the Services occupations in Montvale borough, the most male-oriented occupations are Security & Protection (100.0%), Firefighting & Prevention (100.0%), and Law Enforcement (100.0%), while the most female-oriented occupations are Personal Care & Service (87.2%), Food Preparation & Serving (54.8%), and Healthcare Support (40.0%).
| Occupation | Male | Female |
| Healthcare Support | 18 (60.0%) | 12 (40.0%) |
| Security & Protection | 106 (100.0%) | 0 (0.0%) |
| Firefighting & Prevention | 29 (100.0%) | 0 (0.0%) |
| Law Enforcement | 77 (100.0%) | 0 (0.0%) |
| Food Preparation & Serving | 66 (45.2%) | 80 (54.8%) |
| Cleaning & Maintenance | 52 (100.0%) | 0 (0.0%) |
| Personal Care & Service | 15 (12.8%) | 102 (87.2%) |
| Total (Category) | 257 (57.0%) | 194 (43.0%) |
| Total (Overall) | 2,224 (52.8%) | 1,986 (47.2%) |
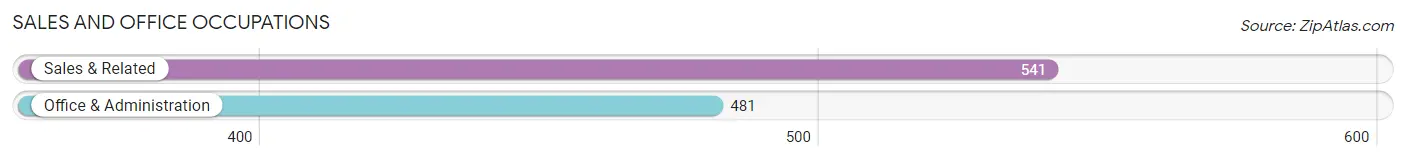
Sales and Office Occupations
The most common Sales and Office occupations in Montvale borough are Sales & Related (541 | 12.9%), and Office & Administration (481 | 11.4%).
Sales and Office Occupations by Sex
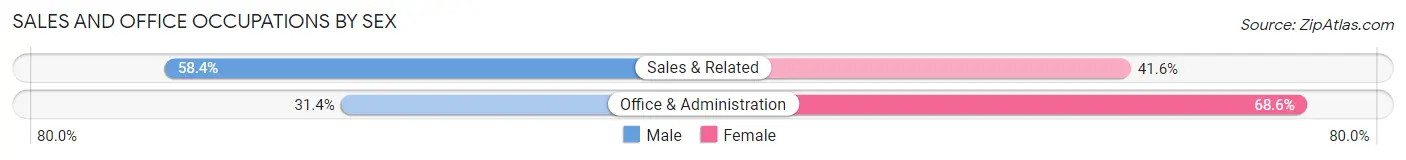
| Occupation | Male | Female |
| Sales & Related | 316 (58.4%) | 225 (41.6%) |
| Office & Administration | 151 (31.4%) | 330 (68.6%) |
| Total (Category) | 467 (45.7%) | 555 (54.3%) |
| Total (Overall) | 2,224 (52.8%) | 1,986 (47.2%) |
Natural Resources, Construction and Maintenance Occupations
The most common Natural Resources, Construction and Maintenance occupations in Montvale borough are Construction & Extraction (161 | 3.8%), and Installation, Maintenance & Repair (53 | 1.3%).

Natural Resources, Construction and Maintenance Occupations by Sex

| Occupation | Male | Female |
| Farming, Fishing & Forestry | 0 (0.0%) | 0 (0.0%) |
| Construction & Extraction | 161 (100.0%) | 0 (0.0%) |
| Installation, Maintenance & Repair | 53 (100.0%) | 0 (0.0%) |
| Total (Category) | 214 (100.0%) | 0 (0.0%) |
| Total (Overall) | 2,224 (52.8%) | 1,986 (47.2%) |
Production, Transportation and Moving Occupations
The most common Production, Transportation and Moving occupations in Montvale borough are Transportation (60 | 1.4%), and Production (19 | 0.4%).
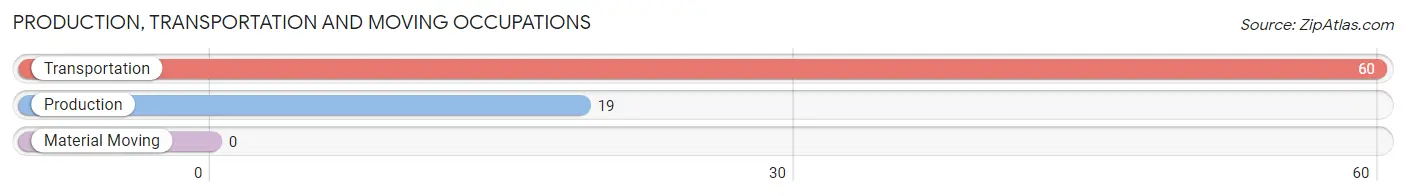
Production, Transportation and Moving Occupations by Sex
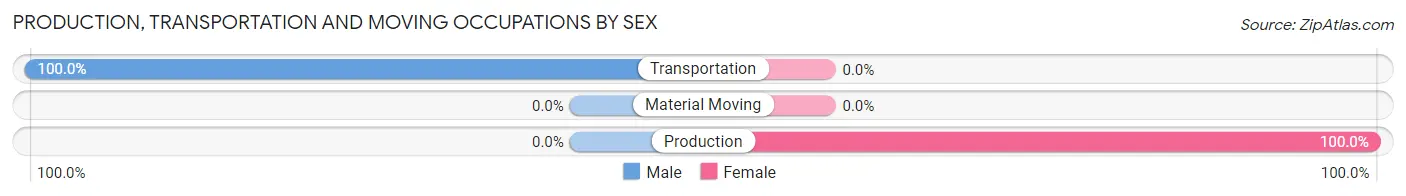
| Occupation | Male | Female |
| Production | 0 (0.0%) | 19 (100.0%) |
| Transportation | 60 (100.0%) | 0 (0.0%) |
| Material Moving | 0 (0.0%) | 0 (0.0%) |
| Total (Category) | 60 (75.9%) | 19 (24.0%) |
| Total (Overall) | 2,224 (52.8%) | 1,986 (47.2%) |
Employment Industries by Sex in Montvale borough
Employment Industries in Montvale borough
The major employment industries in Montvale borough include Educational Services (562 | 13.4%), Finance & Insurance (453 | 10.8%), Retail Trade (443 | 10.5%), Professional & Scientific (412 | 9.8%), and Construction (369 | 8.8%).
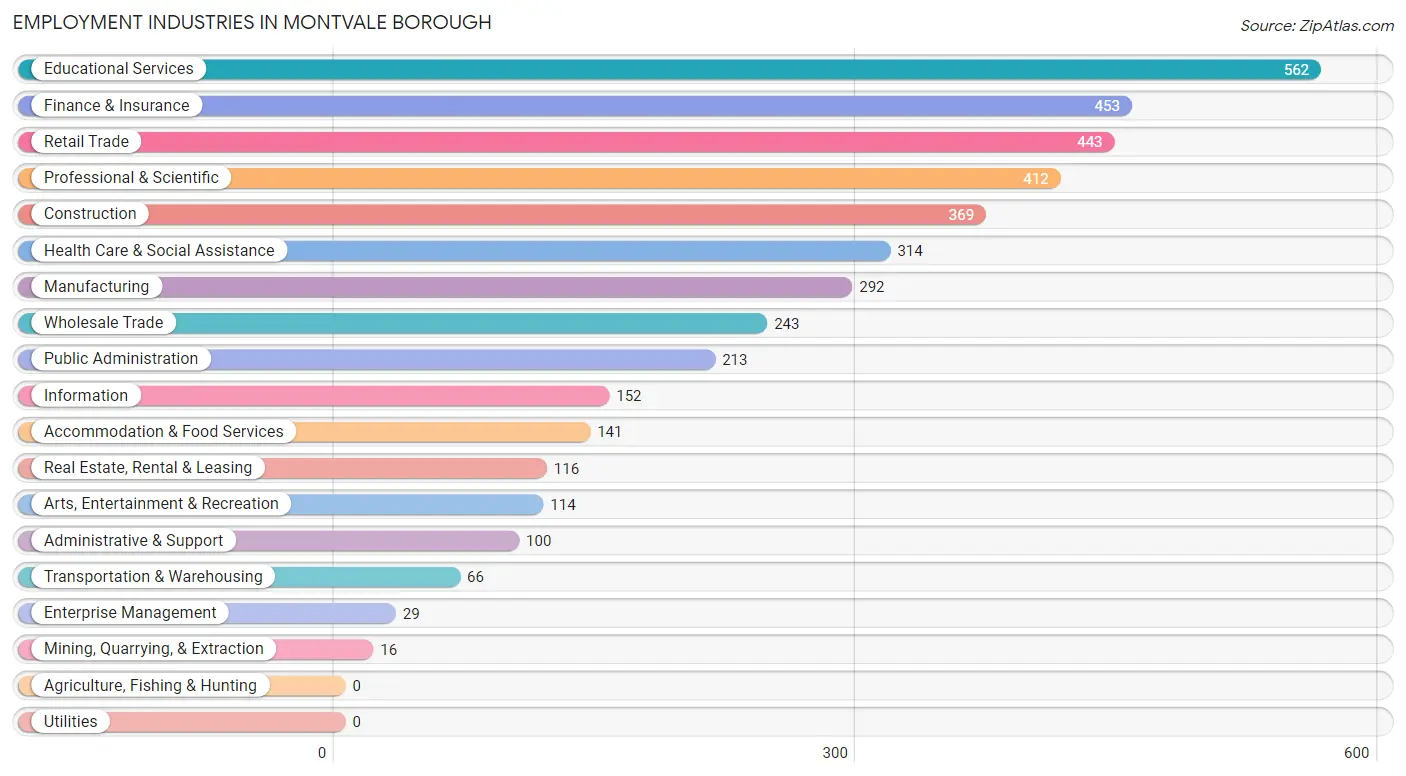
Employment Industries by Sex in Montvale borough
The Montvale borough industries that see more men than women are Mining, Quarrying, & Extraction (100.0%), Wholesale Trade (100.0%), and Transportation & Warehousing (83.3%), whereas the industries that tend to have a higher number of women are Educational Services (81.5%), Information (71.7%), and Health Care & Social Assistance (66.2%).
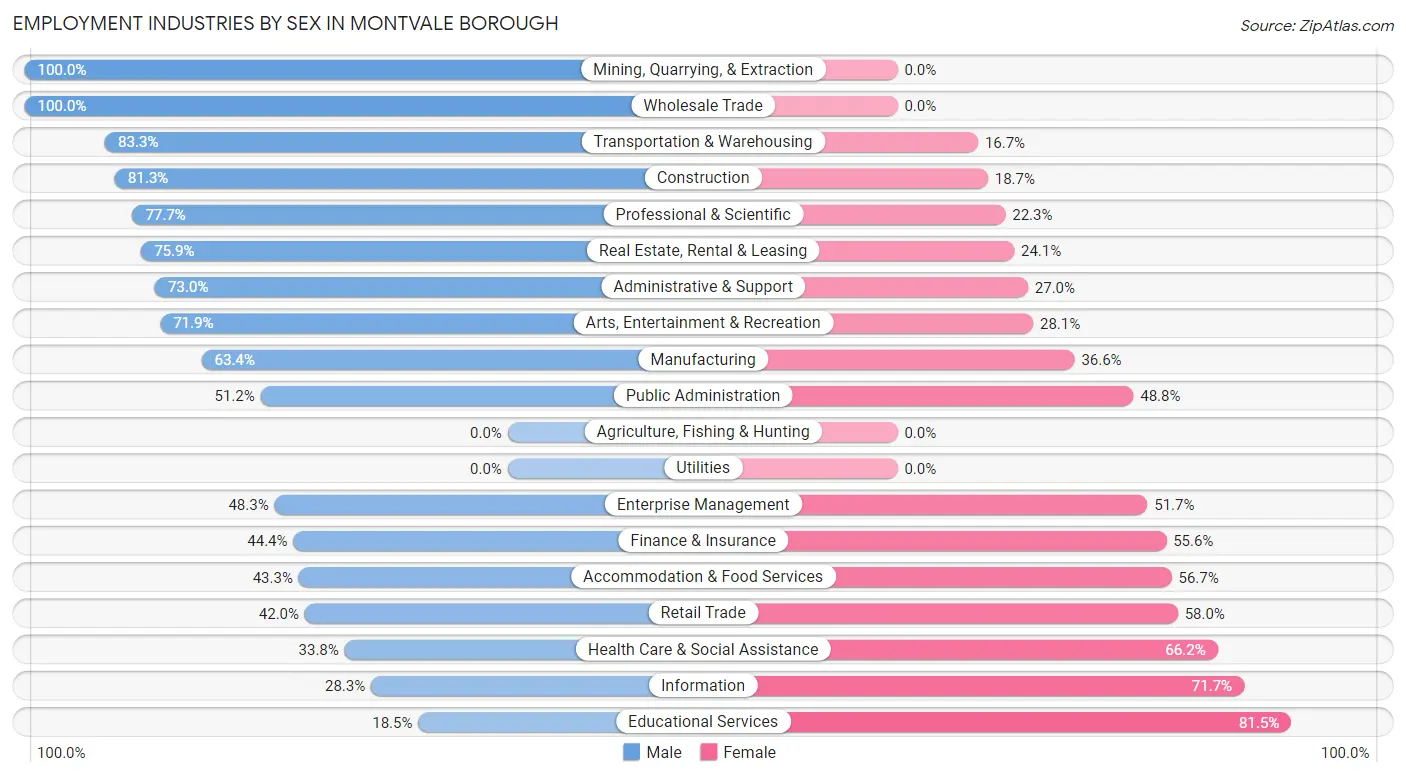
| Industry | Male | Female |
| Agriculture, Fishing & Hunting | 0 (0.0%) | 0 (0.0%) |
| Mining, Quarrying, & Extraction | 16 (100.0%) | 0 (0.0%) |
| Construction | 300 (81.3%) | 69 (18.7%) |
| Manufacturing | 185 (63.4%) | 107 (36.6%) |
| Wholesale Trade | 243 (100.0%) | 0 (0.0%) |
| Retail Trade | 186 (42.0%) | 257 (58.0%) |
| Transportation & Warehousing | 55 (83.3%) | 11 (16.7%) |
| Utilities | 0 (0.0%) | 0 (0.0%) |
| Information | 43 (28.3%) | 109 (71.7%) |
| Finance & Insurance | 201 (44.4%) | 252 (55.6%) |
| Real Estate, Rental & Leasing | 88 (75.9%) | 28 (24.1%) |
| Professional & Scientific | 320 (77.7%) | 92 (22.3%) |
| Enterprise Management | 14 (48.3%) | 15 (51.7%) |
| Administrative & Support | 73 (73.0%) | 27 (27.0%) |
| Educational Services | 104 (18.5%) | 458 (81.5%) |
| Health Care & Social Assistance | 106 (33.8%) | 208 (66.2%) |
| Arts, Entertainment & Recreation | 82 (71.9%) | 32 (28.1%) |
| Accommodation & Food Services | 61 (43.3%) | 80 (56.7%) |
| Public Administration | 109 (51.2%) | 104 (48.8%) |
| Total | 2,224 (52.8%) | 1,986 (47.2%) |
Education in Montvale borough
School Enrollment in Montvale borough
The most common levels of schooling among the 2,065 students in Montvale borough are high school (456 | 22.1%), middle school (435 | 21.1%), and elementary school (403 | 19.5%).
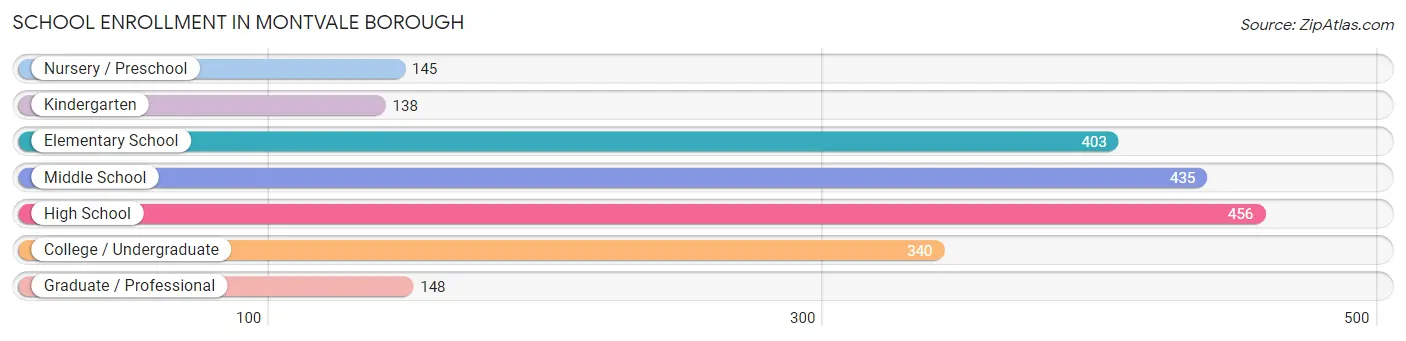
| School Level | # Students | % Students |
| Nursery / Preschool | 145 | 7.0% |
| Kindergarten | 138 | 6.7% |
| Elementary School | 403 | 19.5% |
| Middle School | 435 | 21.1% |
| High School | 456 | 22.1% |
| College / Undergraduate | 340 | 16.5% |
| Graduate / Professional | 148 | 7.2% |
| Total | 2,065 | 100.0% |
School Enrollment by Age by Funding Source in Montvale borough
Out of a total of 2,065 students who are enrolled in schools in Montvale borough, 390 (18.9%) attend a private institution, while the remaining 1,675 (81.1%) are enrolled in public schools. The age group of 3 to 4 year olds has the highest likelihood of being enrolled in private schools, with 69 (93.2% in the age bracket) enrolled. Conversely, the age group of 10 to 14 year olds has the lowest likelihood of being enrolled in a private school, with 498 (100.0% in the age bracket) attending a public institution.
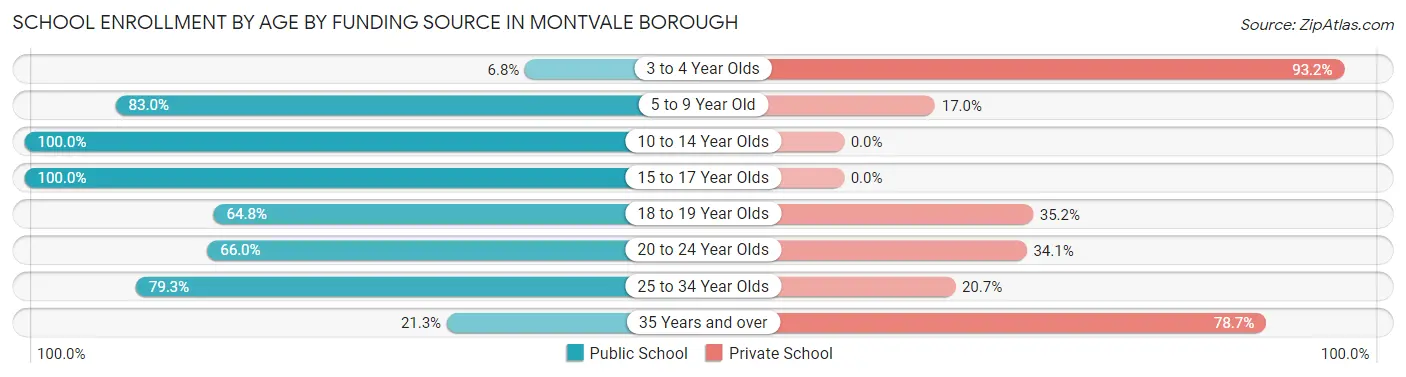
| Age Bracket | Public School | Private School |
| 3 to 4 Year Olds | 5 (6.8%) | 69 (93.2%) |
| 5 to 9 Year Old | 494 (83.0%) | 101 (17.0%) |
| 10 to 14 Year Olds | 498 (100.0%) | 0 (0.0%) |
| 15 to 17 Year Olds | 326 (100.0%) | 0 (0.0%) |
| 18 to 19 Year Olds | 149 (64.8%) | 81 (35.2%) |
| 20 to 24 Year Olds | 122 (65.9%) | 63 (34.1%) |
| 25 to 34 Year Olds | 65 (79.3%) | 17 (20.7%) |
| 35 Years and over | 16 (21.3%) | 59 (78.7%) |
| Total | 1,675 (81.1%) | 390 (18.9%) |
Educational Attainment by Field of Study in Montvale borough
Business (667 | 18.3%), education (378 | 10.4%), science & technology (337 | 9.2%), psychology (332 | 9.1%), and social sciences (298 | 8.2%) are the most common fields of study among 3,643 individuals in Montvale borough who have obtained a bachelor's degree or higher.
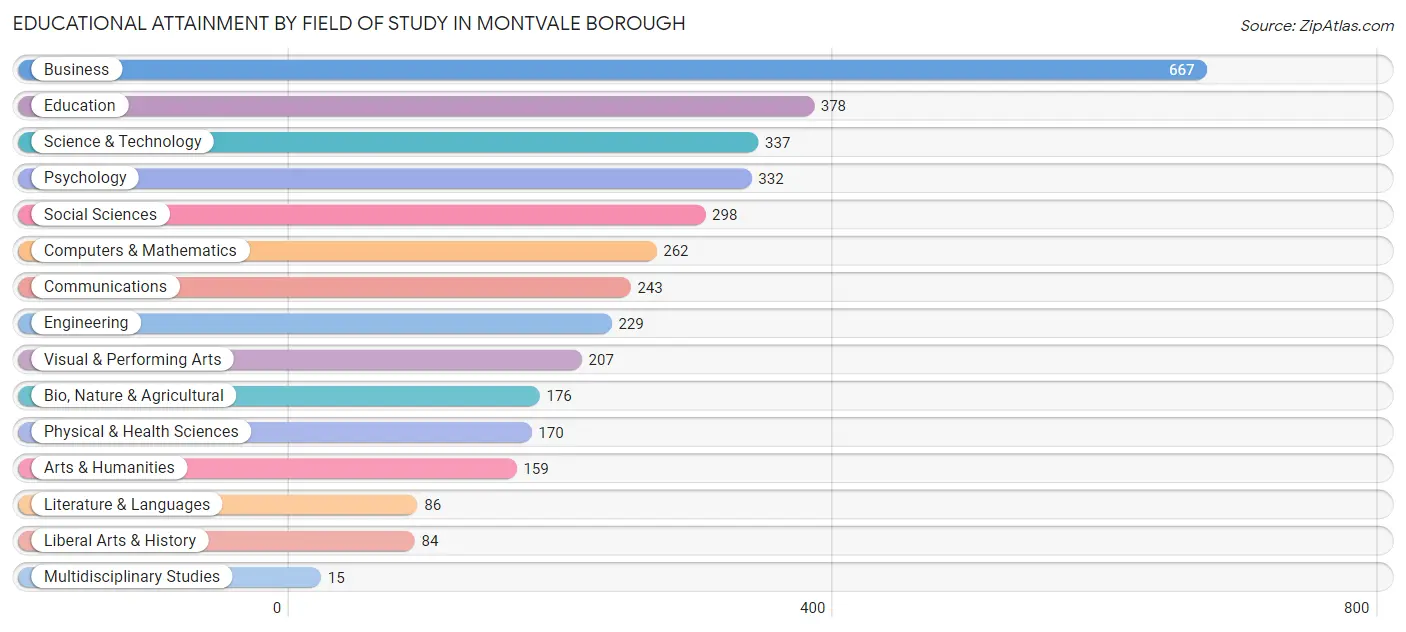
| Field of Study | # Graduates | % Graduates |
| Computers & Mathematics | 262 | 7.2% |
| Bio, Nature & Agricultural | 176 | 4.8% |
| Physical & Health Sciences | 170 | 4.7% |
| Psychology | 332 | 9.1% |
| Social Sciences | 298 | 8.2% |
| Engineering | 229 | 6.3% |
| Multidisciplinary Studies | 15 | 0.4% |
| Science & Technology | 337 | 9.2% |
| Business | 667 | 18.3% |
| Education | 378 | 10.4% |
| Literature & Languages | 86 | 2.4% |
| Liberal Arts & History | 84 | 2.3% |
| Visual & Performing Arts | 207 | 5.7% |
| Communications | 243 | 6.7% |
| Arts & Humanities | 159 | 4.4% |
| Total | 3,643 | 100.0% |
Transportation & Commute in Montvale borough
Vehicle Availability by Sex in Montvale borough
The most prevalent vehicle ownership categories in Montvale borough are males with 2 vehicles (964, accounting for 45.9%) and females with 2 vehicles (850, making up 49.2%).
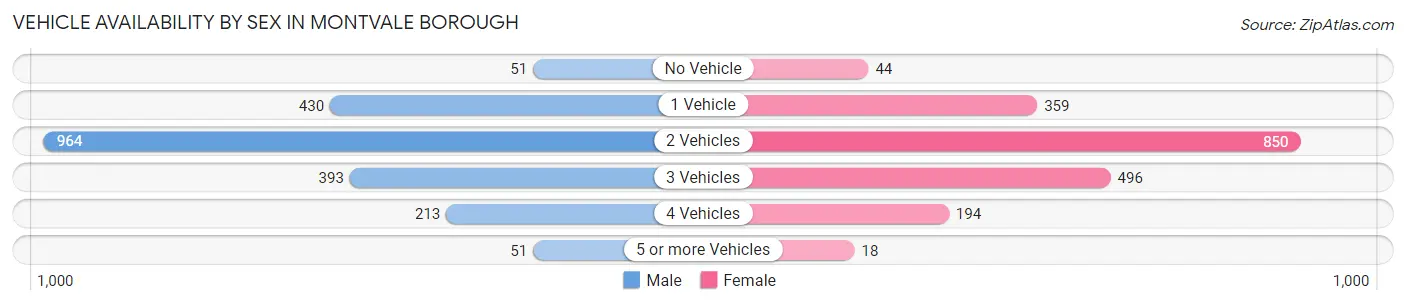
| Vehicles Available | Male | Female |
| No Vehicle | 51 (2.4%) | 44 (2.2%) |
| 1 Vehicle | 430 (20.5%) | 359 (18.3%) |
| 2 Vehicles | 964 (45.9%) | 850 (43.3%) |
| 3 Vehicles | 393 (18.7%) | 496 (25.3%) |
| 4 Vehicles | 213 (10.1%) | 194 (9.9%) |
| 5 or more Vehicles | 51 (2.4%) | 18 (0.9%) |
| Total | 2,102 (100.0%) | 1,961 (100.0%) |
Commute Time in Montvale borough
The most frequently occuring commute durations in Montvale borough are 30 to 34 minutes (578 commuters, 19.3%), 15 to 19 minutes (371 commuters, 12.4%), and 5 to 9 minutes (318 commuters, 10.6%).
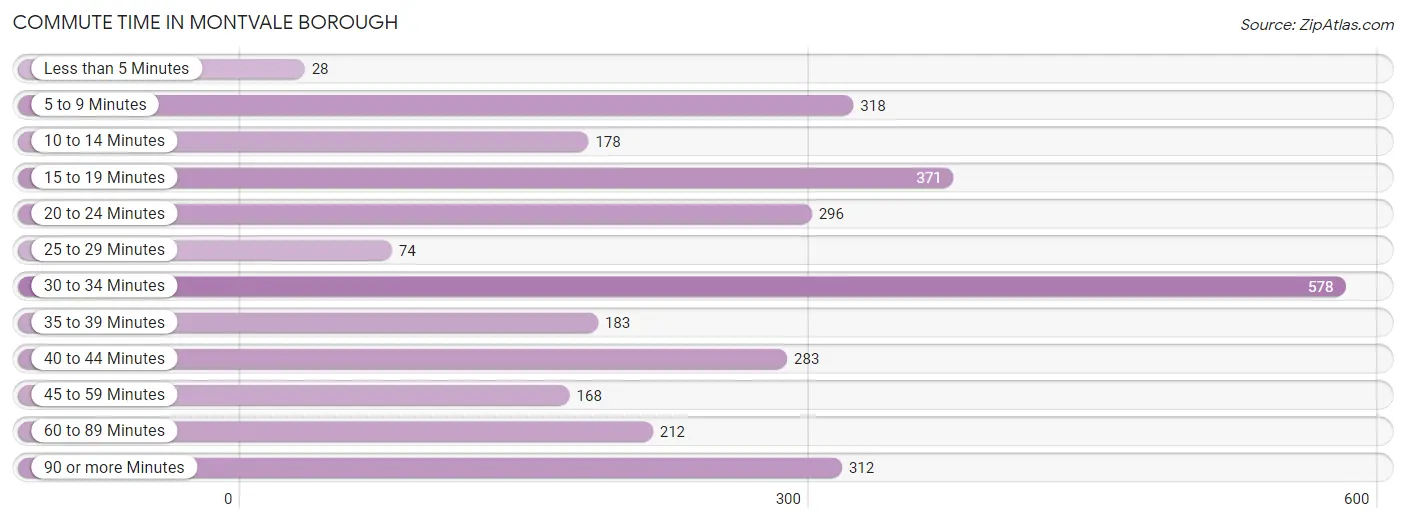
| Commute Time | # Commuters | % Commuters |
| Less than 5 Minutes | 28 | 0.9% |
| 5 to 9 Minutes | 318 | 10.6% |
| 10 to 14 Minutes | 178 | 5.9% |
| 15 to 19 Minutes | 371 | 12.4% |
| 20 to 24 Minutes | 296 | 9.9% |
| 25 to 29 Minutes | 74 | 2.5% |
| 30 to 34 Minutes | 578 | 19.3% |
| 35 to 39 Minutes | 183 | 6.1% |
| 40 to 44 Minutes | 283 | 9.4% |
| 45 to 59 Minutes | 168 | 5.6% |
| 60 to 89 Minutes | 212 | 7.1% |
| 90 or more Minutes | 312 | 10.4% |
Commute Time by Sex in Montvale borough
The most common commute times in Montvale borough are 30 to 34 minutes (300 commuters, 19.4%) for males and 30 to 34 minutes (278 commuters, 19.1%) for females.
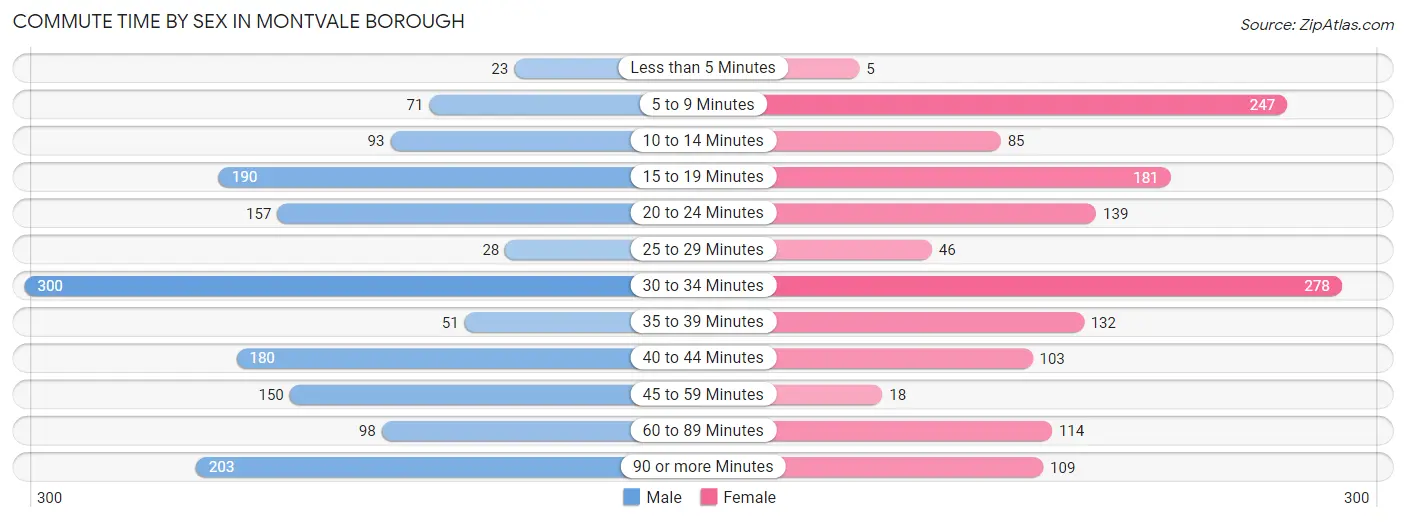
| Commute Time | Male | Female |
| Less than 5 Minutes | 23 (1.5%) | 5 (0.3%) |
| 5 to 9 Minutes | 71 (4.6%) | 247 (17.0%) |
| 10 to 14 Minutes | 93 (6.0%) | 85 (5.8%) |
| 15 to 19 Minutes | 190 (12.3%) | 181 (12.4%) |
| 20 to 24 Minutes | 157 (10.2%) | 139 (9.5%) |
| 25 to 29 Minutes | 28 (1.8%) | 46 (3.2%) |
| 30 to 34 Minutes | 300 (19.4%) | 278 (19.1%) |
| 35 to 39 Minutes | 51 (3.3%) | 132 (9.1%) |
| 40 to 44 Minutes | 180 (11.7%) | 103 (7.1%) |
| 45 to 59 Minutes | 150 (9.7%) | 18 (1.2%) |
| 60 to 89 Minutes | 98 (6.4%) | 114 (7.8%) |
| 90 or more Minutes | 203 (13.2%) | 109 (7.5%) |
Time of Departure to Work by Sex in Montvale borough
The most frequent times of departure to work in Montvale borough are 7:00 AM to 7:29 AM (359, 23.3%) for males and 7:00 AM to 7:29 AM (408, 28.0%) for females.
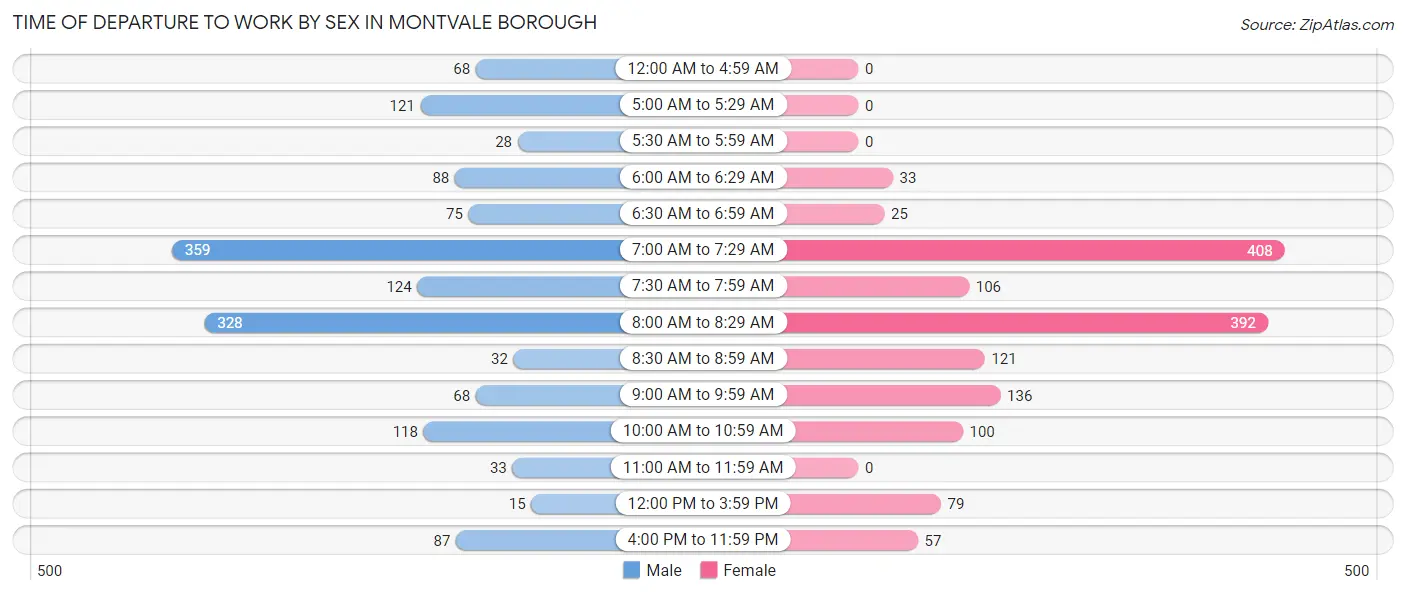
| Time of Departure | Male | Female |
| 12:00 AM to 4:59 AM | 68 (4.4%) | 0 (0.0%) |
| 5:00 AM to 5:29 AM | 121 (7.8%) | 0 (0.0%) |
| 5:30 AM to 5:59 AM | 28 (1.8%) | 0 (0.0%) |
| 6:00 AM to 6:29 AM | 88 (5.7%) | 33 (2.3%) |
| 6:30 AM to 6:59 AM | 75 (4.9%) | 25 (1.7%) |
| 7:00 AM to 7:29 AM | 359 (23.3%) | 408 (28.0%) |
| 7:30 AM to 7:59 AM | 124 (8.0%) | 106 (7.3%) |
| 8:00 AM to 8:29 AM | 328 (21.2%) | 392 (26.9%) |
| 8:30 AM to 8:59 AM | 32 (2.1%) | 121 (8.3%) |
| 9:00 AM to 9:59 AM | 68 (4.4%) | 136 (9.3%) |
| 10:00 AM to 10:59 AM | 118 (7.6%) | 100 (6.9%) |
| 11:00 AM to 11:59 AM | 33 (2.1%) | 0 (0.0%) |
| 12:00 PM to 3:59 PM | 15 (1.0%) | 79 (5.4%) |
| 4:00 PM to 11:59 PM | 87 (5.6%) | 57 (3.9%) |
| Total | 1,544 (100.0%) | 1,457 (100.0%) |
Housing Occupancy in Montvale borough
Occupancy by Ownership in Montvale borough
Of the total 3,066 dwellings in Montvale borough, owner-occupied units account for 2,576 (84.0%), while renter-occupied units make up 490 (16.0%).
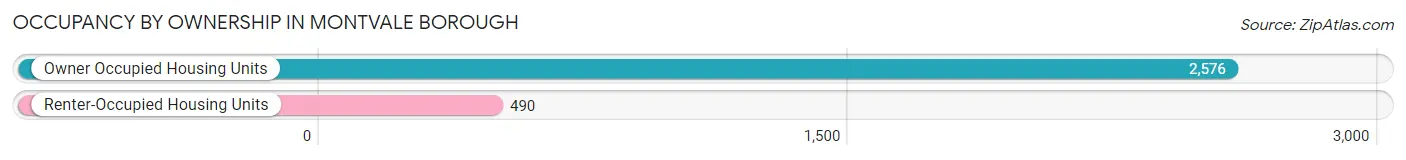
| Occupancy | # Housing Units | % Housing Units |
| Owner Occupied Housing Units | 2,576 | 84.0% |
| Renter-Occupied Housing Units | 490 | 16.0% |
| Total Occupied Housing Units | 3,066 | 100.0% |
Occupancy by Household Size in Montvale borough
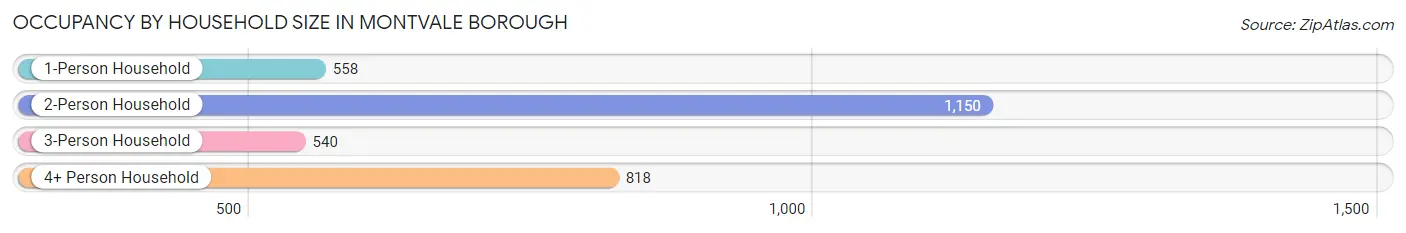
| Household Size | # Housing Units | % Housing Units |
| 1-Person Household | 558 | 18.2% |
| 2-Person Household | 1,150 | 37.5% |
| 3-Person Household | 540 | 17.6% |
| 4+ Person Household | 818 | 26.7% |
| Total Housing Units | 3,066 | 100.0% |
Occupancy by Ownership by Household Size in Montvale borough
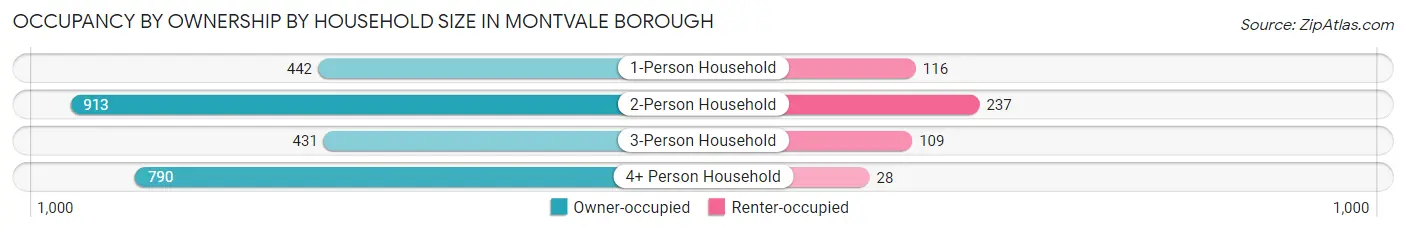
| Household Size | Owner-occupied | Renter-occupied |
| 1-Person Household | 442 (79.2%) | 116 (20.8%) |
| 2-Person Household | 913 (79.4%) | 237 (20.6%) |
| 3-Person Household | 431 (79.8%) | 109 (20.2%) |
| 4+ Person Household | 790 (96.6%) | 28 (3.4%) |
| Total Housing Units | 2,576 (84.0%) | 490 (16.0%) |
Occupancy by Educational Attainment in Montvale borough
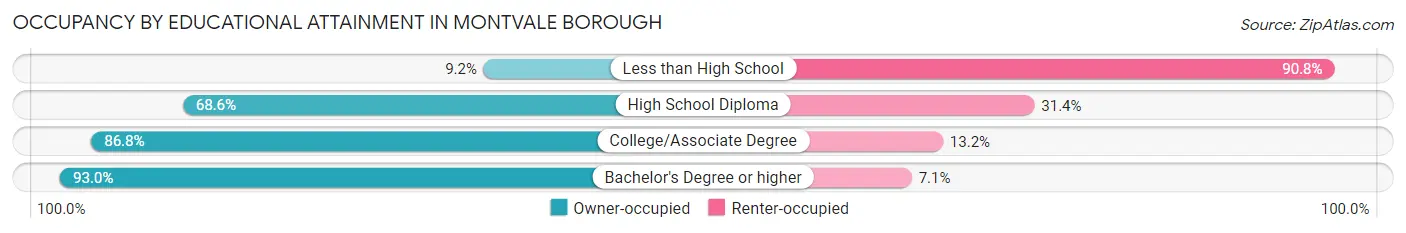
| Household Size | Owner-occupied | Renter-occupied |
| Less than High School | 12 (9.2%) | 119 (90.8%) |
| High School Diploma | 326 (68.6%) | 149 (31.4%) |
| College/Associate Degree | 682 (86.8%) | 104 (13.2%) |
| Bachelor's Degree or higher | 1,556 (92.9%) | 118 (7.0%) |
Occupancy by Age of Householder in Montvale borough
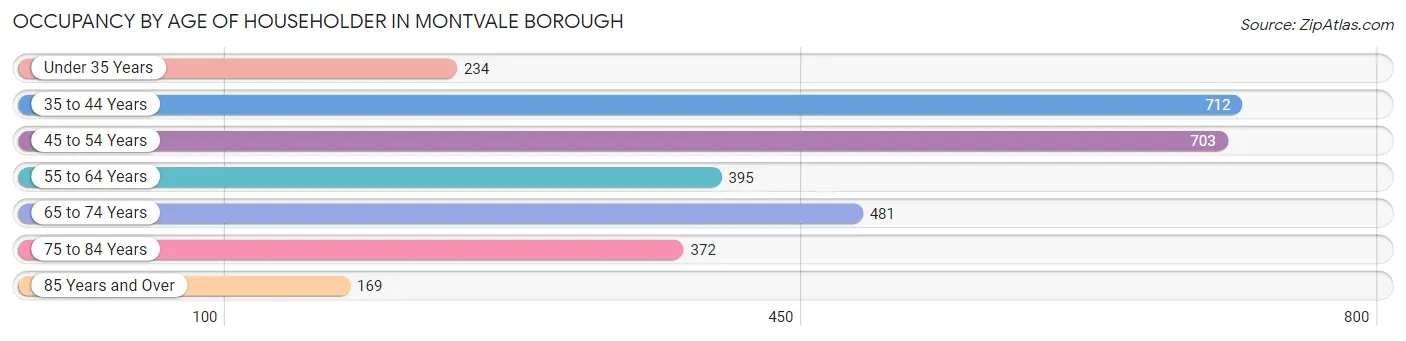
| Age Bracket | # Households | % Households |
| Under 35 Years | 234 | 7.6% |
| 35 to 44 Years | 712 | 23.2% |
| 45 to 54 Years | 703 | 22.9% |
| 55 to 64 Years | 395 | 12.9% |
| 65 to 74 Years | 481 | 15.7% |
| 75 to 84 Years | 372 | 12.1% |
| 85 Years and Over | 169 | 5.5% |
| Total | 3,066 | 100.0% |
Housing Finances in Montvale borough
Median Income by Occupancy in Montvale borough
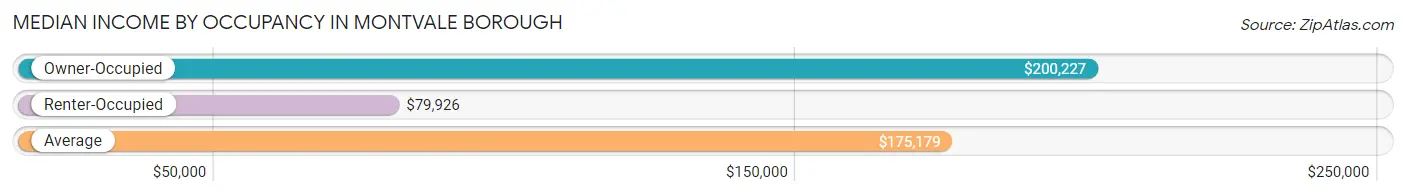
| Occupancy Type | # Households | Median Income |
| Owner-Occupied | 2,576 (84.0%) | $200,227 |
| Renter-Occupied | 490 (16.0%) | $79,926 |
| Average | 3,066 (100.0%) | $175,179 |
Occupancy by Householder Income Bracket in Montvale borough
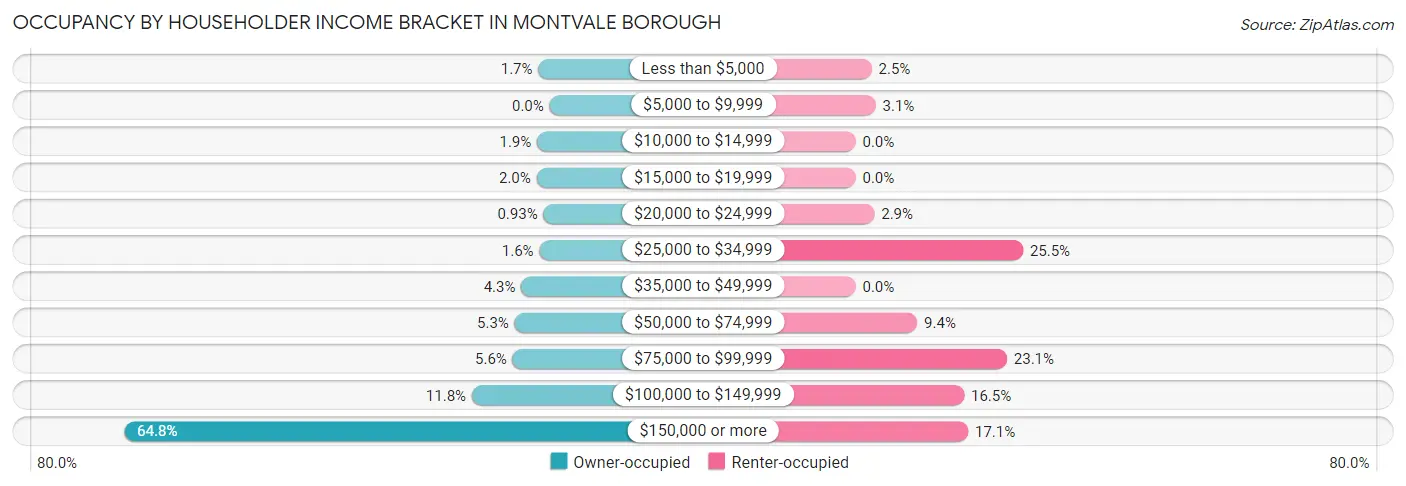
| Income Bracket | Owner-occupied | Renter-occupied |
| Less than $5,000 | 44 (1.7%) | 12 (2.5%) |
| $5,000 to $9,999 | 0 (0.0%) | 15 (3.1%) |
| $10,000 to $14,999 | 49 (1.9%) | 0 (0.0%) |
| $15,000 to $19,999 | 51 (2.0%) | 0 (0.0%) |
| $20,000 to $24,999 | 24 (0.9%) | 14 (2.9%) |
| $25,000 to $34,999 | 40 (1.5%) | 125 (25.5%) |
| $35,000 to $49,999 | 111 (4.3%) | 0 (0.0%) |
| $50,000 to $74,999 | 137 (5.3%) | 46 (9.4%) |
| $75,000 to $99,999 | 145 (5.6%) | 113 (23.1%) |
| $100,000 to $149,999 | 305 (11.8%) | 81 (16.5%) |
| $150,000 or more | 1,670 (64.8%) | 84 (17.1%) |
| Total | 2,576 (100.0%) | 490 (100.0%) |
Monthly Housing Cost Tiers in Montvale borough
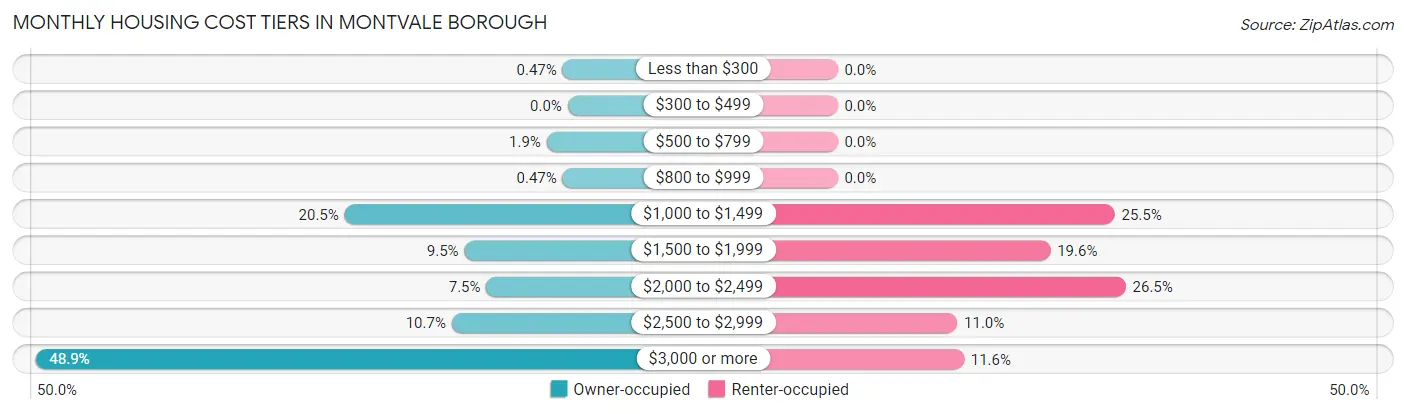
| Monthly Cost | Owner-occupied | Renter-occupied |
| Less than $300 | 12 (0.5%) | 0 (0.0%) |
| $300 to $499 | 0 (0.0%) | 0 (0.0%) |
| $500 to $799 | 50 (1.9%) | 0 (0.0%) |
| $800 to $999 | 12 (0.5%) | 0 (0.0%) |
| $1,000 to $1,499 | 529 (20.5%) | 125 (25.5%) |
| $1,500 to $1,999 | 245 (9.5%) | 96 (19.6%) |
| $2,000 to $2,499 | 193 (7.5%) | 130 (26.5%) |
| $2,500 to $2,999 | 275 (10.7%) | 54 (11.0%) |
| $3,000 or more | 1,260 (48.9%) | 57 (11.6%) |
| Total | 2,576 (100.0%) | 490 (100.0%) |
Physical Housing Characteristics in Montvale borough
Housing Structures in Montvale borough
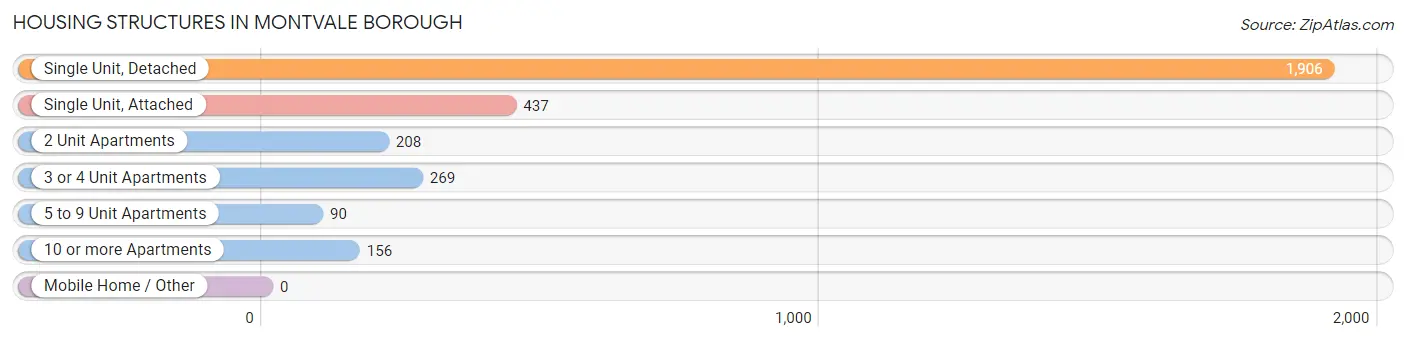
| Structure Type | # Housing Units | % Housing Units |
| Single Unit, Detached | 1,906 | 62.2% |
| Single Unit, Attached | 437 | 14.2% |
| 2 Unit Apartments | 208 | 6.8% |
| 3 or 4 Unit Apartments | 269 | 8.8% |
| 5 to 9 Unit Apartments | 90 | 2.9% |
| 10 or more Apartments | 156 | 5.1% |
| Mobile Home / Other | 0 | 0.0% |
| Total | 3,066 | 100.0% |
Housing Structures by Occupancy in Montvale borough
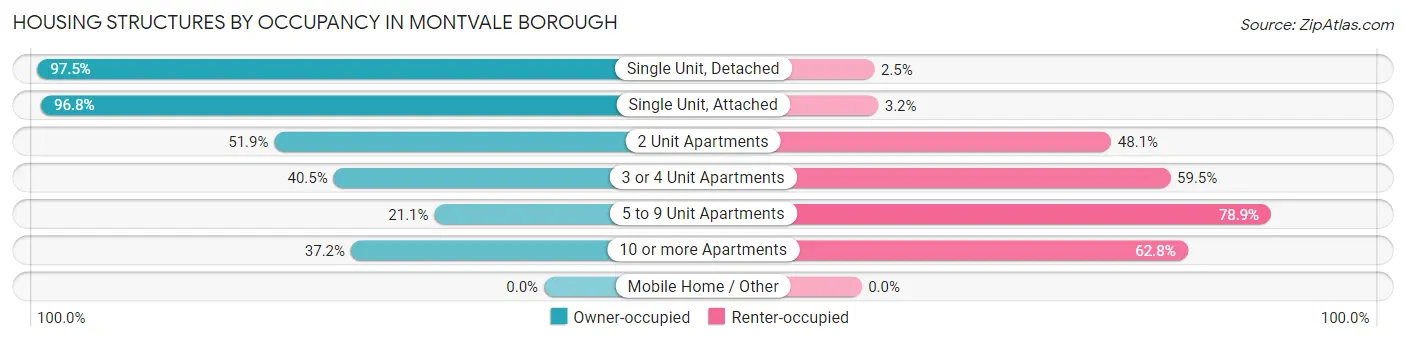
| Structure Type | Owner-occupied | Renter-occupied |
| Single Unit, Detached | 1,859 (97.5%) | 47 (2.5%) |
| Single Unit, Attached | 423 (96.8%) | 14 (3.2%) |
| 2 Unit Apartments | 108 (51.9%) | 100 (48.1%) |
| 3 or 4 Unit Apartments | 109 (40.5%) | 160 (59.5%) |
| 5 to 9 Unit Apartments | 19 (21.1%) | 71 (78.9%) |
| 10 or more Apartments | 58 (37.2%) | 98 (62.8%) |
| Mobile Home / Other | 0 (0.0%) | 0 (0.0%) |
| Total | 2,576 (84.0%) | 490 (16.0%) |
Housing Structures by Number of Rooms in Montvale borough
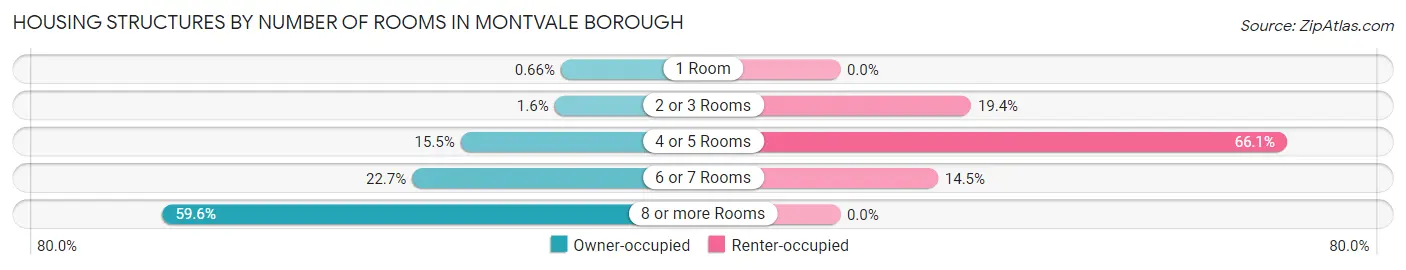
| Number of Rooms | Owner-occupied | Renter-occupied |
| 1 Room | 17 (0.7%) | 0 (0.0%) |
| 2 or 3 Rooms | 41 (1.6%) | 95 (19.4%) |
| 4 or 5 Rooms | 399 (15.5%) | 324 (66.1%) |
| 6 or 7 Rooms | 584 (22.7%) | 71 (14.5%) |
| 8 or more Rooms | 1,535 (59.6%) | 0 (0.0%) |
| Total | 2,576 (100.0%) | 490 (100.0%) |
Housing Structure by Heating Type in Montvale borough
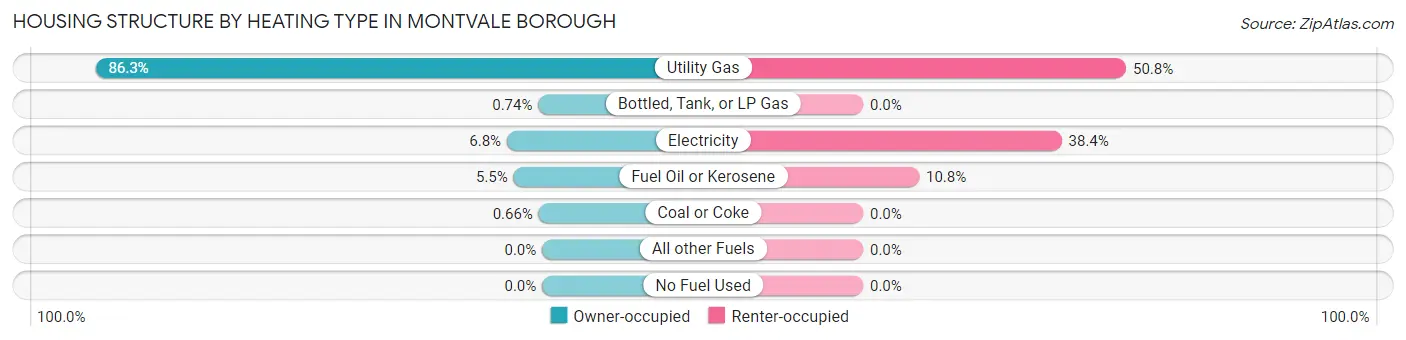
| Heating Type | Owner-occupied | Renter-occupied |
| Utility Gas | 2,223 (86.3%) | 249 (50.8%) |
| Bottled, Tank, or LP Gas | 19 (0.7%) | 0 (0.0%) |
| Electricity | 175 (6.8%) | 188 (38.4%) |
| Fuel Oil or Kerosene | 142 (5.5%) | 53 (10.8%) |
| Coal or Coke | 17 (0.7%) | 0 (0.0%) |
| All other Fuels | 0 (0.0%) | 0 (0.0%) |
| No Fuel Used | 0 (0.0%) | 0 (0.0%) |
| Total | 2,576 (100.0%) | 490 (100.0%) |
Household Vehicle Usage in Montvale borough
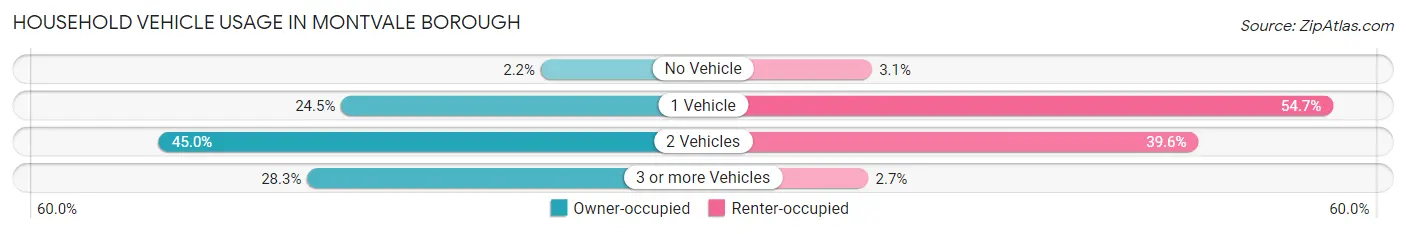
| Vehicles per Household | Owner-occupied | Renter-occupied |
| No Vehicle | 56 (2.2%) | 15 (3.1%) |
| 1 Vehicle | 632 (24.5%) | 268 (54.7%) |
| 2 Vehicles | 1,158 (45.0%) | 194 (39.6%) |
| 3 or more Vehicles | 730 (28.3%) | 13 (2.6%) |
| Total | 2,576 (100.0%) | 490 (100.0%) |
Real Estate & Mortgages in Montvale borough
Real Estate and Mortgage Overview in Montvale borough
| Characteristic | Without Mortgage | With Mortgage |
| Housing Units | 881 | 1,695 |
| Median Property Value | $639,700 | $694,000 |
| Median Household Income | $129,531 | $1,319 |
| Monthly Housing Costs | $1,396 | $1,237 |
| Real Estate Taxes | $10,001 | $0 |
Property Value by Mortgage Status in Montvale borough
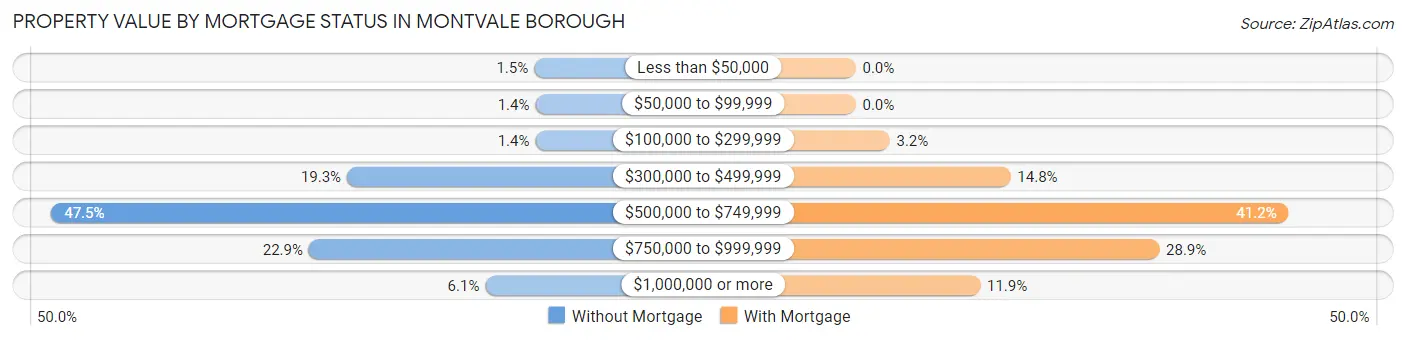
| Property Value | Without Mortgage | With Mortgage |
| Less than $50,000 | 13 (1.5%) | 0 (0.0%) |
| $50,000 to $99,999 | 12 (1.4%) | 0 (0.0%) |
| $100,000 to $299,999 | 12 (1.4%) | 55 (3.2%) |
| $300,000 to $499,999 | 170 (19.3%) | 250 (14.7%) |
| $500,000 to $749,999 | 418 (47.4%) | 699 (41.2%) |
| $750,000 to $999,999 | 202 (22.9%) | 490 (28.9%) |
| $1,000,000 or more | 54 (6.1%) | 201 (11.9%) |
| Total | 881 (100.0%) | 1,695 (100.0%) |
Household Income by Mortgage Status in Montvale borough
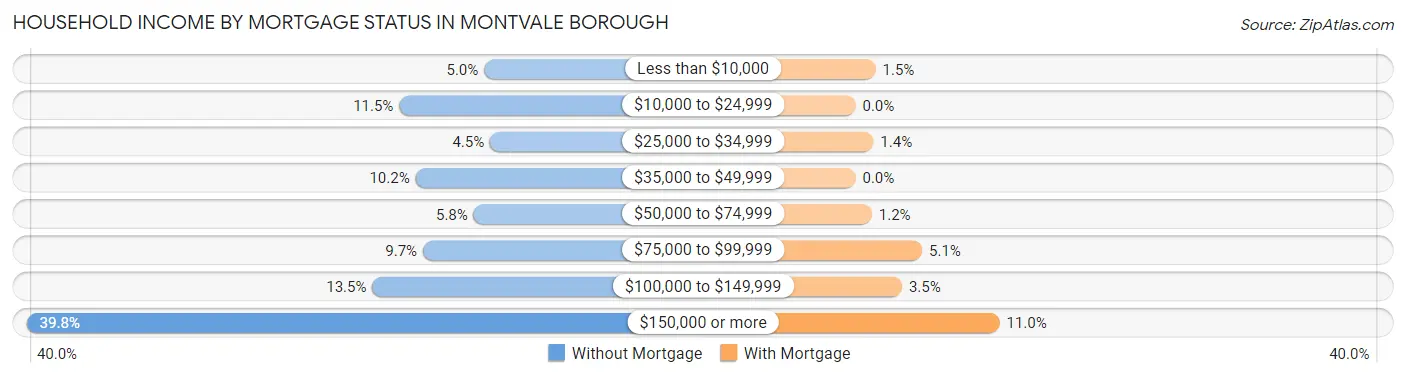
| Household Income | Without Mortgage | With Mortgage |
| Less than $10,000 | 44 (5.0%) | 26 (1.5%) |
| $10,000 to $24,999 | 101 (11.5%) | 0 (0.0%) |
| $25,000 to $34,999 | 40 (4.5%) | 23 (1.4%) |
| $35,000 to $49,999 | 90 (10.2%) | 0 (0.0%) |
| $50,000 to $74,999 | 51 (5.8%) | 21 (1.2%) |
| $75,000 to $99,999 | 85 (9.7%) | 86 (5.1%) |
| $100,000 to $149,999 | 119 (13.5%) | 60 (3.5%) |
| $150,000 or more | 351 (39.8%) | 186 (11.0%) |
| Total | 881 (100.0%) | 1,695 (100.0%) |
Property Value to Household Income Ratio in Montvale borough
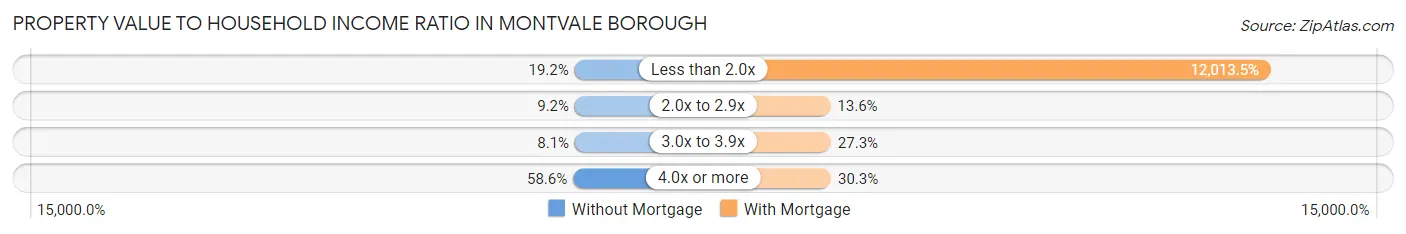
| Value-to-Income Ratio | Without Mortgage | With Mortgage |
| Less than 2.0x | 169 (19.2%) | 203,628 (12,013.5%) |
| 2.0x to 2.9x | 81 (9.2%) | 231 (13.6%) |
| 3.0x to 3.9x | 71 (8.1%) | 463 (27.3%) |
| 4.0x or more | 516 (58.6%) | 513 (30.3%) |
| Total | 881 (100.0%) | 1,695 (100.0%) |
Real Estate Taxes by Mortgage Status in Montvale borough
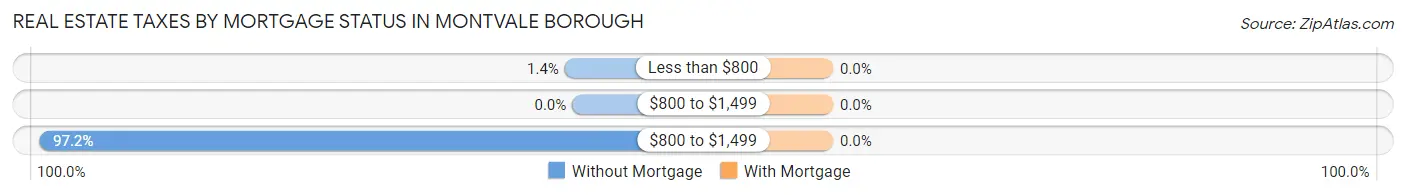
| Property Taxes | Without Mortgage | With Mortgage |
| Less than $800 | 12 (1.4%) | 0 (0.0%) |
| $800 to $1,499 | 0 (0.0%) | 0 (0.0%) |
| $800 to $1,499 | 856 (97.2%) | 0 (0.0%) |
| Total | 881 (100.0%) | 1,695 (100.0%) |
Health & Disability in Montvale borough
Health Insurance Coverage by Age in Montvale borough
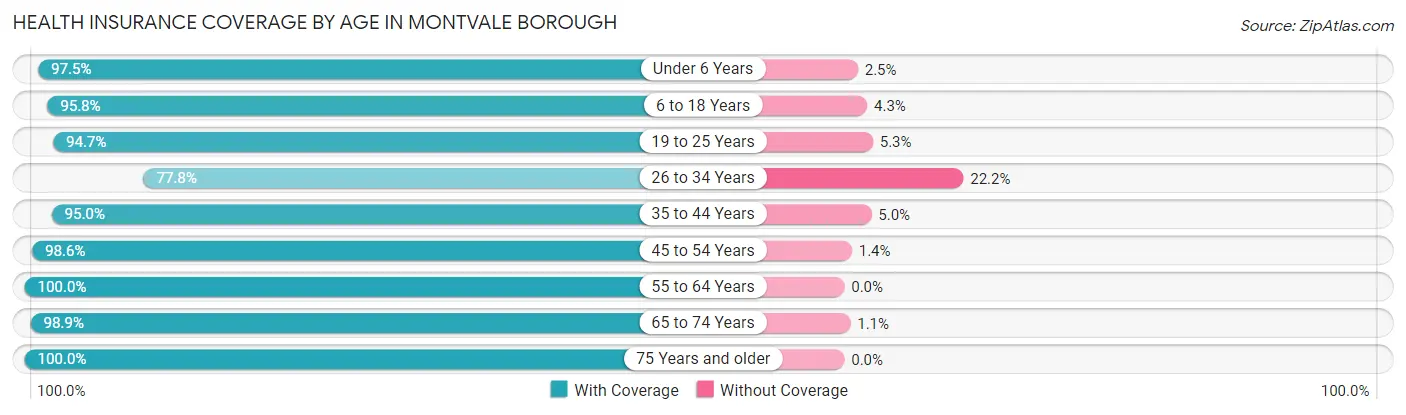
| Age Bracket | With Coverage | Without Coverage |
| Under 6 Years | 426 (97.5%) | 11 (2.5%) |
| 6 to 18 Years | 1,330 (95.8%) | 59 (4.3%) |
| 19 to 25 Years | 535 (94.7%) | 30 (5.3%) |
| 26 to 34 Years | 554 (77.8%) | 158 (22.2%) |
| 35 to 44 Years | 1,206 (95.0%) | 64 (5.0%) |
| 45 to 54 Years | 1,474 (98.6%) | 21 (1.4%) |
| 55 to 64 Years | 804 (100.0%) | 0 (0.0%) |
| 65 to 74 Years | 881 (98.9%) | 10 (1.1%) |
| 75 Years and older | 850 (100.0%) | 0 (0.0%) |
| Total | 8,060 (95.8%) | 353 (4.2%) |
Health Insurance Coverage by Citizenship Status in Montvale borough
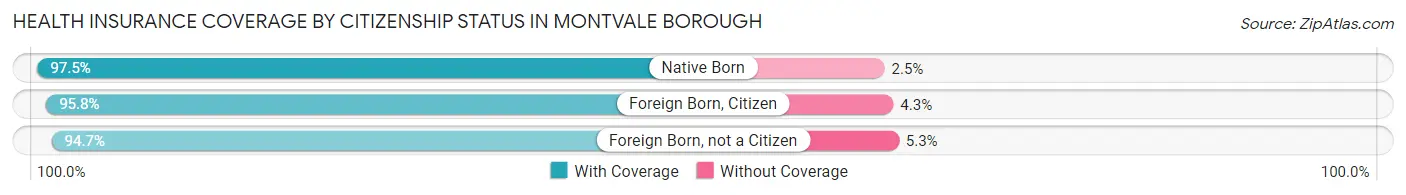
| Citizenship Status | With Coverage | Without Coverage |
| Native Born | 426 (97.5%) | 11 (2.5%) |
| Foreign Born, Citizen | 1,330 (95.8%) | 59 (4.3%) |
| Foreign Born, not a Citizen | 535 (94.7%) | 30 (5.3%) |
Health Insurance Coverage by Household Income in Montvale borough
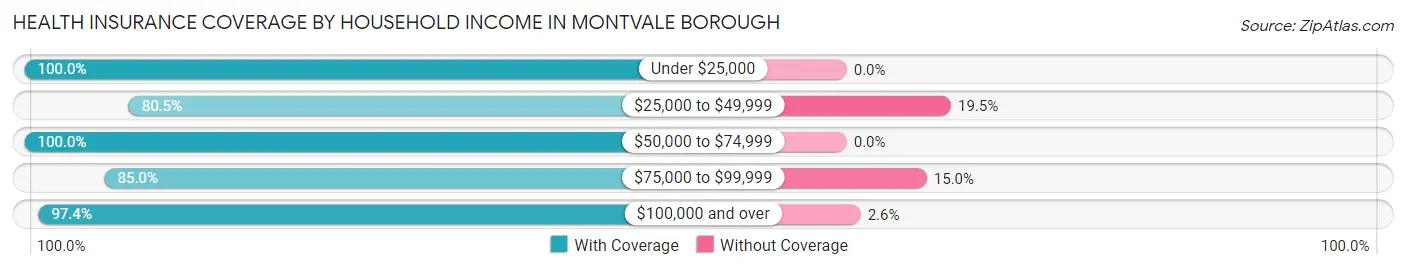
| Household Income | With Coverage | Without Coverage |
| Under $25,000 | 274 (100.0%) | 0 (0.0%) |
| $25,000 to $49,999 | 379 (80.5%) | 92 (19.5%) |
| $50,000 to $74,999 | 314 (100.0%) | 0 (0.0%) |
| $75,000 to $99,999 | 476 (85.0%) | 84 (15.0%) |
| $100,000 and over | 6,608 (97.4%) | 177 (2.6%) |
Public vs Private Health Insurance Coverage by Age in Montvale borough
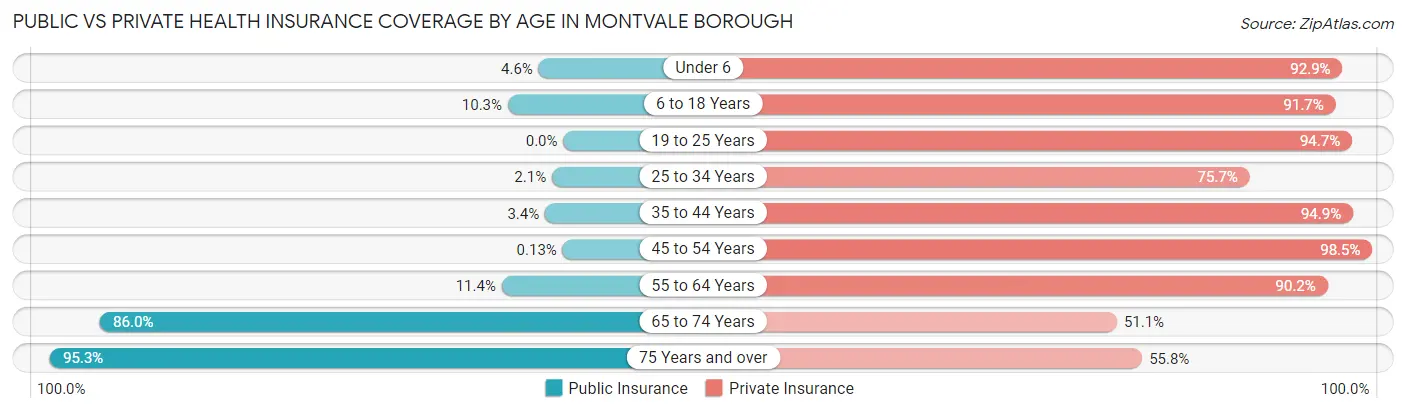
| Age Bracket | Public Insurance | Private Insurance |
| Under 6 | 20 (4.6%) | 406 (92.9%) |
| 6 to 18 Years | 143 (10.3%) | 1,273 (91.6%) |
| 19 to 25 Years | 0 (0.0%) | 535 (94.7%) |
| 25 to 34 Years | 15 (2.1%) | 539 (75.7%) |
| 35 to 44 Years | 43 (3.4%) | 1,205 (94.9%) |
| 45 to 54 Years | 2 (0.1%) | 1,472 (98.5%) |
| 55 to 64 Years | 92 (11.4%) | 725 (90.2%) |
| 65 to 74 Years | 766 (86.0%) | 455 (51.1%) |
| 75 Years and over | 810 (95.3%) | 474 (55.8%) |
| Total | 1,891 (22.5%) | 7,084 (84.2%) |
Disability Status by Sex by Age in Montvale borough
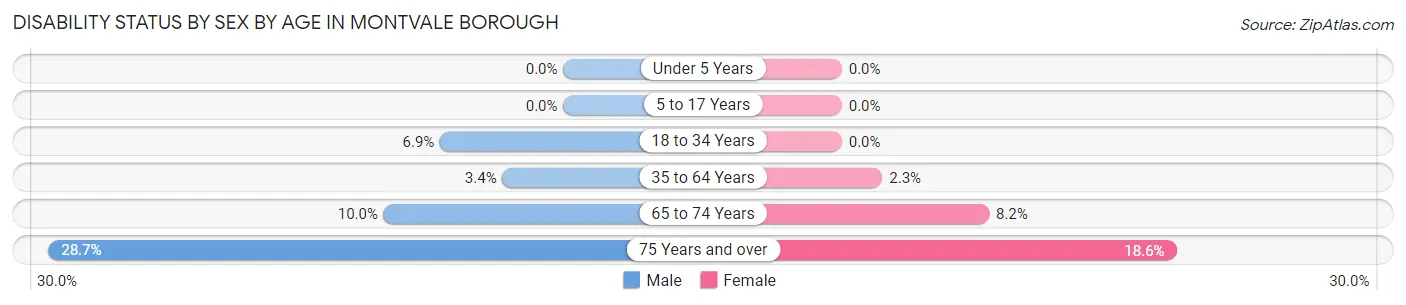
| Age Bracket | Male | Female |
| Under 5 Years | 0 (0.0%) | 0 (0.0%) |
| 5 to 17 Years | 0 (0.0%) | 0 (0.0%) |
| 18 to 34 Years | 33 (6.9%) | 0 (0.0%) |
| 35 to 64 Years | 67 (3.4%) | 36 (2.3%) |
| 65 to 74 Years | 44 (10.0%) | 37 (8.2%) |
| 75 Years and over | 76 (28.7%) | 109 (18.6%) |
Disability Class by Sex by Age in Montvale borough
Disability Class: Hearing Difficulty
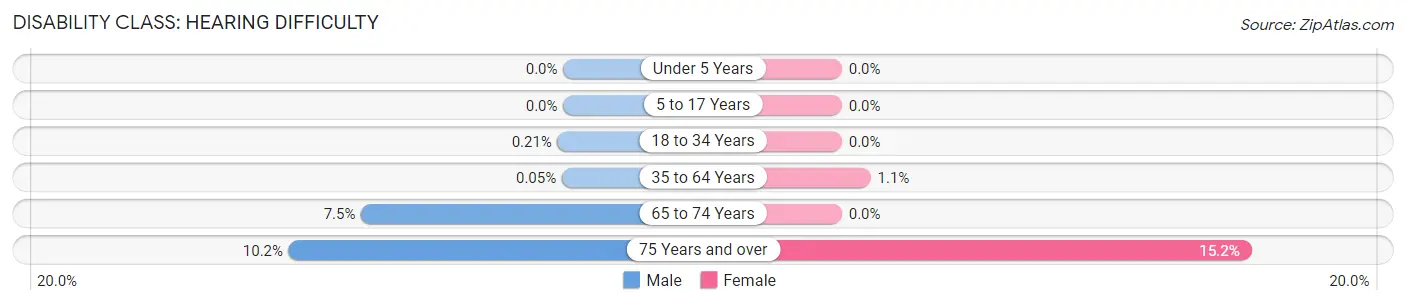
| Age Bracket | Male | Female |
| Under 5 Years | 0 (0.0%) | 0 (0.0%) |
| 5 to 17 Years | 0 (0.0%) | 0 (0.0%) |
| 18 to 34 Years | 1 (0.2%) | 0 (0.0%) |
| 35 to 64 Years | 1 (0.1%) | 17 (1.1%) |
| 65 to 74 Years | 33 (7.5%) | 0 (0.0%) |
| 75 Years and over | 27 (10.2%) | 89 (15.2%) |
Disability Class: Vision Difficulty
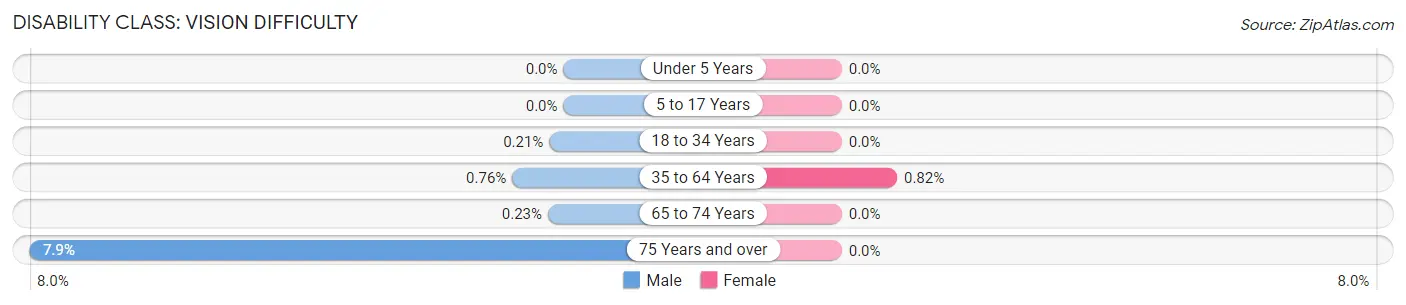
| Age Bracket | Male | Female |
| Under 5 Years | 0 (0.0%) | 0 (0.0%) |
| 5 to 17 Years | 0 (0.0%) | 0 (0.0%) |
| 18 to 34 Years | 1 (0.2%) | 0 (0.0%) |
| 35 to 64 Years | 15 (0.8%) | 13 (0.8%) |
| 65 to 74 Years | 1 (0.2%) | 0 (0.0%) |
| 75 Years and over | 21 (7.9%) | 0 (0.0%) |
Disability Class: Cognitive Difficulty
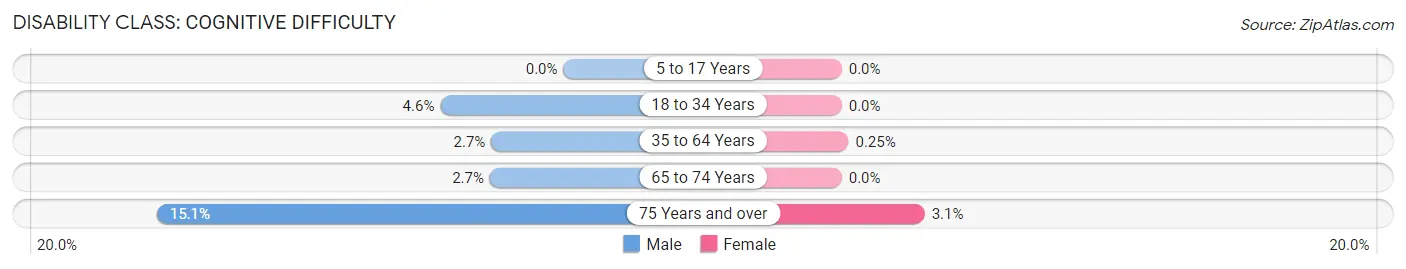
| Age Bracket | Male | Female |
| 5 to 17 Years | 0 (0.0%) | 0 (0.0%) |
| 18 to 34 Years | 22 (4.6%) | 0 (0.0%) |
| 35 to 64 Years | 53 (2.7%) | 4 (0.3%) |
| 65 to 74 Years | 12 (2.7%) | 0 (0.0%) |
| 75 Years and over | 40 (15.1%) | 18 (3.1%) |
Disability Class: Ambulatory Difficulty
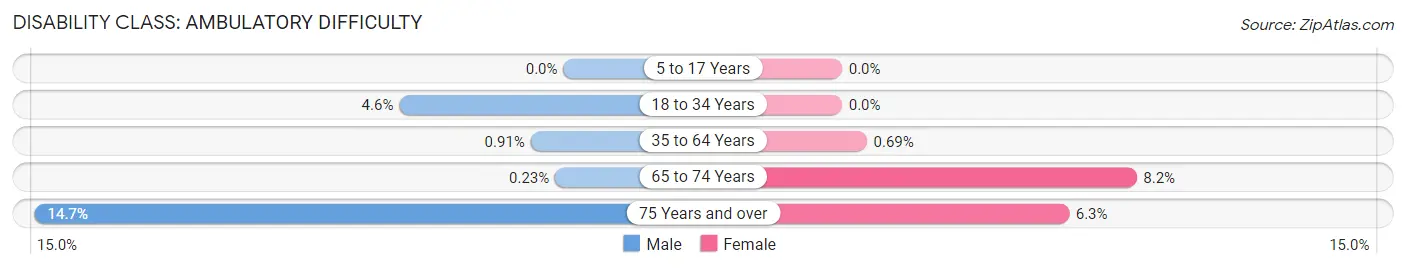
| Age Bracket | Male | Female |
| 5 to 17 Years | 0 (0.0%) | 0 (0.0%) |
| 18 to 34 Years | 22 (4.6%) | 0 (0.0%) |
| 35 to 64 Years | 18 (0.9%) | 11 (0.7%) |
| 65 to 74 Years | 1 (0.2%) | 37 (8.2%) |
| 75 Years and over | 39 (14.7%) | 37 (6.3%) |
Disability Class: Self-Care Difficulty
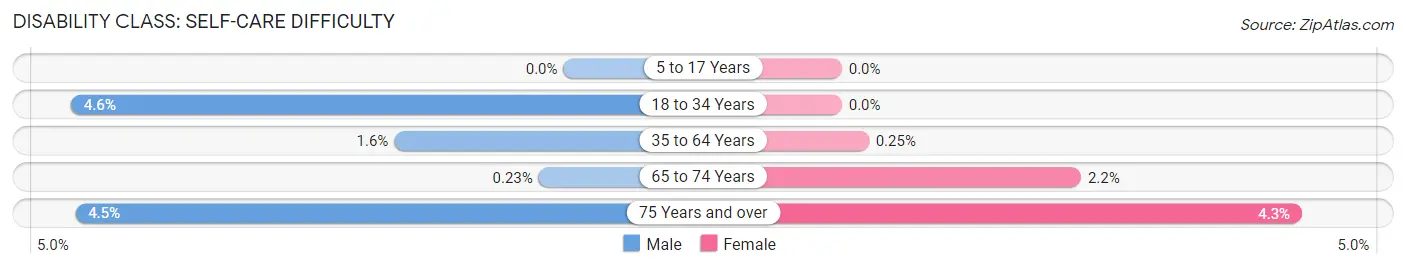
| Age Bracket | Male | Female |
| 5 to 17 Years | 0 (0.0%) | 0 (0.0%) |
| 18 to 34 Years | 22 (4.6%) | 0 (0.0%) |
| 35 to 64 Years | 31 (1.6%) | 4 (0.3%) |
| 65 to 74 Years | 1 (0.2%) | 10 (2.2%) |
| 75 Years and over | 12 (4.5%) | 25 (4.3%) |
Technology Access in Montvale borough
Computing Device Access in Montvale borough
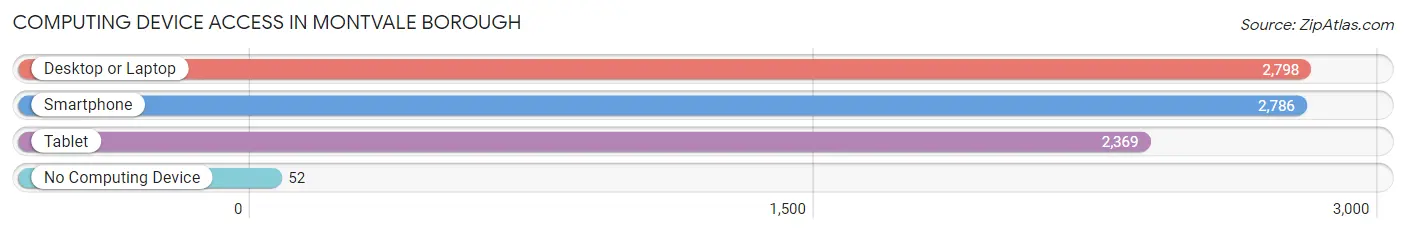
| Device Type | # Households | % Households |
| Desktop or Laptop | 2,798 | 91.3% |
| Smartphone | 2,786 | 90.9% |
| Tablet | 2,369 | 77.3% |
| No Computing Device | 52 | 1.7% |
| Total | 3,066 | 100.0% |
Internet Access in Montvale borough
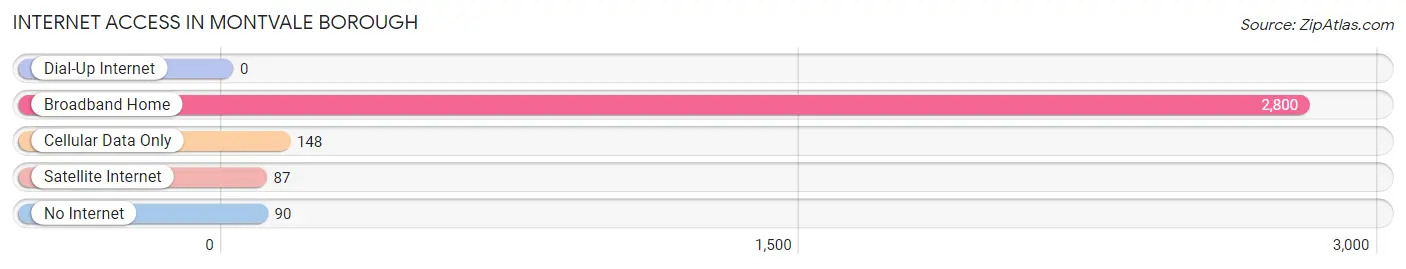
| Internet Type | # Households | % Households |
| Dial-Up Internet | 0 | 0.0% |
| Broadband Home | 2,800 | 91.3% |
| Cellular Data Only | 148 | 4.8% |
| Satellite Internet | 87 | 2.8% |
| No Internet | 90 | 2.9% |
| Total | 3,066 | 100.0% |
Montvale borough Summary
Montvale Borough is a small borough located in Bergen County, New Jersey. It is situated in the northern part of the state, approximately 25 miles northwest of New York City. The borough is bordered by Park Ridge, Woodcliff Lake, Upper Saddle River, and Washington Township. As of the 2010 United States Census, the borough had a total population of 7,744.
History
The area that is now Montvale was originally inhabited by the Lenni Lenape Native Americans. The first European settlers arrived in the area in the late 17th century. The area was part of the larger Saddle River Township, which was established in 1716. In 1894, the area was incorporated as the Borough of Montvale. The name of the borough is derived from the French words “mont” and “vale”, which mean “mountain” and “valley”, respectively.
Geography
Montvale is located at 40°58'N 74°7'W (40.967, -74.117). According to the United States Census Bureau, the borough has a total area of 3.3 square miles, all of which is land. The borough is located in the Ramapo Mountains, and is home to several small lakes and streams.
Economy
Montvale is a primarily residential community, and the majority of its residents are employed in the nearby cities of New York and Newark. The borough is home to several corporate headquarters, including the global headquarters of Mercedes-Benz USA, which is located in the borough. Other major employers in the borough include the Montvale Plaza Shopping Center, the Montvale Public Library, and the Montvale Fire Department.
Demographics
As of the 2010 United States Census, there were 7,744 people, 2,717 households, and 2,093 families residing in the borough. The population density was 2,346.2 people per square mile. The racial makeup of the borough was 87.2% White, 1.2% African American, 0.1% Native American, 8.7% Asian, 0.1% Pacific Islander, 1.2% from other races, and 1.6% from two or more races. Hispanic or Latino of any race were 5.2% of the population.
The median income for a household in the borough was $107,917, and the median income for a family was $125,917. The per capita income for the borough was $50,917. About 1.7% of families and 2.3% of the population were below the poverty line, including 2.3% of those under age 18 and 2.3% of those age 65 or over.
Common Questions
What is Per Capita Income in Montvale borough?
Per Capita income in Montvale borough is $74,722.
What is the Median Family Income in Montvale borough?
Median Family Income in Montvale borough is $186,493.
What is the Median Household income in Montvale borough?
Median Household Income in Montvale borough is $175,179.
What is Income or Wage Gap in Montvale borough?
Income or Wage Gap in Montvale borough is 57.0%.
Women in Montvale borough earn 43.0 cents for every dollar earned by a man.
What is Inequality or Gini Index in Montvale borough?
Inequality or Gini Index in Montvale borough is 0.43.
What is the Total Population of Montvale borough?
Total Population of Montvale borough is 8,413.
What is the Total Male Population of Montvale borough?
Total Male Population of Montvale borough is 4,025.
What is the Total Female Population of Montvale borough?
Total Female Population of Montvale borough is 4,388.
What is the Ratio of Males per 100 Females in Montvale borough?
There are 91.73 Males per 100 Females in Montvale borough.
What is the Ratio of Females per 100 Males in Montvale borough?
There are 109.02 Females per 100 Males in Montvale borough.
What is the Median Population Age in Montvale borough?
Median Population Age in Montvale borough is 43.4 Years.
What is the Average Family Size in Montvale borough
Average Family Size in Montvale borough is 3.0 People.
What is the Average Household Size in Montvale borough
Average Household Size in Montvale borough is 2.7 People.
How Large is the Labor Force in Montvale borough?
There are 4,339 People in the Labor Forcein in Montvale borough.
What is the Percentage of People in the Labor Force in Montvale borough?
63.0% of People are in the Labor Force in Montvale borough.
What is the Unemployment Rate in Montvale borough?
Unemployment Rate in Montvale borough is 2.9%.