Zip Codes with the Highest Percentage of Families with Income Below $10,000 in Paterson, NJ
RELATED REPORTS & OPTIONS
Family Income | $0-10k
Paterson
Compare Zip Codes
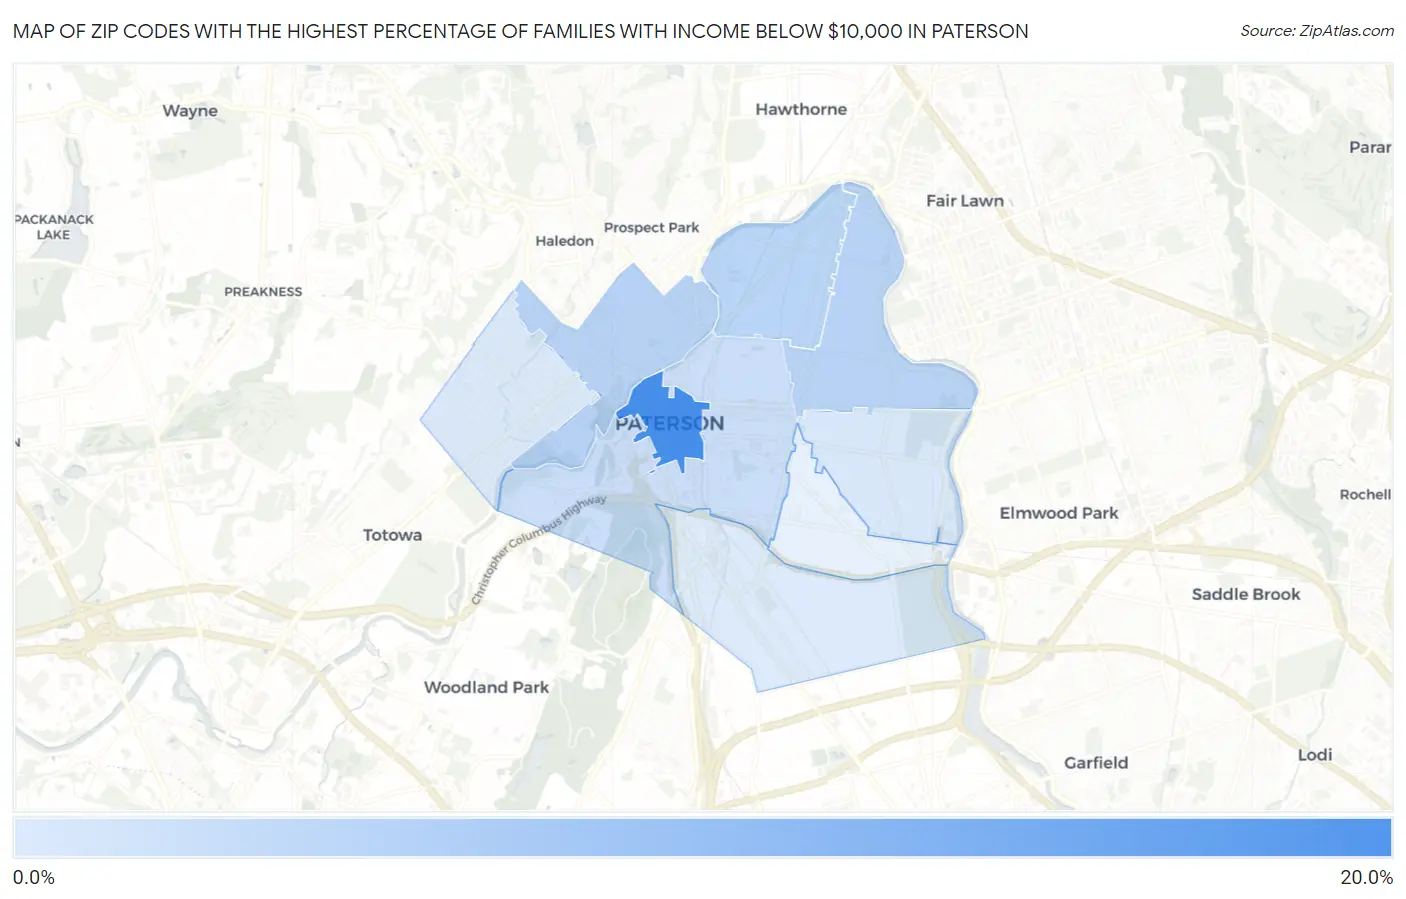
Map of Zip Codes with the Highest Percentage of Families with Income Below $10,000 in Paterson
4.8%
19.3%
Zip Codes with the Highest Percentage of Families with Income Below $10,000 in Paterson, NJ
| Zip Code | Families with Income < $10k | vs State | vs National | |
| 1. | 07505 | 19.3% | 2.4%(+16.9)#1 | 3.1%(+16.2)#512 |
| 2. | 07514 | 8.3% | 2.4%(+5.90)#16 | 3.1%(+5.20)#2,772 |
| 3. | 07522 | 8.1% | 2.4%(+5.70)#19 | 3.1%(+5.00)#2,905 |
| 4. | 07524 | 8.0% | 2.4%(+5.60)#21 | 3.1%(+4.90)#2,958 |
| 5. | 07501 | 6.5% | 2.4%(+4.10)#34 | 3.1%(+3.40)#4,099 |
| 6. | 07504 | 5.2% | 2.4%(+2.80)#52 | 3.1%(+2.10)#5,794 |
| 7. | 07503 | 4.8% | 2.4%(+2.40)#57 | 3.1%(+1.70)#6,464 |
| 8. | 07502 | 4.8% | 2.4%(+2.40)#58 | 3.1%(+1.70)#6,475 |
1
Common Questions
What are the Top 5 Zip Codes with the Highest Percentage of Families with Income Below $10,000 in Paterson, NJ?
Top 5 Zip Codes with the Highest Percentage of Families with Income Below $10,000 in Paterson, NJ are:
What zip code has the Highest Percentage of Families with Income Below $10,000 in Paterson, NJ?
07505 has the Highest Percentage of Families with Income Below $10,000 in Paterson, NJ with 19.3%.
What is the Percentage of Families with Income Below $10,000 in Paterson, NJ?
Percentage of Families with Income Below $10,000 in Paterson is 6.4%.
What is the Percentage of Families with Income Below $10,000 in New Jersey?
Percentage of Families with Income Below $10,000 in New Jersey is 2.4%.
What is the Percentage of Families with Income Below $10,000 in the United States?
Percentage of Families with Income Below $10,000 in the United States is 3.1%.