Englishtown borough, NJ Map & Demographics
Englishtown borough Overview
$48,523
PER CAPITA INCOME
$114,556
AVG FAMILY INCOME
$101,750
AVG HOUSEHOLD INCOME
33.6%
WAGE / INCOME GAP [ % ]
66.4¢/ $1
WAGE / INCOME GAP [ $ ]
$9,594
FAMILY INCOME DEFICIT
0.49
INEQUALITY / GINI INDEX
2,129
TOTAL POPULATION
1,048
MALE POPULATION
1,081
FEMALE POPULATION
96.95
MALES / 100 FEMALES
103.15
FEMALES / 100 MALES
37.9
MEDIAN AGE
3.2
AVG FAMILY SIZE
2.8
AVG HOUSEHOLD SIZE
1,170
LABOR FORCE [ PEOPLE ]
68.2%
PERCENT IN LABOR FORCE
8.3%
UNEMPLOYMENT RATE
Income in Englishtown borough
Income Overview in Englishtown borough
Per Capita Income in Englishtown borough is $48,523, while median incomes of families and households are $114,556 and $101,750 respectively.
| Characteristic | Number | Measure |
| Per Capita Income | 2,129 | $48,523 |
| Median Family Income | 523 | $114,556 |
| Mean Family Income | 523 | $162,856 |
| Median Household Income | 725 | $101,750 |
| Mean Household Income | 725 | $138,397 |
| Income Deficit | 523 | $9,594 |
| Wage / Income Gap (%) | 2,129 | 33.61% |
| Wage / Income Gap ($) | 2,129 | 66.39¢ per $1 |
| Gini / Inequality Index | 2,129 | 0.49 |
Earnings by Sex in Englishtown borough
Average Earnings in Englishtown borough are $55,788, $69,226 for men and $45,962 for women, a difference of 33.6%.
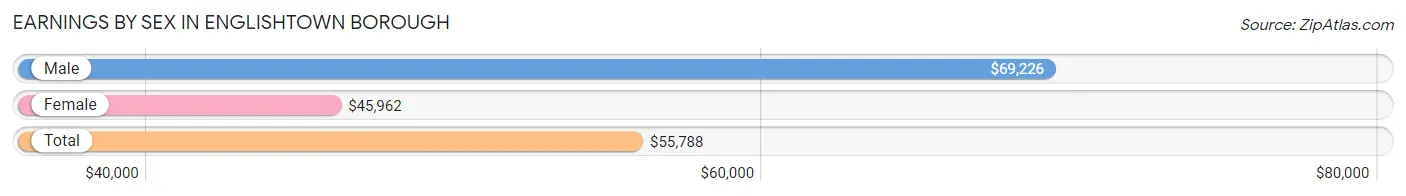
| Sex | Number | Average Earnings |
| Male | 625 (50.9%) | $69,226 |
| Female | 602 (49.1%) | $45,962 |
| Total | 1,227 (100.0%) | $55,788 |
Earnings by Sex by Income Bracket in Englishtown borough
The most common earnings brackets in Englishtown borough are $100,000+ for men (203 | 32.5%) and $75,000 to $99,999 for women (88 | 14.6%).
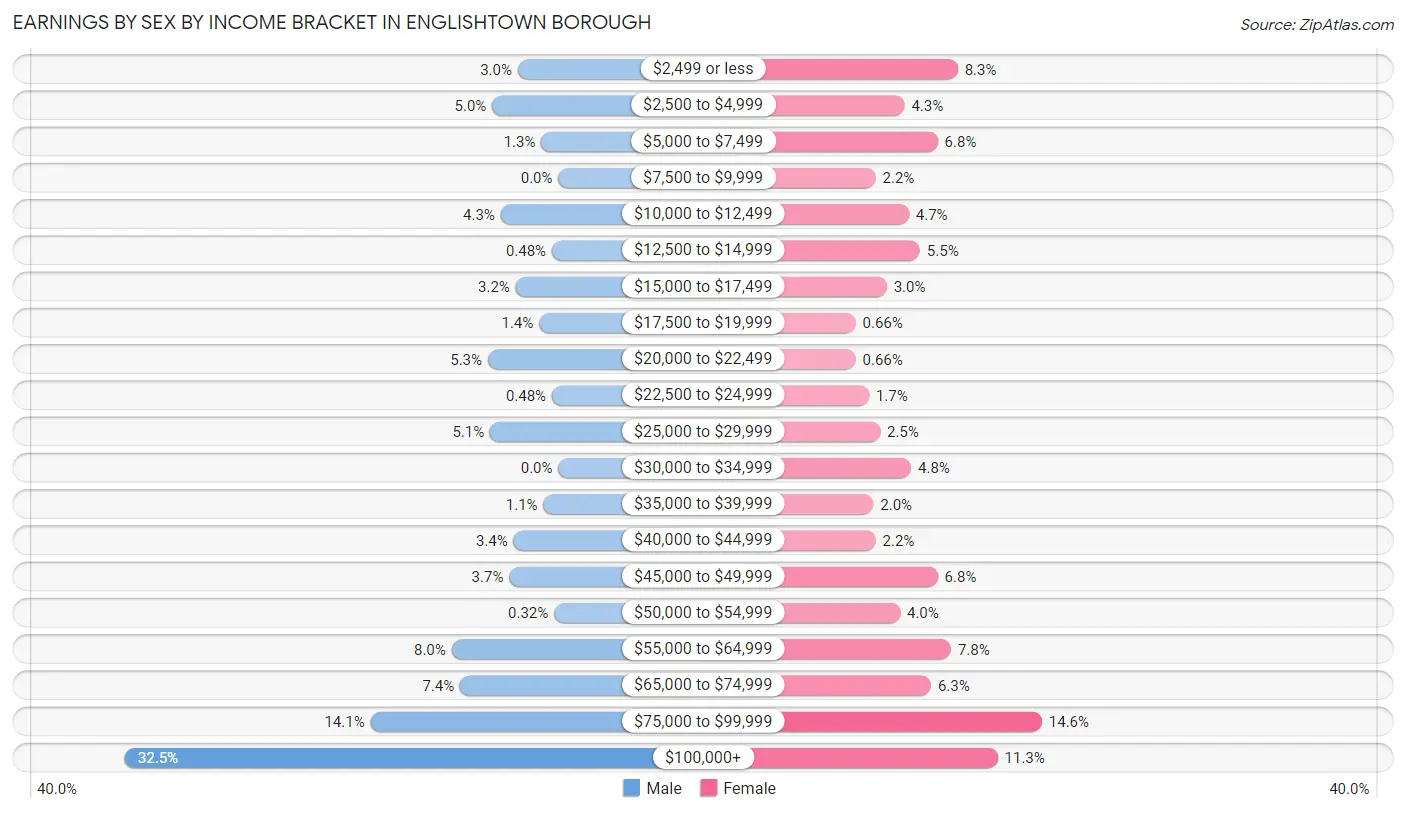
| Income | Male | Female |
| $2,499 or less | 19 (3.0%) | 50 (8.3%) |
| $2,500 to $4,999 | 31 (5.0%) | 26 (4.3%) |
| $5,000 to $7,499 | 8 (1.3%) | 41 (6.8%) |
| $7,500 to $9,999 | 0 (0.0%) | 13 (2.2%) |
| $10,000 to $12,499 | 27 (4.3%) | 28 (4.6%) |
| $12,500 to $14,999 | 3 (0.5%) | 33 (5.5%) |
| $15,000 to $17,499 | 20 (3.2%) | 18 (3.0%) |
| $17,500 to $19,999 | 9 (1.4%) | 4 (0.7%) |
| $20,000 to $22,499 | 33 (5.3%) | 4 (0.7%) |
| $22,500 to $24,999 | 3 (0.5%) | 10 (1.7%) |
| $25,000 to $29,999 | 32 (5.1%) | 15 (2.5%) |
| $30,000 to $34,999 | 0 (0.0%) | 29 (4.8%) |
| $35,000 to $39,999 | 7 (1.1%) | 12 (2.0%) |
| $40,000 to $44,999 | 21 (3.4%) | 13 (2.2%) |
| $45,000 to $49,999 | 23 (3.7%) | 41 (6.8%) |
| $50,000 to $54,999 | 2 (0.3%) | 24 (4.0%) |
| $55,000 to $64,999 | 50 (8.0%) | 47 (7.8%) |
| $65,000 to $74,999 | 46 (7.4%) | 38 (6.3%) |
| $75,000 to $99,999 | 88 (14.1%) | 88 (14.6%) |
| $100,000+ | 203 (32.5%) | 68 (11.3%) |
| Total | 625 (100.0%) | 602 (100.0%) |
Earnings by Sex by Educational Attainment in Englishtown borough
Average earnings in Englishtown borough are $92,500 for men and $51,071 for women, a difference of 44.8%. Men with an educational attainment of graduate degree enjoy the highest average annual earnings of $210,357, while those with high school diploma education earn the least with $59,000. Women with an educational attainment of graduate degree earn the most with the average annual earnings of $80,481, while those with less than high school education have the smallest earnings of $2,499.
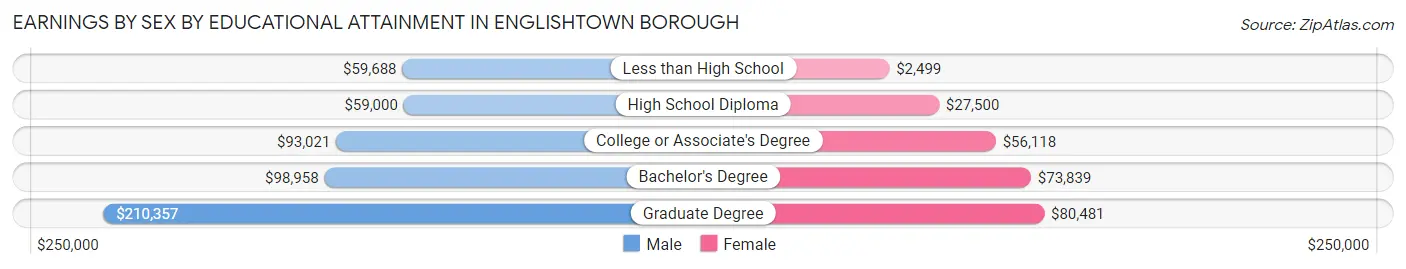
| Educational Attainment | Male Income | Female Income |
| Less than High School | $59,688 | $2,499 |
| High School Diploma | $59,000 | $27,500 |
| College or Associate's Degree | $93,021 | $56,118 |
| Bachelor's Degree | $98,958 | $73,839 |
| Graduate Degree | $210,357 | $80,481 |
| Total | $92,500 | $51,071 |
Family Income in Englishtown borough
Family Income Brackets in Englishtown borough
According to the Englishtown borough family income data, there are 158 families falling into the $200,000+ income range, which is the most common income bracket and makes up 30.2% of all families. Conversely, the $10,000 to $14,999 income bracket is the least frequent group with only 6 families (1.1%) belonging to this category.
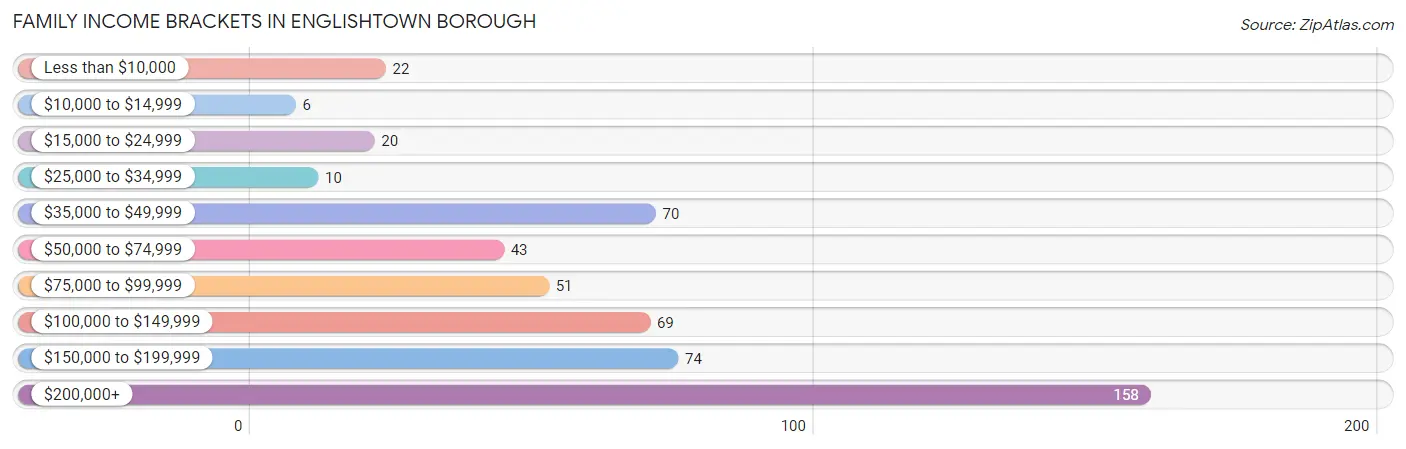
| Income Bracket | # Families | % Families |
| Less than $10,000 | 22 | 4.2% |
| $10,000 to $14,999 | 6 | 1.1% |
| $15,000 to $24,999 | 20 | 3.8% |
| $25,000 to $34,999 | 10 | 1.9% |
| $35,000 to $49,999 | 70 | 13.4% |
| $50,000 to $74,999 | 43 | 8.2% |
| $75,000 to $99,999 | 51 | 9.8% |
| $100,000 to $149,999 | 69 | 13.2% |
| $150,000 to $199,999 | 74 | 14.1% |
| $200,000+ | 158 | 30.2% |
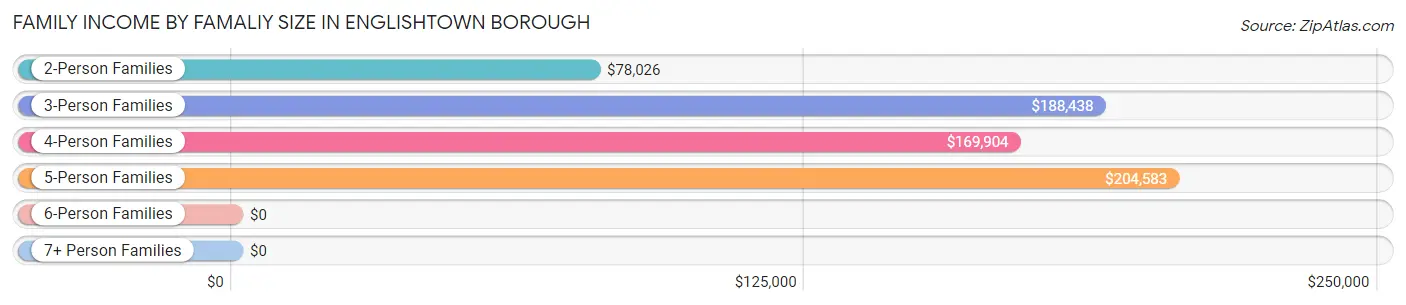
Family Income by Famaliy Size in Englishtown borough
5-person families (46 | 8.8%) account for the highest median family income in Englishtown borough with $204,583 per family, while 3-person families (160 | 30.6%) have the highest median income of $62,813 per family member.
| Income Bracket | # Families | Median Income |
| 2-Person Families | 190 (36.3%) | $78,026 |
| 3-Person Families | 160 (30.6%) | $188,438 |
| 4-Person Families | 127 (24.3%) | $169,904 |
| 5-Person Families | 46 (8.8%) | $204,583 |
| 6-Person Families | 0 (0.0%) | $0 |
| 7+ Person Families | 0 (0.0%) | $0 |
| Total | 523 (100.0%) | $114,556 |
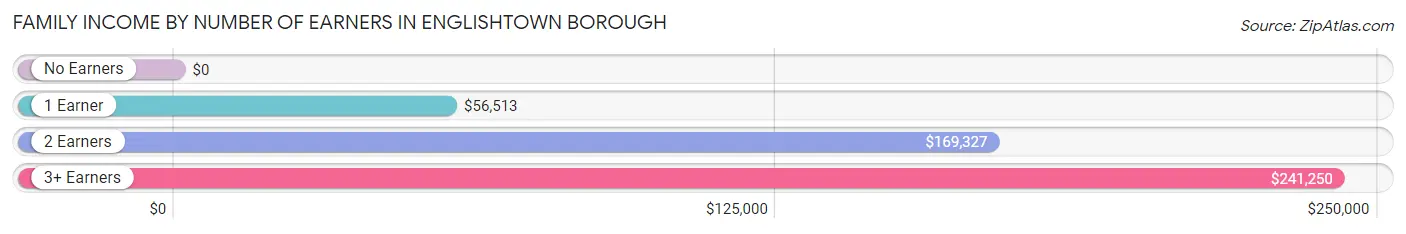
Family Income by Number of Earners in Englishtown borough
| Number of Earners | # Families | Median Income |
| No Earners | 18 (3.4%) | $0 |
| 1 Earner | 157 (30.0%) | $56,513 |
| 2 Earners | 241 (46.1%) | $169,327 |
| 3+ Earners | 107 (20.5%) | $241,250 |
| Total | 523 (100.0%) | $114,556 |
Household Income in Englishtown borough
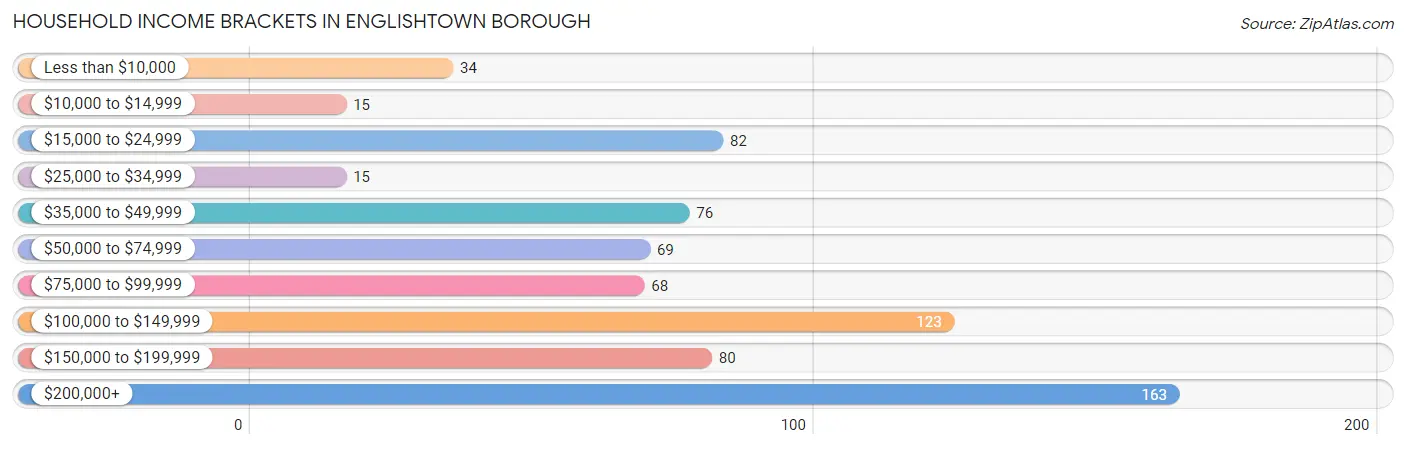
Household Income Brackets in Englishtown borough
With 163 households falling in the category, the $200,000+ income range is the most frequent in Englishtown borough, accounting for 22.5% of all households. In contrast, only 15 households (2.1%) fall into the $10,000 to $14,999 income bracket, making it the least populous group.
| Income Bracket | # Households | % Households |
| Less than $10,000 | 34 | 4.7% |
| $10,000 to $14,999 | 15 | 2.1% |
| $15,000 to $24,999 | 82 | 11.3% |
| $25,000 to $34,999 | 15 | 2.1% |
| $35,000 to $49,999 | 76 | 10.5% |
| $50,000 to $74,999 | 69 | 9.5% |
| $75,000 to $99,999 | 68 | 9.4% |
| $100,000 to $149,999 | 123 | 17.0% |
| $150,000 to $199,999 | 80 | 11.0% |
| $200,000+ | 163 | 22.5% |
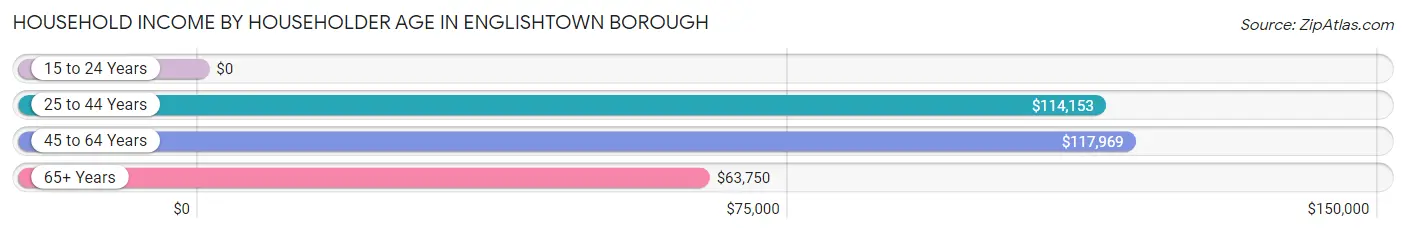
Household Income by Householder Age in Englishtown borough
The median household income in Englishtown borough is $101,750, with the highest median household income of $117,969 found in the 45 to 64 years age bracket for the primary householder. A total of 370 households (51.0%) fall into this category. Meanwhile, the 15 to 24 years age bracket for the primary householder has the lowest median household income of $0, with 12 households (1.7%) in this group.
| Income Bracket | # Households | Median Income |
| 15 to 24 Years | 12 (1.7%) | $0 |
| 25 to 44 Years | 201 (27.7%) | $114,153 |
| 45 to 64 Years | 370 (51.0%) | $117,969 |
| 65+ Years | 142 (19.6%) | $63,750 |
| Total | 725 (100.0%) | $101,750 |
Poverty in Englishtown borough
Income Below Poverty by Sex and Age in Englishtown borough
With 10.1% poverty level for males and 16.0% for females among the residents of Englishtown borough, 16 and 17 year old males and 75 year old and over females are the most vulnerable to poverty, with 32 males (46.4%) and 39 females (60.0%) in their respective age groups living below the poverty level.
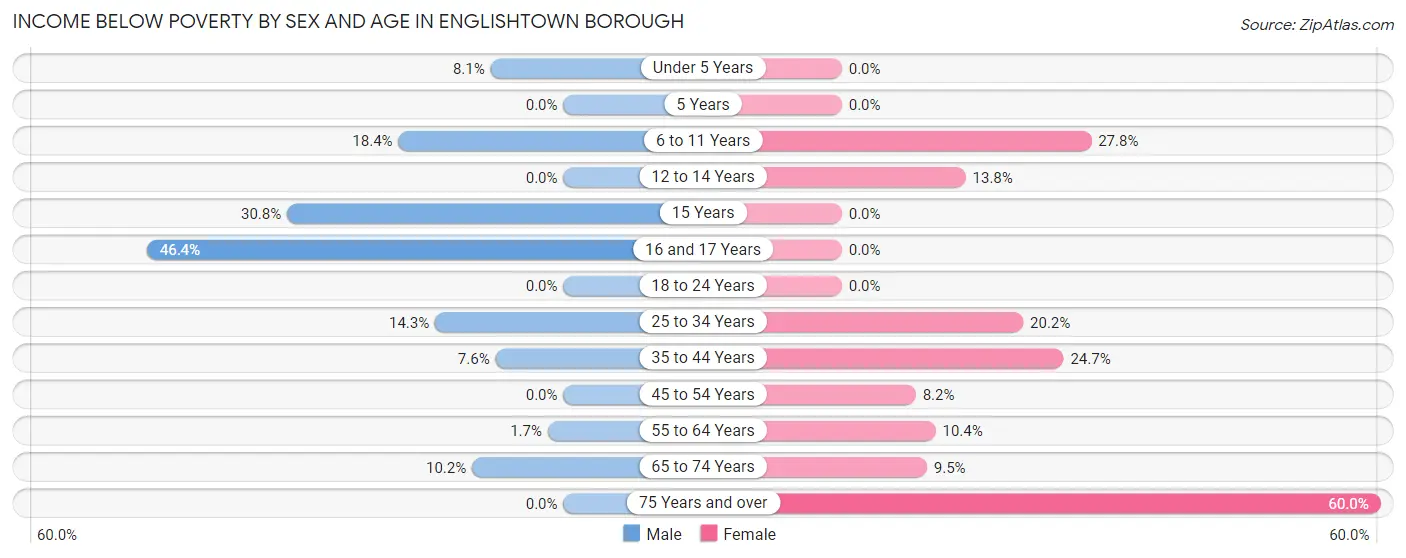
| Age Bracket | Male | Female |
| Under 5 Years | 3 (8.1%) | 0 (0.0%) |
| 5 Years | 0 (0.0%) | 0 (0.0%) |
| 6 to 11 Years | 9 (18.4%) | 20 (27.8%) |
| 12 to 14 Years | 0 (0.0%) | 4 (13.8%) |
| 15 Years | 24 (30.8%) | 0 (0.0%) |
| 16 and 17 Years | 32 (46.4%) | 0 (0.0%) |
| 18 to 24 Years | 0 (0.0%) | 0 (0.0%) |
| 25 to 34 Years | 18 (14.3%) | 21 (20.2%) |
| 35 to 44 Years | 9 (7.6%) | 40 (24.7%) |
| 45 to 54 Years | 0 (0.0%) | 13 (8.2%) |
| 55 to 64 Years | 3 (1.7%) | 19 (10.4%) |
| 65 to 74 Years | 6 (10.2%) | 9 (9.5%) |
| 75 Years and over | 0 (0.0%) | 39 (60.0%) |
| Total | 104 (10.1%) | 165 (16.0%) |
Income Above Poverty by Sex and Age in Englishtown borough
According to the poverty statistics in Englishtown borough, males aged 12 to 14 years and females aged under 5 years are the age groups that are most secure financially, with 100.0% of males and 100.0% of females in these age groups living above the poverty line.
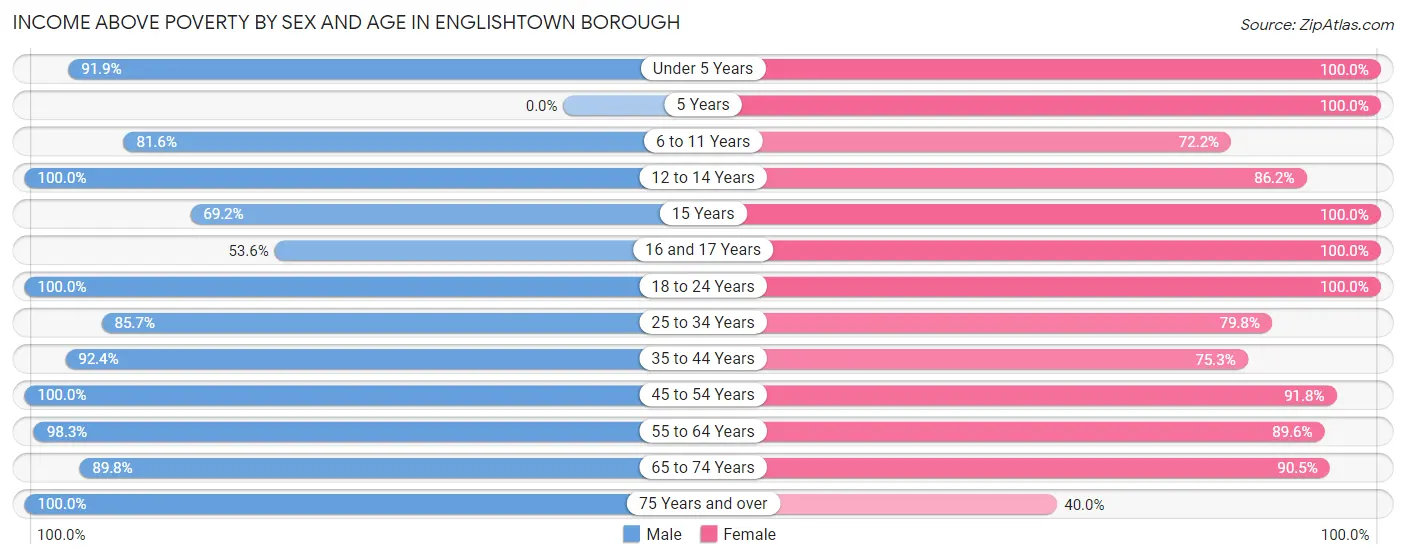
| Age Bracket | Male | Female |
| Under 5 Years | 34 (91.9%) | 26 (100.0%) |
| 5 Years | 0 (0.0%) | 5 (100.0%) |
| 6 to 11 Years | 40 (81.6%) | 52 (72.2%) |
| 12 to 14 Years | 66 (100.0%) | 25 (86.2%) |
| 15 Years | 54 (69.2%) | 13 (100.0%) |
| 16 and 17 Years | 37 (53.6%) | 5 (100.0%) |
| 18 to 24 Years | 107 (100.0%) | 118 (100.0%) |
| 25 to 34 Years | 108 (85.7%) | 83 (79.8%) |
| 35 to 44 Years | 110 (92.4%) | 122 (75.3%) |
| 45 to 54 Years | 130 (100.0%) | 145 (91.8%) |
| 55 to 64 Years | 170 (98.3%) | 163 (89.6%) |
| 65 to 74 Years | 53 (89.8%) | 86 (90.5%) |
| 75 Years and over | 17 (100.0%) | 26 (40.0%) |
| Total | 926 (89.9%) | 869 (84.0%) |
Income Below Poverty Among Married-Couple Families in Englishtown borough
The poverty statistics for married-couple families in Englishtown borough show that 8.3% or 31 of the total 375 families live below the poverty line. Families with 3 or 4 children have the highest poverty rate of 28.6%, comprising of 4 families. On the other hand, families with 1 or 2 children have the lowest poverty rate of 5.7%, which includes 9 families.
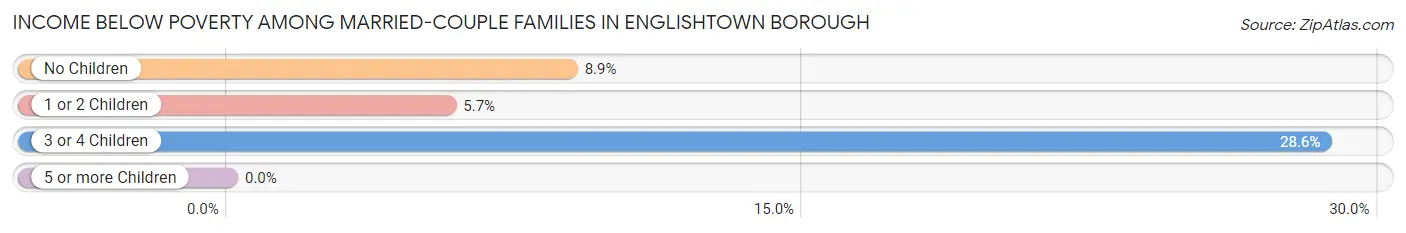
| Children | Above Poverty | Below Poverty |
| No Children | 185 (91.1%) | 18 (8.9%) |
| 1 or 2 Children | 149 (94.3%) | 9 (5.7%) |
| 3 or 4 Children | 10 (71.4%) | 4 (28.6%) |
| 5 or more Children | 0 (0.0%) | 0 (0.0%) |
| Total | 344 (91.7%) | 31 (8.3%) |
Income Below Poverty Among Single-Parent Households in Englishtown borough
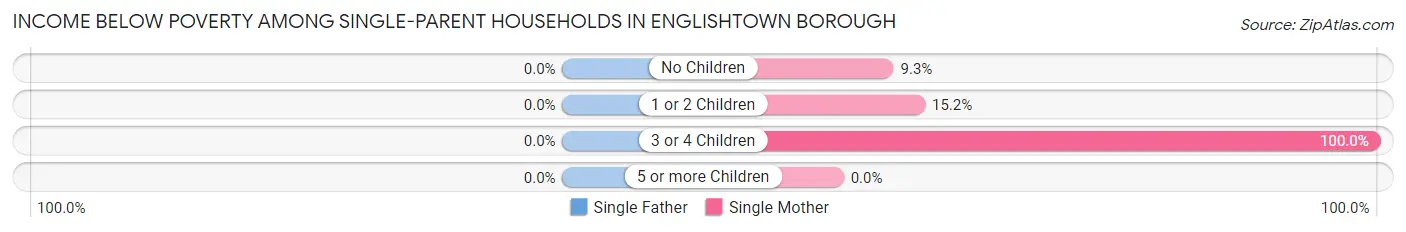
| Children | Single Father | Single Mother |
| No Children | 0 (0.0%) | 4 (9.3%) |
| 1 or 2 Children | 0 (0.0%) | 10 (15.1%) |
| 3 or 4 Children | 0 (0.0%) | 4 (100.0%) |
| 5 or more Children | 0 (0.0%) | 0 (0.0%) |
| Total | 0 (0.0%) | 18 (15.9%) |
Income Below Poverty Among Married-Couple vs Single-Parent Households in Englishtown borough
The poverty data for Englishtown borough shows that 31 of the married-couple family households (8.3%) and 18 of the single-parent households (12.2%) are living below the poverty level. Within the married-couple family households, those with 3 or 4 children have the highest poverty rate, with 4 households (28.6%) falling below the poverty line. Among the single-parent households, those with 3 or 4 children have the highest poverty rate, with 4 household (100.0%) living below poverty.
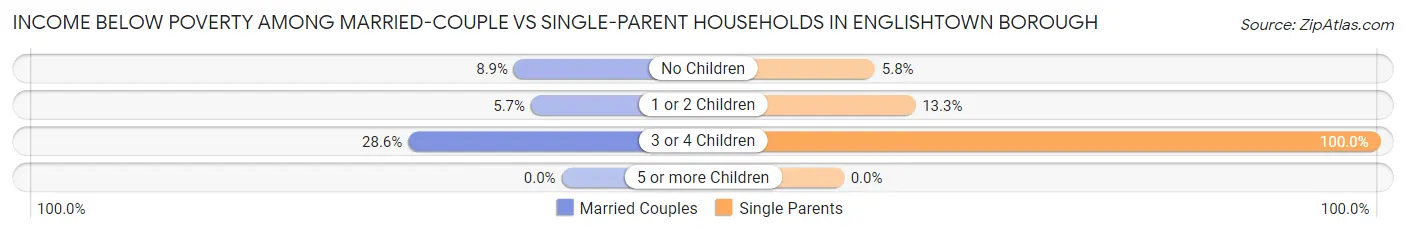
| Children | Married-Couple Families | Single-Parent Households |
| No Children | 18 (8.9%) | 4 (5.8%) |
| 1 or 2 Children | 9 (5.7%) | 10 (13.3%) |
| 3 or 4 Children | 4 (28.6%) | 4 (100.0%) |
| 5 or more Children | 0 (0.0%) | 0 (0.0%) |
| Total | 31 (8.3%) | 18 (12.2%) |
Race in Englishtown borough
The most populous races in Englishtown borough are White / Caucasian (1,605 | 75.4%), Hispanic or Latino (309 | 14.5%), and Asian (188 | 8.8%).
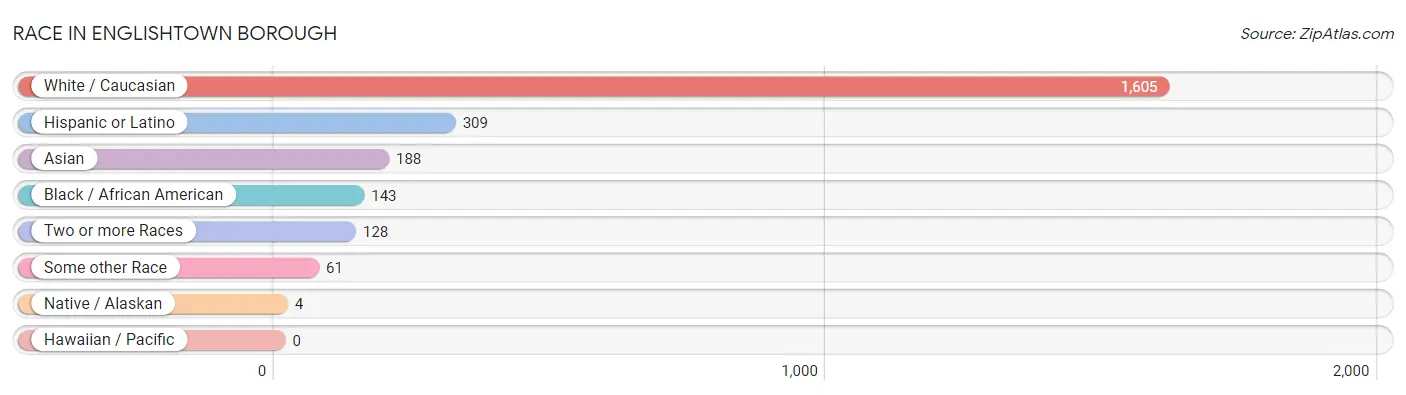
| Race | # Population | % Population |
| Asian | 188 | 8.8% |
| Black / African American | 143 | 6.7% |
| Hawaiian / Pacific | 0 | 0.0% |
| Hispanic or Latino | 309 | 14.5% |
| Native / Alaskan | 4 | 0.2% |
| White / Caucasian | 1,605 | 75.4% |
| Two or more Races | 128 | 6.0% |
| Some other Race | 61 | 2.9% |
| Total | 2,129 | 100.0% |
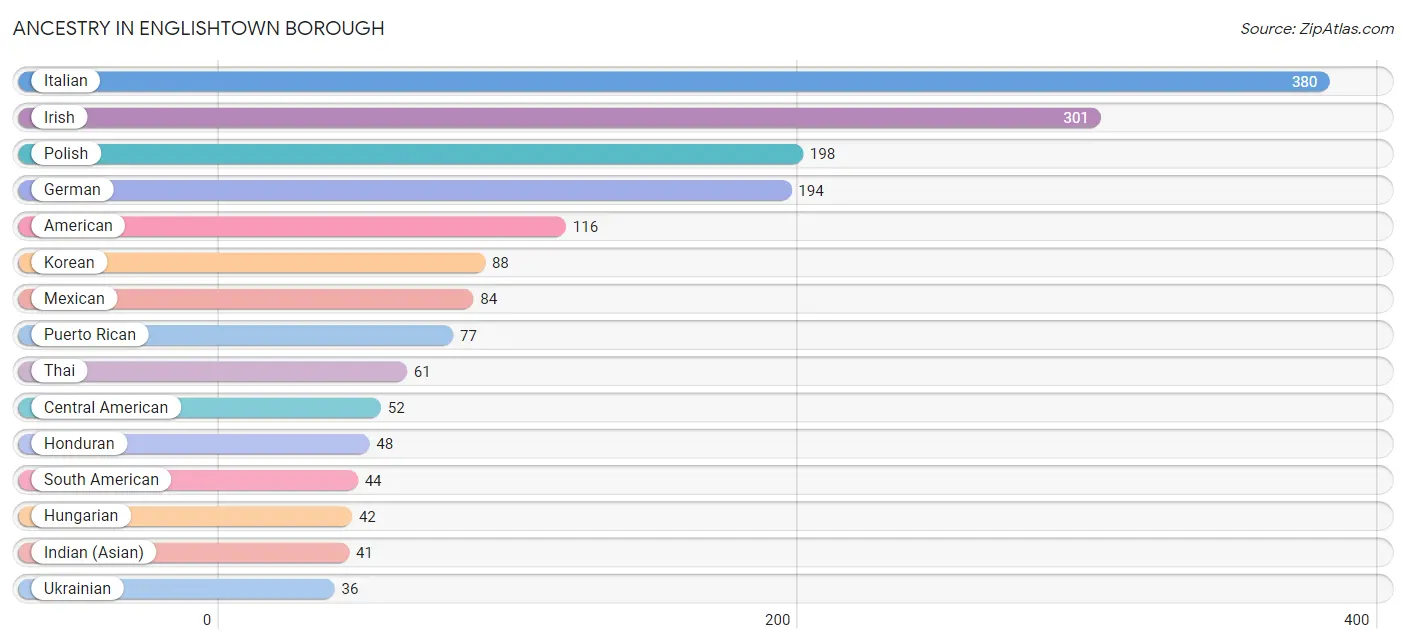
Ancestry in Englishtown borough
The most populous ancestries reported in Englishtown borough are Italian (380 | 17.8%), Irish (301 | 14.1%), Polish (198 | 9.3%), German (194 | 9.1%), and American (116 | 5.4%), together accounting for 55.8% of all Englishtown borough residents.
| Ancestry | # Population | % Population |
| Albanian | 28 | 1.3% |
| American | 116 | 5.4% |
| Arab | 24 | 1.1% |
| Argentinean | 22 | 1.0% |
| Burmese | 19 | 0.9% |
| Central American | 52 | 2.4% |
| Cuban | 12 | 0.6% |
| Czech | 5 | 0.2% |
| Czechoslovakian | 7 | 0.3% |
| Dominican | 35 | 1.6% |
| Dutch | 14 | 0.7% |
| Ecuadorian | 12 | 0.6% |
| Egyptian | 24 | 1.1% |
| English | 33 | 1.5% |
| European | 22 | 1.0% |
| French | 33 | 1.5% |
| French Canadian | 8 | 0.4% |
| German | 194 | 9.1% |
| Greek | 12 | 0.6% |
| Honduran | 48 | 2.2% |
| Hungarian | 42 | 2.0% |
| Indian (Asian) | 41 | 1.9% |
| Irish | 301 | 14.1% |
| Italian | 380 | 17.8% |
| Korean | 88 | 4.1% |
| Mexican | 84 | 4.0% |
| Norwegian | 9 | 0.4% |
| Pakistani | 5 | 0.2% |
| Panamanian | 4 | 0.2% |
| Peruvian | 10 | 0.5% |
| Polish | 198 | 9.3% |
| Portuguese | 30 | 1.4% |
| Puerto Rican | 77 | 3.6% |
| Russian | 19 | 0.9% |
| Scandinavian | 2 | 0.1% |
| Scotch-Irish | 11 | 0.5% |
| Scottish | 4 | 0.2% |
| Slovak | 11 | 0.5% |
| South American | 44 | 2.1% |
| Spanish | 5 | 0.2% |
| Thai | 61 | 2.9% |
| Turkish | 25 | 1.2% |
| Ukrainian | 36 | 1.7% |
| Welsh | 4 | 0.2% | View All 44 Rows |
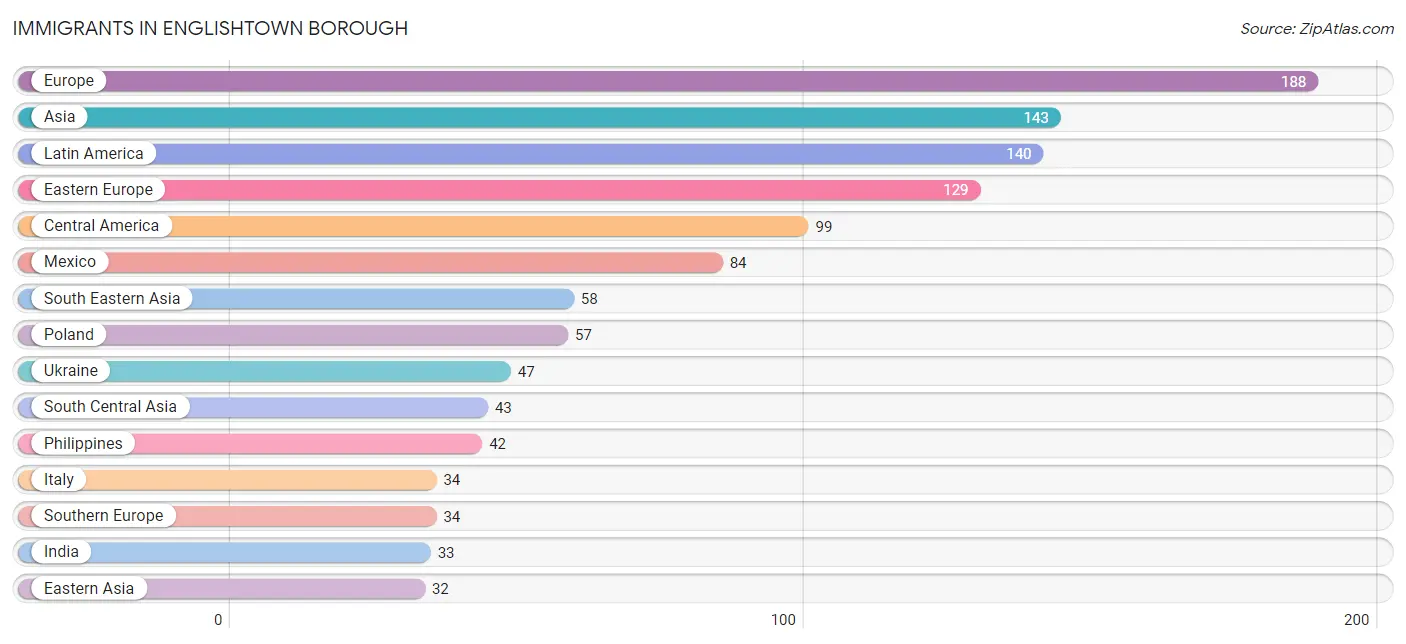
Immigrants in Englishtown borough
The most numerous immigrant groups reported in Englishtown borough came from Europe (188 | 8.8%), Asia (143 | 6.7%), Latin America (140 | 6.6%), Eastern Europe (129 | 6.1%), and Central America (99 | 4.6%), together accounting for 32.8% of all Englishtown borough residents.
| Immigration Origin | # Population | % Population |
| Africa | 31 | 1.5% |
| Asia | 143 | 6.7% |
| Belarus | 10 | 0.5% |
| Canada | 10 | 0.5% |
| Caribbean | 24 | 1.1% |
| Central America | 99 | 4.6% |
| China | 20 | 0.9% |
| Cuba | 5 | 0.2% |
| Czechoslovakia | 11 | 0.5% |
| Dominican Republic | 19 | 0.9% |
| Eastern Asia | 32 | 1.5% |
| Eastern Europe | 129 | 6.1% |
| Ecuador | 12 | 0.6% |
| Egypt | 31 | 1.5% |
| England | 4 | 0.2% |
| Europe | 188 | 8.8% |
| Germany | 18 | 0.9% |
| Honduras | 15 | 0.7% |
| Hong Kong | 17 | 0.8% |
| India | 33 | 1.5% |
| Italy | 34 | 1.6% |
| Korea | 12 | 0.6% |
| Laos | 5 | 0.2% |
| Latin America | 140 | 6.6% |
| Malaysia | 6 | 0.3% |
| Mexico | 84 | 4.0% |
| North Macedonia | 4 | 0.2% |
| Northern Africa | 31 | 1.5% |
| Northern Europe | 7 | 0.3% |
| Peru | 5 | 0.2% |
| Philippines | 42 | 2.0% |
| Poland | 57 | 2.7% |
| South America | 17 | 0.8% |
| South Central Asia | 43 | 2.0% |
| South Eastern Asia | 58 | 2.7% |
| Southern Europe | 34 | 1.6% |
| Thailand | 5 | 0.2% |
| Turkey | 10 | 0.5% |
| Ukraine | 47 | 2.2% |
| Uzbekistan | 6 | 0.3% |
| Western Asia | 10 | 0.5% |
| Western Europe | 18 | 0.9% | View All 42 Rows |
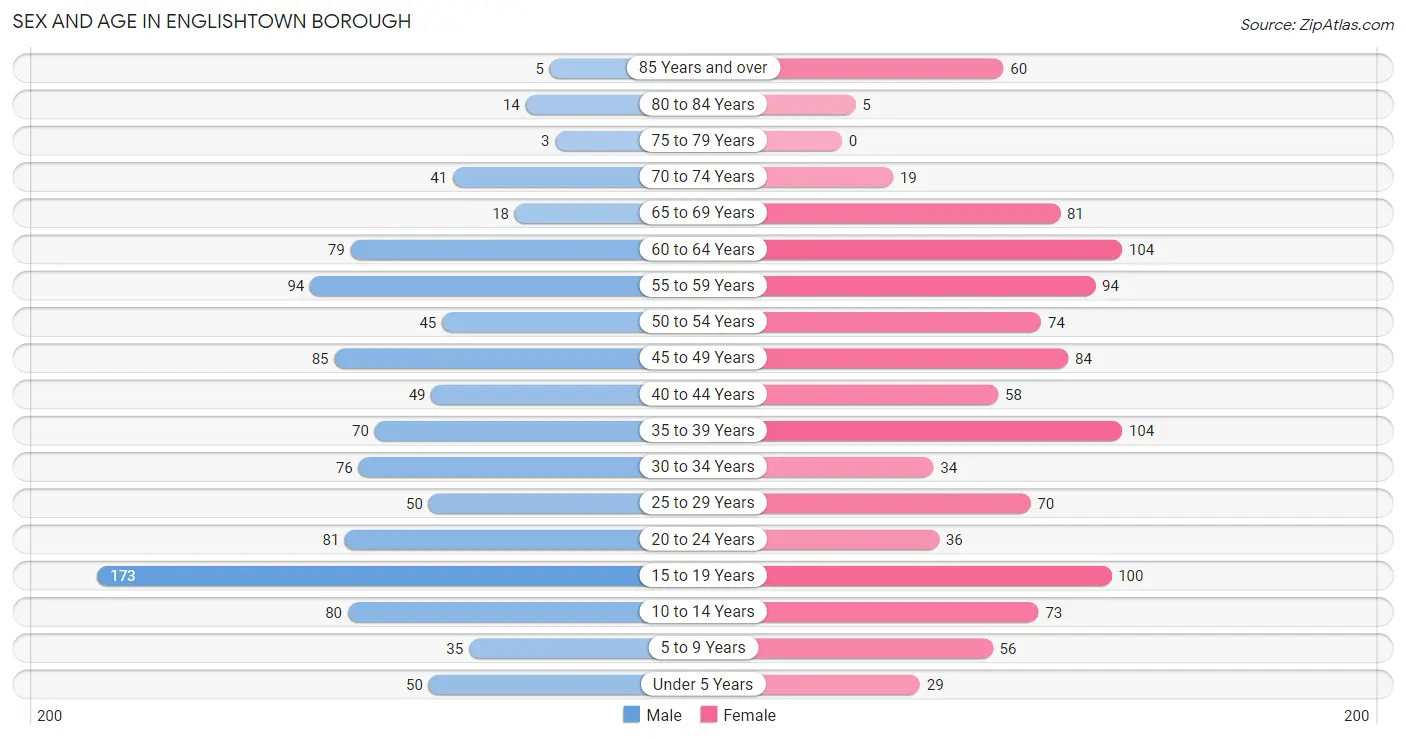
Sex and Age in Englishtown borough
Sex and Age in Englishtown borough
The most populous age groups in Englishtown borough are 15 to 19 Years (173 | 16.5%) for men and 35 to 39 Years (104 | 9.6%) for women.
| Age Bracket | Male | Female |
| Under 5 Years | 50 (4.8%) | 29 (2.7%) |
| 5 to 9 Years | 35 (3.3%) | 56 (5.2%) |
| 10 to 14 Years | 80 (7.6%) | 73 (6.8%) |
| 15 to 19 Years | 173 (16.5%) | 100 (9.2%) |
| 20 to 24 Years | 81 (7.7%) | 36 (3.3%) |
| 25 to 29 Years | 50 (4.8%) | 70 (6.5%) |
| 30 to 34 Years | 76 (7.2%) | 34 (3.2%) |
| 35 to 39 Years | 70 (6.7%) | 104 (9.6%) |
| 40 to 44 Years | 49 (4.7%) | 58 (5.4%) |
| 45 to 49 Years | 85 (8.1%) | 84 (7.8%) |
| 50 to 54 Years | 45 (4.3%) | 74 (6.9%) |
| 55 to 59 Years | 94 (9.0%) | 94 (8.7%) |
| 60 to 64 Years | 79 (7.5%) | 104 (9.6%) |
| 65 to 69 Years | 18 (1.7%) | 81 (7.5%) |
| 70 to 74 Years | 41 (3.9%) | 19 (1.8%) |
| 75 to 79 Years | 3 (0.3%) | 0 (0.0%) |
| 80 to 84 Years | 14 (1.3%) | 5 (0.5%) |
| 85 Years and over | 5 (0.5%) | 60 (5.6%) |
| Total | 1,048 (100.0%) | 1,081 (100.0%) |
Families and Households in Englishtown borough
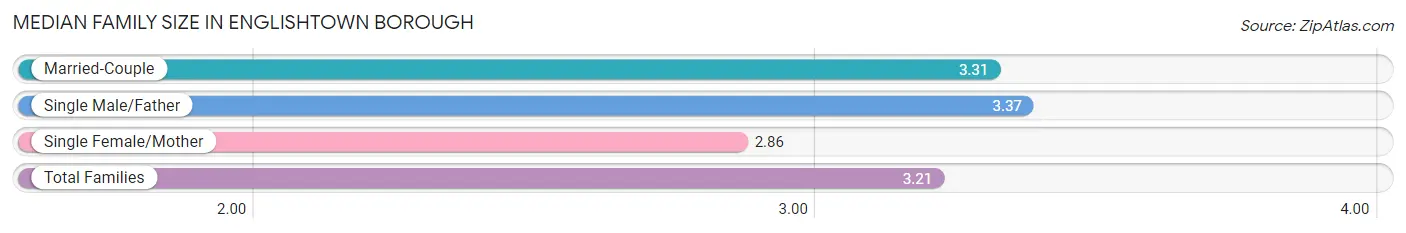
Median Family Size in Englishtown borough
The median family size in Englishtown borough is 3.21 persons per family, with single male/father families (35 | 6.7%) accounting for the largest median family size of 3.37 persons per family. On the other hand, single female/mother families (113 | 21.6%) represent the smallest median family size with 2.86 persons per family.
| Family Type | # Families | Family Size |
| Married-Couple | 375 (71.7%) | 3.31 |
| Single Male/Father | 35 (6.7%) | 3.37 |
| Single Female/Mother | 113 (21.6%) | 2.86 |
| Total Families | 523 (100.0%) | 3.21 |
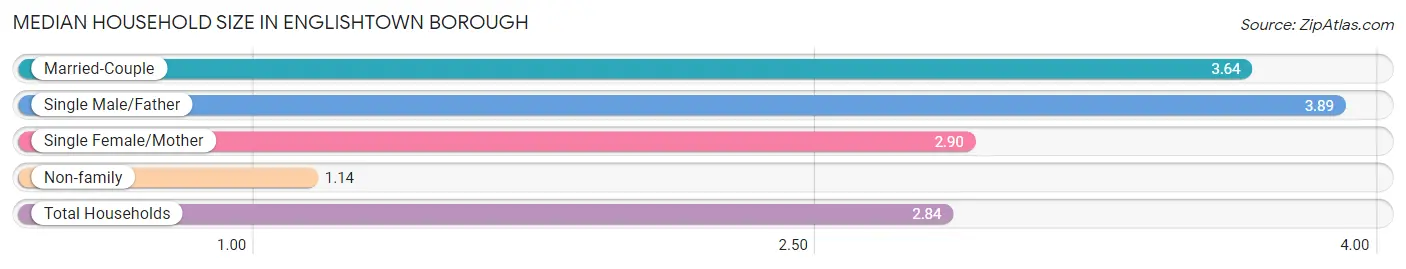
Median Household Size in Englishtown borough
The median household size in Englishtown borough is 2.84 persons per household, with single male/father households (35 | 4.8%) accounting for the largest median household size of 3.89 persons per household. non-family households (202 | 27.9%) represent the smallest median household size with 1.14 persons per household.
| Household Type | # Households | Household Size |
| Married-Couple | 375 (51.7%) | 3.64 |
| Single Male/Father | 35 (4.8%) | 3.89 |
| Single Female/Mother | 113 (15.6%) | 2.90 |
| Non-family | 202 (27.9%) | 1.14 |
| Total Households | 725 (100.0%) | 2.84 |
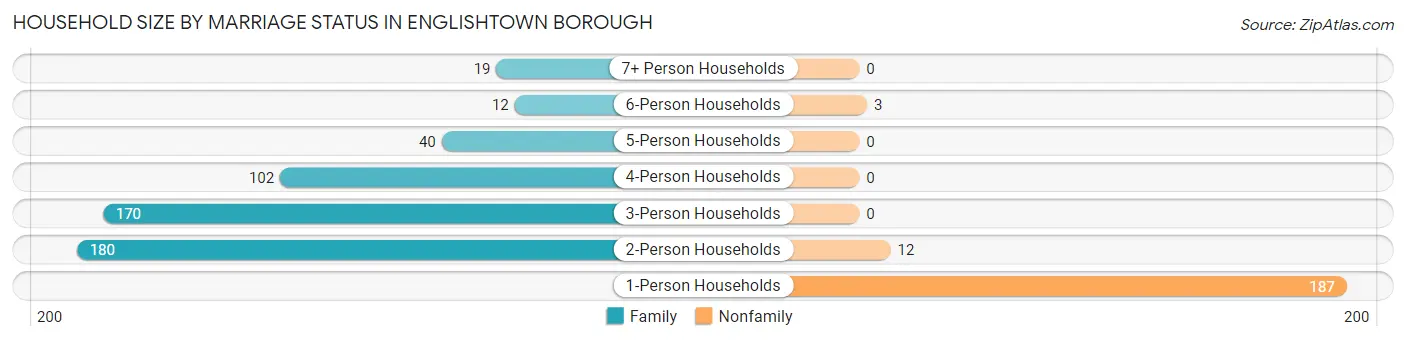
Household Size by Marriage Status in Englishtown borough
Out of a total of 725 households in Englishtown borough, 523 (72.1%) are family households, while 202 (27.9%) are nonfamily households. The most numerous type of family households are 2-person households, comprising 180, and the most common type of nonfamily households are 1-person households, comprising 187.
| Household Size | Family Households | Nonfamily Households |
| 1-Person Households | - | 187 (25.8%) |
| 2-Person Households | 180 (24.8%) | 12 (1.7%) |
| 3-Person Households | 170 (23.4%) | 0 (0.0%) |
| 4-Person Households | 102 (14.1%) | 0 (0.0%) |
| 5-Person Households | 40 (5.5%) | 0 (0.0%) |
| 6-Person Households | 12 (1.7%) | 3 (0.4%) |
| 7+ Person Households | 19 (2.6%) | 0 (0.0%) |
| Total | 523 (72.1%) | 202 (27.9%) |
Female Fertility in Englishtown borough
Fertility by Age in Englishtown borough
Average fertility rate in Englishtown borough is 25.0 births per 1,000 women. Women in the age bracket of 35 to 50 years have the highest fertility rate with 48.0 births per 1,000 women. Women in the age bracket of 35 to 50 years acount for 100.0% of all women with births.
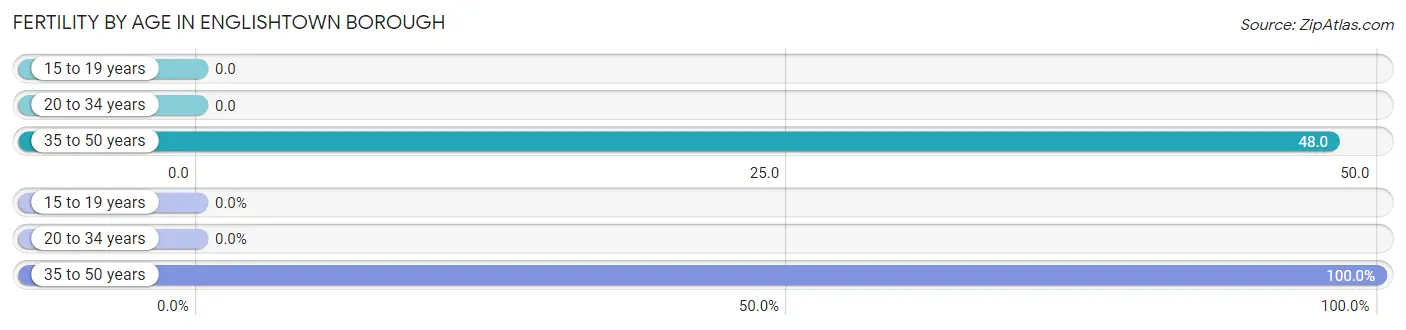
| Age Bracket | Women with Births | Births / 1,000 Women |
| 15 to 19 years | 0 (0.0%) | 0.0 |
| 20 to 34 years | 0 (0.0%) | 0.0 |
| 35 to 50 years | 13 (100.0%) | 48.0 |
| Total | 13 (100.0%) | 25.0 |
Fertility by Age by Marriage Status in Englishtown borough
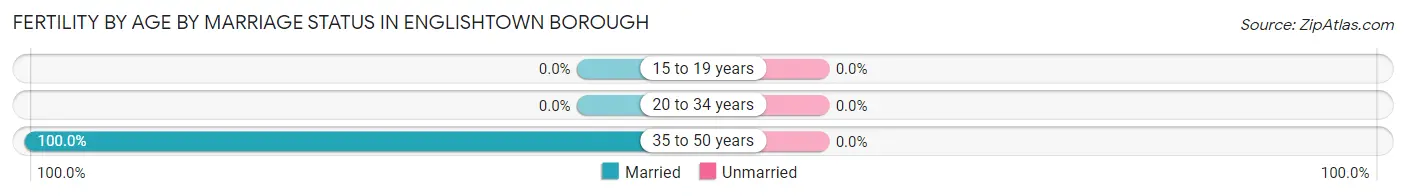
| Age Bracket | Married | Unmarried |
| 15 to 19 years | 0 (0.0%) | 0 (0.0%) |
| 20 to 34 years | 0 (0.0%) | 0 (0.0%) |
| 35 to 50 years | 13 (100.0%) | 0 (0.0%) |
| Total | 13 (100.0%) | 0 (0.0%) |
Fertility by Education in Englishtown borough
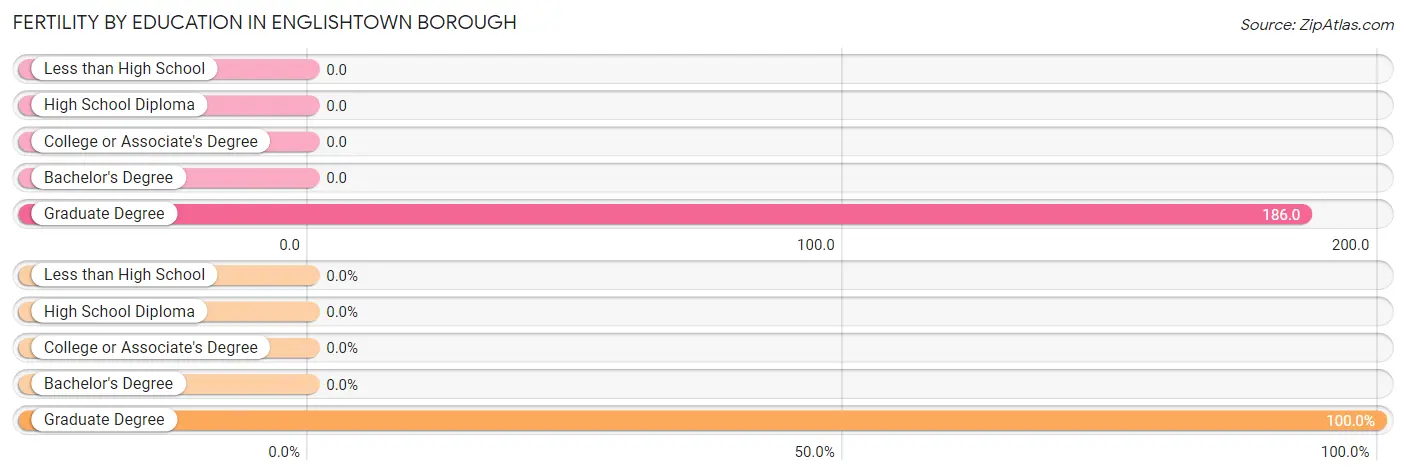
| Educational Attainment | Women with Births | Births / 1,000 Women |
| Less than High School | 0 (0.0%) | 0.0 |
| High School Diploma | 0 (0.0%) | 0.0 |
| College or Associate's Degree | 0 (0.0%) | 0.0 |
| Bachelor's Degree | 0 (0.0%) | 0.0 |
| Graduate Degree | 13 (100.0%) | 186.0 |
| Total | 13 (100.0%) | 25.0 |
Fertility by Education by Marriage Status in Englishtown borough
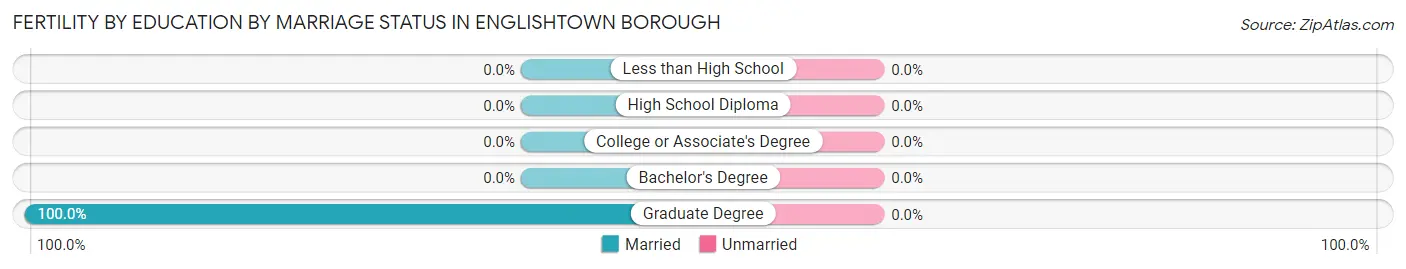
| Educational Attainment | Married | Unmarried |
| Less than High School | 0 (0.0%) | 0 (0.0%) |
| High School Diploma | 0 (0.0%) | 0 (0.0%) |
| College or Associate's Degree | 0 (0.0%) | 0 (0.0%) |
| Bachelor's Degree | 0 (0.0%) | 0 (0.0%) |
| Graduate Degree | 13 (100.0%) | 0 (0.0%) |
| Total | 13 (100.0%) | 0 (0.0%) |
Employment Characteristics in Englishtown borough
Employment by Class of Employer in Englishtown borough
Among the 1,068 employed individuals in Englishtown borough, private company employees (813 | 76.1%), local government employees (119 | 11.1%), and self-employed (not incorporated) (53 | 5.0%) make up the most common classes of employment.
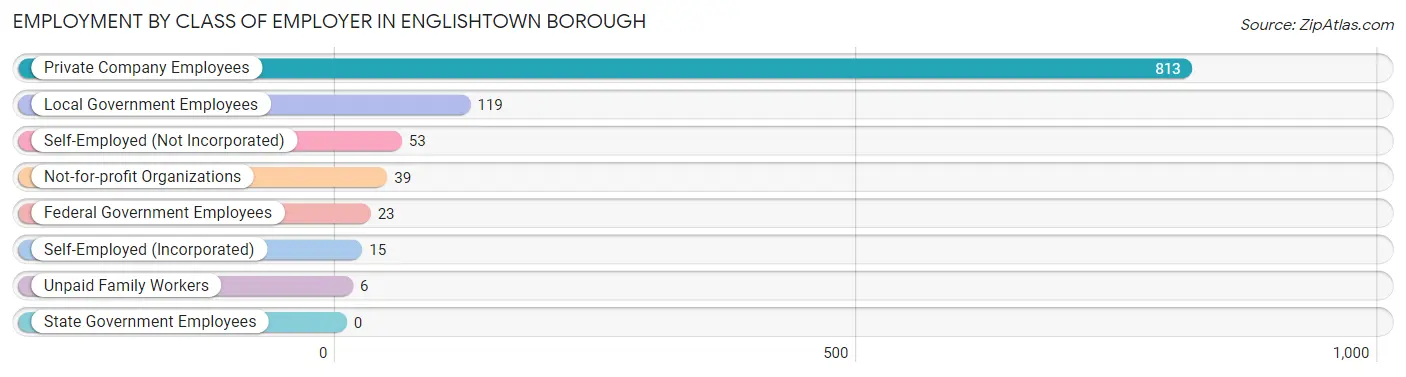
| Employer Class | # Employees | % Employees |
| Private Company Employees | 813 | 76.1% |
| Self-Employed (Incorporated) | 15 | 1.4% |
| Self-Employed (Not Incorporated) | 53 | 5.0% |
| Not-for-profit Organizations | 39 | 3.6% |
| Local Government Employees | 119 | 11.1% |
| State Government Employees | 0 | 0.0% |
| Federal Government Employees | 23 | 2.1% |
| Unpaid Family Workers | 6 | 0.6% |
| Total | 1,068 | 100.0% |
Employment Status by Age in Englishtown borough
According to the labor force statistics for Englishtown borough, out of the total population over 16 years of age (1,715), 68.2% or 1,170 individuals are in the labor force, with 8.3% or 97 of them unemployed. The age group with the highest labor force participation rate is 30 to 34 years, with 100.0% or 110 individuals in the labor force. Within the labor force, the 20 to 24 years age range has the highest percentage of unemployed individuals, with 24.1% or 22 of them being unemployed.
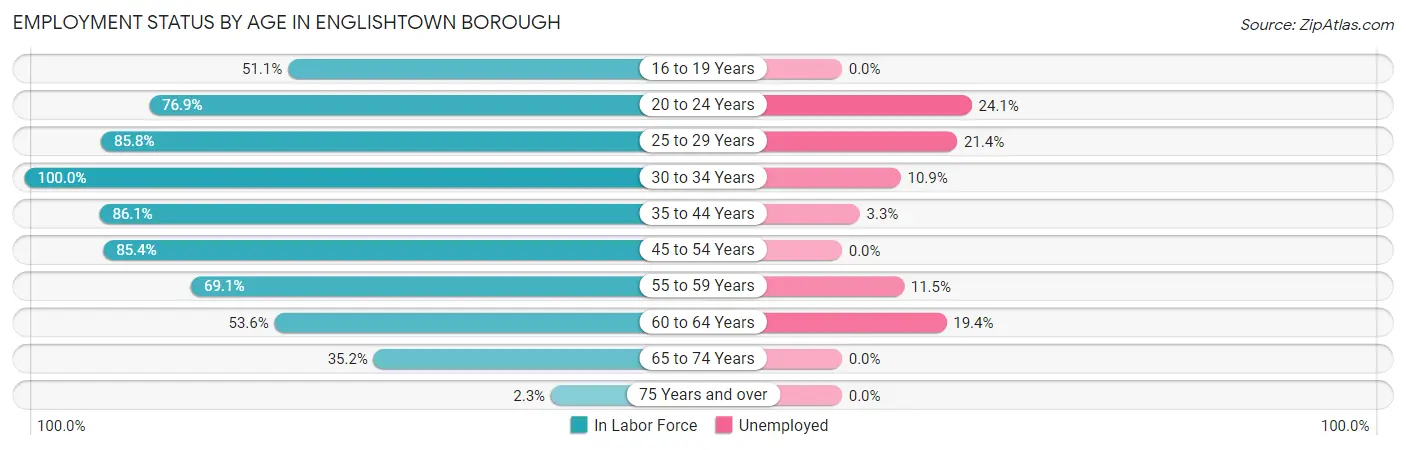
| Age Bracket | In Labor Force | Unemployed |
| 16 to 19 Years | 93 (51.1%) | 0 (0.0%) |
| 20 to 24 Years | 90 (76.9%) | 22 (24.1%) |
| 25 to 29 Years | 103 (85.8%) | 22 (21.4%) |
| 30 to 34 Years | 110 (100.0%) | 12 (10.9%) |
| 35 to 44 Years | 242 (86.1%) | 8 (3.3%) |
| 45 to 54 Years | 246 (85.4%) | 0 (0.0%) |
| 55 to 59 Years | 130 (69.1%) | 15 (11.5%) |
| 60 to 64 Years | 98 (53.6%) | 19 (19.4%) |
| 65 to 74 Years | 56 (35.2%) | 0 (0.0%) |
| 75 Years and over | 2 (2.3%) | 0 (0.0%) |
| Total | 1,170 (68.2%) | 97 (8.3%) |
Employment Status by Educational Attainment in Englishtown borough
According to labor force statistics for Englishtown borough, 79.4% of individuals (929) out of the total population between 25 and 64 years of age (1,170) are in the labor force, with 8.2% or 76 of them being unemployed. The group with the highest labor force participation rate are those with the educational attainment of bachelor's degree or higher, with 92.0% or 416 individuals in the labor force. Within the labor force, individuals with less than high school education have the highest percentage of unemployment, with 52.8% or 19 of them being unemployed.
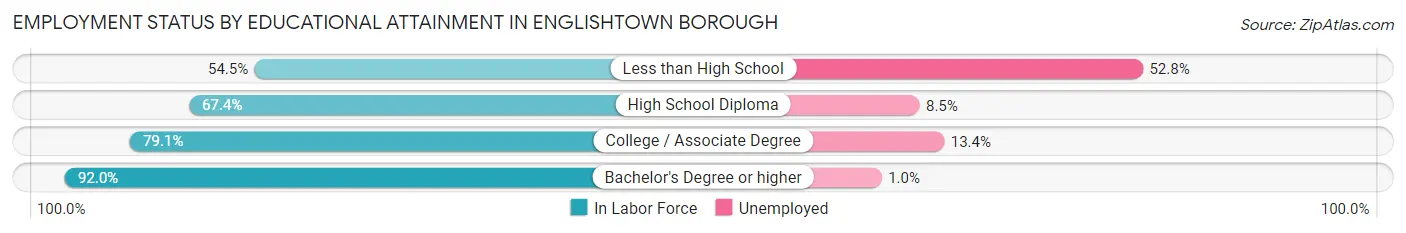
| Educational Attainment | In Labor Force | Unemployed |
| Less than High School | 36 (54.5%) | 35 (52.8%) |
| High School Diploma | 223 (67.4%) | 28 (8.5%) |
| College / Associate Degree | 254 (79.1%) | 43 (13.4%) |
| Bachelor's Degree or higher | 416 (92.0%) | 5 (1.0%) |
| Total | 929 (79.4%) | 96 (8.2%) |
Employment Occupations by Sex in Englishtown borough
Management, Business, Science and Arts Occupations
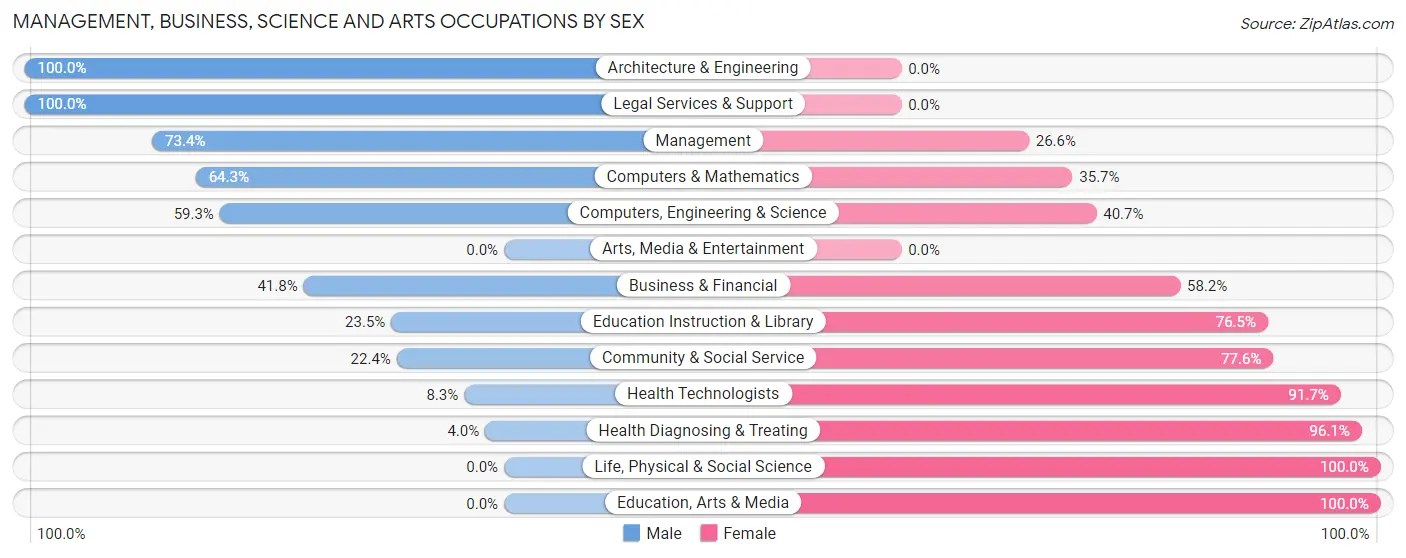
The most common Management, Business, Science and Arts occupations in Englishtown borough are Management (139 | 13.0%), Computers, Engineering & Science (86 | 8.0%), Health Diagnosing & Treating (76 | 7.1%), Computers & Mathematics (70 | 6.5%), and Community & Social Service (67 | 6.3%).
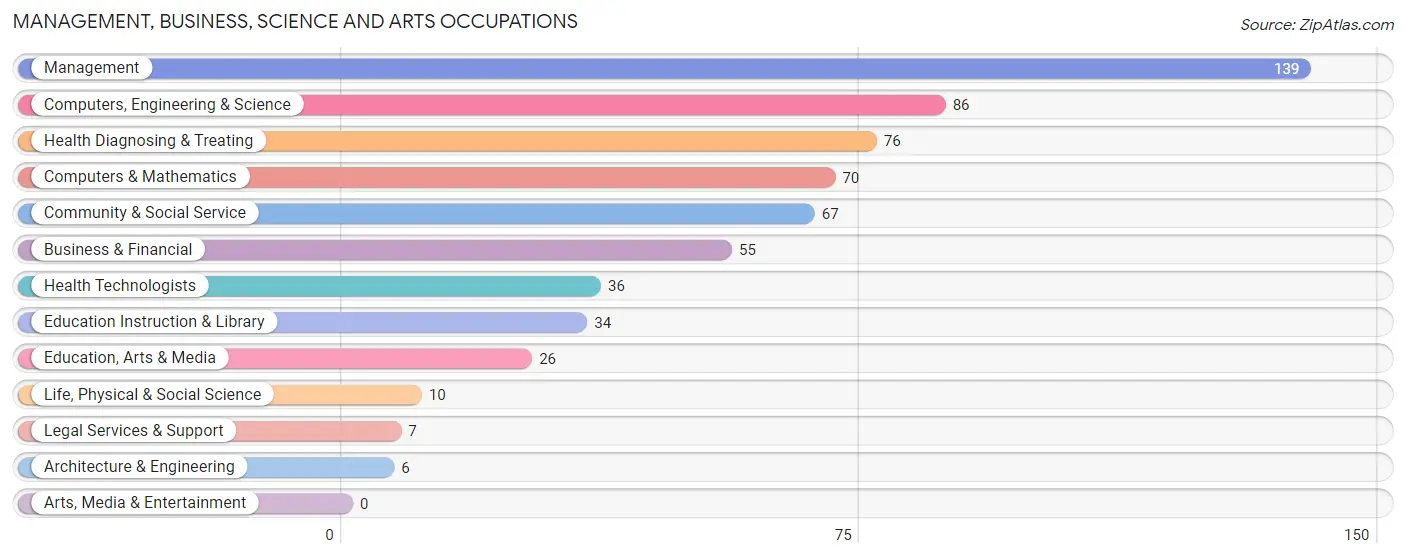
Management, Business, Science and Arts Occupations by Sex
Within the Management, Business, Science and Arts occupations in Englishtown borough, the most male-oriented occupations are Architecture & Engineering (100.0%), Legal Services & Support (100.0%), and Management (73.4%), while the most female-oriented occupations are Life, Physical & Social Science (100.0%), Education, Arts & Media (100.0%), and Health Diagnosing & Treating (96.1%).
| Occupation | Male | Female |
| Management | 102 (73.4%) | 37 (26.6%) |
| Business & Financial | 23 (41.8%) | 32 (58.2%) |
| Computers, Engineering & Science | 51 (59.3%) | 35 (40.7%) |
| Computers & Mathematics | 45 (64.3%) | 25 (35.7%) |
| Architecture & Engineering | 6 (100.0%) | 0 (0.0%) |
| Life, Physical & Social Science | 0 (0.0%) | 10 (100.0%) |
| Community & Social Service | 15 (22.4%) | 52 (77.6%) |
| Education, Arts & Media | 0 (0.0%) | 26 (100.0%) |
| Legal Services & Support | 7 (100.0%) | 0 (0.0%) |
| Education Instruction & Library | 8 (23.5%) | 26 (76.5%) |
| Arts, Media & Entertainment | 0 (0.0%) | 0 (0.0%) |
| Health Diagnosing & Treating | 3 (4.0%) | 73 (96.1%) |
| Health Technologists | 3 (8.3%) | 33 (91.7%) |
| Total (Category) | 194 (45.9%) | 229 (54.1%) |
| Total (Overall) | 552 (51.6%) | 518 (48.4%) |
Services Occupations
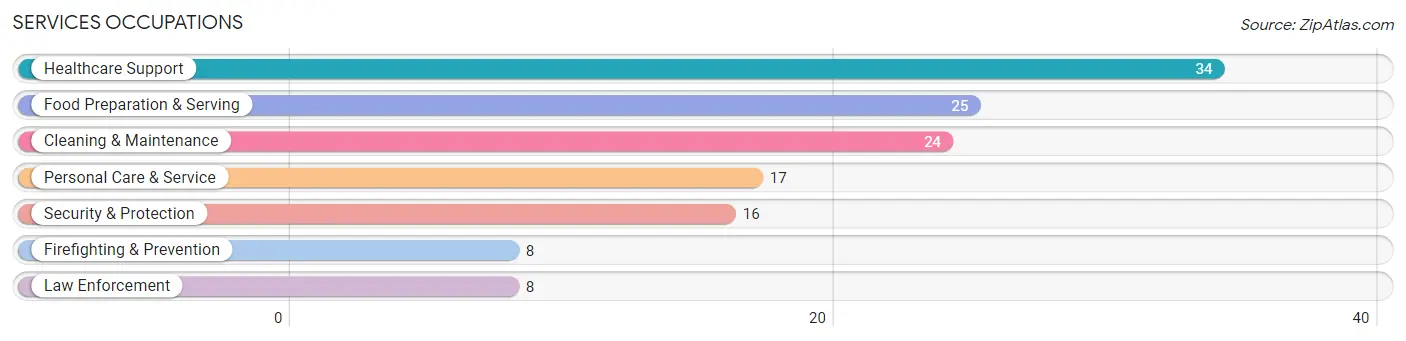
The most common Services occupations in Englishtown borough are Healthcare Support (34 | 3.2%), Food Preparation & Serving (25 | 2.3%), Cleaning & Maintenance (24 | 2.2%), Personal Care & Service (17 | 1.6%), and Security & Protection (16 | 1.5%).
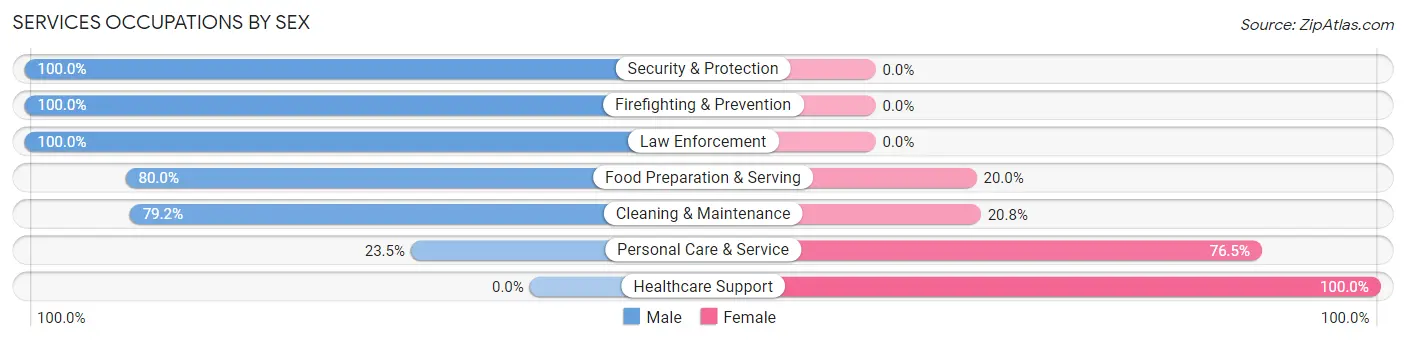
Services Occupations by Sex
Within the Services occupations in Englishtown borough, the most male-oriented occupations are Security & Protection (100.0%), Firefighting & Prevention (100.0%), and Law Enforcement (100.0%), while the most female-oriented occupations are Healthcare Support (100.0%), Personal Care & Service (76.5%), and Cleaning & Maintenance (20.8%).
| Occupation | Male | Female |
| Healthcare Support | 0 (0.0%) | 34 (100.0%) |
| Security & Protection | 16 (100.0%) | 0 (0.0%) |
| Firefighting & Prevention | 8 (100.0%) | 0 (0.0%) |
| Law Enforcement | 8 (100.0%) | 0 (0.0%) |
| Food Preparation & Serving | 20 (80.0%) | 5 (20.0%) |
| Cleaning & Maintenance | 19 (79.2%) | 5 (20.8%) |
| Personal Care & Service | 4 (23.5%) | 13 (76.5%) |
| Total (Category) | 59 (50.9%) | 57 (49.1%) |
| Total (Overall) | 552 (51.6%) | 518 (48.4%) |
Sales and Office Occupations
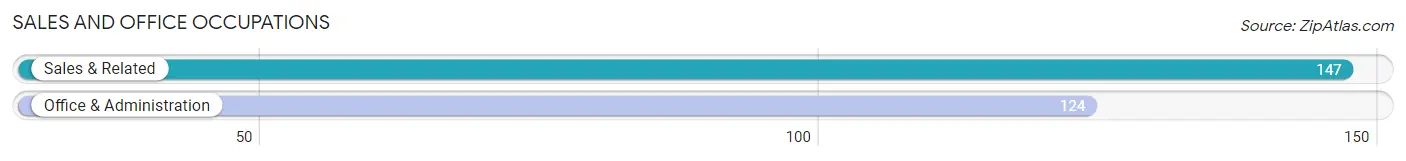
The most common Sales and Office occupations in Englishtown borough are Sales & Related (147 | 13.7%), and Office & Administration (124 | 11.6%).
Sales and Office Occupations by Sex
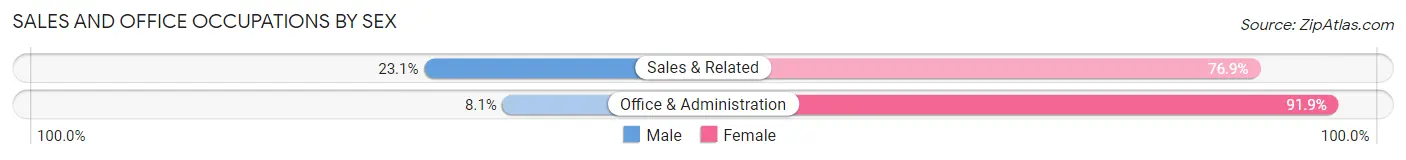
| Occupation | Male | Female |
| Sales & Related | 34 (23.1%) | 113 (76.9%) |
| Office & Administration | 10 (8.1%) | 114 (91.9%) |
| Total (Category) | 44 (16.2%) | 227 (83.8%) |
| Total (Overall) | 552 (51.6%) | 518 (48.4%) |
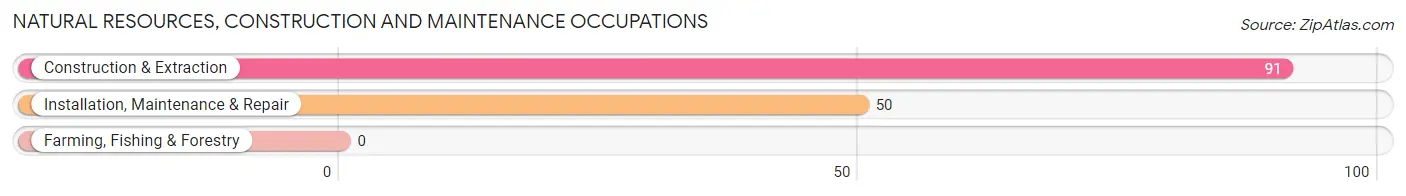
Natural Resources, Construction and Maintenance Occupations
The most common Natural Resources, Construction and Maintenance occupations in Englishtown borough are Construction & Extraction (91 | 8.5%), and Installation, Maintenance & Repair (50 | 4.7%).
Natural Resources, Construction and Maintenance Occupations by Sex
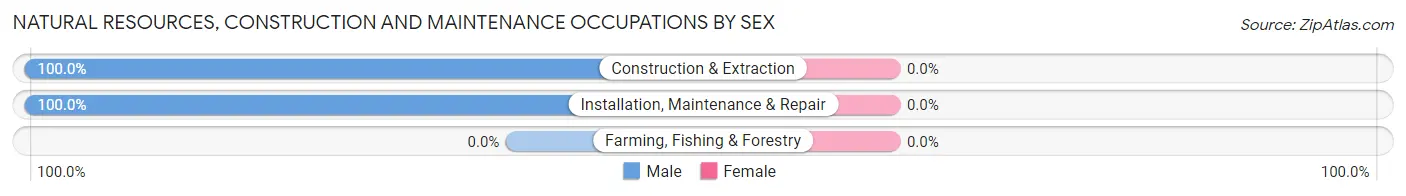
| Occupation | Male | Female |
| Farming, Fishing & Forestry | 0 (0.0%) | 0 (0.0%) |
| Construction & Extraction | 91 (100.0%) | 0 (0.0%) |
| Installation, Maintenance & Repair | 50 (100.0%) | 0 (0.0%) |
| Total (Category) | 141 (100.0%) | 0 (0.0%) |
| Total (Overall) | 552 (51.6%) | 518 (48.4%) |
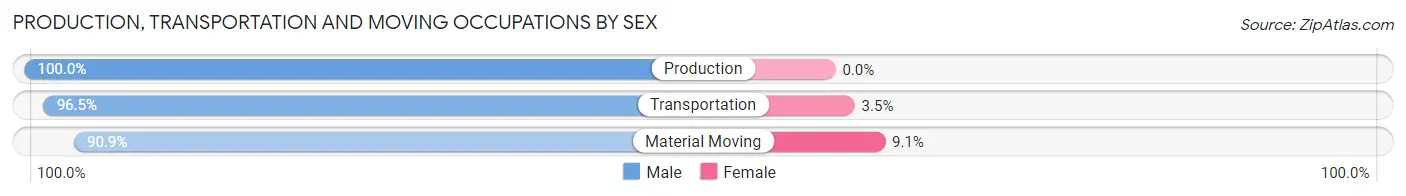
Production, Transportation and Moving Occupations
The most common Production, Transportation and Moving occupations in Englishtown borough are Transportation (57 | 5.3%), Material Moving (33 | 3.1%), and Production (29 | 2.7%).
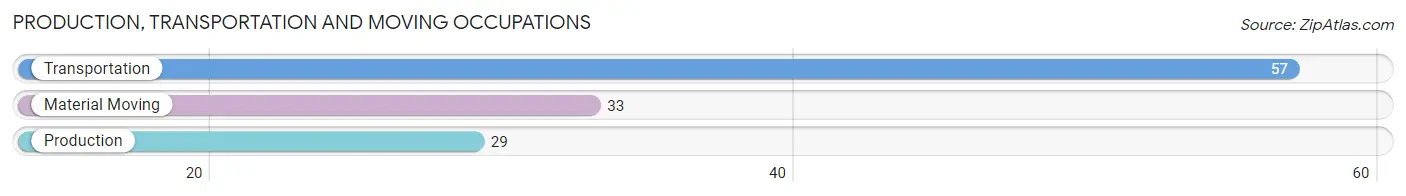
Production, Transportation and Moving Occupations by Sex
| Occupation | Male | Female |
| Production | 29 (100.0%) | 0 (0.0%) |
| Transportation | 55 (96.5%) | 2 (3.5%) |
| Material Moving | 30 (90.9%) | 3 (9.1%) |
| Total (Category) | 114 (95.8%) | 5 (4.2%) |
| Total (Overall) | 552 (51.6%) | 518 (48.4%) |
Employment Industries by Sex in Englishtown borough
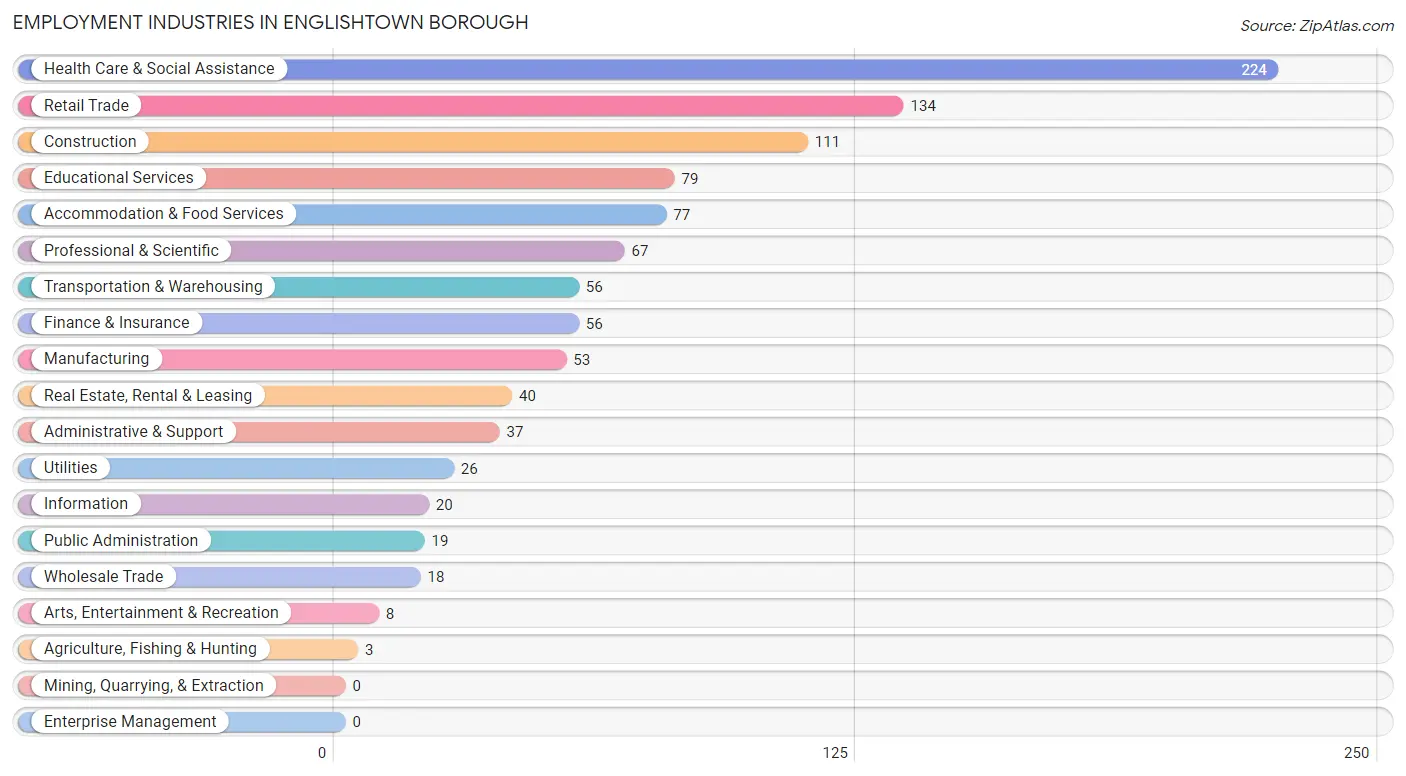
Employment Industries in Englishtown borough
The major employment industries in Englishtown borough include Health Care & Social Assistance (224 | 20.9%), Retail Trade (134 | 12.5%), Construction (111 | 10.4%), Educational Services (79 | 7.4%), and Accommodation & Food Services (77 | 7.2%).
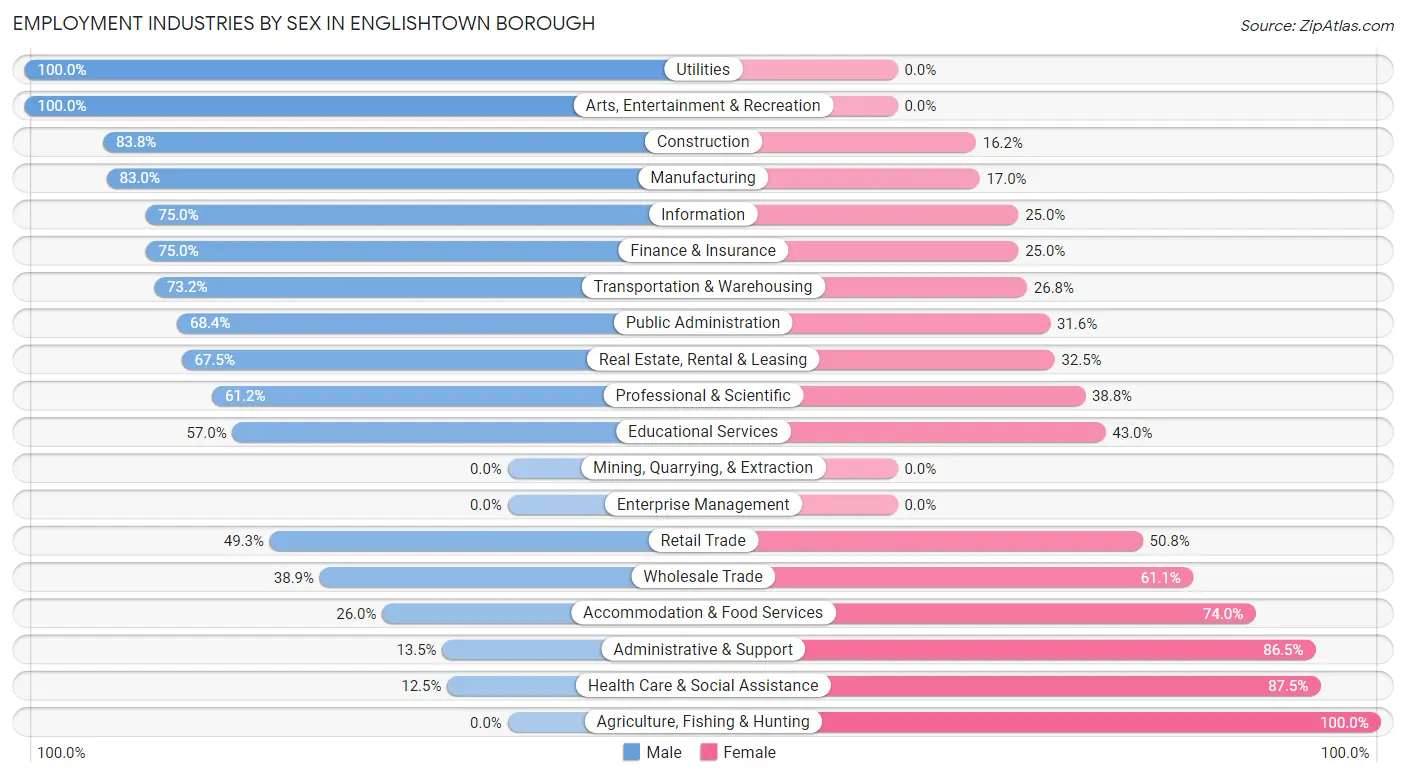
Employment Industries by Sex in Englishtown borough
The Englishtown borough industries that see more men than women are Utilities (100.0%), Arts, Entertainment & Recreation (100.0%), and Construction (83.8%), whereas the industries that tend to have a higher number of women are Agriculture, Fishing & Hunting (100.0%), Health Care & Social Assistance (87.5%), and Administrative & Support (86.5%).
| Industry | Male | Female |
| Agriculture, Fishing & Hunting | 0 (0.0%) | 3 (100.0%) |
| Mining, Quarrying, & Extraction | 0 (0.0%) | 0 (0.0%) |
| Construction | 93 (83.8%) | 18 (16.2%) |
| Manufacturing | 44 (83.0%) | 9 (17.0%) |
| Wholesale Trade | 7 (38.9%) | 11 (61.1%) |
| Retail Trade | 66 (49.2%) | 68 (50.7%) |
| Transportation & Warehousing | 41 (73.2%) | 15 (26.8%) |
| Utilities | 26 (100.0%) | 0 (0.0%) |
| Information | 15 (75.0%) | 5 (25.0%) |
| Finance & Insurance | 42 (75.0%) | 14 (25.0%) |
| Real Estate, Rental & Leasing | 27 (67.5%) | 13 (32.5%) |
| Professional & Scientific | 41 (61.2%) | 26 (38.8%) |
| Enterprise Management | 0 (0.0%) | 0 (0.0%) |
| Administrative & Support | 5 (13.5%) | 32 (86.5%) |
| Educational Services | 45 (57.0%) | 34 (43.0%) |
| Health Care & Social Assistance | 28 (12.5%) | 196 (87.5%) |
| Arts, Entertainment & Recreation | 8 (100.0%) | 0 (0.0%) |
| Accommodation & Food Services | 20 (26.0%) | 57 (74.0%) |
| Public Administration | 13 (68.4%) | 6 (31.6%) |
| Total | 552 (51.6%) | 518 (48.4%) |
Education in Englishtown borough
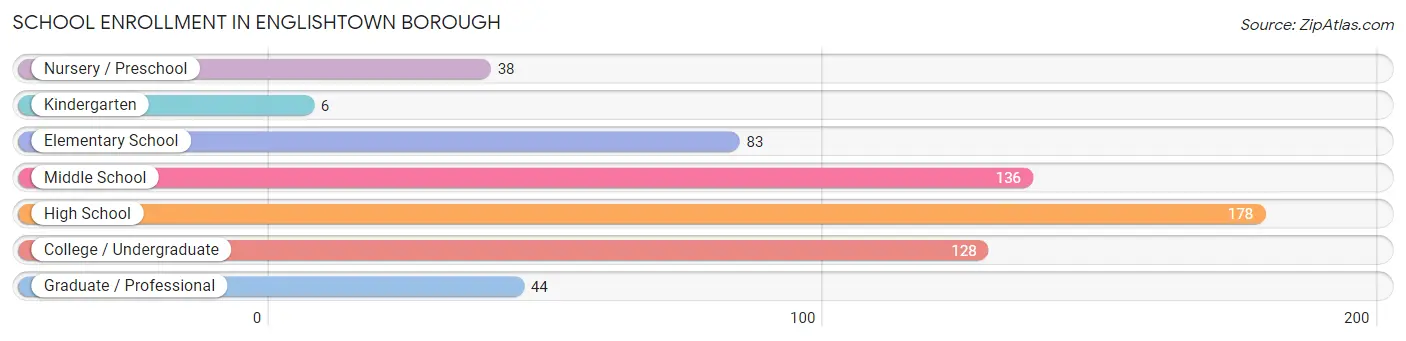
School Enrollment in Englishtown borough
The most common levels of schooling among the 613 students in Englishtown borough are high school (178 | 29.0%), middle school (136 | 22.2%), and college / undergraduate (128 | 20.9%).
| School Level | # Students | % Students |
| Nursery / Preschool | 38 | 6.2% |
| Kindergarten | 6 | 1.0% |
| Elementary School | 83 | 13.5% |
| Middle School | 136 | 22.2% |
| High School | 178 | 29.0% |
| College / Undergraduate | 128 | 20.9% |
| Graduate / Professional | 44 | 7.2% |
| Total | 613 | 100.0% |
School Enrollment by Age by Funding Source in Englishtown borough
Out of a total of 613 students who are enrolled in schools in Englishtown borough, 70 (11.4%) attend a private institution, while the remaining 543 (88.6%) are enrolled in public schools. The age group of 35 years and over has the highest likelihood of being enrolled in private schools, with 21 (72.4% in the age bracket) enrolled. Conversely, the age group of 5 to 9 year old has the lowest likelihood of being enrolled in a private school, with 81 (100.0% in the age bracket) attending a public institution.
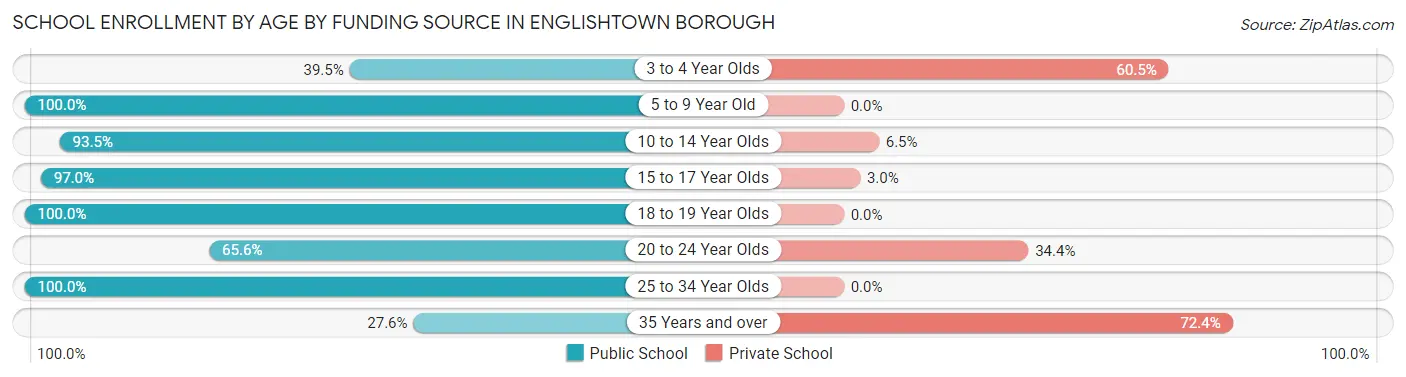
| Age Bracket | Public School | Private School |
| 3 to 4 Year Olds | 15 (39.5%) | 23 (60.5%) |
| 5 to 9 Year Old | 81 (100.0%) | 0 (0.0%) |
| 10 to 14 Year Olds | 143 (93.5%) | 10 (6.5%) |
| 15 to 17 Year Olds | 160 (97.0%) | 5 (3.0%) |
| 18 to 19 Year Olds | 86 (100.0%) | 0 (0.0%) |
| 20 to 24 Year Olds | 21 (65.6%) | 11 (34.4%) |
| 25 to 34 Year Olds | 29 (100.0%) | 0 (0.0%) |
| 35 Years and over | 8 (27.6%) | 21 (72.4%) |
| Total | 543 (88.6%) | 70 (11.4%) |
Educational Attainment by Field of Study in Englishtown borough
Business (131 | 24.8%), science & technology (79 | 15.0%), computers & mathematics (60 | 11.4%), psychology (43 | 8.1%), and engineering (39 | 7.4%) are the most common fields of study among 528 individuals in Englishtown borough who have obtained a bachelor's degree or higher.
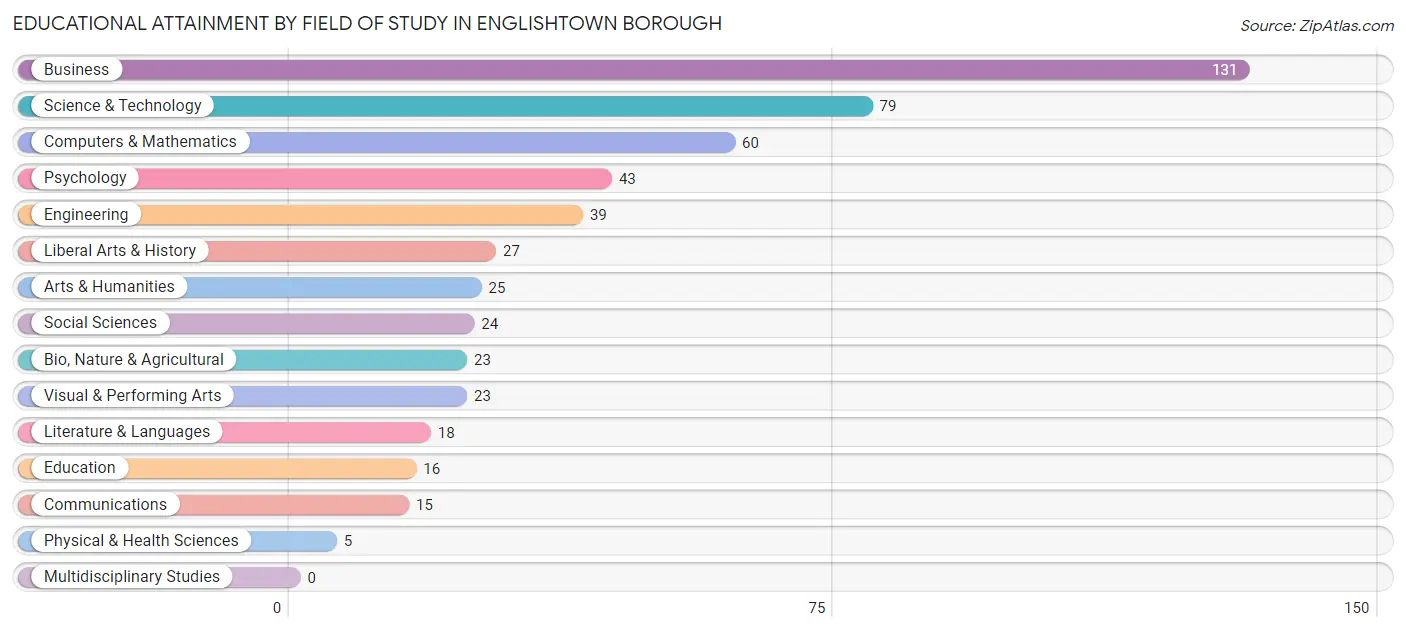
| Field of Study | # Graduates | % Graduates |
| Computers & Mathematics | 60 | 11.4% |
| Bio, Nature & Agricultural | 23 | 4.4% |
| Physical & Health Sciences | 5 | 0.9% |
| Psychology | 43 | 8.1% |
| Social Sciences | 24 | 4.5% |
| Engineering | 39 | 7.4% |
| Multidisciplinary Studies | 0 | 0.0% |
| Science & Technology | 79 | 15.0% |
| Business | 131 | 24.8% |
| Education | 16 | 3.0% |
| Literature & Languages | 18 | 3.4% |
| Liberal Arts & History | 27 | 5.1% |
| Visual & Performing Arts | 23 | 4.4% |
| Communications | 15 | 2.8% |
| Arts & Humanities | 25 | 4.7% |
| Total | 528 | 100.0% |
Transportation & Commute in Englishtown borough
Vehicle Availability by Sex in Englishtown borough
The most prevalent vehicle ownership categories in Englishtown borough are males with 2 vehicles (217, accounting for 39.1%) and females with 2 vehicles (161, making up 42.3%).
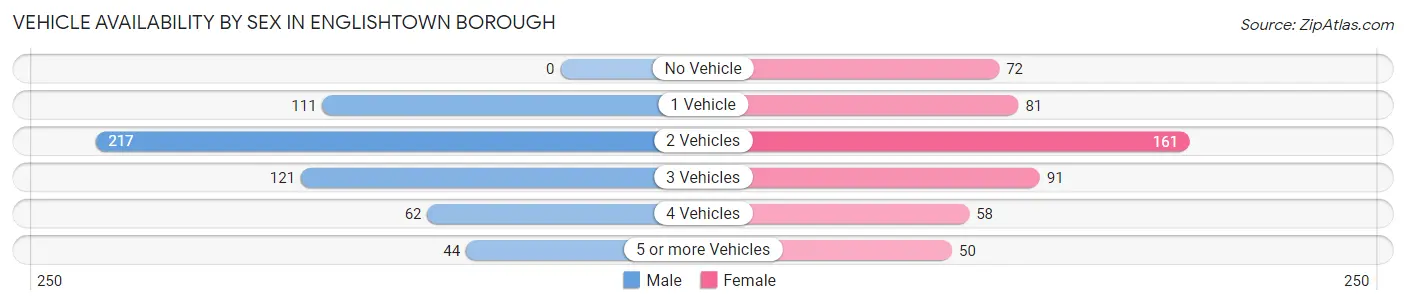
| Vehicles Available | Male | Female |
| No Vehicle | 0 (0.0%) | 72 (14.0%) |
| 1 Vehicle | 111 (20.0%) | 81 (15.8%) |
| 2 Vehicles | 217 (39.1%) | 161 (31.4%) |
| 3 Vehicles | 121 (21.8%) | 91 (17.7%) |
| 4 Vehicles | 62 (11.2%) | 58 (11.3%) |
| 5 or more Vehicles | 44 (7.9%) | 50 (9.8%) |
| Total | 555 (100.0%) | 513 (100.0%) |
Commute Time in Englishtown borough
The most frequently occuring commute durations in Englishtown borough are 15 to 19 minutes (204 commuters, 21.3%), 30 to 34 minutes (143 commuters, 14.9%), and 45 to 59 minutes (141 commuters, 14.7%).
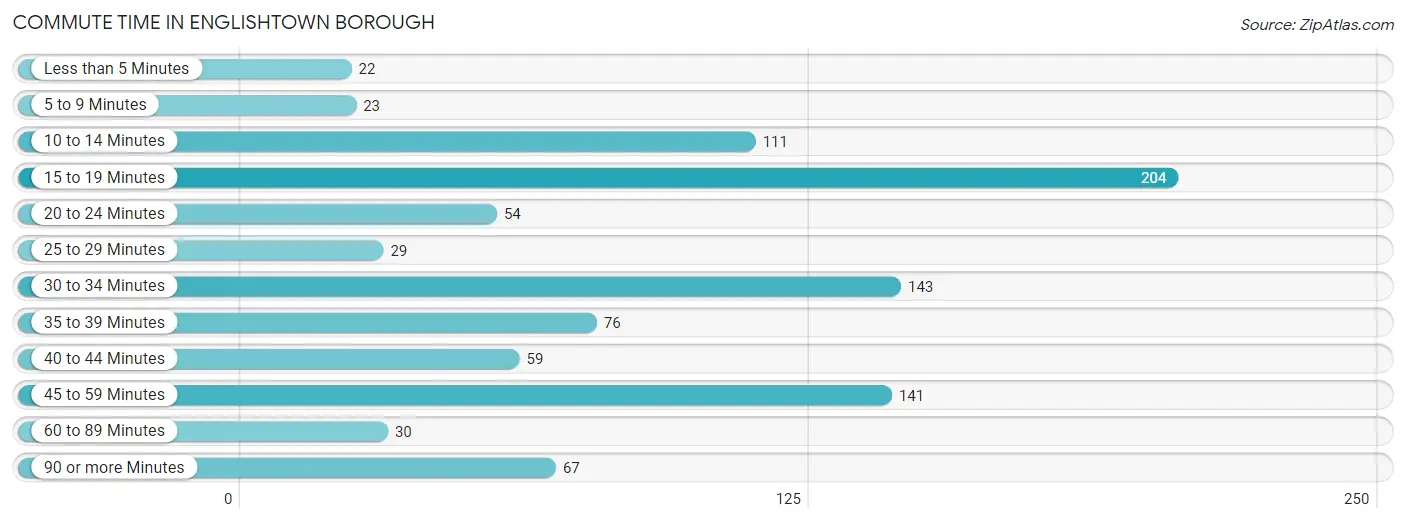
| Commute Time | # Commuters | % Commuters |
| Less than 5 Minutes | 22 | 2.3% |
| 5 to 9 Minutes | 23 | 2.4% |
| 10 to 14 Minutes | 111 | 11.6% |
| 15 to 19 Minutes | 204 | 21.3% |
| 20 to 24 Minutes | 54 | 5.6% |
| 25 to 29 Minutes | 29 | 3.0% |
| 30 to 34 Minutes | 143 | 14.9% |
| 35 to 39 Minutes | 76 | 7.9% |
| 40 to 44 Minutes | 59 | 6.1% |
| 45 to 59 Minutes | 141 | 14.7% |
| 60 to 89 Minutes | 30 | 3.1% |
| 90 or more Minutes | 67 | 7.0% |
Commute Time by Sex in Englishtown borough
The most common commute times in Englishtown borough are 15 to 19 minutes (105 commuters, 20.7%) for males and 10 to 14 minutes (106 commuters, 23.4%) for females.
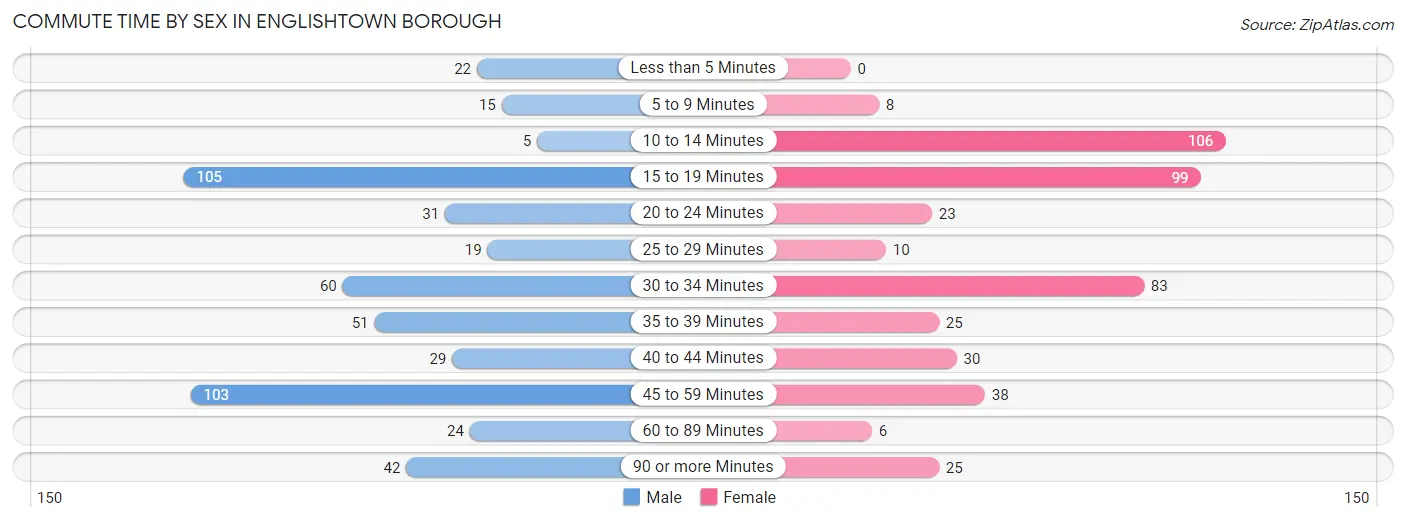
| Commute Time | Male | Female |
| Less than 5 Minutes | 22 (4.3%) | 0 (0.0%) |
| 5 to 9 Minutes | 15 (3.0%) | 8 (1.8%) |
| 10 to 14 Minutes | 5 (1.0%) | 106 (23.4%) |
| 15 to 19 Minutes | 105 (20.7%) | 99 (21.8%) |
| 20 to 24 Minutes | 31 (6.1%) | 23 (5.1%) |
| 25 to 29 Minutes | 19 (3.7%) | 10 (2.2%) |
| 30 to 34 Minutes | 60 (11.9%) | 83 (18.3%) |
| 35 to 39 Minutes | 51 (10.1%) | 25 (5.5%) |
| 40 to 44 Minutes | 29 (5.7%) | 30 (6.6%) |
| 45 to 59 Minutes | 103 (20.4%) | 38 (8.4%) |
| 60 to 89 Minutes | 24 (4.7%) | 6 (1.3%) |
| 90 or more Minutes | 42 (8.3%) | 25 (5.5%) |
Time of Departure to Work by Sex in Englishtown borough
The most frequent times of departure to work in Englishtown borough are 6:00 AM to 6:29 AM (140, 27.7%) for males and 7:30 AM to 7:59 AM (103, 22.7%) for females.
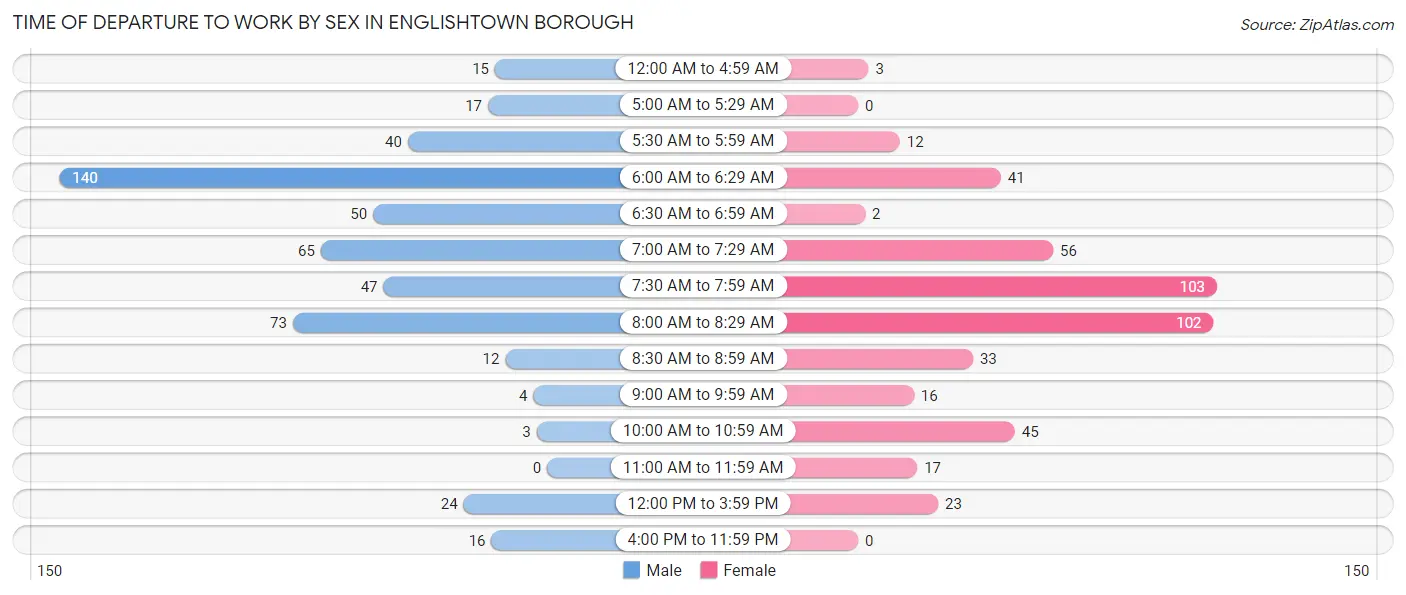
| Time of Departure | Male | Female |
| 12:00 AM to 4:59 AM | 15 (3.0%) | 3 (0.7%) |
| 5:00 AM to 5:29 AM | 17 (3.4%) | 0 (0.0%) |
| 5:30 AM to 5:59 AM | 40 (7.9%) | 12 (2.6%) |
| 6:00 AM to 6:29 AM | 140 (27.7%) | 41 (9.0%) |
| 6:30 AM to 6:59 AM | 50 (9.9%) | 2 (0.4%) |
| 7:00 AM to 7:29 AM | 65 (12.9%) | 56 (12.4%) |
| 7:30 AM to 7:59 AM | 47 (9.3%) | 103 (22.7%) |
| 8:00 AM to 8:29 AM | 73 (14.4%) | 102 (22.5%) |
| 8:30 AM to 8:59 AM | 12 (2.4%) | 33 (7.3%) |
| 9:00 AM to 9:59 AM | 4 (0.8%) | 16 (3.5%) |
| 10:00 AM to 10:59 AM | 3 (0.6%) | 45 (9.9%) |
| 11:00 AM to 11:59 AM | 0 (0.0%) | 17 (3.7%) |
| 12:00 PM to 3:59 PM | 24 (4.7%) | 23 (5.1%) |
| 4:00 PM to 11:59 PM | 16 (3.2%) | 0 (0.0%) |
| Total | 506 (100.0%) | 453 (100.0%) |
Housing Occupancy in Englishtown borough
Occupancy by Ownership in Englishtown borough
Of the total 725 dwellings in Englishtown borough, owner-occupied units account for 461 (63.6%), while renter-occupied units make up 264 (36.4%).
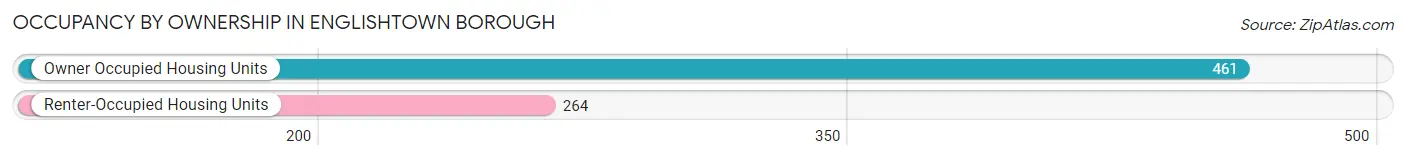
| Occupancy | # Housing Units | % Housing Units |
| Owner Occupied Housing Units | 461 | 63.6% |
| Renter-Occupied Housing Units | 264 | 36.4% |
| Total Occupied Housing Units | 725 | 100.0% |
Occupancy by Household Size in Englishtown borough
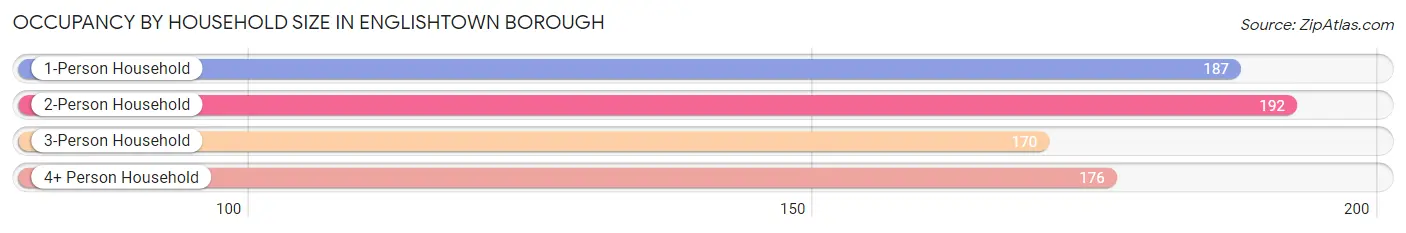
| Household Size | # Housing Units | % Housing Units |
| 1-Person Household | 187 | 25.8% |
| 2-Person Household | 192 | 26.5% |
| 3-Person Household | 170 | 23.4% |
| 4+ Person Household | 176 | 24.3% |
| Total Housing Units | 725 | 100.0% |
Occupancy by Ownership by Household Size in Englishtown borough
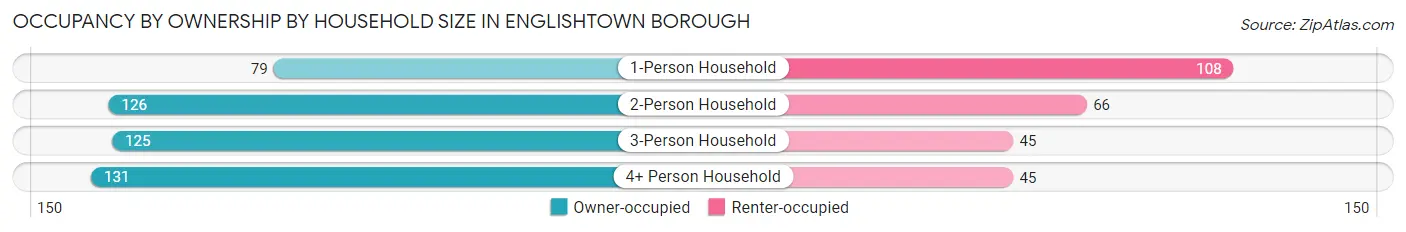
| Household Size | Owner-occupied | Renter-occupied |
| 1-Person Household | 79 (42.2%) | 108 (57.8%) |
| 2-Person Household | 126 (65.6%) | 66 (34.4%) |
| 3-Person Household | 125 (73.5%) | 45 (26.5%) |
| 4+ Person Household | 131 (74.4%) | 45 (25.6%) |
| Total Housing Units | 461 (63.6%) | 264 (36.4%) |
Occupancy by Educational Attainment in Englishtown borough
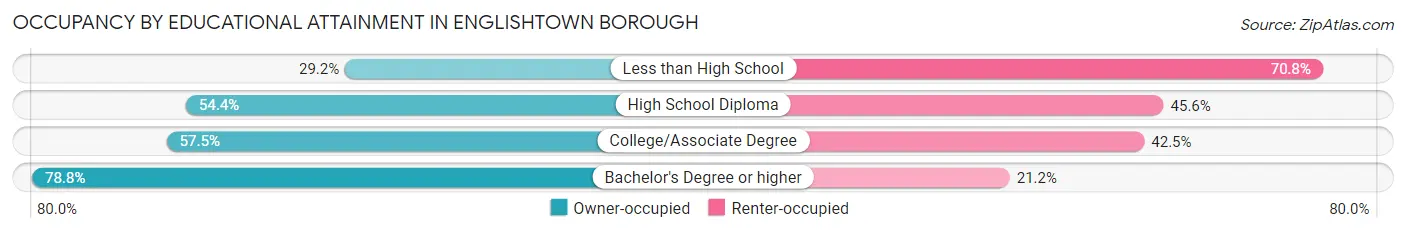
| Household Size | Owner-occupied | Renter-occupied |
| Less than High School | 7 (29.2%) | 17 (70.8%) |
| High School Diploma | 111 (54.4%) | 93 (45.6%) |
| College/Associate Degree | 131 (57.5%) | 97 (42.5%) |
| Bachelor's Degree or higher | 212 (78.8%) | 57 (21.2%) |
Occupancy by Age of Householder in Englishtown borough
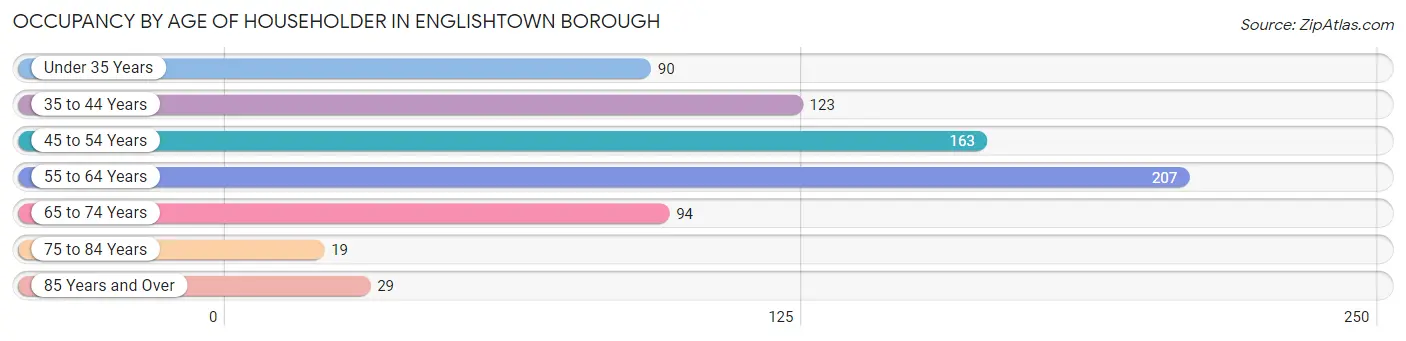
| Age Bracket | # Households | % Households |
| Under 35 Years | 90 | 12.4% |
| 35 to 44 Years | 123 | 17.0% |
| 45 to 54 Years | 163 | 22.5% |
| 55 to 64 Years | 207 | 28.5% |
| 65 to 74 Years | 94 | 13.0% |
| 75 to 84 Years | 19 | 2.6% |
| 85 Years and Over | 29 | 4.0% |
| Total | 725 | 100.0% |
Housing Finances in Englishtown borough
Median Income by Occupancy in Englishtown borough
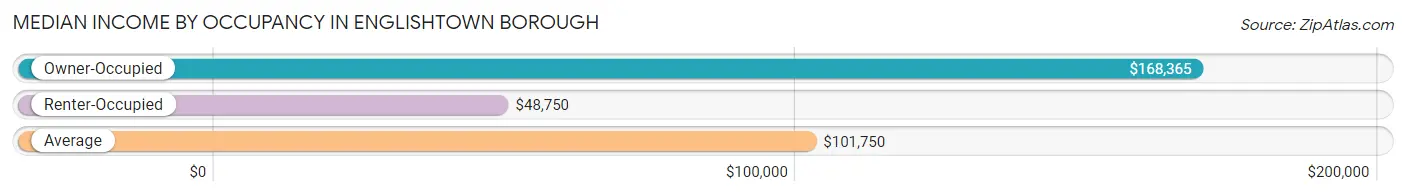
| Occupancy Type | # Households | Median Income |
| Owner-Occupied | 461 (63.6%) | $168,365 |
| Renter-Occupied | 264 (36.4%) | $48,750 |
| Average | 725 (100.0%) | $101,750 |
Occupancy by Householder Income Bracket in Englishtown borough
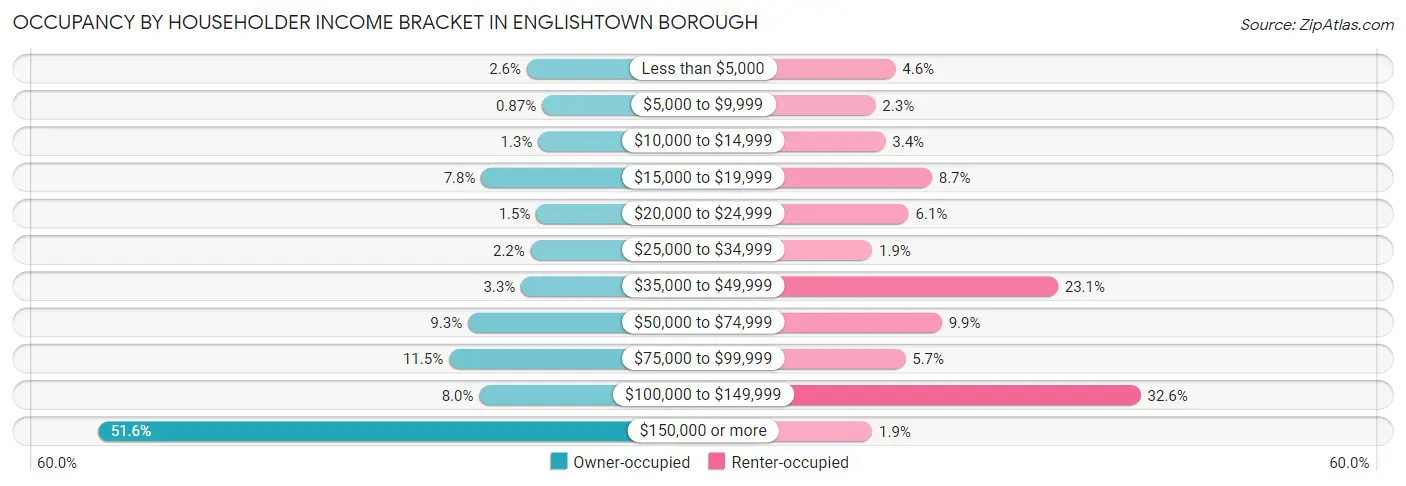
| Income Bracket | Owner-occupied | Renter-occupied |
| Less than $5,000 | 12 (2.6%) | 12 (4.5%) |
| $5,000 to $9,999 | 4 (0.9%) | 6 (2.3%) |
| $10,000 to $14,999 | 6 (1.3%) | 9 (3.4%) |
| $15,000 to $19,999 | 36 (7.8%) | 23 (8.7%) |
| $20,000 to $24,999 | 7 (1.5%) | 16 (6.1%) |
| $25,000 to $34,999 | 10 (2.2%) | 5 (1.9%) |
| $35,000 to $49,999 | 15 (3.3%) | 61 (23.1%) |
| $50,000 to $74,999 | 43 (9.3%) | 26 (9.9%) |
| $75,000 to $99,999 | 53 (11.5%) | 15 (5.7%) |
| $100,000 to $149,999 | 37 (8.0%) | 86 (32.6%) |
| $150,000 or more | 238 (51.6%) | 5 (1.9%) |
| Total | 461 (100.0%) | 264 (100.0%) |
Monthly Housing Cost Tiers in Englishtown borough
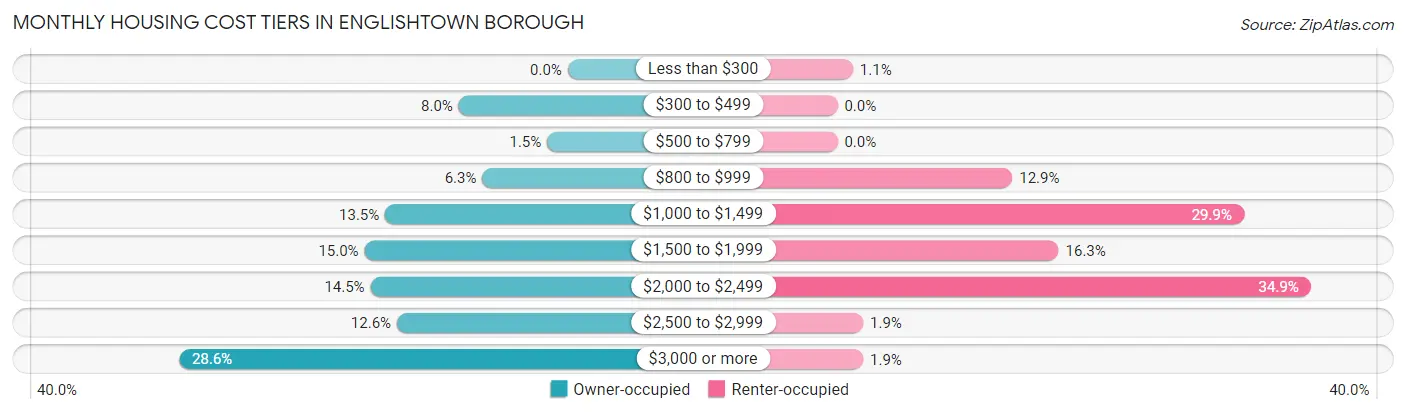
| Monthly Cost | Owner-occupied | Renter-occupied |
| Less than $300 | 0 (0.0%) | 3 (1.1%) |
| $300 to $499 | 37 (8.0%) | 0 (0.0%) |
| $500 to $799 | 7 (1.5%) | 0 (0.0%) |
| $800 to $999 | 29 (6.3%) | 34 (12.9%) |
| $1,000 to $1,499 | 62 (13.5%) | 79 (29.9%) |
| $1,500 to $1,999 | 69 (15.0%) | 43 (16.3%) |
| $2,000 to $2,499 | 67 (14.5%) | 92 (34.8%) |
| $2,500 to $2,999 | 58 (12.6%) | 5 (1.9%) |
| $3,000 or more | 132 (28.6%) | 5 (1.9%) |
| Total | 461 (100.0%) | 264 (100.0%) |
Physical Housing Characteristics in Englishtown borough
Housing Structures in Englishtown borough
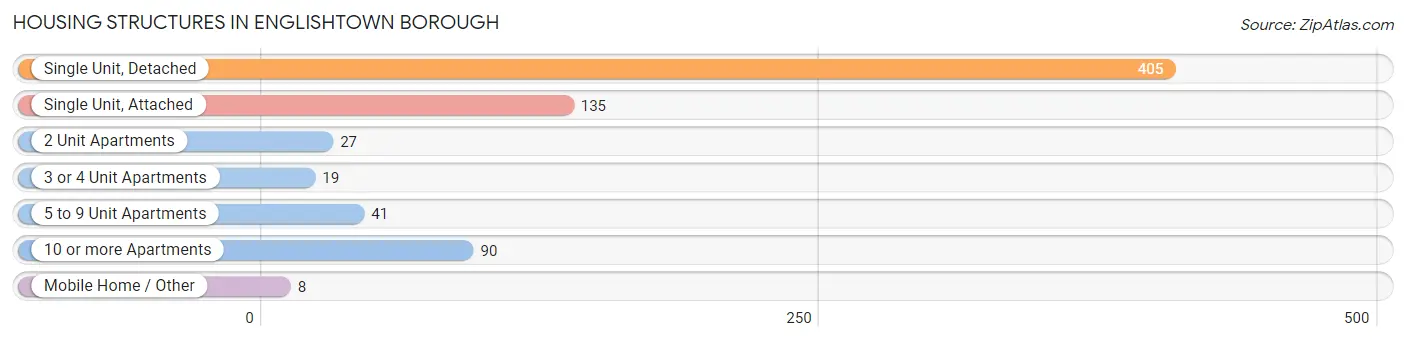
| Structure Type | # Housing Units | % Housing Units |
| Single Unit, Detached | 405 | 55.9% |
| Single Unit, Attached | 135 | 18.6% |
| 2 Unit Apartments | 27 | 3.7% |
| 3 or 4 Unit Apartments | 19 | 2.6% |
| 5 to 9 Unit Apartments | 41 | 5.7% |
| 10 or more Apartments | 90 | 12.4% |
| Mobile Home / Other | 8 | 1.1% |
| Total | 725 | 100.0% |
Housing Structures by Occupancy in Englishtown borough
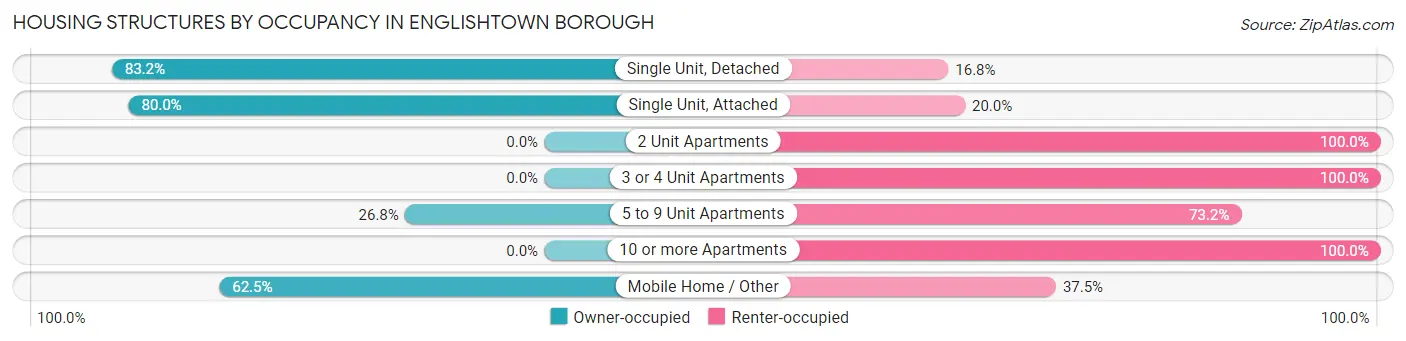
| Structure Type | Owner-occupied | Renter-occupied |
| Single Unit, Detached | 337 (83.2%) | 68 (16.8%) |
| Single Unit, Attached | 108 (80.0%) | 27 (20.0%) |
| 2 Unit Apartments | 0 (0.0%) | 27 (100.0%) |
| 3 or 4 Unit Apartments | 0 (0.0%) | 19 (100.0%) |
| 5 to 9 Unit Apartments | 11 (26.8%) | 30 (73.2%) |
| 10 or more Apartments | 0 (0.0%) | 90 (100.0%) |
| Mobile Home / Other | 5 (62.5%) | 3 (37.5%) |
| Total | 461 (63.6%) | 264 (36.4%) |
Housing Structures by Number of Rooms in Englishtown borough
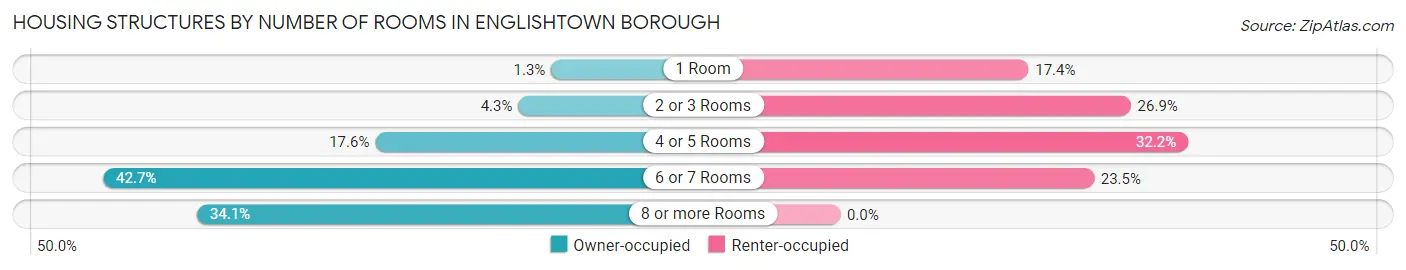
| Number of Rooms | Owner-occupied | Renter-occupied |
| 1 Room | 6 (1.3%) | 46 (17.4%) |
| 2 or 3 Rooms | 20 (4.3%) | 71 (26.9%) |
| 4 or 5 Rooms | 81 (17.6%) | 85 (32.2%) |
| 6 or 7 Rooms | 197 (42.7%) | 62 (23.5%) |
| 8 or more Rooms | 157 (34.1%) | 0 (0.0%) |
| Total | 461 (100.0%) | 264 (100.0%) |
Housing Structure by Heating Type in Englishtown borough
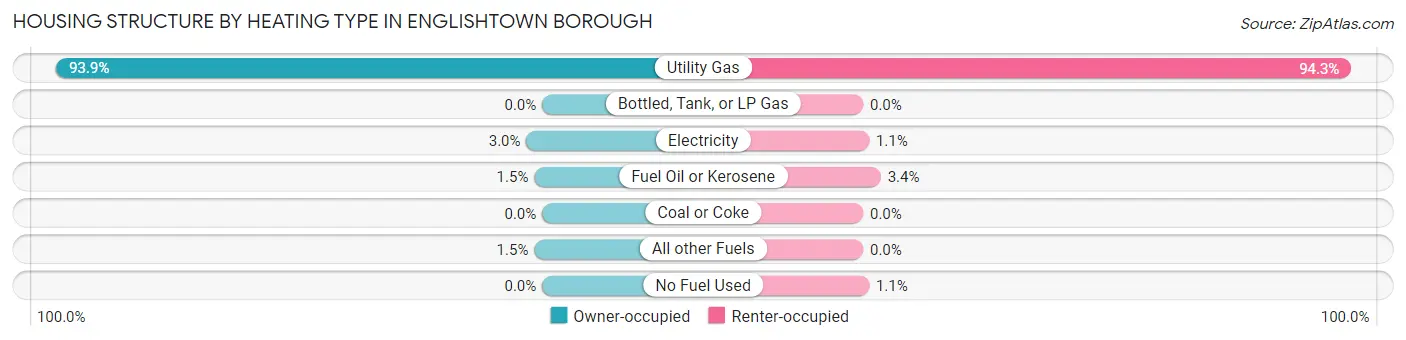
| Heating Type | Owner-occupied | Renter-occupied |
| Utility Gas | 433 (93.9%) | 249 (94.3%) |
| Bottled, Tank, or LP Gas | 0 (0.0%) | 0 (0.0%) |
| Electricity | 14 (3.0%) | 3 (1.1%) |
| Fuel Oil or Kerosene | 7 (1.5%) | 9 (3.4%) |
| Coal or Coke | 0 (0.0%) | 0 (0.0%) |
| All other Fuels | 7 (1.5%) | 0 (0.0%) |
| No Fuel Used | 0 (0.0%) | 3 (1.1%) |
| Total | 461 (100.0%) | 264 (100.0%) |
Household Vehicle Usage in Englishtown borough
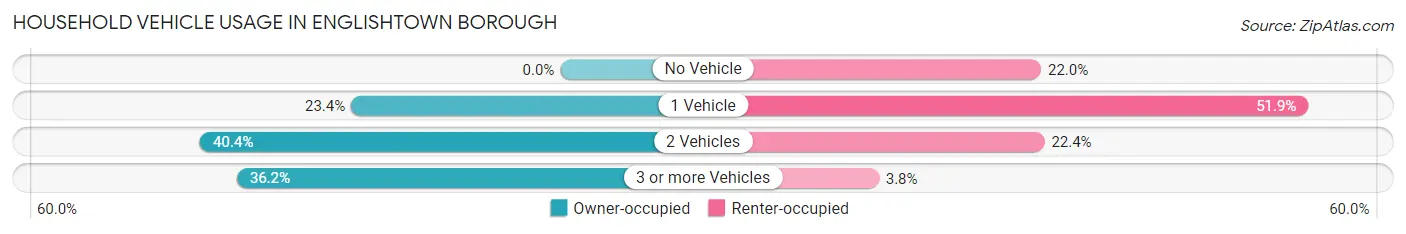
| Vehicles per Household | Owner-occupied | Renter-occupied |
| No Vehicle | 0 (0.0%) | 58 (22.0%) |
| 1 Vehicle | 108 (23.4%) | 137 (51.9%) |
| 2 Vehicles | 186 (40.4%) | 59 (22.4%) |
| 3 or more Vehicles | 167 (36.2%) | 10 (3.8%) |
| Total | 461 (100.0%) | 264 (100.0%) |
Real Estate & Mortgages in Englishtown borough
Real Estate and Mortgage Overview in Englishtown borough
| Characteristic | Without Mortgage | With Mortgage |
| Housing Units | 137 | 324 |
| Median Property Value | $369,700 | $439,700 |
| Median Household Income | - | - |
| Monthly Housing Costs | $970 | $132 |
| Real Estate Taxes | $6,680 | $4 |
Property Value by Mortgage Status in Englishtown borough
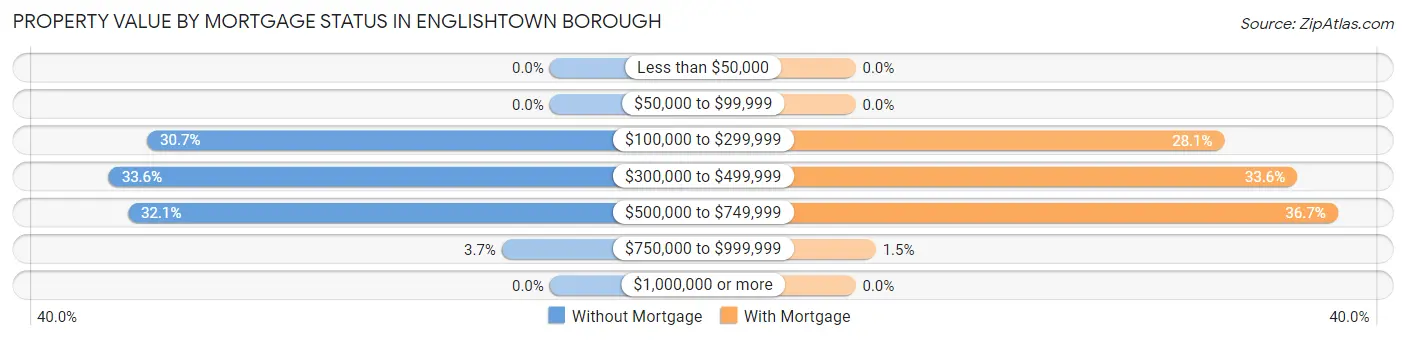
| Property Value | Without Mortgage | With Mortgage |
| Less than $50,000 | 0 (0.0%) | 0 (0.0%) |
| $50,000 to $99,999 | 0 (0.0%) | 0 (0.0%) |
| $100,000 to $299,999 | 42 (30.7%) | 91 (28.1%) |
| $300,000 to $499,999 | 46 (33.6%) | 109 (33.6%) |
| $500,000 to $749,999 | 44 (32.1%) | 119 (36.7%) |
| $750,000 to $999,999 | 5 (3.6%) | 5 (1.5%) |
| $1,000,000 or more | 0 (0.0%) | 0 (0.0%) |
| Total | 137 (100.0%) | 324 (100.0%) |
Household Income by Mortgage Status in Englishtown borough
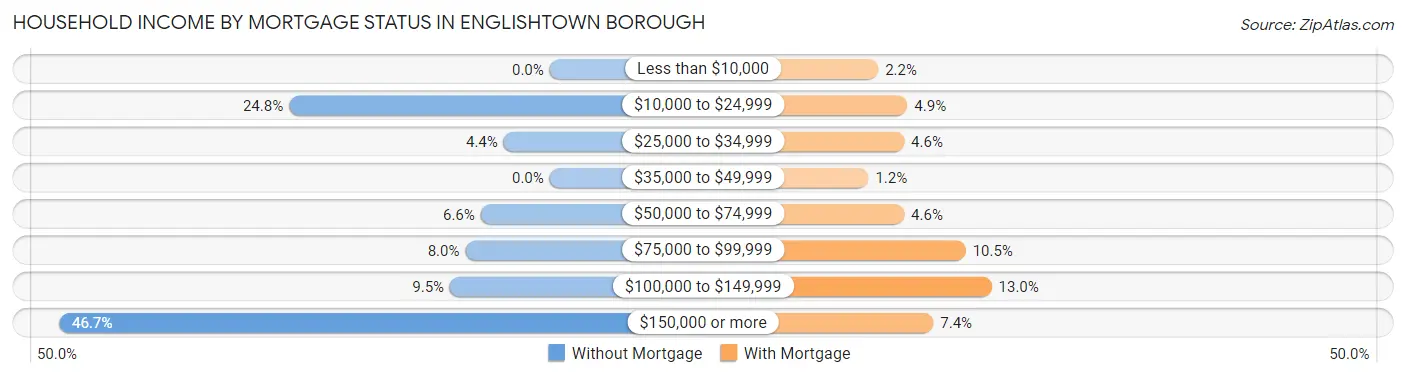
| Household Income | Without Mortgage | With Mortgage |
| Less than $10,000 | 0 (0.0%) | 7 (2.2%) |
| $10,000 to $24,999 | 34 (24.8%) | 16 (4.9%) |
| $25,000 to $34,999 | 6 (4.4%) | 15 (4.6%) |
| $35,000 to $49,999 | 0 (0.0%) | 4 (1.2%) |
| $50,000 to $74,999 | 9 (6.6%) | 15 (4.6%) |
| $75,000 to $99,999 | 11 (8.0%) | 34 (10.5%) |
| $100,000 to $149,999 | 13 (9.5%) | 42 (13.0%) |
| $150,000 or more | 64 (46.7%) | 24 (7.4%) |
| Total | 137 (100.0%) | 324 (100.0%) |
Property Value to Household Income Ratio in Englishtown borough
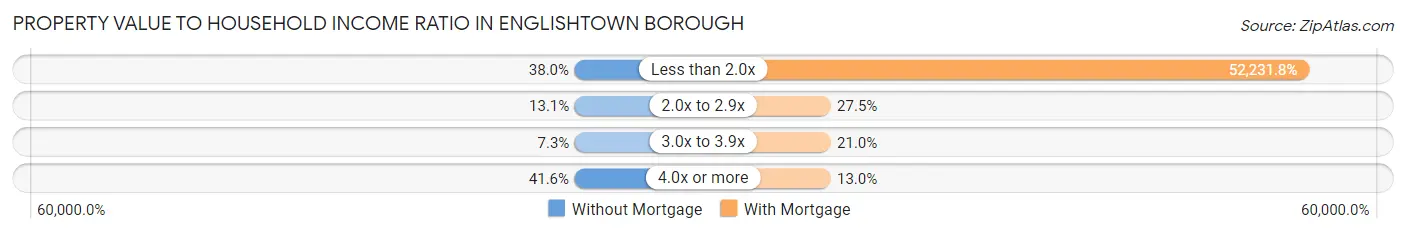
| Value-to-Income Ratio | Without Mortgage | With Mortgage |
| Less than 2.0x | 52 (38.0%) | 169,231 (52,231.8%) |
| 2.0x to 2.9x | 18 (13.1%) | 89 (27.5%) |
| 3.0x to 3.9x | 10 (7.3%) | 68 (21.0%) |
| 4.0x or more | 57 (41.6%) | 42 (13.0%) |
| Total | 137 (100.0%) | 324 (100.0%) |
Real Estate Taxes by Mortgage Status in Englishtown borough
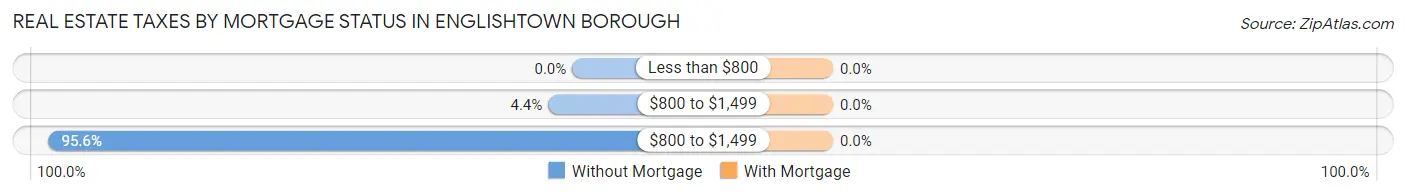
| Property Taxes | Without Mortgage | With Mortgage |
| Less than $800 | 0 (0.0%) | 0 (0.0%) |
| $800 to $1,499 | 6 (4.4%) | 0 (0.0%) |
| $800 to $1,499 | 131 (95.6%) | 0 (0.0%) |
| Total | 137 (100.0%) | 324 (100.0%) |
Health & Disability in Englishtown borough
Health Insurance Coverage by Age in Englishtown borough
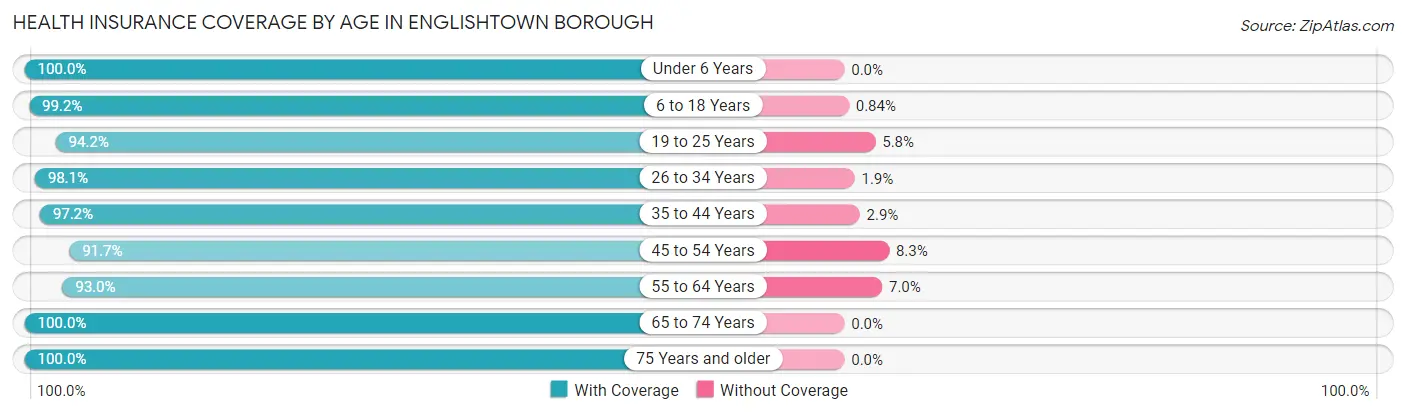
| Age Bracket | With Coverage | Without Coverage |
| Under 6 Years | 84 (100.0%) | 0 (0.0%) |
| 6 to 18 Years | 470 (99.2%) | 4 (0.8%) |
| 19 to 25 Years | 163 (94.2%) | 10 (5.8%) |
| 26 to 34 Years | 205 (98.1%) | 4 (1.9%) |
| 35 to 44 Years | 273 (97.2%) | 8 (2.9%) |
| 45 to 54 Years | 264 (91.7%) | 24 (8.3%) |
| 55 to 64 Years | 330 (93.0%) | 25 (7.0%) |
| 65 to 74 Years | 154 (100.0%) | 0 (0.0%) |
| 75 Years and older | 82 (100.0%) | 0 (0.0%) |
| Total | 2,025 (96.4%) | 75 (3.6%) |
Health Insurance Coverage by Citizenship Status in Englishtown borough
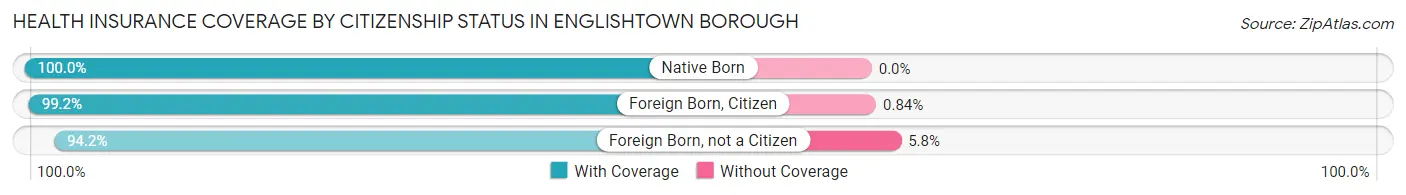
| Citizenship Status | With Coverage | Without Coverage |
| Native Born | 84 (100.0%) | 0 (0.0%) |
| Foreign Born, Citizen | 470 (99.2%) | 4 (0.8%) |
| Foreign Born, not a Citizen | 163 (94.2%) | 10 (5.8%) |
Health Insurance Coverage by Household Income in Englishtown borough
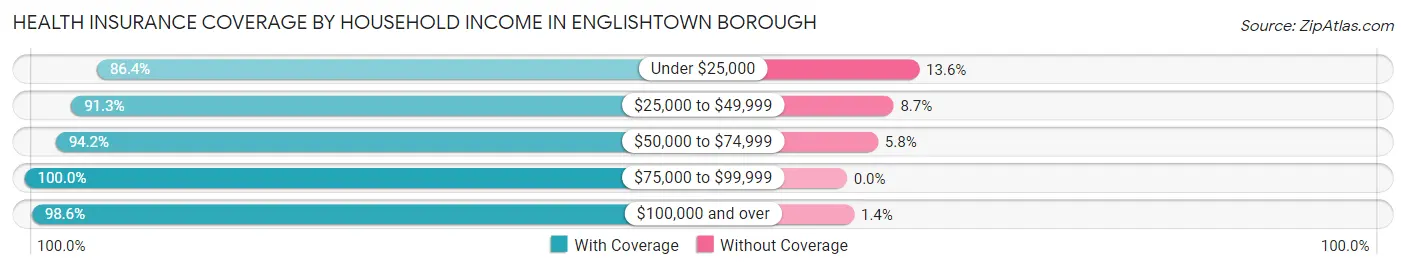
| Household Income | With Coverage | Without Coverage |
| Under $25,000 | 204 (86.4%) | 32 (13.6%) |
| $25,000 to $49,999 | 188 (91.3%) | 18 (8.7%) |
| $50,000 to $74,999 | 113 (94.2%) | 7 (5.8%) |
| $75,000 to $99,999 | 174 (100.0%) | 0 (0.0%) |
| $100,000 and over | 1,302 (98.6%) | 18 (1.4%) |
Public vs Private Health Insurance Coverage by Age in Englishtown borough
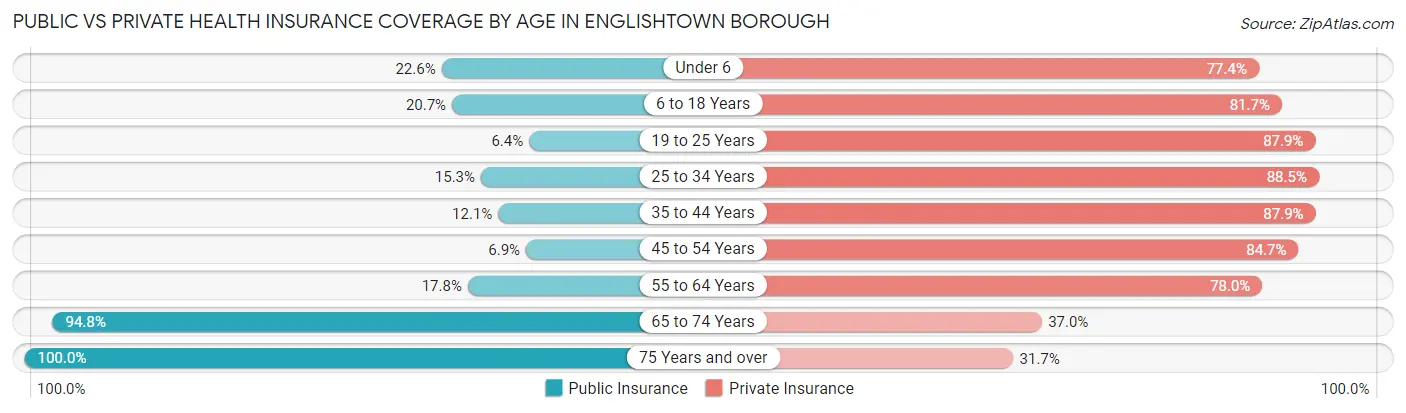
| Age Bracket | Public Insurance | Private Insurance |
| Under 6 | 19 (22.6%) | 65 (77.4%) |
| 6 to 18 Years | 98 (20.7%) | 387 (81.7%) |
| 19 to 25 Years | 11 (6.4%) | 152 (87.9%) |
| 25 to 34 Years | 32 (15.3%) | 185 (88.5%) |
| 35 to 44 Years | 34 (12.1%) | 247 (87.9%) |
| 45 to 54 Years | 20 (6.9%) | 244 (84.7%) |
| 55 to 64 Years | 63 (17.7%) | 277 (78.0%) |
| 65 to 74 Years | 146 (94.8%) | 57 (37.0%) |
| 75 Years and over | 82 (100.0%) | 26 (31.7%) |
| Total | 505 (24.0%) | 1,640 (78.1%) |
Disability Status by Sex by Age in Englishtown borough
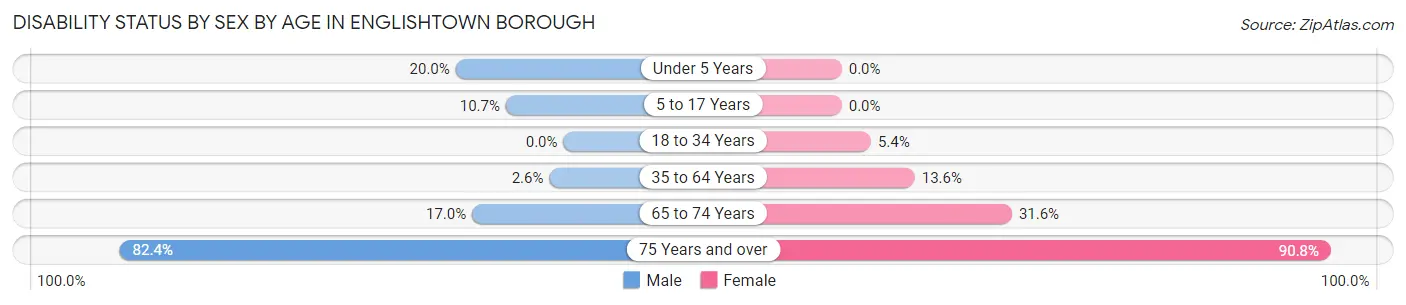
| Age Bracket | Male | Female |
| Under 5 Years | 10 (20.0%) | 0 (0.0%) |
| 5 to 17 Years | 28 (10.7%) | 0 (0.0%) |
| 18 to 34 Years | 0 (0.0%) | 12 (5.4%) |
| 35 to 64 Years | 11 (2.6%) | 68 (13.6%) |
| 65 to 74 Years | 10 (17.0%) | 30 (31.6%) |
| 75 Years and over | 14 (82.4%) | 59 (90.8%) |
Disability Class by Sex by Age in Englishtown borough
Disability Class: Hearing Difficulty
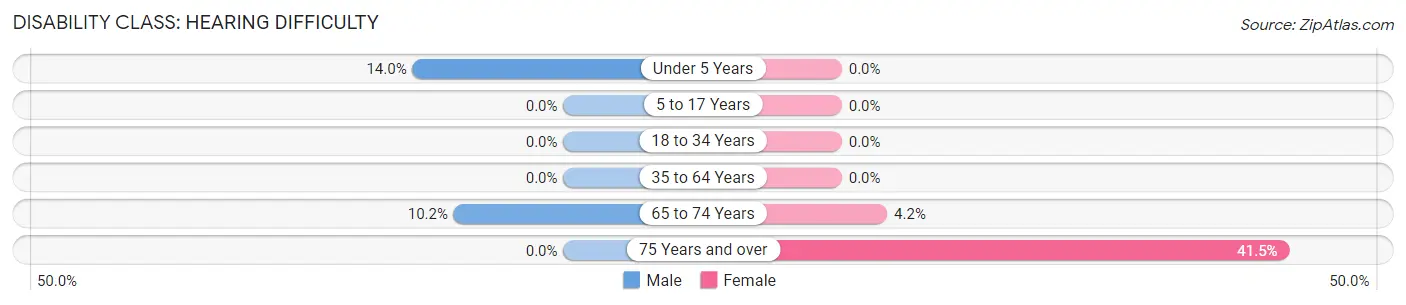
| Age Bracket | Male | Female |
| Under 5 Years | 7 (14.0%) | 0 (0.0%) |
| 5 to 17 Years | 0 (0.0%) | 0 (0.0%) |
| 18 to 34 Years | 0 (0.0%) | 0 (0.0%) |
| 35 to 64 Years | 0 (0.0%) | 0 (0.0%) |
| 65 to 74 Years | 6 (10.2%) | 4 (4.2%) |
| 75 Years and over | 0 (0.0%) | 27 (41.5%) |
Disability Class: Vision Difficulty
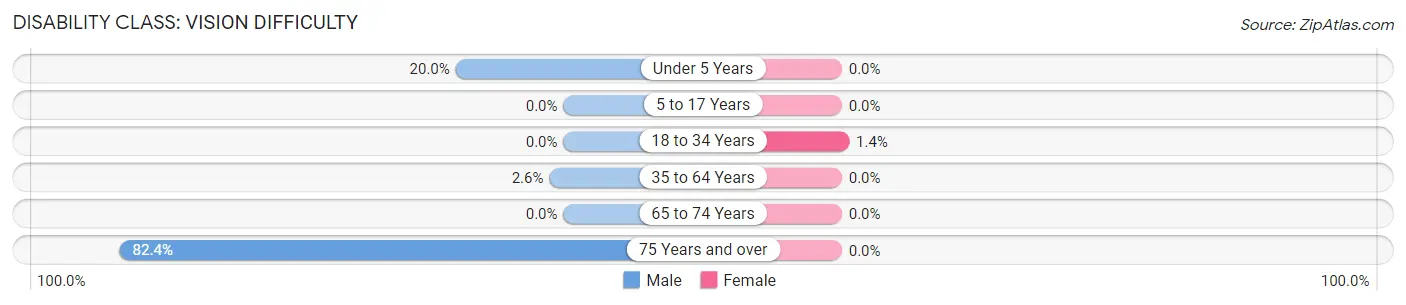
| Age Bracket | Male | Female |
| Under 5 Years | 10 (20.0%) | 0 (0.0%) |
| 5 to 17 Years | 0 (0.0%) | 0 (0.0%) |
| 18 to 34 Years | 0 (0.0%) | 3 (1.3%) |
| 35 to 64 Years | 11 (2.6%) | 0 (0.0%) |
| 65 to 74 Years | 0 (0.0%) | 0 (0.0%) |
| 75 Years and over | 14 (82.4%) | 0 (0.0%) |
Disability Class: Cognitive Difficulty
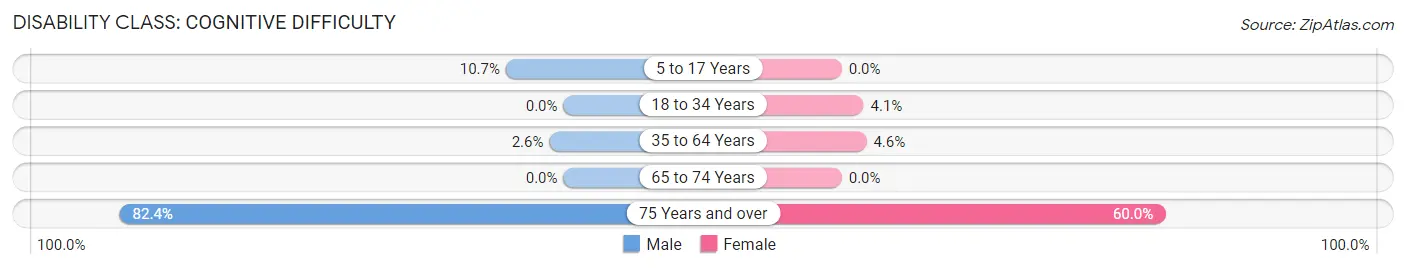
| Age Bracket | Male | Female |
| 5 to 17 Years | 28 (10.7%) | 0 (0.0%) |
| 18 to 34 Years | 0 (0.0%) | 9 (4.1%) |
| 35 to 64 Years | 11 (2.6%) | 23 (4.6%) |
| 65 to 74 Years | 0 (0.0%) | 0 (0.0%) |
| 75 Years and over | 14 (82.4%) | 39 (60.0%) |
Disability Class: Ambulatory Difficulty
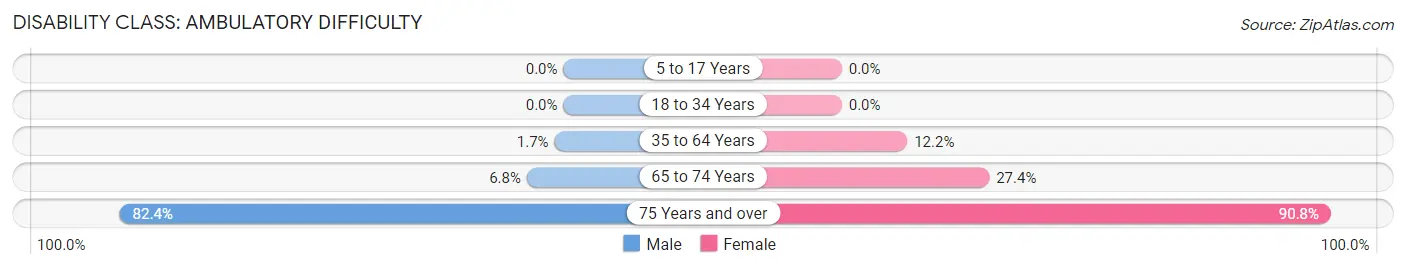
| Age Bracket | Male | Female |
| 5 to 17 Years | 0 (0.0%) | 0 (0.0%) |
| 18 to 34 Years | 0 (0.0%) | 0 (0.0%) |
| 35 to 64 Years | 7 (1.7%) | 61 (12.1%) |
| 65 to 74 Years | 4 (6.8%) | 26 (27.4%) |
| 75 Years and over | 14 (82.4%) | 59 (90.8%) |
Disability Class: Self-Care Difficulty
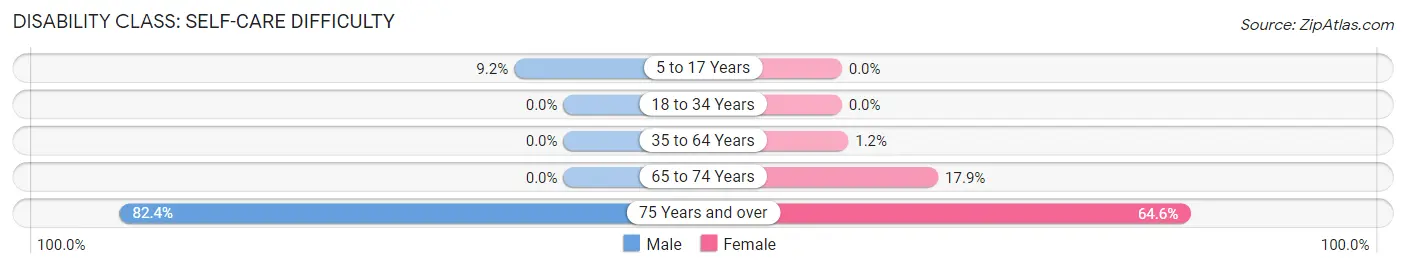
| Age Bracket | Male | Female |
| 5 to 17 Years | 24 (9.2%) | 0 (0.0%) |
| 18 to 34 Years | 0 (0.0%) | 0 (0.0%) |
| 35 to 64 Years | 0 (0.0%) | 6 (1.2%) |
| 65 to 74 Years | 0 (0.0%) | 17 (17.9%) |
| 75 Years and over | 14 (82.4%) | 42 (64.6%) |
Technology Access in Englishtown borough
Computing Device Access in Englishtown borough
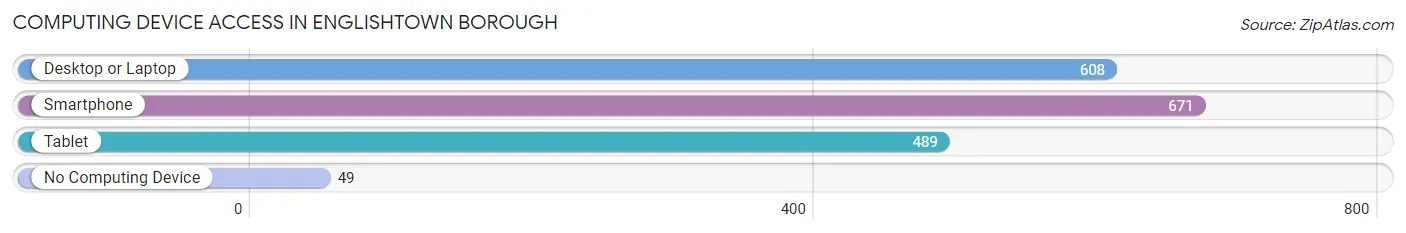
| Device Type | # Households | % Households |
| Desktop or Laptop | 608 | 83.9% |
| Smartphone | 671 | 92.5% |
| Tablet | 489 | 67.4% |
| No Computing Device | 49 | 6.8% |
| Total | 725 | 100.0% |
Internet Access in Englishtown borough
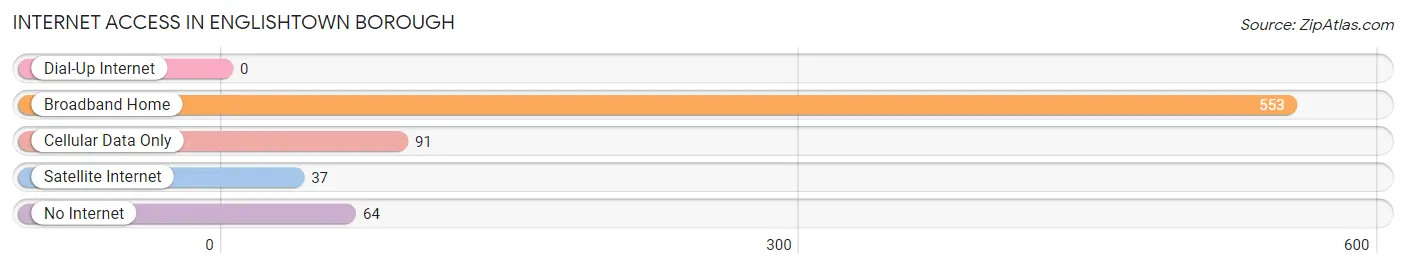
| Internet Type | # Households | % Households |
| Dial-Up Internet | 0 | 0.0% |
| Broadband Home | 553 | 76.3% |
| Cellular Data Only | 91 | 12.6% |
| Satellite Internet | 37 | 5.1% |
| No Internet | 64 | 8.8% |
| Total | 725 | 100.0% |
Englishtown borough Summary
History
Englishtown Borough is a small borough located in Monmouth County, New Jersey. It is situated in the northern part of the county, and is bordered by Manalapan Township to the north, Millstone Township to the east, and Monroe Township to the south and west. The borough was incorporated in 1888, and is named after the English settlers who first arrived in the area in the late 17th century.
The area that is now Englishtown was originally inhabited by the Lenape Native Americans. The first European settlers arrived in the area in 1685, and the town was officially established in 1702. The town was originally known as “English Towne”, and was a farming community. In the late 19th century, the town began to grow and develop, and in 1888 it was officially incorporated as a borough.
In the early 20th century, Englishtown was a popular destination for vacationers, and the town was home to several resorts and hotels. The town also had a thriving business district, with several stores and businesses. In the 1950s, the town began to decline, and many of the businesses and resorts closed. In the late 20th century, the town began to experience a resurgence, and today it is a popular destination for visitors and residents alike.
Geography
Englishtown Borough is located in northern Monmouth County, New Jersey. It is situated between Manalapan Township to the north, Millstone Township to the east, and Monroe Township to the south and west. The borough covers an area of 1.3 square miles, and is home to a population of approximately 4,000 people.
The borough is located in the Raritan Valley region of New Jersey, and is situated on the banks of the Manasquan River. The borough is mostly flat, with some rolling hills in the northern part of the borough. The borough is home to several parks and recreational areas, including the Englishtown Recreation Area, which features a lake, picnic areas, and a playground.
Economy
Englishtown Borough has a diverse economy, with a variety of businesses and industries. The borough is home to several retail stores, restaurants, and other businesses. The borough is also home to several manufacturing companies, including a plastics manufacturer and a metal fabrication company.
The borough is also home to several educational institutions, including the Englishtown Middle School and the Englishtown High School. The borough is also home to several churches, and is a popular destination for visitors and residents alike.
Demographics
As of the 2010 census, Englishtown Borough had a population of 4,039 people. The racial makeup of the borough was 79.3% White, 11.2% African American, 0.3% Native American, 2.2% Asian, and 6.9% from other races. Hispanic or Latino of any race were 8.7% of the population.
The median household income in Englishtown Borough was $63,917, and the median family income was $76,917. The per capita income was $30,917. About 4.3% of families and 5.7% of the population were below the poverty line, including 8.2% of those under age 18 and 4.3% of those age 65 or over.
Common Questions
What is Per Capita Income in Englishtown borough?
Per Capita income in Englishtown borough is $48,523.
What is the Median Family Income in Englishtown borough?
Median Family Income in Englishtown borough is $114,556.
What is the Median Household income in Englishtown borough?
Median Household Income in Englishtown borough is $101,750.
What is Income or Wage Gap in Englishtown borough?
Income or Wage Gap in Englishtown borough is 33.6%.
Women in Englishtown borough earn 66.4 cents for every dollar earned by a man.
What is Family Income Deficit in Englishtown borough?
Family Income Deficit in Englishtown borough is $9,594.
Families that are below poverty line in Englishtown borough earn $9,594 less on average than the poverty threshold level.
What is Inequality or Gini Index in Englishtown borough?
Inequality or Gini Index in Englishtown borough is 0.49.
What is the Total Population of Englishtown borough?
Total Population of Englishtown borough is 2,129.
What is the Total Male Population of Englishtown borough?
Total Male Population of Englishtown borough is 1,048.
What is the Total Female Population of Englishtown borough?
Total Female Population of Englishtown borough is 1,081.
What is the Ratio of Males per 100 Females in Englishtown borough?
There are 96.95 Males per 100 Females in Englishtown borough.
What is the Ratio of Females per 100 Males in Englishtown borough?
There are 103.15 Females per 100 Males in Englishtown borough.
What is the Median Population Age in Englishtown borough?
Median Population Age in Englishtown borough is 37.9 Years.
What is the Average Family Size in Englishtown borough
Average Family Size in Englishtown borough is 3.2 People.
What is the Average Household Size in Englishtown borough
Average Household Size in Englishtown borough is 2.8 People.
How Large is the Labor Force in Englishtown borough?
There are 1,170 People in the Labor Forcein in Englishtown borough.
What is the Percentage of People in the Labor Force in Englishtown borough?
68.2% of People are in the Labor Force in Englishtown borough.
What is the Unemployment Rate in Englishtown borough?
Unemployment Rate in Englishtown borough is 8.3%.