Hainesburg, NJ Map & Demographics
Hainesburg Map
Hainesburg Overview
$31,784
PER CAPITA INCOME
$97,454
AVG FAMILY INCOME
$96,759
AVG HOUSEHOLD INCOME
0.19
INEQUALITY / GINI INDEX
257
TOTAL POPULATION
142
MALE POPULATION
115
FEMALE POPULATION
123.48
MALES / 100 FEMALES
80.99
FEMALES / 100 MALES
35.2
MEDIAN AGE
3.7
AVG FAMILY SIZE
3.2
AVG HOUSEHOLD SIZE
95
LABOR FORCE [ PEOPLE ]
66.9%
PERCENT IN LABOR FORCE
Income in Hainesburg
Income Overview in Hainesburg
Per Capita Income in Hainesburg is $31,784, while median incomes of families and households are $97,454 and $96,759 respectively.
| Characteristic | Number | Measure |
| Per Capita Income | 257 | $31,784 |
| Median Family Income | 65 | $97,454 |
| Mean Family Income | 65 | $117,131 |
| Median Household Income | 80 | $96,759 |
| Mean Household Income | 80 | $106,585 |
| Income Deficit | 65 | $0 |
| Wage / Income Gap (%) | 257 | 0.00% |
| Wage / Income Gap ($) | 257 | 100.00¢ per $1 |
| Gini / Inequality Index | 257 | 0.19 |
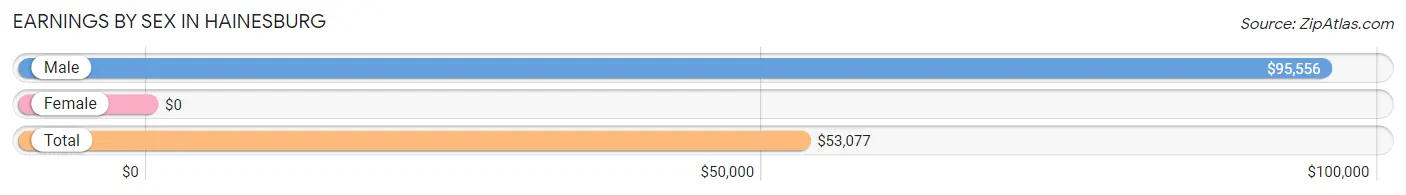
Earnings by Sex in Hainesburg
| Sex | Number | Average Earnings |
| Male | 60 (51.7%) | $95,556 |
| Female | 56 (48.3%) | $0 |
| Total | 116 (100.0%) | $53,077 |
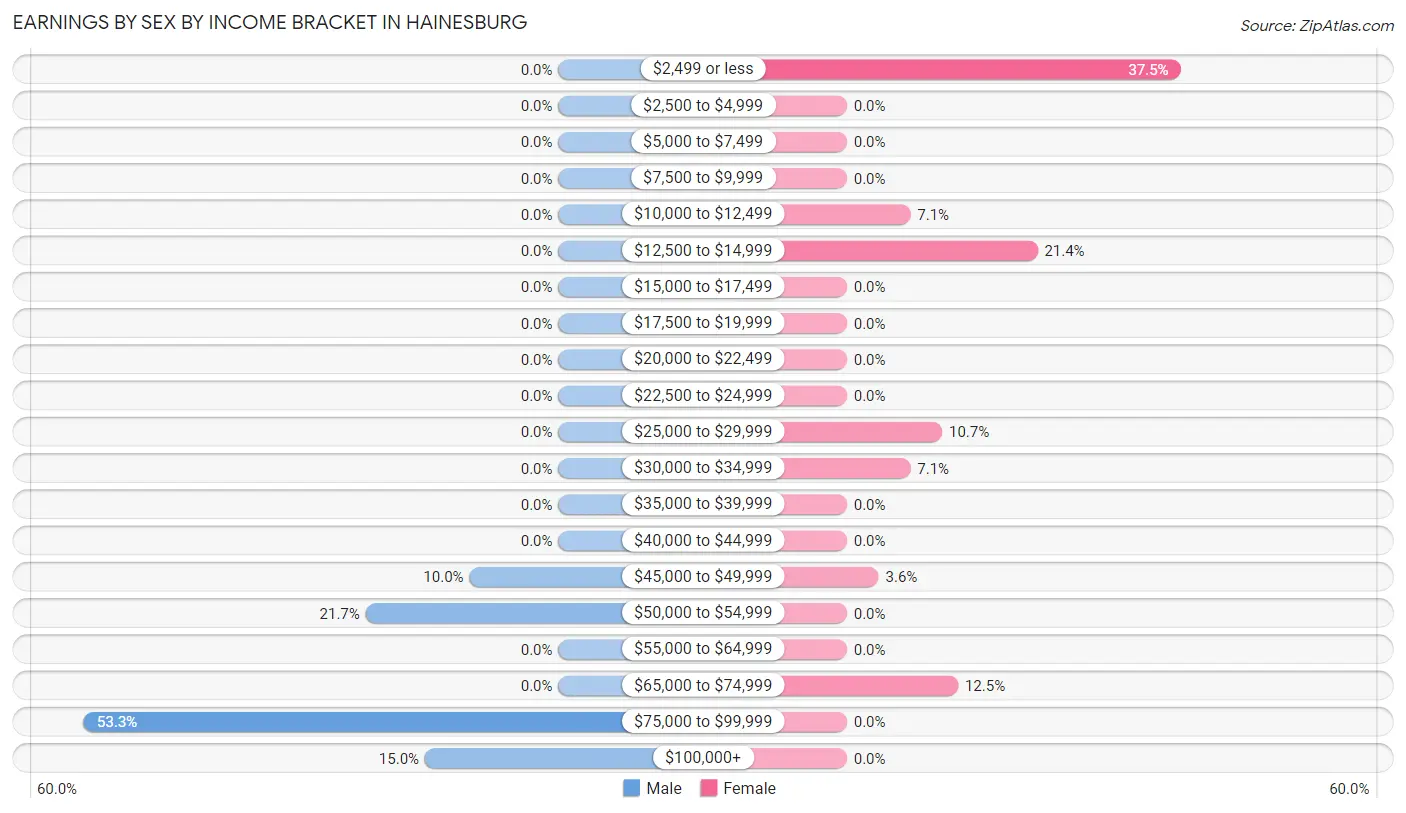
Earnings by Sex by Income Bracket in Hainesburg
The most common earnings brackets in Hainesburg are $75,000 to $99,999 for men (32 | 53.3%) and $2,499 or less for women (21 | 37.5%).
| Income | Male | Female |
| $2,499 or less | 0 (0.0%) | 21 (37.5%) |
| $2,500 to $4,999 | 0 (0.0%) | 0 (0.0%) |
| $5,000 to $7,499 | 0 (0.0%) | 0 (0.0%) |
| $7,500 to $9,999 | 0 (0.0%) | 0 (0.0%) |
| $10,000 to $12,499 | 0 (0.0%) | 4 (7.1%) |
| $12,500 to $14,999 | 0 (0.0%) | 12 (21.4%) |
| $15,000 to $17,499 | 0 (0.0%) | 0 (0.0%) |
| $17,500 to $19,999 | 0 (0.0%) | 0 (0.0%) |
| $20,000 to $22,499 | 0 (0.0%) | 0 (0.0%) |
| $22,500 to $24,999 | 0 (0.0%) | 0 (0.0%) |
| $25,000 to $29,999 | 0 (0.0%) | 6 (10.7%) |
| $30,000 to $34,999 | 0 (0.0%) | 4 (7.1%) |
| $35,000 to $39,999 | 0 (0.0%) | 0 (0.0%) |
| $40,000 to $44,999 | 0 (0.0%) | 0 (0.0%) |
| $45,000 to $49,999 | 6 (10.0%) | 2 (3.6%) |
| $50,000 to $54,999 | 13 (21.7%) | 0 (0.0%) |
| $55,000 to $64,999 | 0 (0.0%) | 0 (0.0%) |
| $65,000 to $74,999 | 0 (0.0%) | 7 (12.5%) |
| $75,000 to $99,999 | 32 (53.3%) | 0 (0.0%) |
| $100,000+ | 9 (15.0%) | 0 (0.0%) |
| Total | 60 (100.0%) | 56 (100.0%) |
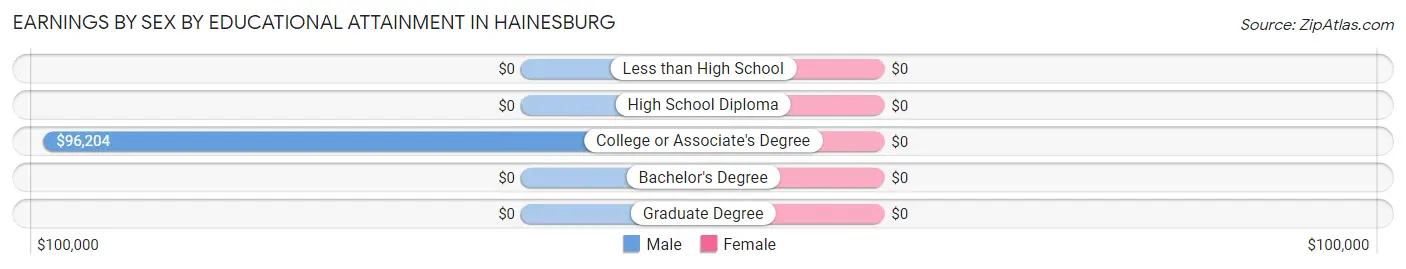
Earnings by Sex by Educational Attainment in Hainesburg
| Educational Attainment | Male Income | Female Income |
| Less than High School | - | - |
| High School Diploma | - | - |
| College or Associate's Degree | $96,204 | $0 |
| Bachelor's Degree | - | - |
| Graduate Degree | - | - |
| Total | $95,556 | $0 |
Family Income in Hainesburg
Family Income Brackets in Hainesburg
According to the Hainesburg family income data, there are 33 families falling into the $75,000 to $99,999 income range, which is the most common income bracket and makes up 50.8% of all families.
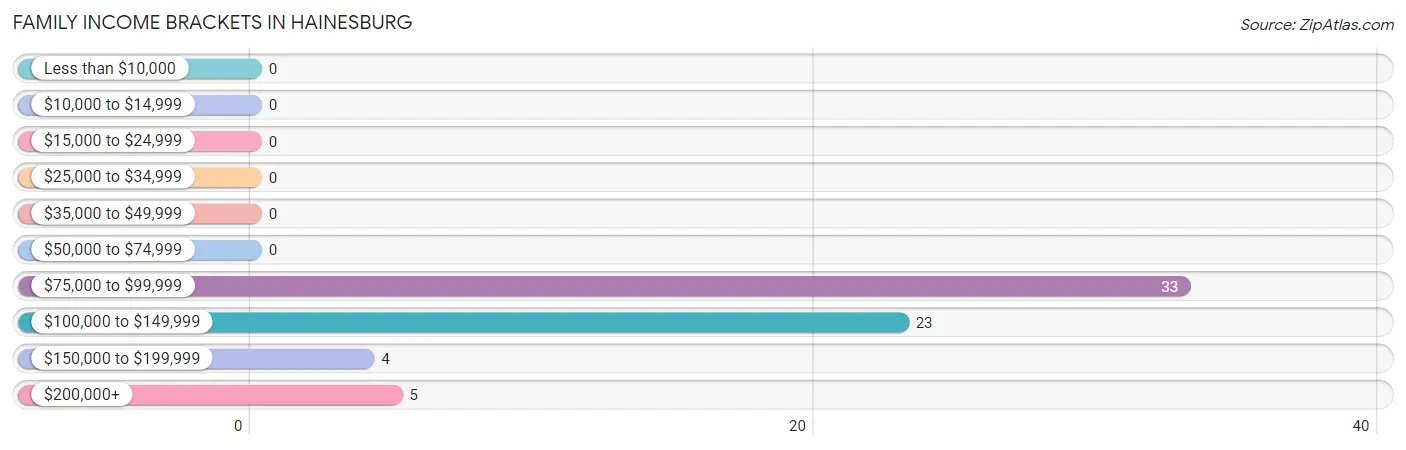
| Income Bracket | # Families | % Families |
| Less than $10,000 | 0 | 0.0% |
| $10,000 to $14,999 | 0 | 0.0% |
| $15,000 to $24,999 | 0 | 0.0% |
| $25,000 to $34,999 | 0 | 0.0% |
| $35,000 to $49,999 | 0 | 0.0% |
| $50,000 to $74,999 | 0 | 0.0% |
| $75,000 to $99,999 | 33 | 50.8% |
| $100,000 to $149,999 | 23 | 35.4% |
| $150,000 to $199,999 | 4 | 6.2% |
| $200,000+ | 5 | 7.7% |
Family Income by Famaliy Size in Hainesburg
2-person families (29 | 44.6%) account for the highest median family income in Hainesburg with $121,635 per family, while 2-person families (29 | 44.6%) have the highest median income of $60,818 per family member.
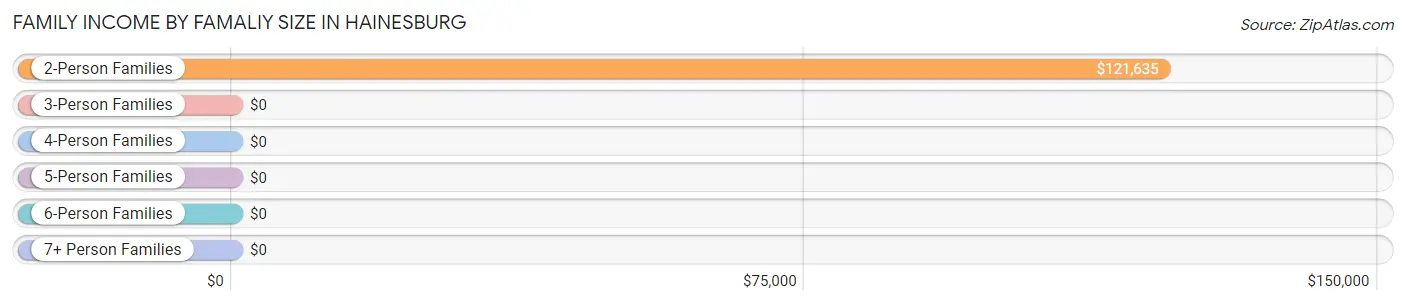
| Income Bracket | # Families | Median Income |
| 2-Person Families | 29 (44.6%) | $121,635 |
| 3-Person Families | 9 (13.9%) | $0 |
| 4-Person Families | 0 (0.0%) | $0 |
| 5-Person Families | 0 (0.0%) | $0 |
| 6-Person Families | 0 (0.0%) | $0 |
| 7+ Person Families | 27 (41.5%) | $0 |
| Total | 65 (100.0%) | $97,454 |
Family Income by Number of Earners in Hainesburg
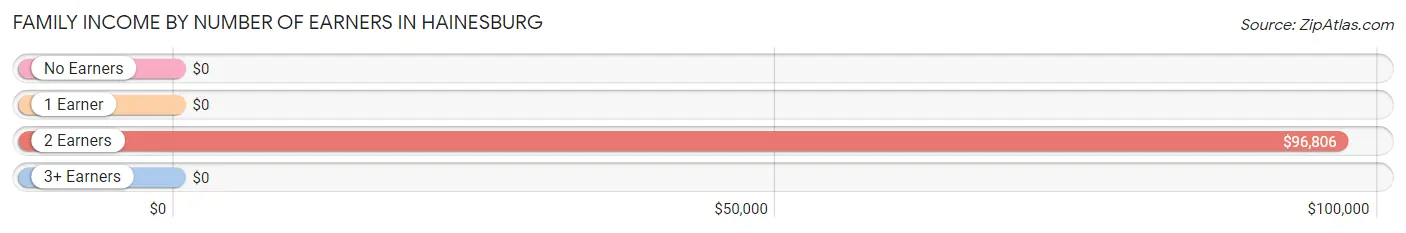
| Number of Earners | # Families | Median Income |
| No Earners | 10 (15.4%) | $0 |
| 1 Earner | 0 (0.0%) | $0 |
| 2 Earners | 51 (78.5%) | $96,806 |
| 3+ Earners | 4 (6.1%) | $0 |
| Total | 65 (100.0%) | $97,454 |
Household Income in Hainesburg
Household Income Brackets in Hainesburg
With 35 households falling in the category, the $75,000 to $99,999 income range is the most frequent in Hainesburg, accounting for 43.8% of all households.
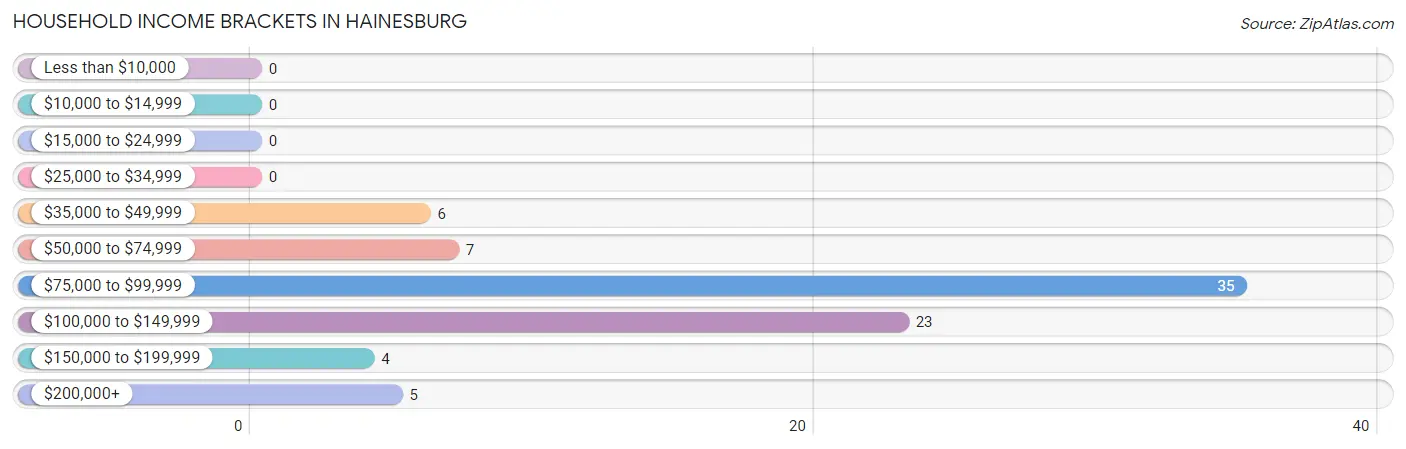
| Income Bracket | # Households | % Households |
| Less than $10,000 | 0 | 0.0% |
| $10,000 to $14,999 | 0 | 0.0% |
| $15,000 to $24,999 | 0 | 0.0% |
| $25,000 to $34,999 | 0 | 0.0% |
| $35,000 to $49,999 | 6 | 7.5% |
| $50,000 to $74,999 | 7 | 8.8% |
| $75,000 to $99,999 | 35 | 43.8% |
| $100,000 to $149,999 | 23 | 28.8% |
| $150,000 to $199,999 | 4 | 5.0% |
| $200,000+ | 5 | 6.3% |
Household Income by Householder Age in Hainesburg
The median household income in Hainesburg is $96,759, with the highest median household income of $121,442 found in the 45 to 64 years age bracket for the primary householder. A total of 29 households (36.2%) fall into this category.
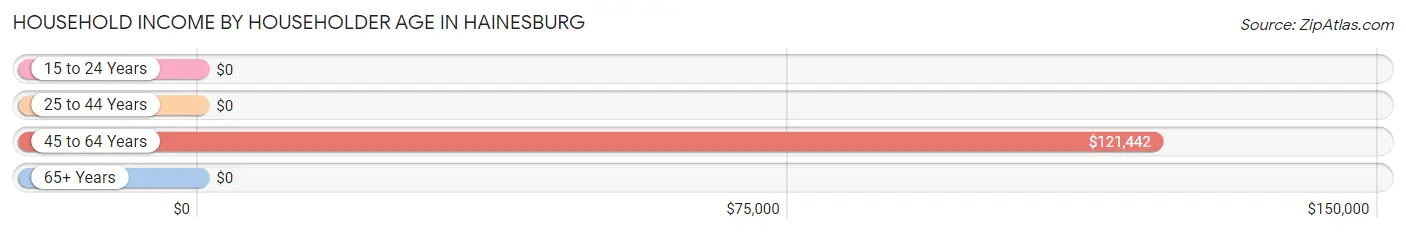
| Income Bracket | # Households | Median Income |
| 15 to 24 Years | 0 (0.0%) | $0 |
| 25 to 44 Years | 27 (33.8%) | $0 |
| 45 to 64 Years | 29 (36.2%) | $121,442 |
| 65+ Years | 24 (30.0%) | $0 |
| Total | 80 (100.0%) | $96,759 |
Poverty in Hainesburg
Income Below Poverty by Sex and Age in Hainesburg
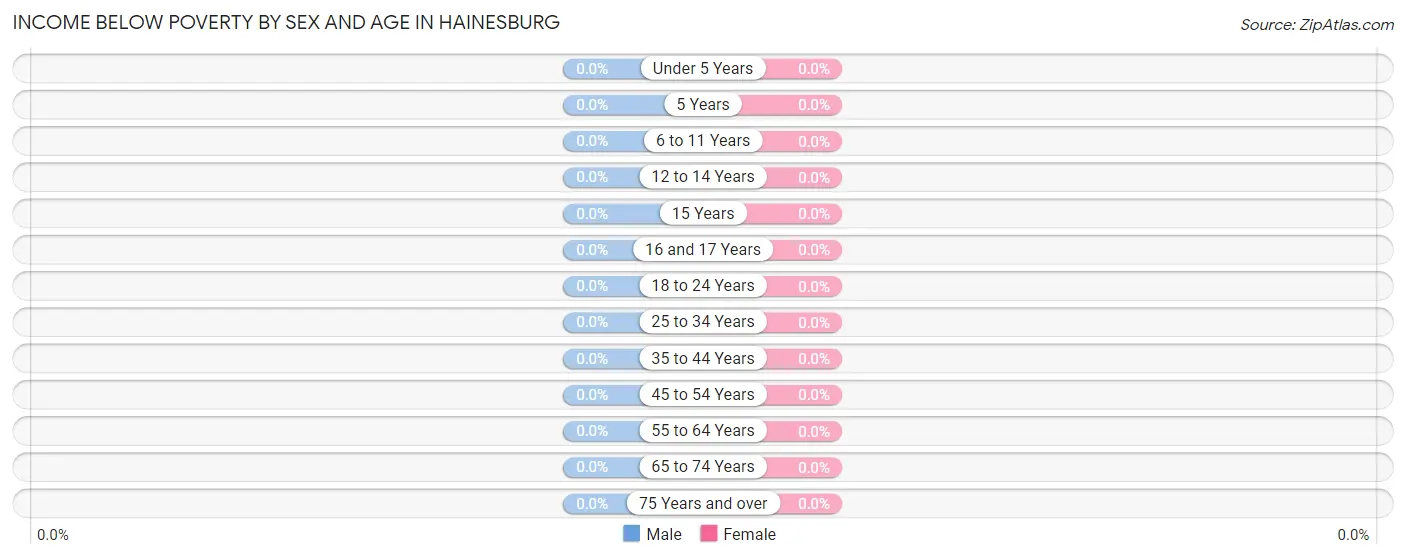
| Age Bracket | Male | Female |
| Under 5 Years | 0 (0.0%) | 0 (0.0%) |
| 5 Years | 0 (0.0%) | 0 (0.0%) |
| 6 to 11 Years | 0 (0.0%) | 0 (0.0%) |
| 12 to 14 Years | 0 (0.0%) | 0 (0.0%) |
| 15 Years | 0 (0.0%) | 0 (0.0%) |
| 16 and 17 Years | 0 (0.0%) | 0 (0.0%) |
| 18 to 24 Years | 0 (0.0%) | 0 (0.0%) |
| 25 to 34 Years | 0 (0.0%) | 0 (0.0%) |
| 35 to 44 Years | 0 (0.0%) | 0 (0.0%) |
| 45 to 54 Years | 0 (0.0%) | 0 (0.0%) |
| 55 to 64 Years | 0 (0.0%) | 0 (0.0%) |
| 65 to 74 Years | 0 (0.0%) | 0 (0.0%) |
| 75 Years and over | 0 (0.0%) | 0 (0.0%) |
| Total | 0 (0.0%) | 0 (0.0%) |
Income Above Poverty by Sex and Age in Hainesburg
According to the poverty statistics in Hainesburg, males aged 5 years and females aged under 5 years are the age groups that are most secure financially, with 100.0% of males and 100.0% of females in these age groups living above the poverty line.
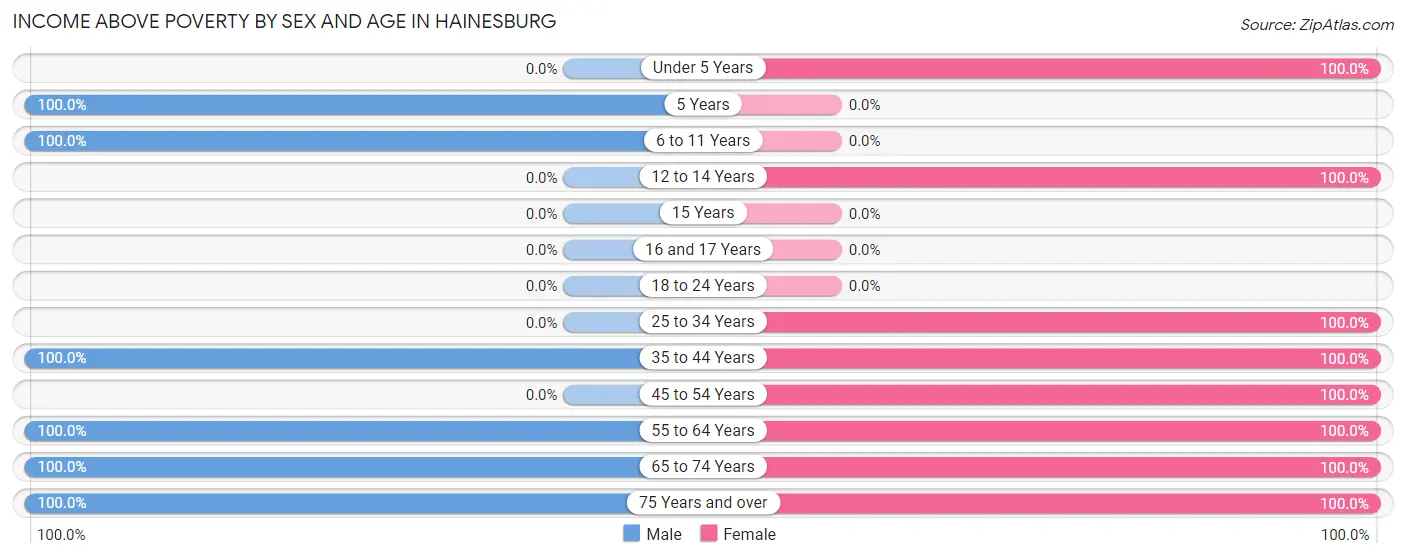
| Age Bracket | Male | Female |
| Under 5 Years | 0 (0.0%) | 21 (100.0%) |
| 5 Years | 23 (100.0%) | 0 (0.0%) |
| 6 to 11 Years | 48 (100.0%) | 0 (0.0%) |
| 12 to 14 Years | 0 (0.0%) | 23 (100.0%) |
| 15 Years | 0 (0.0%) | 0 (0.0%) |
| 16 and 17 Years | 0 (0.0%) | 0 (0.0%) |
| 18 to 24 Years | 0 (0.0%) | 0 (0.0%) |
| 25 to 34 Years | 0 (0.0%) | 4 (100.0%) |
| 35 to 44 Years | 37 (100.0%) | 21 (100.0%) |
| 45 to 54 Years | 0 (0.0%) | 5 (100.0%) |
| 55 to 64 Years | 17 (100.0%) | 29 (100.0%) |
| 65 to 74 Years | 6 (100.0%) | 2 (100.0%) |
| 75 Years and over | 11 (100.0%) | 10 (100.0%) |
| Total | 142 (100.0%) | 115 (100.0%) |
Income Below Poverty Among Married-Couple Families in Hainesburg
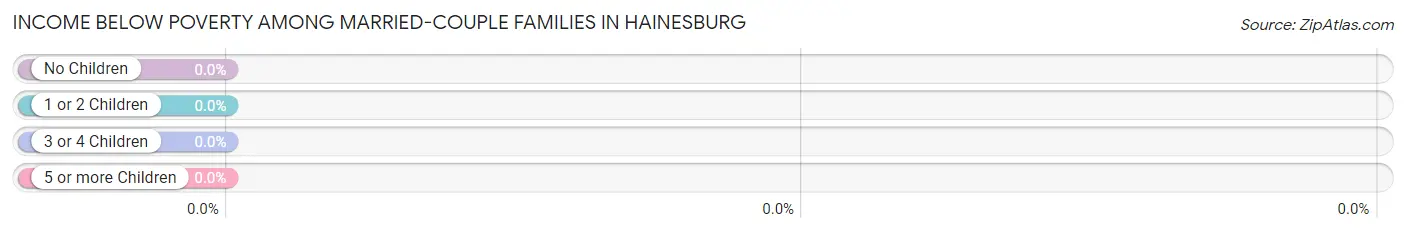
| Children | Above Poverty | Below Poverty |
| No Children | 33 (100.0%) | 0 (0.0%) |
| 1 or 2 Children | 0 (0.0%) | 0 (0.0%) |
| 3 or 4 Children | 0 (0.0%) | 0 (0.0%) |
| 5 or more Children | 27 (100.0%) | 0 (0.0%) |
| Total | 60 (100.0%) | 0 (0.0%) |
Income Below Poverty Among Single-Parent Households in Hainesburg
| Children | Single Father | Single Mother |
| No Children | 0 (0.0%) | 0 (0.0%) |
| 1 or 2 Children | 0 (0.0%) | 0 (0.0%) |
| 3 or 4 Children | 0 (0.0%) | 0 (0.0%) |
| 5 or more Children | 0 (0.0%) | 0 (0.0%) |
| Total | 0 (0.0%) | 0 (0.0%) |
Income Below Poverty Among Married-Couple vs Single-Parent Households in Hainesburg
| Children | Married-Couple Families | Single-Parent Households |
| No Children | 0 (0.0%) | 0 (0.0%) |
| 1 or 2 Children | 0 (0.0%) | 0 (0.0%) |
| 3 or 4 Children | 0 (0.0%) | 0 (0.0%) |
| 5 or more Children | 0 (0.0%) | 0 (0.0%) |
| Total | 0 (0.0%) | 0 (0.0%) |
Race in Hainesburg
The most populous races in Hainesburg are , and White / Caucasian (257 | 100.0%).
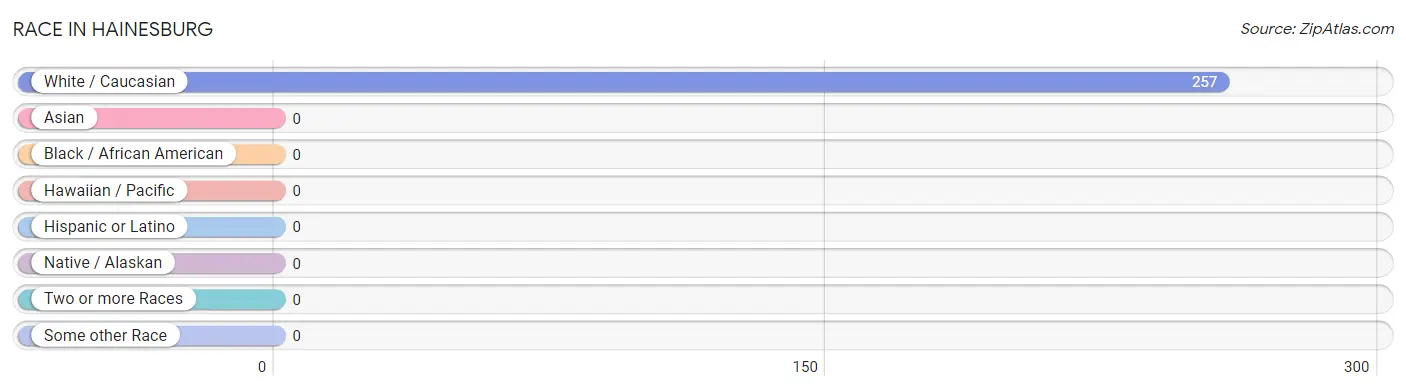
| Race | # Population | % Population |
| Asian | 0 | 0.0% |
| Black / African American | 0 | 0.0% |
| Hawaiian / Pacific | 0 | 0.0% |
| Hispanic or Latino | 0 | 0.0% |
| Native / Alaskan | 0 | 0.0% |
| White / Caucasian | 257 | 100.0% |
| Two or more Races | 0 | 0.0% |
| Some other Race | 0 | 0.0% |
| Total | 257 | 100.0% |
Ancestry in Hainesburg
The most populous ancestries reported in Hainesburg are Norwegian (119 | 46.3%), Italian (61 | 23.7%), English (31 | 12.1%), Irish (19 | 7.4%), and Polish (14 | 5.4%), together accounting for 94.9% of all Hainesburg residents.
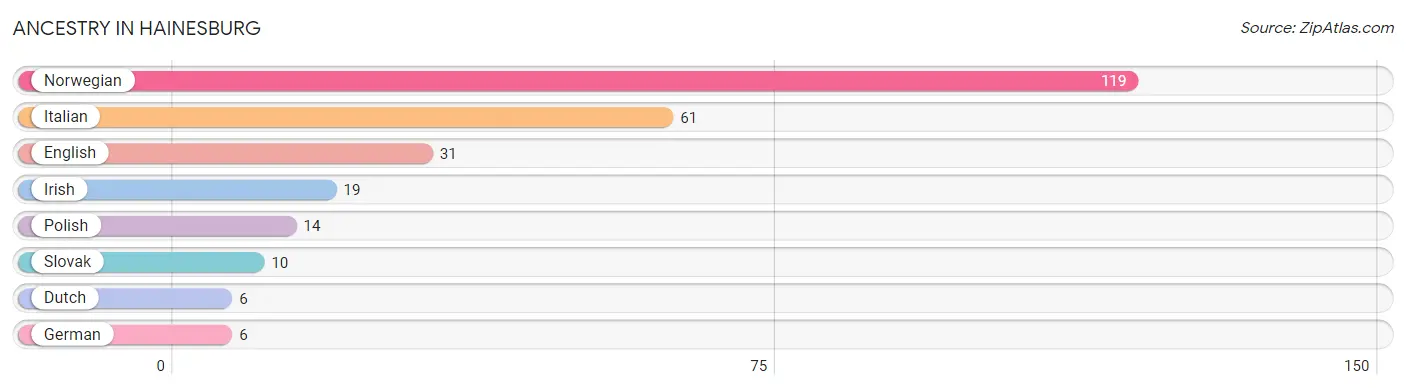
| Ancestry | # Population | % Population |
| Dutch | 6 | 2.3% |
| English | 31 | 12.1% |
| German | 6 | 2.3% |
| Irish | 19 | 7.4% |
| Italian | 61 | 23.7% |
| Norwegian | 119 | 46.3% |
| Polish | 14 | 5.4% |
| Slovak | 10 | 3.9% | View All 8 Rows |
Immigrants in Hainesburg

| Immigration Origin | # Population | % Population | View All 0 Rows |
Sex and Age in Hainesburg
Sex and Age in Hainesburg
The most populous age groups in Hainesburg are 5 to 9 Years (71 | 50.0%) for men and 10 to 14 Years (23 | 20.0%) for women.
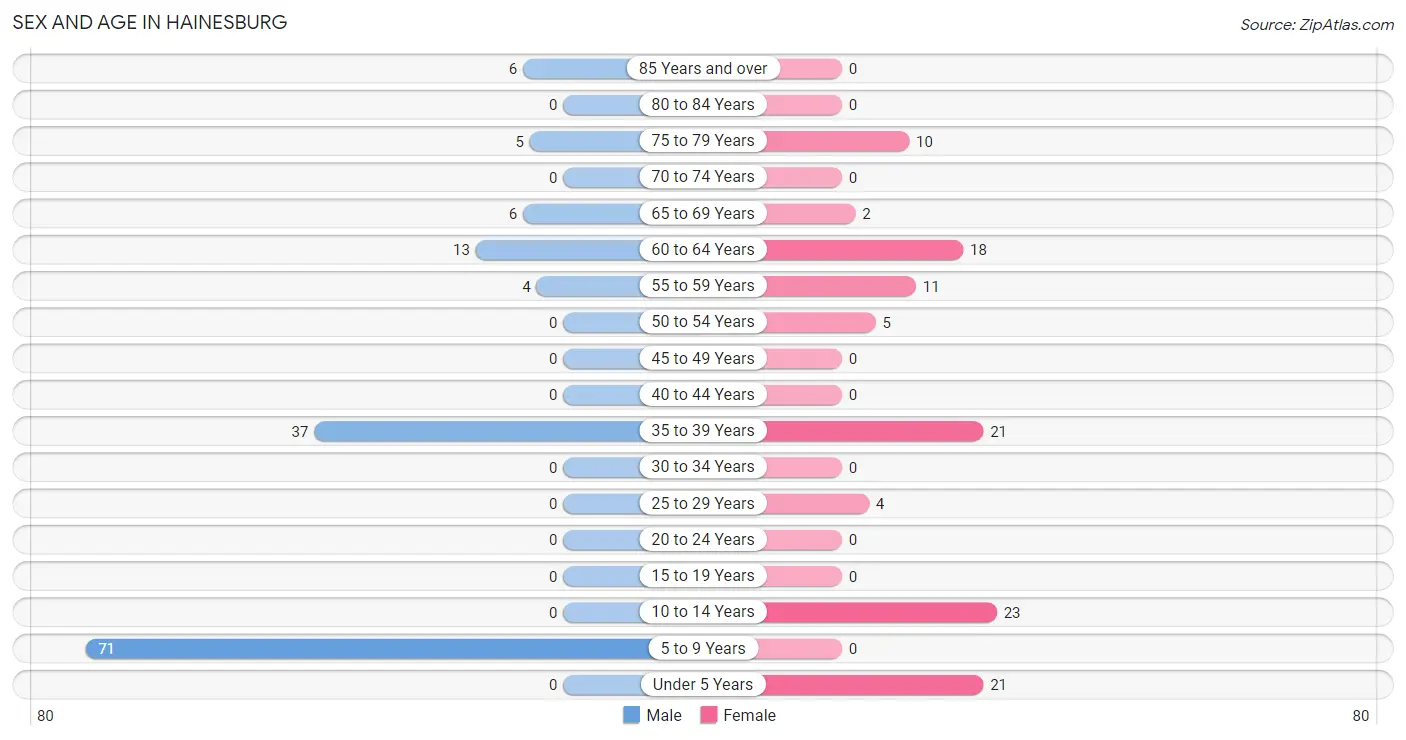
| Age Bracket | Male | Female |
| Under 5 Years | 0 (0.0%) | 21 (18.3%) |
| 5 to 9 Years | 71 (50.0%) | 0 (0.0%) |
| 10 to 14 Years | 0 (0.0%) | 23 (20.0%) |
| 15 to 19 Years | 0 (0.0%) | 0 (0.0%) |
| 20 to 24 Years | 0 (0.0%) | 0 (0.0%) |
| 25 to 29 Years | 0 (0.0%) | 4 (3.5%) |
| 30 to 34 Years | 0 (0.0%) | 0 (0.0%) |
| 35 to 39 Years | 37 (26.1%) | 21 (18.3%) |
| 40 to 44 Years | 0 (0.0%) | 0 (0.0%) |
| 45 to 49 Years | 0 (0.0%) | 0 (0.0%) |
| 50 to 54 Years | 0 (0.0%) | 5 (4.3%) |
| 55 to 59 Years | 4 (2.8%) | 11 (9.6%) |
| 60 to 64 Years | 13 (9.1%) | 18 (15.7%) |
| 65 to 69 Years | 6 (4.2%) | 2 (1.7%) |
| 70 to 74 Years | 0 (0.0%) | 0 (0.0%) |
| 75 to 79 Years | 5 (3.5%) | 10 (8.7%) |
| 80 to 84 Years | 0 (0.0%) | 0 (0.0%) |
| 85 Years and over | 6 (4.2%) | 0 (0.0%) |
| Total | 142 (100.0%) | 115 (100.0%) |
Families and Households in Hainesburg
Median Family Size in Hainesburg
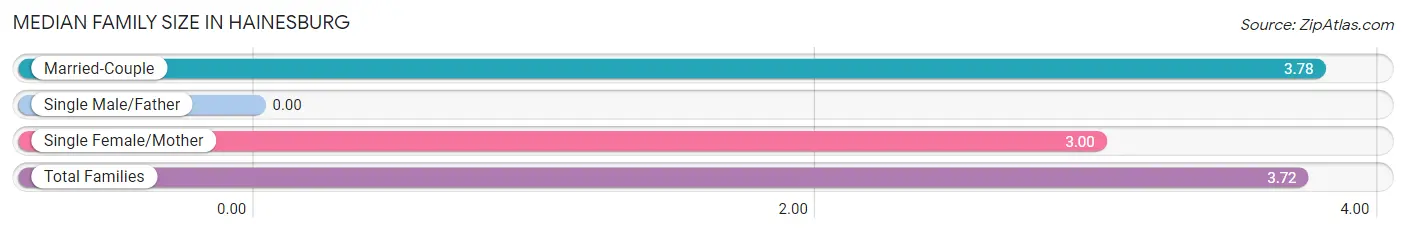
| Family Type | # Families | Family Size |
| Married-Couple | 60 (92.3%) | 3.78 |
| Single Male/Father | 0 (0.0%) | - |
| Single Female/Mother | 5 (7.7%) | 3.00 |
| Total Families | 65 (100.0%) | 3.72 |
Median Household Size in Hainesburg
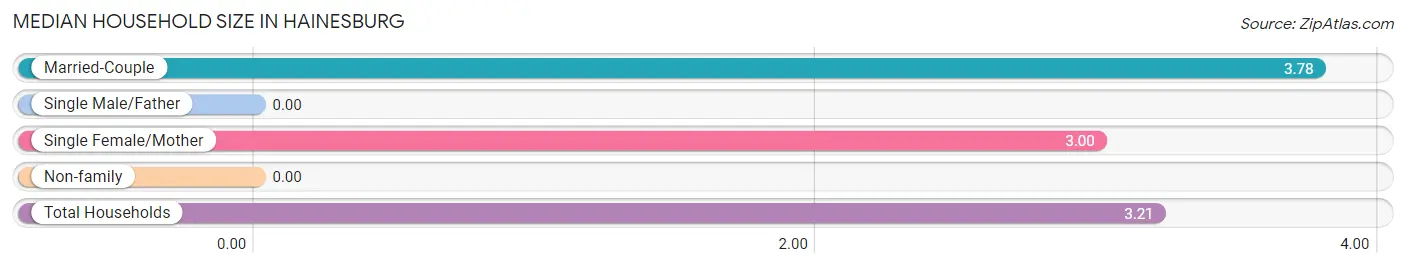
| Household Type | # Households | Household Size |
| Married-Couple | 60 (75.0%) | 3.78 |
| Single Male/Father | 0 (0.0%) | - |
| Single Female/Mother | 5 (6.2%) | 3.00 |
| Non-family | 15 (18.8%) | - |
| Total Households | 80 (100.0%) | 3.21 |
Household Size by Marriage Status in Hainesburg
Out of a total of 80 households in Hainesburg, 65 (81.2%) are family households, while 15 (18.8%) are nonfamily households. The most numerous type of family households are 2-person households, comprising 29, and the most common type of nonfamily households are 1-person households, comprising 15.
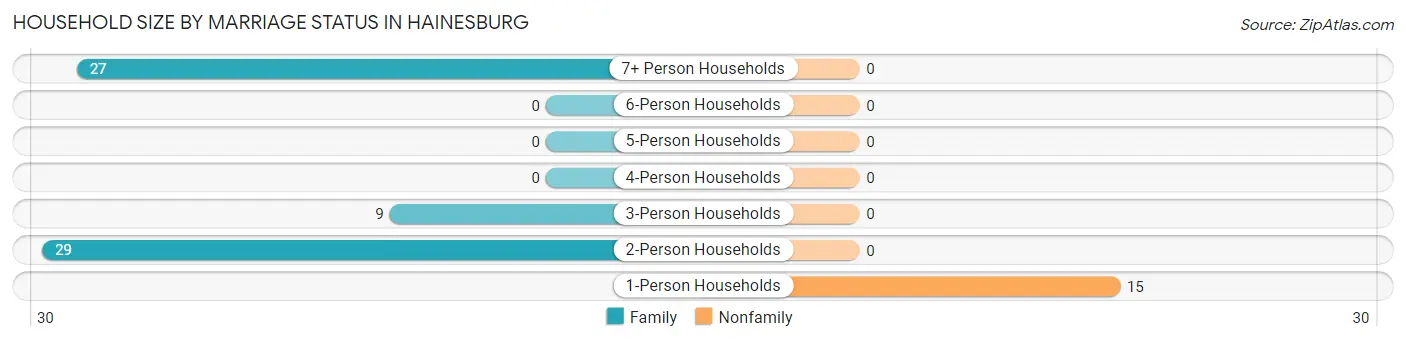
| Household Size | Family Households | Nonfamily Households |
| 1-Person Households | - | 15 (18.8%) |
| 2-Person Households | 29 (36.2%) | 0 (0.0%) |
| 3-Person Households | 9 (11.3%) | 0 (0.0%) |
| 4-Person Households | 0 (0.0%) | 0 (0.0%) |
| 5-Person Households | 0 (0.0%) | 0 (0.0%) |
| 6-Person Households | 0 (0.0%) | 0 (0.0%) |
| 7+ Person Households | 27 (33.8%) | 0 (0.0%) |
| Total | 65 (81.2%) | 15 (18.8%) |
Female Fertility in Hainesburg
Fertility by Age in Hainesburg
| Age Bracket | Women with Births | Births / 1,000 Women |
| 15 to 19 years | 0 (0.0%) | 0.0 |
| 20 to 34 years | 0 (0.0%) | 0.0 |
| 35 to 50 years | 0 (0.0%) | 0.0 |
| Total | 0 (0.0%) | 0.0 |
Fertility by Age by Marriage Status in Hainesburg
| Age Bracket | Married | Unmarried |
| 15 to 19 years | 0 (0.0%) | 0 (0.0%) |
| 20 to 34 years | 0 (0.0%) | 0 (0.0%) |
| 35 to 50 years | 0 (0.0%) | 0 (0.0%) |
| Total | 0 (0.0%) | 0 (0.0%) |
Fertility by Education in Hainesburg
| Educational Attainment | Women with Births | Births / 1,000 Women |
| Less than High School | 0 (0.0%) | 0.0 |
| High School Diploma | 0 (0.0%) | 0.0 |
| College or Associate's Degree | 0 (0.0%) | 0.0 |
| Bachelor's Degree | 0 (0.0%) | 0.0 |
| Graduate Degree | 0 (0.0%) | 0.0 |
| Total | 0 (0.0%) | 0.0 |
Fertility by Education by Marriage Status in Hainesburg
| Educational Attainment | Married | Unmarried |
| Less than High School | 0 (0.0%) | 0 (0.0%) |
| High School Diploma | 0 (0.0%) | 0 (0.0%) |
| College or Associate's Degree | 0 (0.0%) | 0 (0.0%) |
| Bachelor's Degree | 0 (0.0%) | 0 (0.0%) |
| Graduate Degree | 0 (0.0%) | 0 (0.0%) |
| Total | 0 (0.0%) | 0 (0.0%) |
Employment Characteristics in Hainesburg
Employment by Class of Employer in Hainesburg
Among the 95 employed individuals in Hainesburg, private company employees (70 | 73.7%), and self-employed (incorporated) (25 | 26.3%) make up the most common classes of employment.
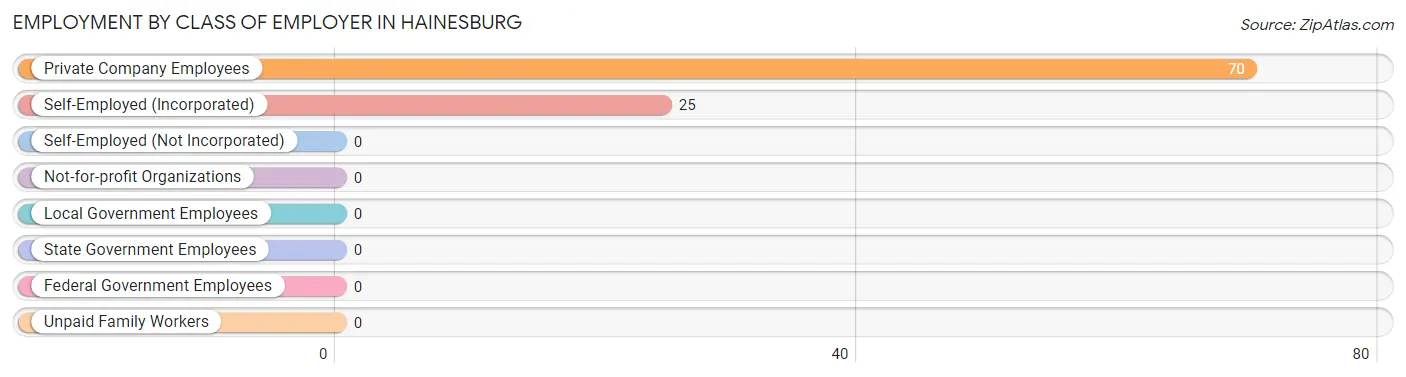
| Employer Class | # Employees | % Employees |
| Private Company Employees | 70 | 73.7% |
| Self-Employed (Incorporated) | 25 | 26.3% |
| Self-Employed (Not Incorporated) | 0 | 0.0% |
| Not-for-profit Organizations | 0 | 0.0% |
| Local Government Employees | 0 | 0.0% |
| State Government Employees | 0 | 0.0% |
| Federal Government Employees | 0 | 0.0% |
| Unpaid Family Workers | 0 | 0.0% |
| Total | 95 | 100.0% |
Employment Status by Age in Hainesburg
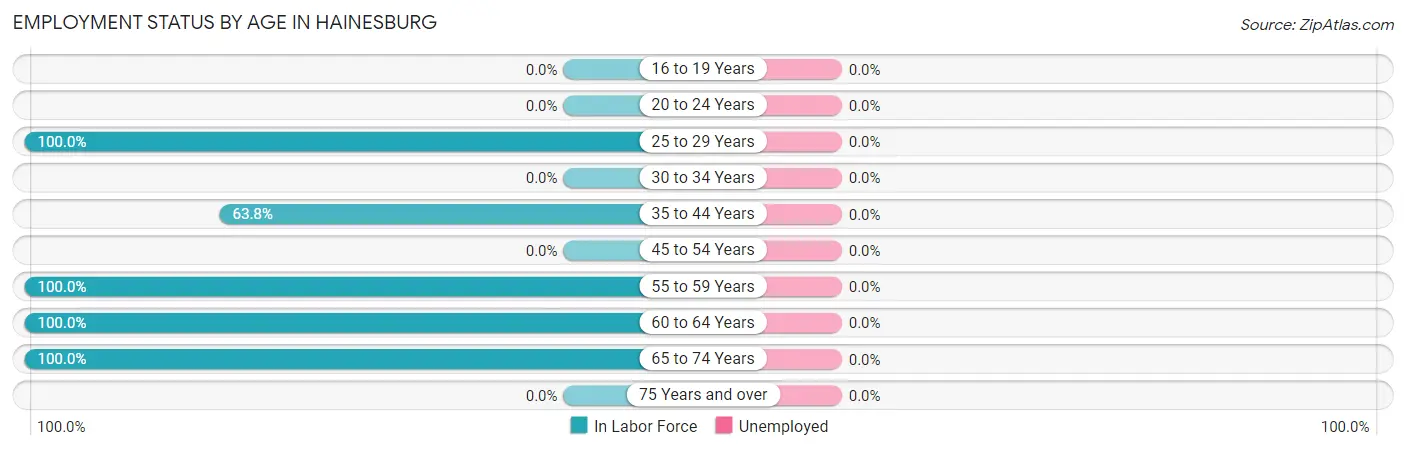
| Age Bracket | In Labor Force | Unemployed |
| 16 to 19 Years | 0 (0.0%) | 0 (0.0%) |
| 20 to 24 Years | 0 (0.0%) | 0 (0.0%) |
| 25 to 29 Years | 4 (100.0%) | 0 (0.0%) |
| 30 to 34 Years | 0 (0.0%) | 0 (0.0%) |
| 35 to 44 Years | 37 (63.8%) | 0 (0.0%) |
| 45 to 54 Years | 0 (0.0%) | 0 (0.0%) |
| 55 to 59 Years | 15 (100.0%) | 0 (0.0%) |
| 60 to 64 Years | 31 (100.0%) | 0 (0.0%) |
| 65 to 74 Years | 8 (100.0%) | 0 (0.0%) |
| 75 Years and over | 0 (0.0%) | 0 (0.0%) |
| Total | 95 (66.9%) | 0 (0.0%) |
Employment Status by Educational Attainment in Hainesburg
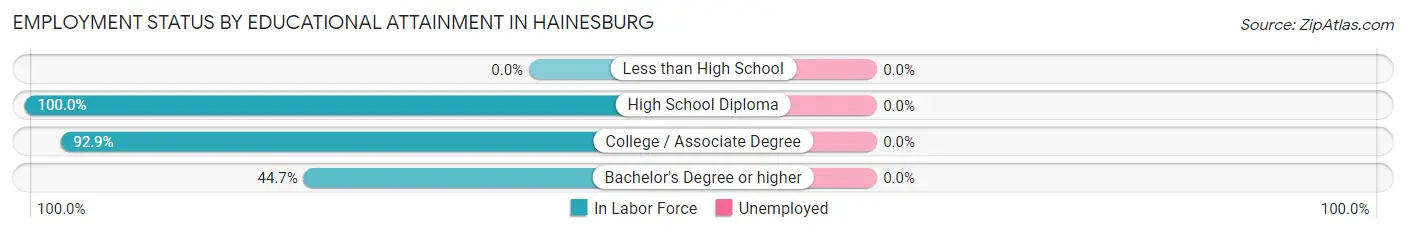
| Educational Attainment | In Labor Force | Unemployed |
| Less than High School | 0 (0.0%) | 0 (0.0%) |
| High School Diploma | 5 (100.0%) | 0 (0.0%) |
| College / Associate Degree | 65 (92.9%) | 0 (0.0%) |
| Bachelor's Degree or higher | 17 (44.7%) | 0 (0.0%) |
| Total | 87 (77.0%) | 0 (0.0%) |
Employment Occupations by Sex in Hainesburg
Management, Business, Science and Arts Occupations
The most common Management, Business, Science and Arts occupations in Hainesburg are Management (13 | 13.7%), and Business & Financial (4 | 4.2%).
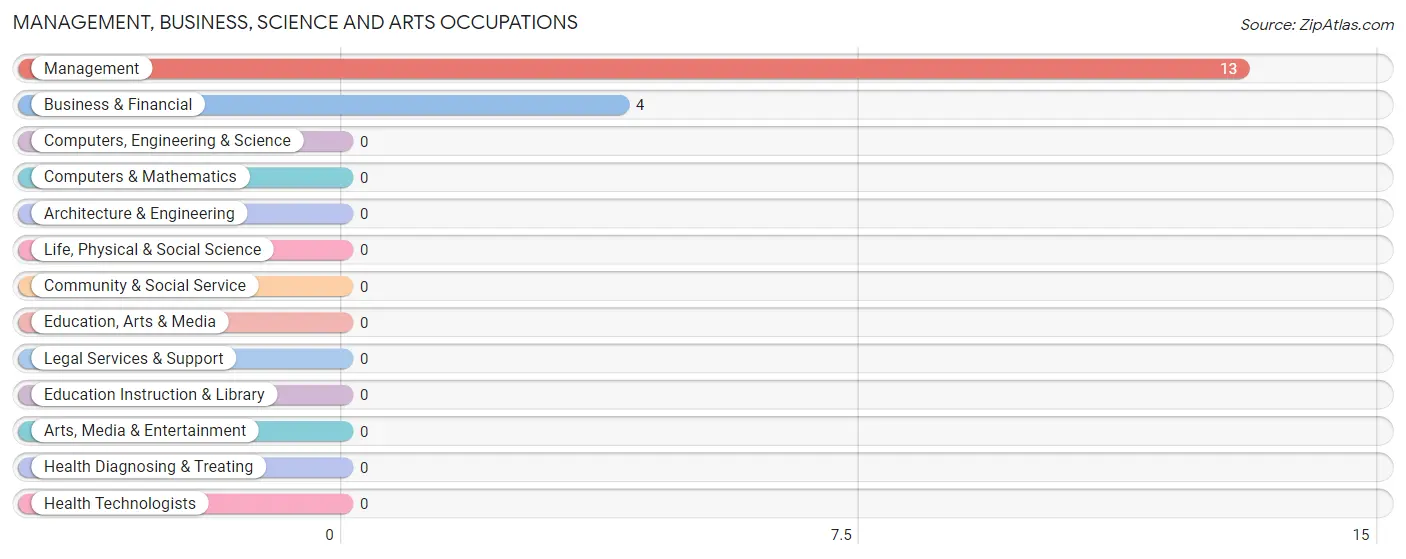
Management, Business, Science and Arts Occupations by Sex
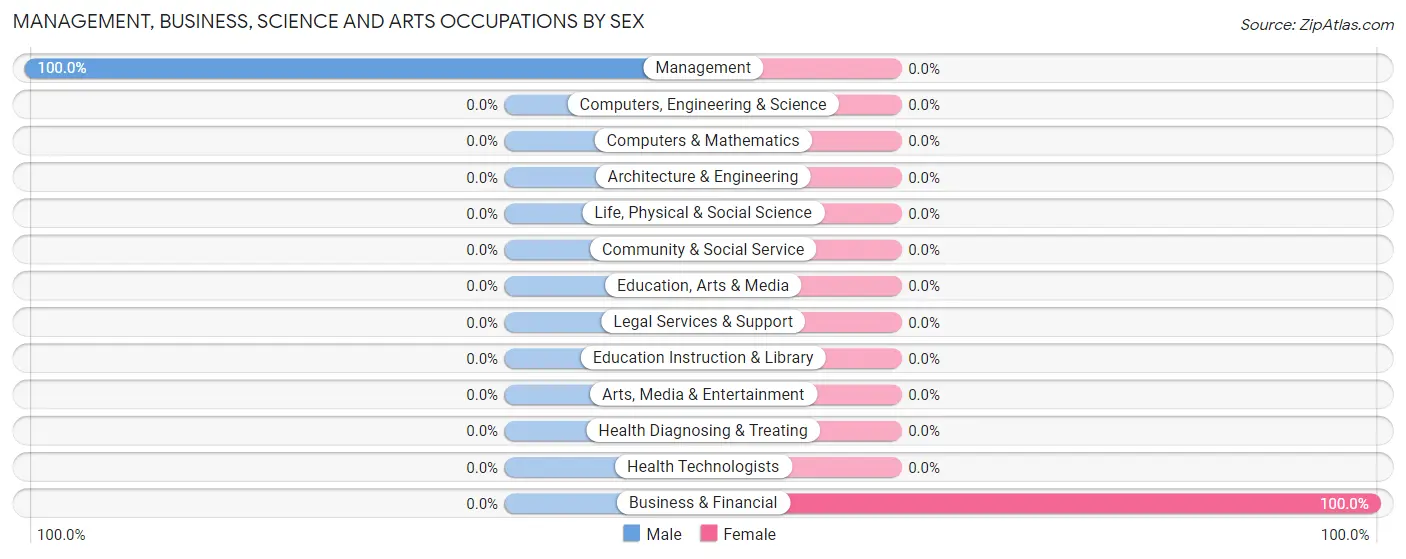
| Occupation | Male | Female |
| Management | 13 (100.0%) | 0 (0.0%) |
| Business & Financial | 0 (0.0%) | 4 (100.0%) |
| Computers, Engineering & Science | 0 (0.0%) | 0 (0.0%) |
| Computers & Mathematics | 0 (0.0%) | 0 (0.0%) |
| Architecture & Engineering | 0 (0.0%) | 0 (0.0%) |
| Life, Physical & Social Science | 0 (0.0%) | 0 (0.0%) |
| Community & Social Service | 0 (0.0%) | 0 (0.0%) |
| Education, Arts & Media | 0 (0.0%) | 0 (0.0%) |
| Legal Services & Support | 0 (0.0%) | 0 (0.0%) |
| Education Instruction & Library | 0 (0.0%) | 0 (0.0%) |
| Arts, Media & Entertainment | 0 (0.0%) | 0 (0.0%) |
| Health Diagnosing & Treating | 0 (0.0%) | 0 (0.0%) |
| Health Technologists | 0 (0.0%) | 0 (0.0%) |
| Total (Category) | 13 (76.5%) | 4 (23.5%) |
| Total (Overall) | 60 (63.2%) | 35 (36.8%) |
Services Occupations
Services Occupations by Sex
| Occupation | Male | Female |
| Healthcare Support | 0 (0.0%) | 0 (0.0%) |
| Security & Protection | 0 (0.0%) | 0 (0.0%) |
| Firefighting & Prevention | 0 (0.0%) | 0 (0.0%) |
| Law Enforcement | 0 (0.0%) | 0 (0.0%) |
| Food Preparation & Serving | 0 (0.0%) | 0 (0.0%) |
| Cleaning & Maintenance | 0 (0.0%) | 0 (0.0%) |
| Personal Care & Service | 0 (0.0%) | 0 (0.0%) |
| Total (Category) | 0 (0.0%) | 0 (0.0%) |
| Total (Overall) | 60 (63.2%) | 35 (36.8%) |
Sales and Office Occupations
The most common Sales and Office occupations in Hainesburg are Sales & Related (8 | 8.4%), and Office & Administration (8 | 8.4%).
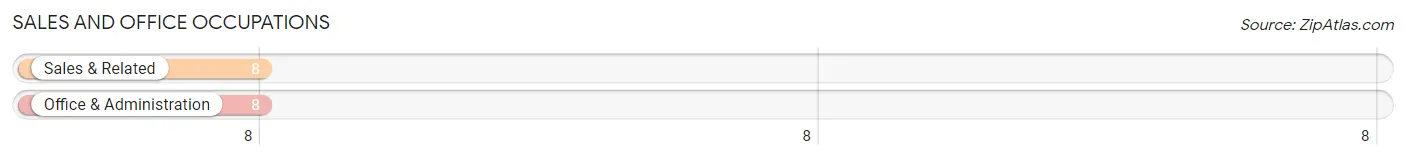
Sales and Office Occupations by Sex
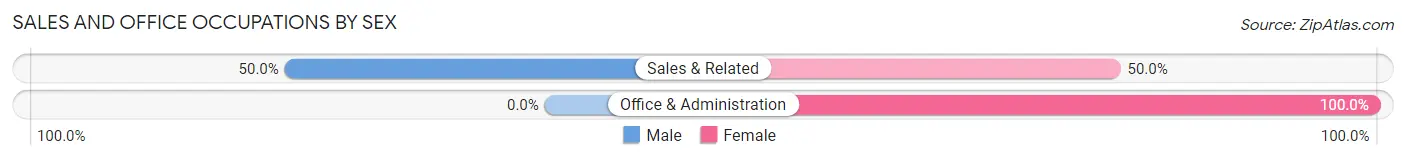
| Occupation | Male | Female |
| Sales & Related | 4 (50.0%) | 4 (50.0%) |
| Office & Administration | 0 (0.0%) | 8 (100.0%) |
| Total (Category) | 4 (25.0%) | 12 (75.0%) |
| Total (Overall) | 60 (63.2%) | 35 (36.8%) |
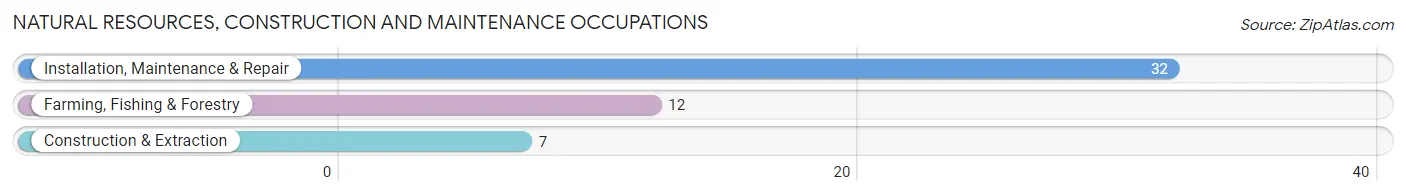
Natural Resources, Construction and Maintenance Occupations
The most common Natural Resources, Construction and Maintenance occupations in Hainesburg are Installation, Maintenance & Repair (32 | 33.7%), Farming, Fishing & Forestry (12 | 12.6%), and Construction & Extraction (7 | 7.4%).
Natural Resources, Construction and Maintenance Occupations by Sex
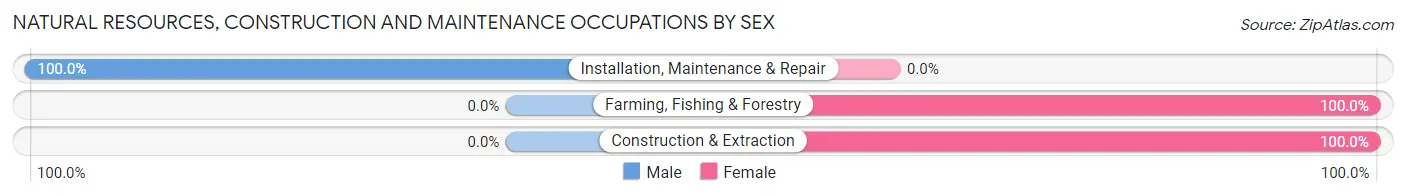
| Occupation | Male | Female |
| Farming, Fishing & Forestry | 0 (0.0%) | 12 (100.0%) |
| Construction & Extraction | 0 (0.0%) | 7 (100.0%) |
| Installation, Maintenance & Repair | 32 (100.0%) | 0 (0.0%) |
| Total (Category) | 32 (62.7%) | 19 (37.2%) |
| Total (Overall) | 60 (63.2%) | 35 (36.8%) |
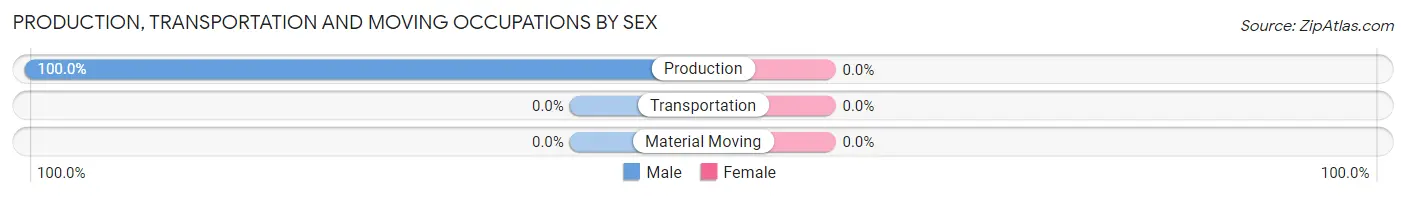
Production, Transportation and Moving Occupations
The most common Production, Transportation and Moving occupations in Hainesburg are , and Production (11 | 11.6%).
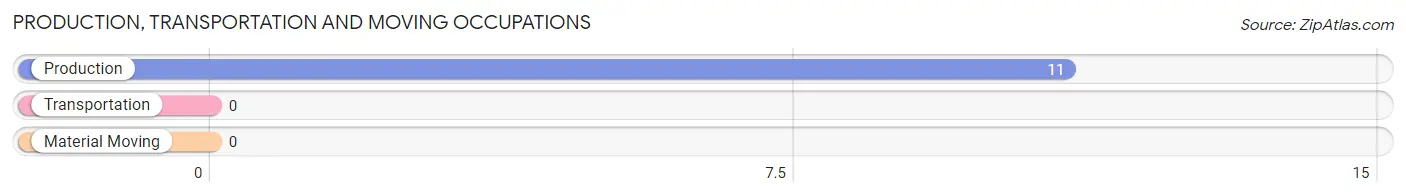
Production, Transportation and Moving Occupations by Sex
| Occupation | Male | Female |
| Production | 11 (100.0%) | 0 (0.0%) |
| Transportation | 0 (0.0%) | 0 (0.0%) |
| Material Moving | 0 (0.0%) | 0 (0.0%) |
| Total (Category) | 11 (100.0%) | 0 (0.0%) |
| Total (Overall) | 60 (63.2%) | 35 (36.8%) |
Employment Industries by Sex in Hainesburg
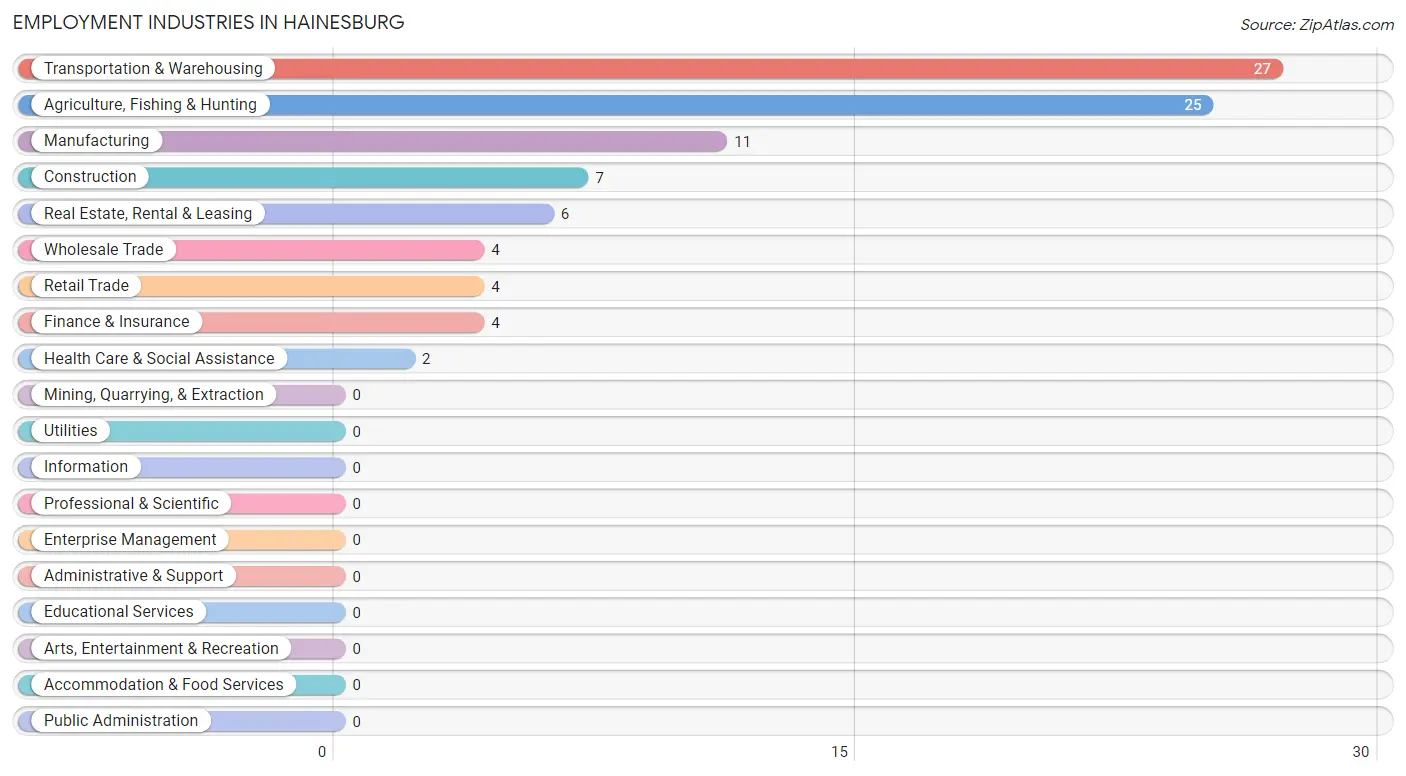
Employment Industries in Hainesburg
The major employment industries in Hainesburg include Transportation & Warehousing (27 | 28.4%), Agriculture, Fishing & Hunting (25 | 26.3%), Manufacturing (11 | 11.6%), Construction (7 | 7.4%), and Real Estate, Rental & Leasing (6 | 6.3%).
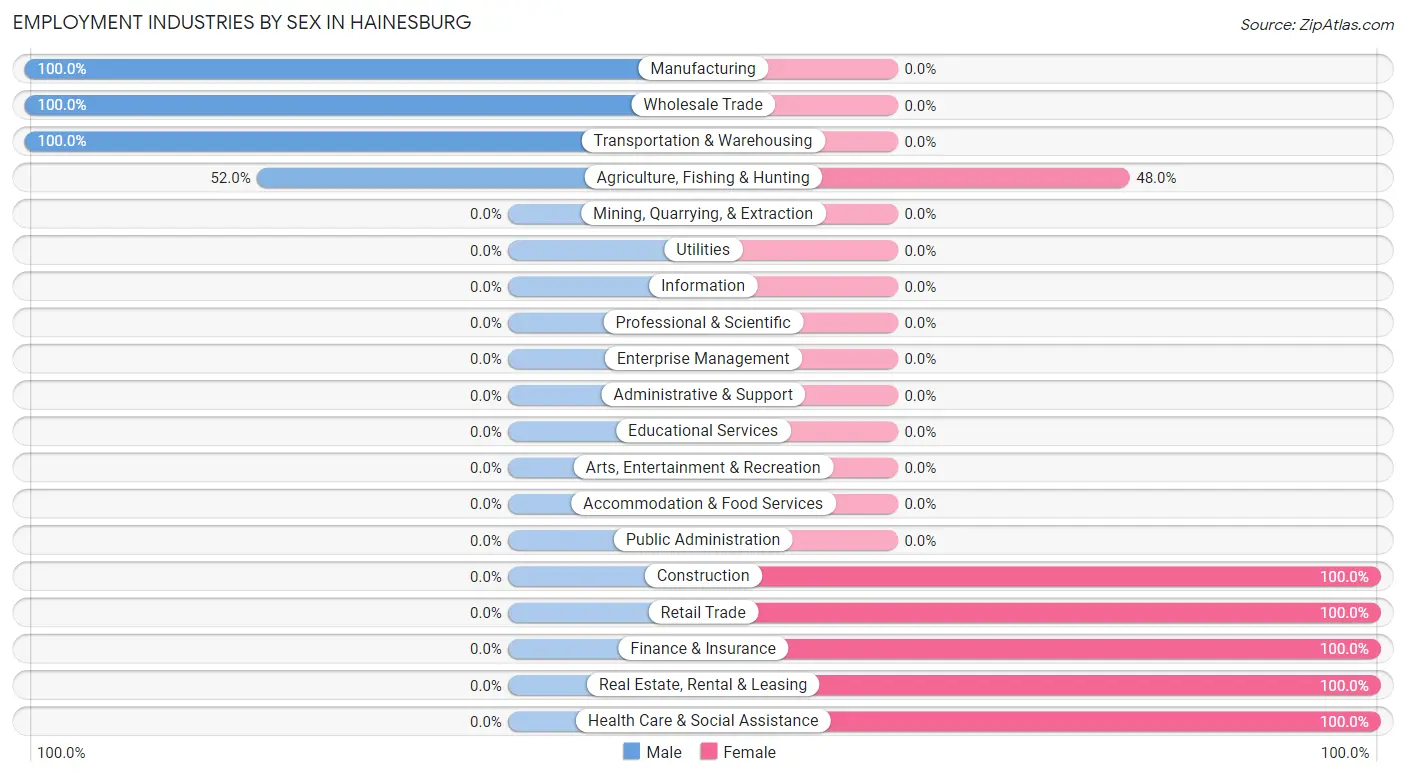
Employment Industries by Sex in Hainesburg
The Hainesburg industries that see more men than women are Manufacturing (100.0%), Wholesale Trade (100.0%), and Transportation & Warehousing (100.0%), whereas the industries that tend to have a higher number of women are Construction (100.0%), Retail Trade (100.0%), and Finance & Insurance (100.0%).
| Industry | Male | Female |
| Agriculture, Fishing & Hunting | 13 (52.0%) | 12 (48.0%) |
| Mining, Quarrying, & Extraction | 0 (0.0%) | 0 (0.0%) |
| Construction | 0 (0.0%) | 7 (100.0%) |
| Manufacturing | 11 (100.0%) | 0 (0.0%) |
| Wholesale Trade | 4 (100.0%) | 0 (0.0%) |
| Retail Trade | 0 (0.0%) | 4 (100.0%) |
| Transportation & Warehousing | 27 (100.0%) | 0 (0.0%) |
| Utilities | 0 (0.0%) | 0 (0.0%) |
| Information | 0 (0.0%) | 0 (0.0%) |
| Finance & Insurance | 0 (0.0%) | 4 (100.0%) |
| Real Estate, Rental & Leasing | 0 (0.0%) | 6 (100.0%) |
| Professional & Scientific | 0 (0.0%) | 0 (0.0%) |
| Enterprise Management | 0 (0.0%) | 0 (0.0%) |
| Administrative & Support | 0 (0.0%) | 0 (0.0%) |
| Educational Services | 0 (0.0%) | 0 (0.0%) |
| Health Care & Social Assistance | 0 (0.0%) | 2 (100.0%) |
| Arts, Entertainment & Recreation | 0 (0.0%) | 0 (0.0%) |
| Accommodation & Food Services | 0 (0.0%) | 0 (0.0%) |
| Public Administration | 0 (0.0%) | 0 (0.0%) |
| Total | 60 (63.2%) | 35 (36.8%) |
Education in Hainesburg
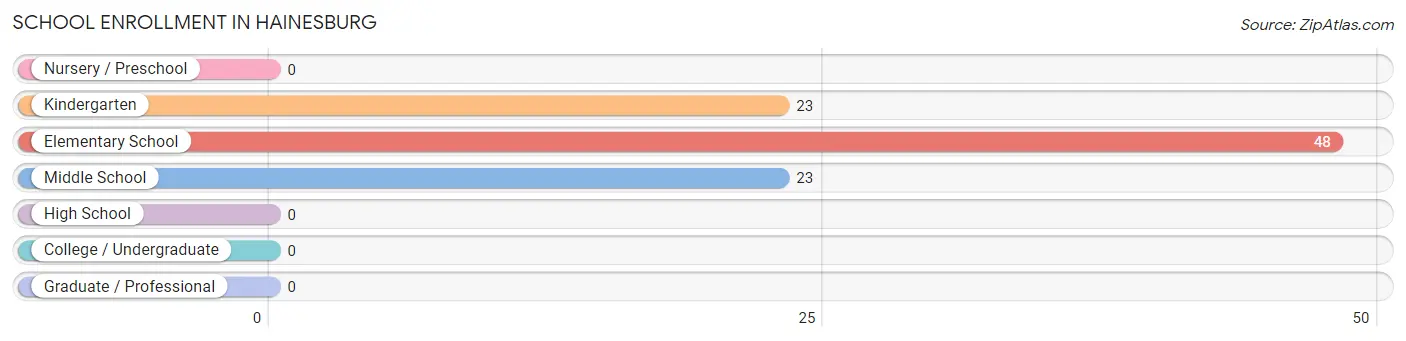
School Enrollment in Hainesburg
The most common levels of schooling among the 94 students in Hainesburg are elementary school (48 | 51.1%), kindergarten (23 | 24.5%), and middle school (23 | 24.5%).
| School Level | # Students | % Students |
| Nursery / Preschool | 0 | 0.0% |
| Kindergarten | 23 | 24.5% |
| Elementary School | 48 | 51.1% |
| Middle School | 23 | 24.5% |
| High School | 0 | 0.0% |
| College / Undergraduate | 0 | 0.0% |
| Graduate / Professional | 0 | 0.0% |
| Total | 94 | 100.0% |
School Enrollment by Age by Funding Source in Hainesburg
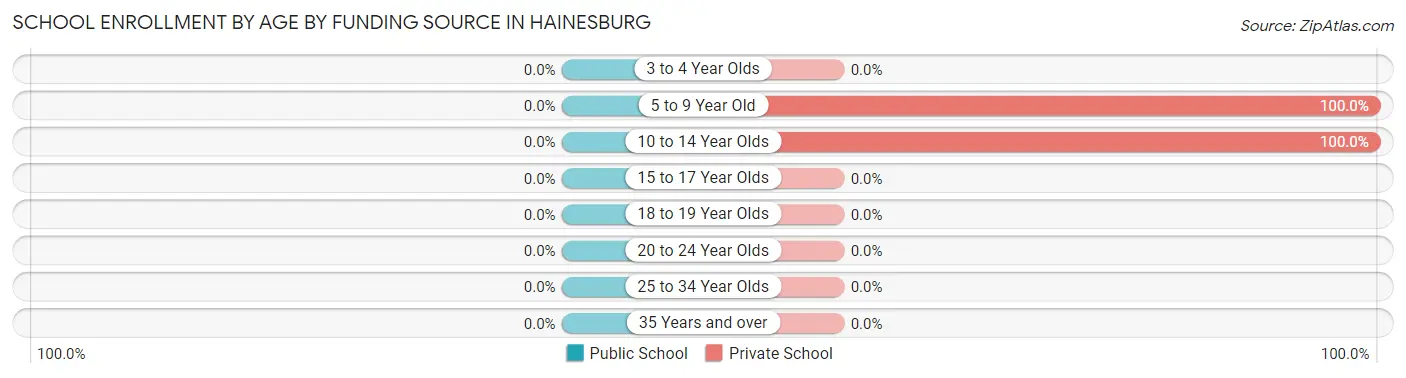
| Age Bracket | Public School | Private School |
| 3 to 4 Year Olds | 0 (0.0%) | 0 (0.0%) |
| 5 to 9 Year Old | 0 (0.0%) | 71 (100.0%) |
| 10 to 14 Year Olds | 0 (0.0%) | 23 (100.0%) |
| 15 to 17 Year Olds | 0 (0.0%) | 0 (0.0%) |
| 18 to 19 Year Olds | 0 (0.0%) | 0 (0.0%) |
| 20 to 24 Year Olds | 0 (0.0%) | 0 (0.0%) |
| 25 to 34 Year Olds | 0 (0.0%) | 0 (0.0%) |
| 35 Years and over | 0 (0.0%) | 0 (0.0%) |
| Total | 0 (0.0%) | 94 (100.0%) |
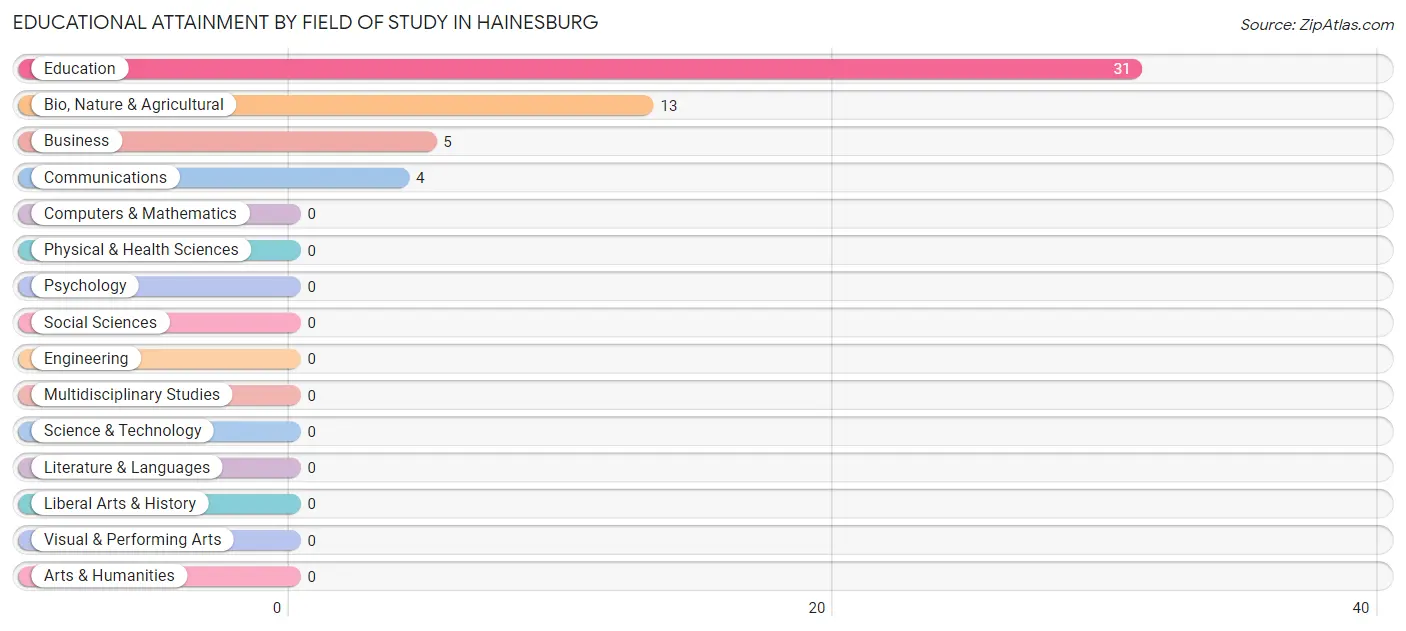
Educational Attainment by Field of Study in Hainesburg
Education (31 | 58.5%), bio, nature & agricultural (13 | 24.5%), business (5 | 9.4%), and communications (4 | 7.5%) are the most common fields of study among 53 individuals in Hainesburg who have obtained a bachelor's degree or higher.
| Field of Study | # Graduates | % Graduates |
| Computers & Mathematics | 0 | 0.0% |
| Bio, Nature & Agricultural | 13 | 24.5% |
| Physical & Health Sciences | 0 | 0.0% |
| Psychology | 0 | 0.0% |
| Social Sciences | 0 | 0.0% |
| Engineering | 0 | 0.0% |
| Multidisciplinary Studies | 0 | 0.0% |
| Science & Technology | 0 | 0.0% |
| Business | 5 | 9.4% |
| Education | 31 | 58.5% |
| Literature & Languages | 0 | 0.0% |
| Liberal Arts & History | 0 | 0.0% |
| Visual & Performing Arts | 0 | 0.0% |
| Communications | 4 | 7.5% |
| Arts & Humanities | 0 | 0.0% |
| Total | 53 | 100.0% |
Transportation & Commute in Hainesburg
Vehicle Availability by Sex in Hainesburg
The most prevalent vehicle ownership categories in Hainesburg are males with 2 vehicles (33, accounting for 55.0%) and females with 2 vehicles (8, making up 94.3%).
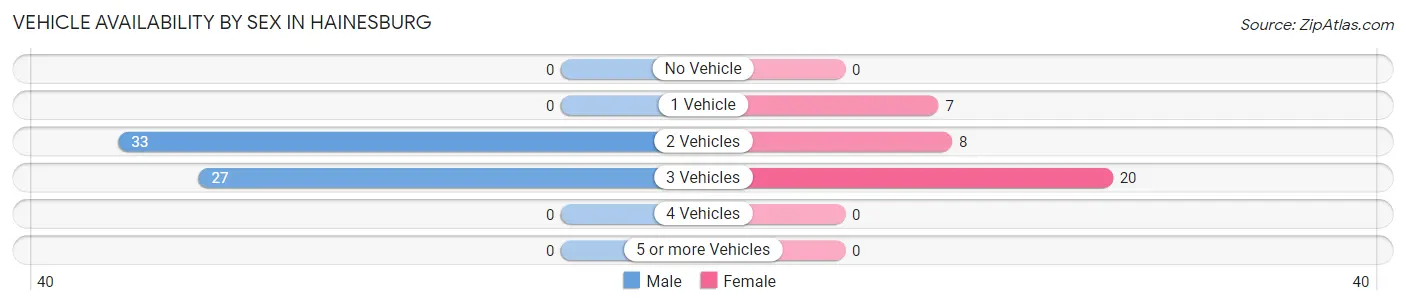
| Vehicles Available | Male | Female |
| No Vehicle | 0 (0.0%) | 0 (0.0%) |
| 1 Vehicle | 0 (0.0%) | 7 (20.0%) |
| 2 Vehicles | 33 (55.0%) | 8 (22.9%) |
| 3 Vehicles | 27 (45.0%) | 20 (57.1%) |
| 4 Vehicles | 0 (0.0%) | 0 (0.0%) |
| 5 or more Vehicles | 0 (0.0%) | 0 (0.0%) |
| Total | 60 (100.0%) | 35 (100.0%) |
Commute Time in Hainesburg
The most frequently occuring commute durations in Hainesburg are 60 to 89 minutes (27 commuters, 30.3%), 90 or more minutes (19 commuters, 21.3%), and 30 to 34 minutes (18 commuters, 20.2%).
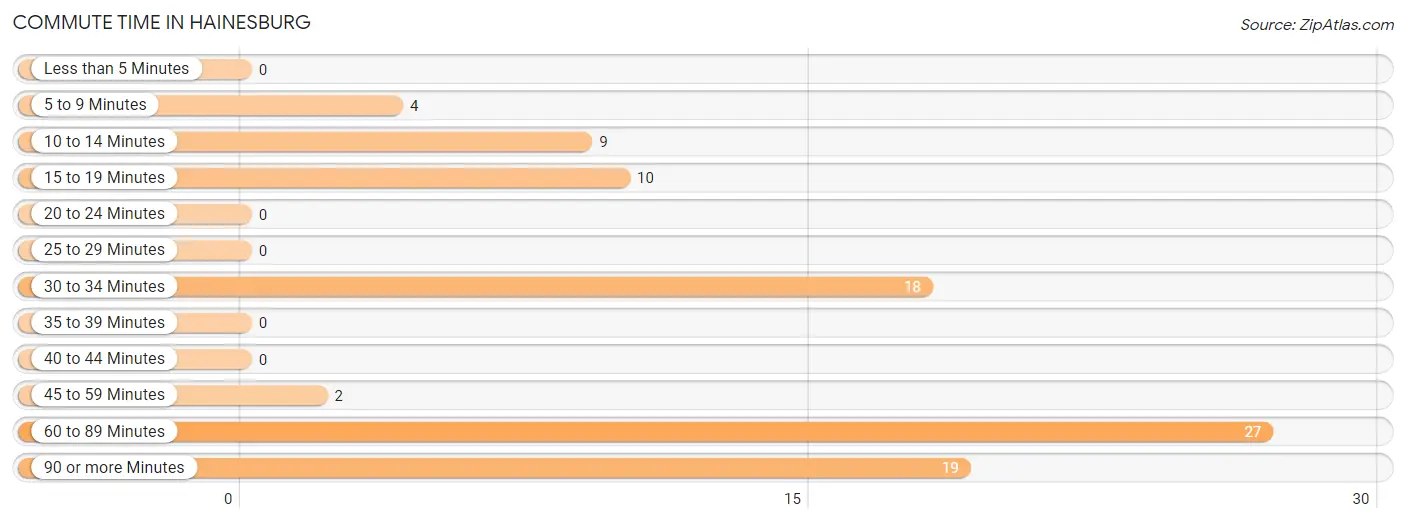
| Commute Time | # Commuters | % Commuters |
| Less than 5 Minutes | 0 | 0.0% |
| 5 to 9 Minutes | 4 | 4.5% |
| 10 to 14 Minutes | 9 | 10.1% |
| 15 to 19 Minutes | 10 | 11.2% |
| 20 to 24 Minutes | 0 | 0.0% |
| 25 to 29 Minutes | 0 | 0.0% |
| 30 to 34 Minutes | 18 | 20.2% |
| 35 to 39 Minutes | 0 | 0.0% |
| 40 to 44 Minutes | 0 | 0.0% |
| 45 to 59 Minutes | 2 | 2.2% |
| 60 to 89 Minutes | 27 | 30.3% |
| 90 or more Minutes | 19 | 21.3% |
Commute Time by Sex in Hainesburg
The most common commute times in Hainesburg are 60 to 89 minutes (27 commuters, 50.0%) for males and 90 or more minutes (19 commuters, 54.3%) for females.
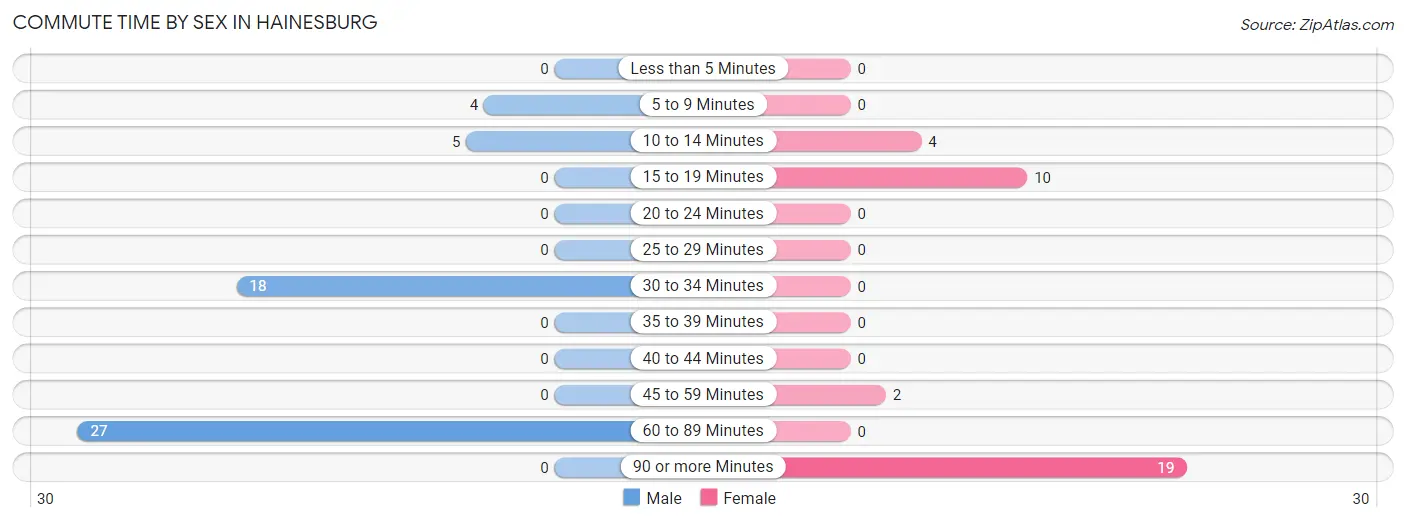
| Commute Time | Male | Female |
| Less than 5 Minutes | 0 (0.0%) | 0 (0.0%) |
| 5 to 9 Minutes | 4 (7.4%) | 0 (0.0%) |
| 10 to 14 Minutes | 5 (9.3%) | 4 (11.4%) |
| 15 to 19 Minutes | 0 (0.0%) | 10 (28.6%) |
| 20 to 24 Minutes | 0 (0.0%) | 0 (0.0%) |
| 25 to 29 Minutes | 0 (0.0%) | 0 (0.0%) |
| 30 to 34 Minutes | 18 (33.3%) | 0 (0.0%) |
| 35 to 39 Minutes | 0 (0.0%) | 0 (0.0%) |
| 40 to 44 Minutes | 0 (0.0%) | 0 (0.0%) |
| 45 to 59 Minutes | 0 (0.0%) | 2 (5.7%) |
| 60 to 89 Minutes | 27 (50.0%) | 0 (0.0%) |
| 90 or more Minutes | 0 (0.0%) | 19 (54.3%) |
Time of Departure to Work by Sex in Hainesburg
The most frequent times of departure to work in Hainesburg are 10:00 AM to 10:59 AM (27, 50.0%) for males and 6:30 AM to 6:59 AM (12, 34.3%) for females.
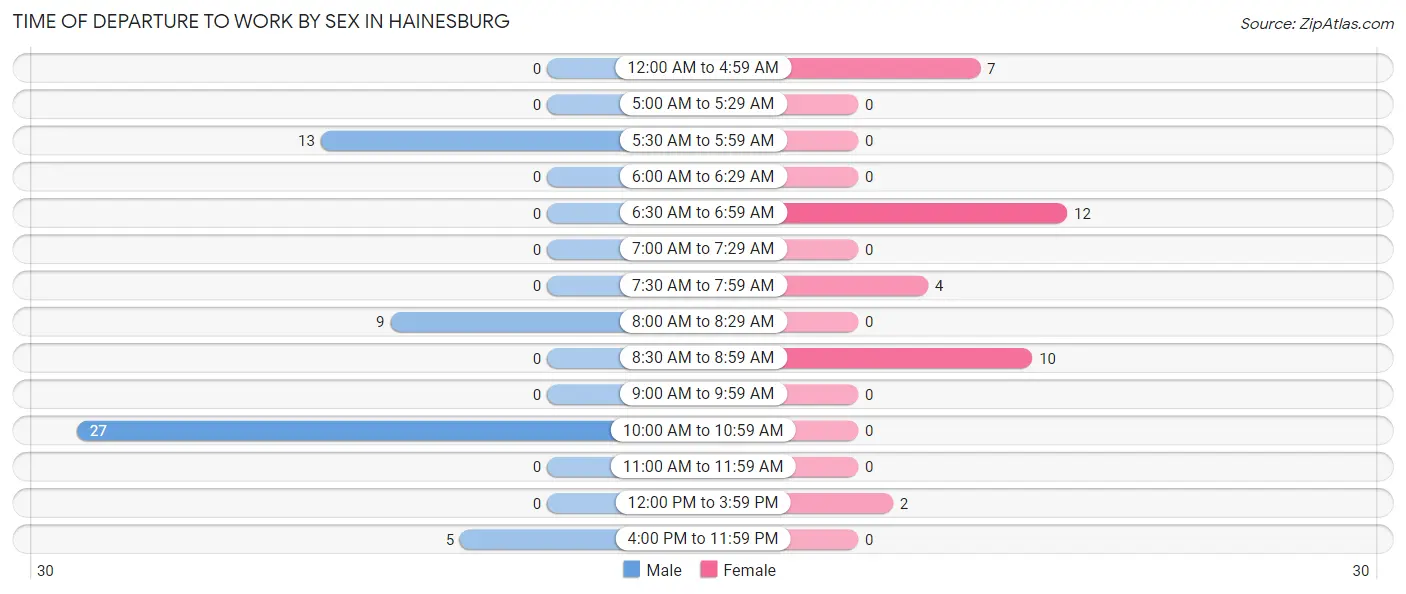
| Time of Departure | Male | Female |
| 12:00 AM to 4:59 AM | 0 (0.0%) | 7 (20.0%) |
| 5:00 AM to 5:29 AM | 0 (0.0%) | 0 (0.0%) |
| 5:30 AM to 5:59 AM | 13 (24.1%) | 0 (0.0%) |
| 6:00 AM to 6:29 AM | 0 (0.0%) | 0 (0.0%) |
| 6:30 AM to 6:59 AM | 0 (0.0%) | 12 (34.3%) |
| 7:00 AM to 7:29 AM | 0 (0.0%) | 0 (0.0%) |
| 7:30 AM to 7:59 AM | 0 (0.0%) | 4 (11.4%) |
| 8:00 AM to 8:29 AM | 9 (16.7%) | 0 (0.0%) |
| 8:30 AM to 8:59 AM | 0 (0.0%) | 10 (28.6%) |
| 9:00 AM to 9:59 AM | 0 (0.0%) | 0 (0.0%) |
| 10:00 AM to 10:59 AM | 27 (50.0%) | 0 (0.0%) |
| 11:00 AM to 11:59 AM | 0 (0.0%) | 0 (0.0%) |
| 12:00 PM to 3:59 PM | 0 (0.0%) | 2 (5.7%) |
| 4:00 PM to 11:59 PM | 5 (9.3%) | 0 (0.0%) |
| Total | 54 (100.0%) | 35 (100.0%) |
Housing Occupancy in Hainesburg
Occupancy by Ownership in Hainesburg
Of the total 80 dwellings in Hainesburg, owner-occupied units account for 65 (81.2%), while renter-occupied units make up 15 (18.8%).
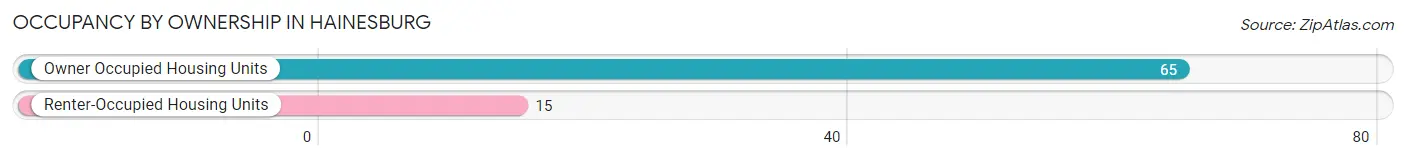
| Occupancy | # Housing Units | % Housing Units |
| Owner Occupied Housing Units | 65 | 81.2% |
| Renter-Occupied Housing Units | 15 | 18.8% |
| Total Occupied Housing Units | 80 | 100.0% |
Occupancy by Household Size in Hainesburg
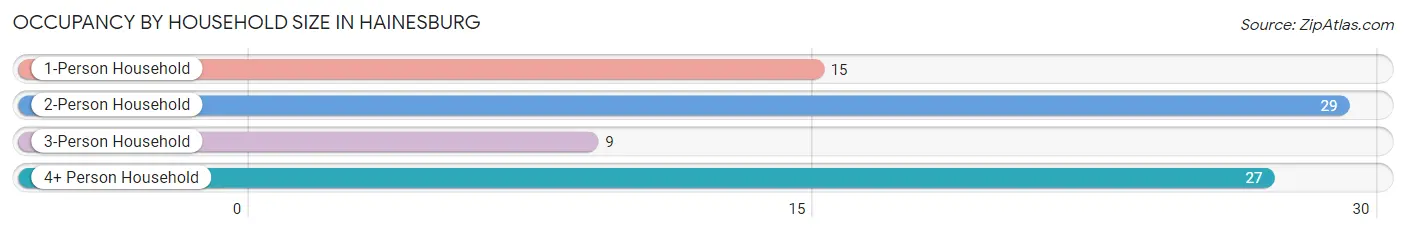
| Household Size | # Housing Units | % Housing Units |
| 1-Person Household | 15 | 18.8% |
| 2-Person Household | 29 | 36.2% |
| 3-Person Household | 9 | 11.3% |
| 4+ Person Household | 27 | 33.8% |
| Total Housing Units | 80 | 100.0% |
Occupancy by Ownership by Household Size in Hainesburg
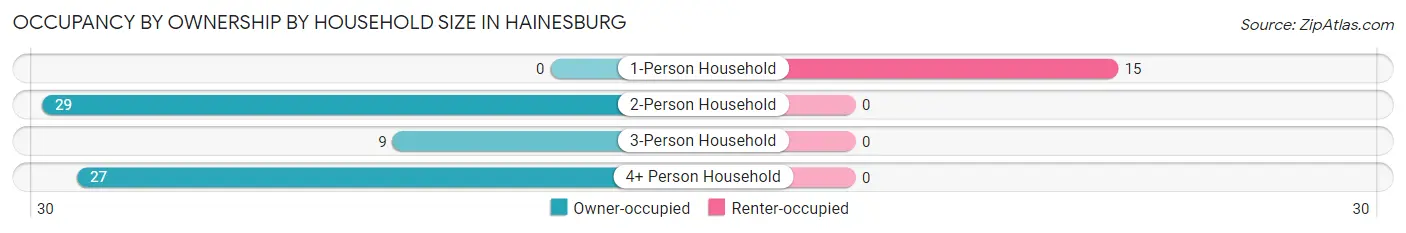
| Household Size | Owner-occupied | Renter-occupied |
| 1-Person Household | 0 (0.0%) | 15 (100.0%) |
| 2-Person Household | 29 (100.0%) | 0 (0.0%) |
| 3-Person Household | 9 (100.0%) | 0 (0.0%) |
| 4+ Person Household | 27 (100.0%) | 0 (0.0%) |
| Total Housing Units | 65 (81.2%) | 15 (18.8%) |
Occupancy by Educational Attainment in Hainesburg
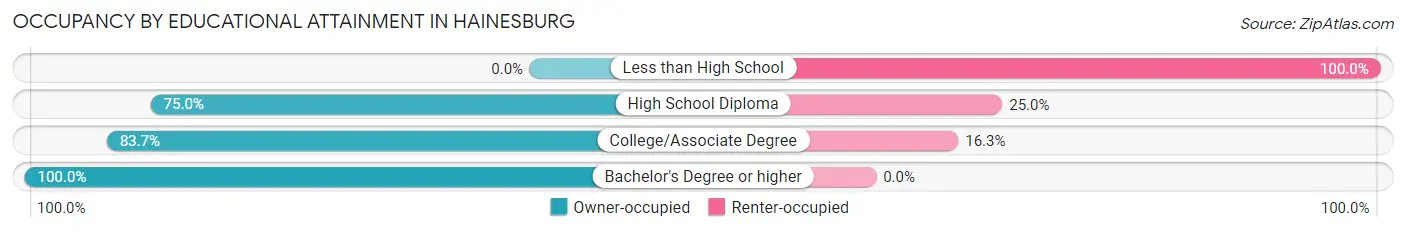
| Household Size | Owner-occupied | Renter-occupied |
| Less than High School | 0 (0.0%) | 6 (100.0%) |
| High School Diploma | 6 (75.0%) | 2 (25.0%) |
| College/Associate Degree | 36 (83.7%) | 7 (16.3%) |
| Bachelor's Degree or higher | 23 (100.0%) | 0 (0.0%) |
Occupancy by Age of Householder in Hainesburg
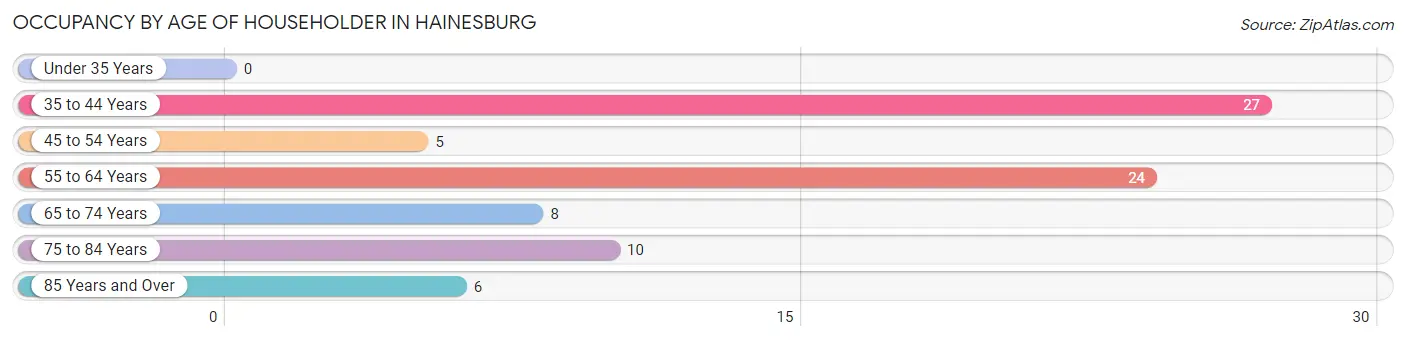
| Age Bracket | # Households | % Households |
| Under 35 Years | 0 | 0.0% |
| 35 to 44 Years | 27 | 33.8% |
| 45 to 54 Years | 5 | 6.2% |
| 55 to 64 Years | 24 | 30.0% |
| 65 to 74 Years | 8 | 10.0% |
| 75 to 84 Years | 10 | 12.5% |
| 85 Years and Over | 6 | 7.5% |
| Total | 80 | 100.0% |
Housing Finances in Hainesburg
Median Income by Occupancy in Hainesburg
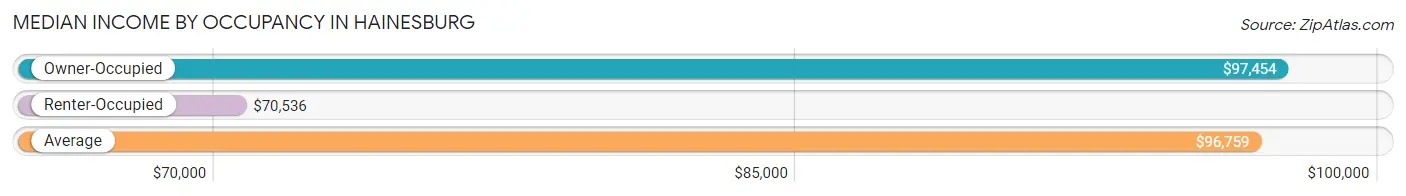
| Occupancy Type | # Households | Median Income |
| Owner-Occupied | 65 (81.2%) | $97,454 |
| Renter-Occupied | 15 (18.8%) | $70,536 |
| Average | 80 (100.0%) | $96,759 |
Occupancy by Householder Income Bracket in Hainesburg
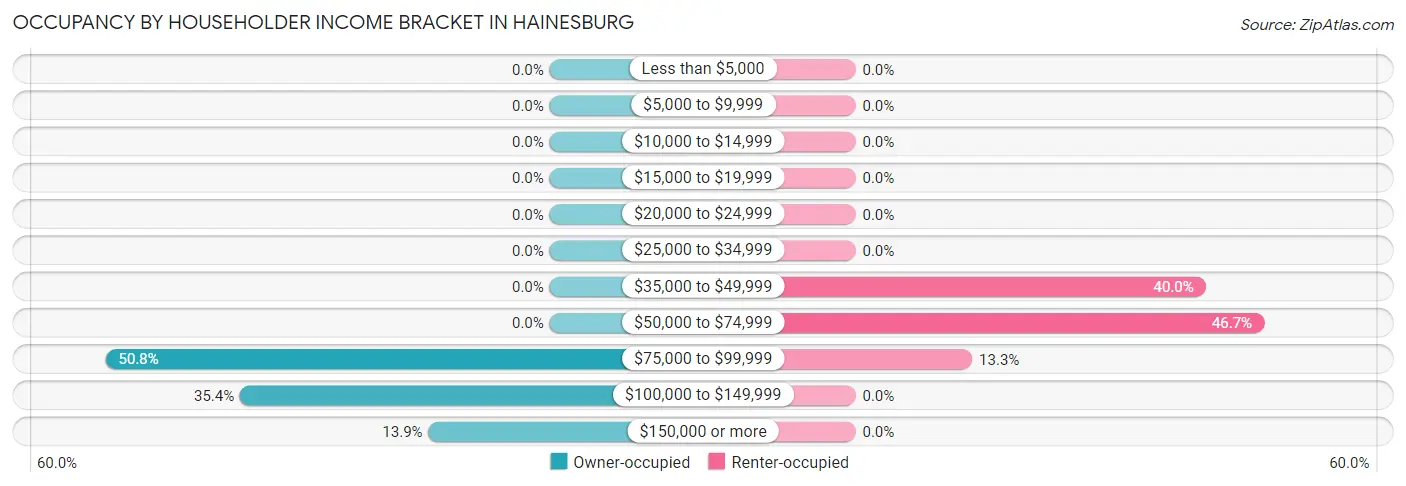
| Income Bracket | Owner-occupied | Renter-occupied |
| Less than $5,000 | 0 (0.0%) | 0 (0.0%) |
| $5,000 to $9,999 | 0 (0.0%) | 0 (0.0%) |
| $10,000 to $14,999 | 0 (0.0%) | 0 (0.0%) |
| $15,000 to $19,999 | 0 (0.0%) | 0 (0.0%) |
| $20,000 to $24,999 | 0 (0.0%) | 0 (0.0%) |
| $25,000 to $34,999 | 0 (0.0%) | 0 (0.0%) |
| $35,000 to $49,999 | 0 (0.0%) | 6 (40.0%) |
| $50,000 to $74,999 | 0 (0.0%) | 7 (46.7%) |
| $75,000 to $99,999 | 33 (50.8%) | 2 (13.3%) |
| $100,000 to $149,999 | 23 (35.4%) | 0 (0.0%) |
| $150,000 or more | 9 (13.9%) | 0 (0.0%) |
| Total | 65 (100.0%) | 15 (100.0%) |
Monthly Housing Cost Tiers in Hainesburg
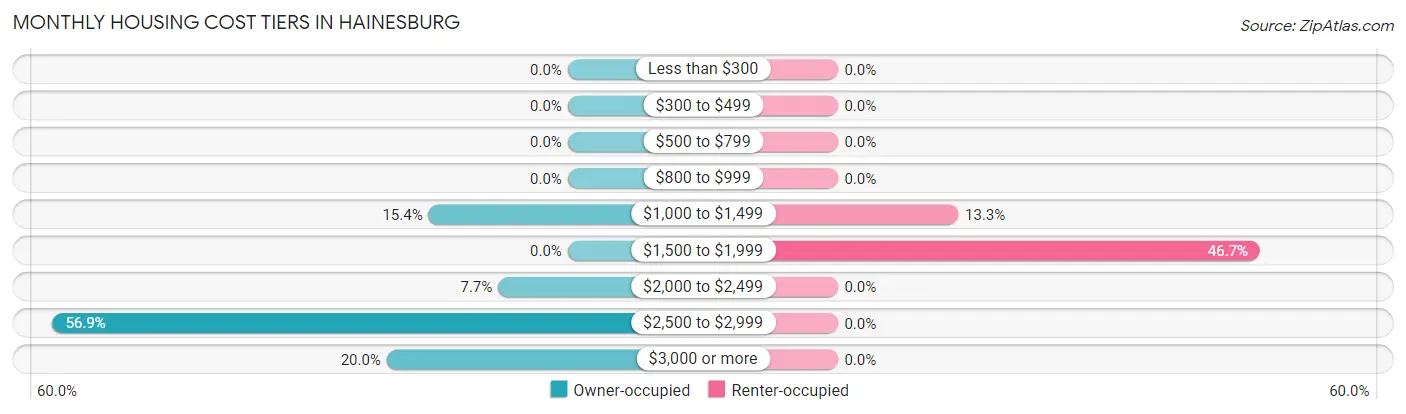
| Monthly Cost | Owner-occupied | Renter-occupied |
| Less than $300 | 0 (0.0%) | 0 (0.0%) |
| $300 to $499 | 0 (0.0%) | 0 (0.0%) |
| $500 to $799 | 0 (0.0%) | 0 (0.0%) |
| $800 to $999 | 0 (0.0%) | 0 (0.0%) |
| $1,000 to $1,499 | 10 (15.4%) | 2 (13.3%) |
| $1,500 to $1,999 | 0 (0.0%) | 7 (46.7%) |
| $2,000 to $2,499 | 5 (7.7%) | 0 (0.0%) |
| $2,500 to $2,999 | 37 (56.9%) | 0 (0.0%) |
| $3,000 or more | 13 (20.0%) | 0 (0.0%) |
| Total | 65 (100.0%) | 15 (100.0%) |
Physical Housing Characteristics in Hainesburg
Housing Structures in Hainesburg
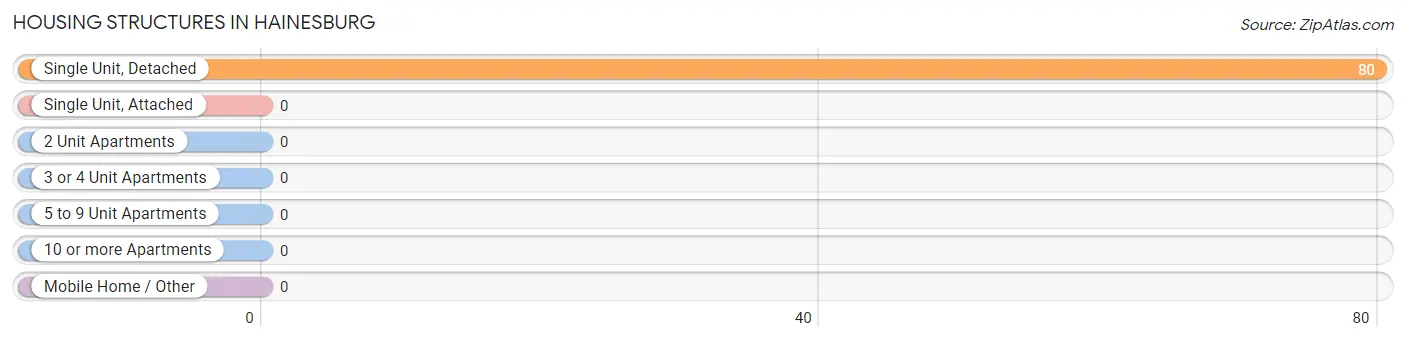
| Structure Type | # Housing Units | % Housing Units |
| Single Unit, Detached | 80 | 100.0% |
| Single Unit, Attached | 0 | 0.0% |
| 2 Unit Apartments | 0 | 0.0% |
| 3 or 4 Unit Apartments | 0 | 0.0% |
| 5 to 9 Unit Apartments | 0 | 0.0% |
| 10 or more Apartments | 0 | 0.0% |
| Mobile Home / Other | 0 | 0.0% |
| Total | 80 | 100.0% |
Housing Structures by Occupancy in Hainesburg
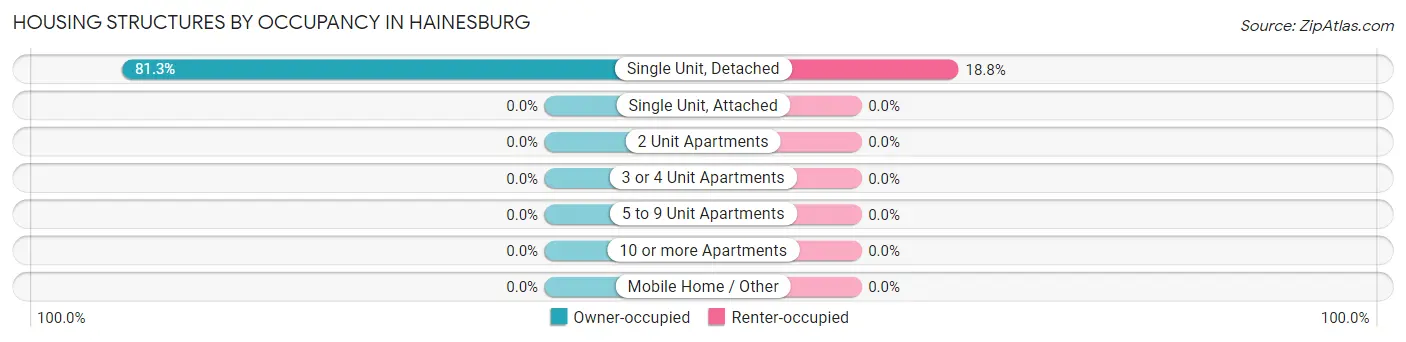
| Structure Type | Owner-occupied | Renter-occupied |
| Single Unit, Detached | 65 (81.2%) | 15 (18.8%) |
| Single Unit, Attached | 0 (0.0%) | 0 (0.0%) |
| 2 Unit Apartments | 0 (0.0%) | 0 (0.0%) |
| 3 or 4 Unit Apartments | 0 (0.0%) | 0 (0.0%) |
| 5 to 9 Unit Apartments | 0 (0.0%) | 0 (0.0%) |
| 10 or more Apartments | 0 (0.0%) | 0 (0.0%) |
| Mobile Home / Other | 0 (0.0%) | 0 (0.0%) |
| Total | 65 (81.2%) | 15 (18.8%) |
Housing Structures by Number of Rooms in Hainesburg
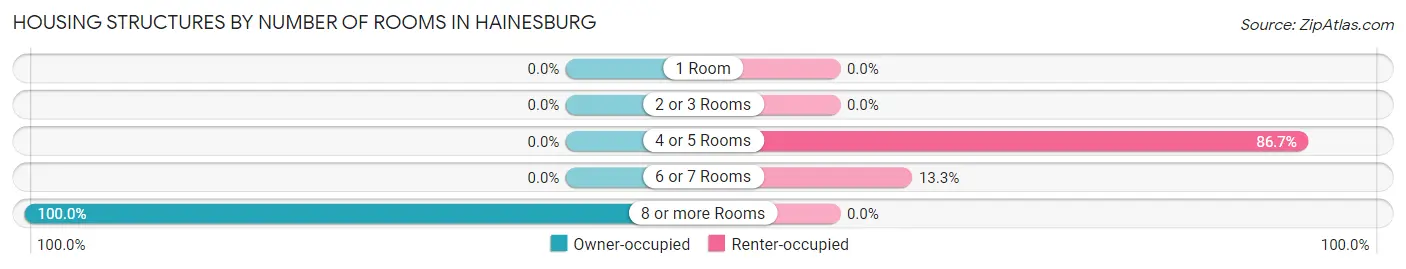
| Number of Rooms | Owner-occupied | Renter-occupied |
| 1 Room | 0 (0.0%) | 0 (0.0%) |
| 2 or 3 Rooms | 0 (0.0%) | 0 (0.0%) |
| 4 or 5 Rooms | 0 (0.0%) | 13 (86.7%) |
| 6 or 7 Rooms | 0 (0.0%) | 2 (13.3%) |
| 8 or more Rooms | 65 (100.0%) | 0 (0.0%) |
| Total | 65 (100.0%) | 15 (100.0%) |
Housing Structure by Heating Type in Hainesburg
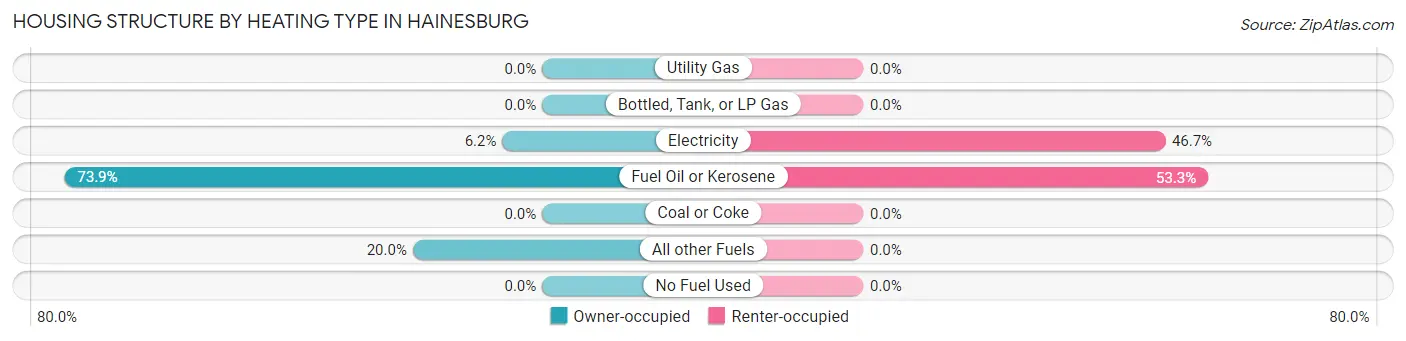
| Heating Type | Owner-occupied | Renter-occupied |
| Utility Gas | 0 (0.0%) | 0 (0.0%) |
| Bottled, Tank, or LP Gas | 0 (0.0%) | 0 (0.0%) |
| Electricity | 4 (6.1%) | 7 (46.7%) |
| Fuel Oil or Kerosene | 48 (73.9%) | 8 (53.3%) |
| Coal or Coke | 0 (0.0%) | 0 (0.0%) |
| All other Fuels | 13 (20.0%) | 0 (0.0%) |
| No Fuel Used | 0 (0.0%) | 0 (0.0%) |
| Total | 65 (100.0%) | 15 (100.0%) |
Household Vehicle Usage in Hainesburg
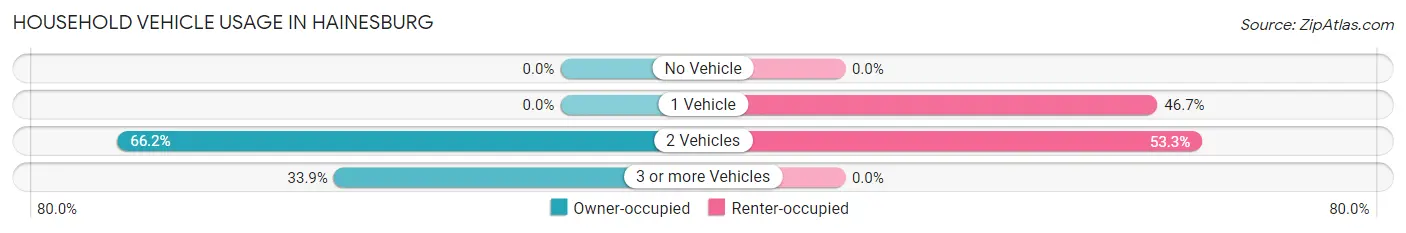
| Vehicles per Household | Owner-occupied | Renter-occupied |
| No Vehicle | 0 (0.0%) | 0 (0.0%) |
| 1 Vehicle | 0 (0.0%) | 7 (46.7%) |
| 2 Vehicles | 43 (66.1%) | 8 (53.3%) |
| 3 or more Vehicles | 22 (33.9%) | 0 (0.0%) |
| Total | 65 (100.0%) | 15 (100.0%) |
Real Estate & Mortgages in Hainesburg
Real Estate and Mortgage Overview in Hainesburg
| Characteristic | Without Mortgage | With Mortgage |
| Housing Units | 10 | 55 |
| Median Property Value | - | - |
| Median Household Income | - | - |
| Monthly Housing Costs | - | - |
| Real Estate Taxes | - | - |
Property Value by Mortgage Status in Hainesburg
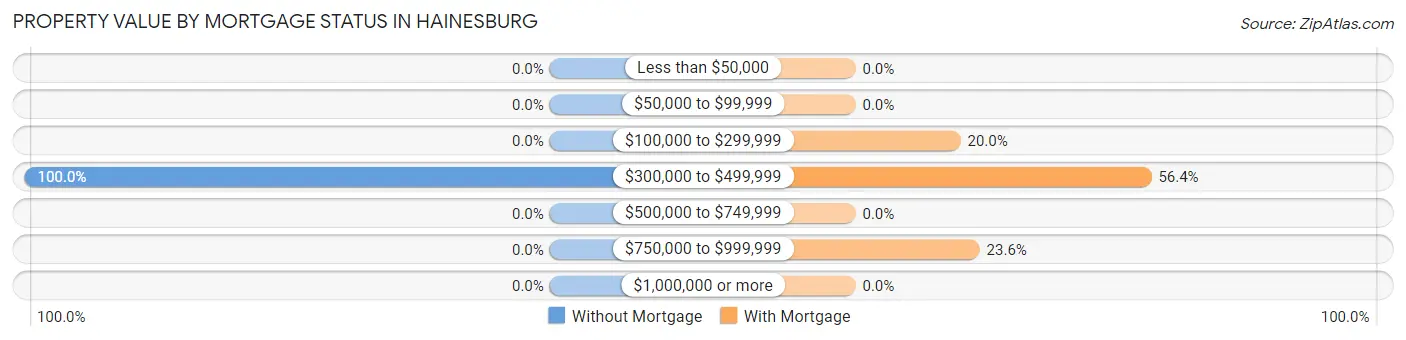
| Property Value | Without Mortgage | With Mortgage |
| Less than $50,000 | 0 (0.0%) | 0 (0.0%) |
| $50,000 to $99,999 | 0 (0.0%) | 0 (0.0%) |
| $100,000 to $299,999 | 0 (0.0%) | 11 (20.0%) |
| $300,000 to $499,999 | 10 (100.0%) | 31 (56.4%) |
| $500,000 to $749,999 | 0 (0.0%) | 0 (0.0%) |
| $750,000 to $999,999 | 0 (0.0%) | 13 (23.6%) |
| $1,000,000 or more | 0 (0.0%) | 0 (0.0%) |
| Total | 10 (100.0%) | 55 (100.0%) |
Household Income by Mortgage Status in Hainesburg
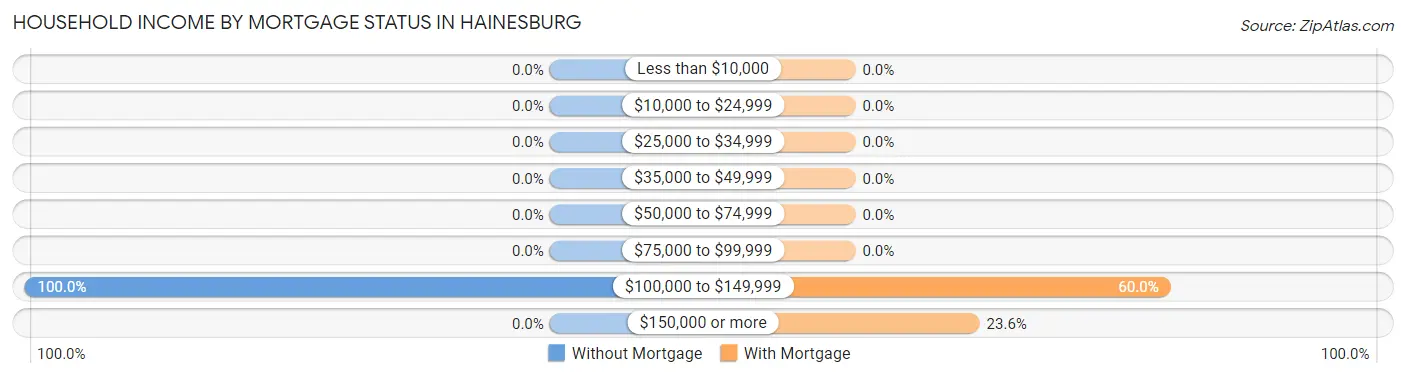
| Household Income | Without Mortgage | With Mortgage |
| Less than $10,000 | 0 (0.0%) | 0 (0.0%) |
| $10,000 to $24,999 | 0 (0.0%) | 0 (0.0%) |
| $25,000 to $34,999 | 0 (0.0%) | 0 (0.0%) |
| $35,000 to $49,999 | 0 (0.0%) | 0 (0.0%) |
| $50,000 to $74,999 | 0 (0.0%) | 0 (0.0%) |
| $75,000 to $99,999 | 0 (0.0%) | 0 (0.0%) |
| $100,000 to $149,999 | 10 (100.0%) | 33 (60.0%) |
| $150,000 or more | 0 (0.0%) | 13 (23.6%) |
| Total | 10 (100.0%) | 55 (100.0%) |
Property Value to Household Income Ratio in Hainesburg
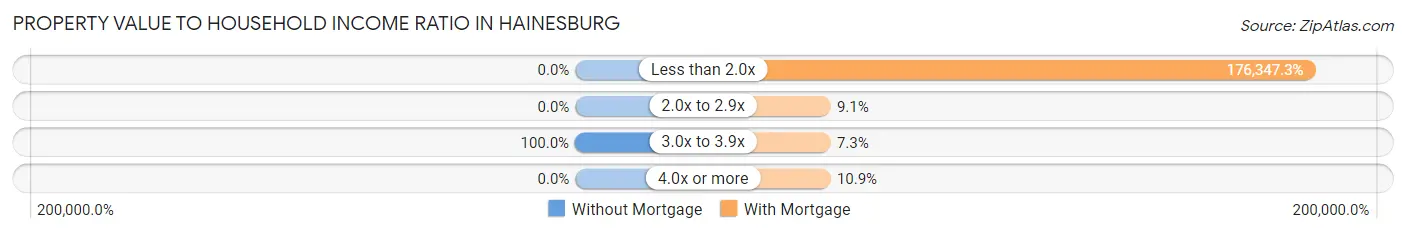
| Value-to-Income Ratio | Without Mortgage | With Mortgage |
| Less than 2.0x | 0 (0.0%) | 96,991 (176,347.3%) |
| 2.0x to 2.9x | 0 (0.0%) | 5 (9.1%) |
| 3.0x to 3.9x | 10 (100.0%) | 4 (7.3%) |
| 4.0x or more | 0 (0.0%) | 6 (10.9%) |
| Total | 10 (100.0%) | 55 (100.0%) |
Real Estate Taxes by Mortgage Status in Hainesburg
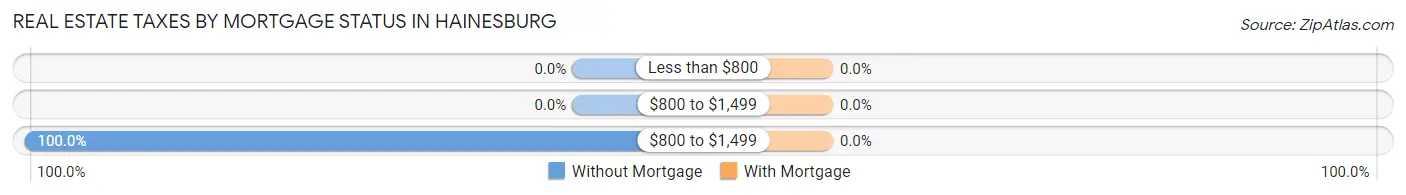
| Property Taxes | Without Mortgage | With Mortgage |
| Less than $800 | 0 (0.0%) | 0 (0.0%) |
| $800 to $1,499 | 0 (0.0%) | 0 (0.0%) |
| $800 to $1,499 | 10 (100.0%) | 0 (0.0%) |
| Total | 10 (100.0%) | 55 (100.0%) |
Health & Disability in Hainesburg
Health Insurance Coverage by Age in Hainesburg
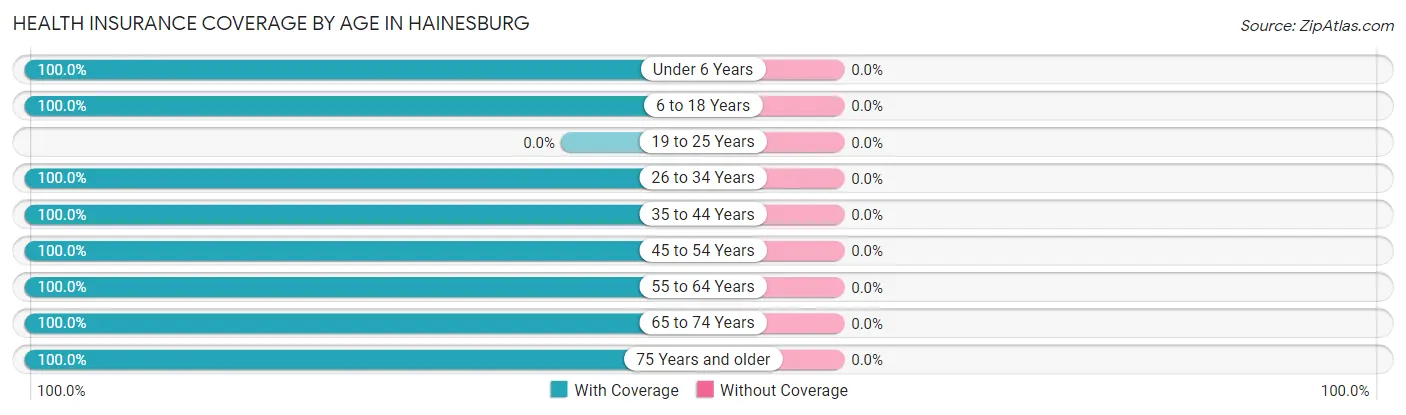
| Age Bracket | With Coverage | Without Coverage |
| Under 6 Years | 44 (100.0%) | 0 (0.0%) |
| 6 to 18 Years | 71 (100.0%) | 0 (0.0%) |
| 19 to 25 Years | 0 (0.0%) | 0 (0.0%) |
| 26 to 34 Years | 4 (100.0%) | 0 (0.0%) |
| 35 to 44 Years | 58 (100.0%) | 0 (0.0%) |
| 45 to 54 Years | 5 (100.0%) | 0 (0.0%) |
| 55 to 64 Years | 46 (100.0%) | 0 (0.0%) |
| 65 to 74 Years | 8 (100.0%) | 0 (0.0%) |
| 75 Years and older | 21 (100.0%) | 0 (0.0%) |
| Total | 257 (100.0%) | 0 (0.0%) |
Health Insurance Coverage by Citizenship Status in Hainesburg
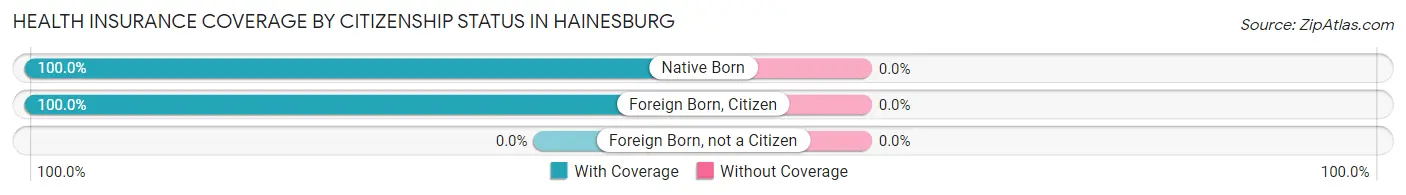
| Citizenship Status | With Coverage | Without Coverage |
| Native Born | 44 (100.0%) | 0 (0.0%) |
| Foreign Born, Citizen | 71 (100.0%) | 0 (0.0%) |
| Foreign Born, not a Citizen | 0 (0.0%) | 0 (0.0%) |
Health Insurance Coverage by Household Income in Hainesburg
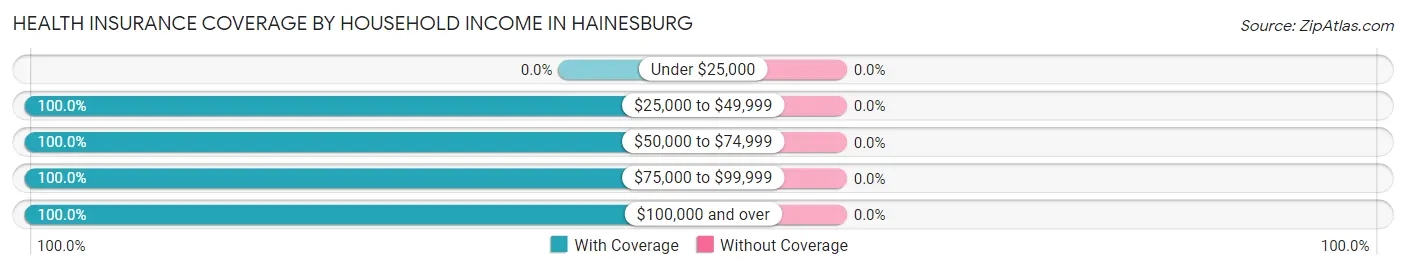
| Household Income | With Coverage | Without Coverage |
| Under $25,000 | 0 (0.0%) | 0 (0.0%) |
| $25,000 to $49,999 | 6 (100.0%) | 0 (0.0%) |
| $50,000 to $74,999 | 7 (100.0%) | 0 (0.0%) |
| $75,000 to $99,999 | 177 (100.0%) | 0 (0.0%) |
| $100,000 and over | 67 (100.0%) | 0 (0.0%) |
Public vs Private Health Insurance Coverage by Age in Hainesburg
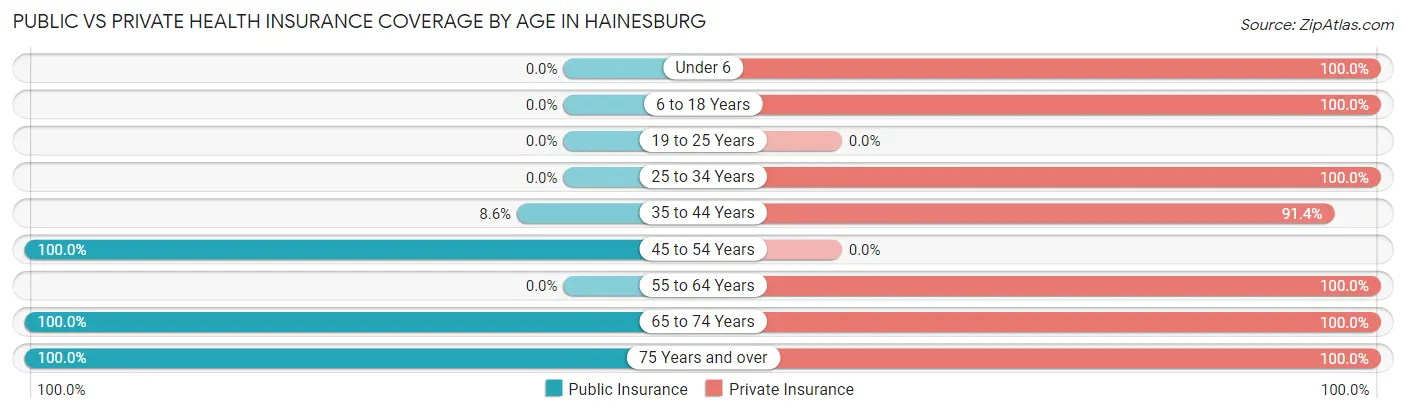
| Age Bracket | Public Insurance | Private Insurance |
| Under 6 | 0 (0.0%) | 44 (100.0%) |
| 6 to 18 Years | 0 (0.0%) | 71 (100.0%) |
| 19 to 25 Years | 0 (0.0%) | 0 (0.0%) |
| 25 to 34 Years | 0 (0.0%) | 4 (100.0%) |
| 35 to 44 Years | 5 (8.6%) | 53 (91.4%) |
| 45 to 54 Years | 5 (100.0%) | 0 (0.0%) |
| 55 to 64 Years | 0 (0.0%) | 46 (100.0%) |
| 65 to 74 Years | 8 (100.0%) | 8 (100.0%) |
| 75 Years and over | 21 (100.0%) | 21 (100.0%) |
| Total | 39 (15.2%) | 247 (96.1%) |
Disability Status by Sex by Age in Hainesburg
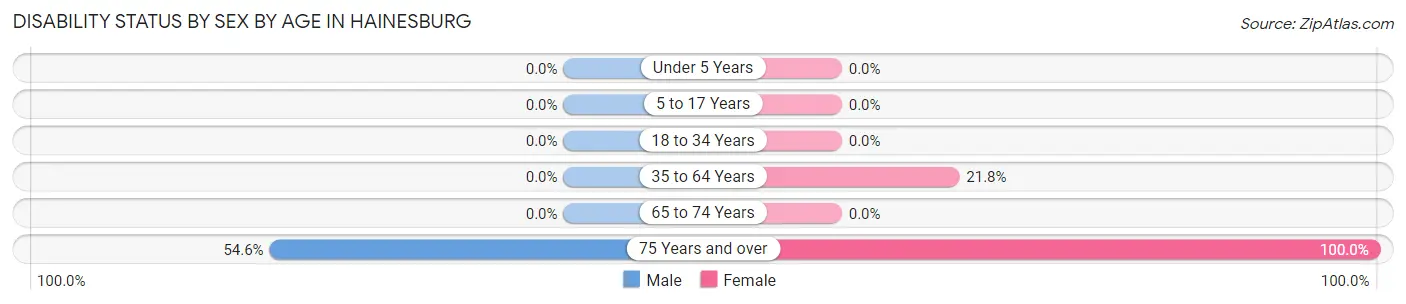
| Age Bracket | Male | Female |
| Under 5 Years | 0 (0.0%) | 0 (0.0%) |
| 5 to 17 Years | 0 (0.0%) | 0 (0.0%) |
| 18 to 34 Years | 0 (0.0%) | 0 (0.0%) |
| 35 to 64 Years | 0 (0.0%) | 12 (21.8%) |
| 65 to 74 Years | 0 (0.0%) | 0 (0.0%) |
| 75 Years and over | 6 (54.5%) | 10 (100.0%) |
Disability Class by Sex by Age in Hainesburg
Disability Class: Hearing Difficulty
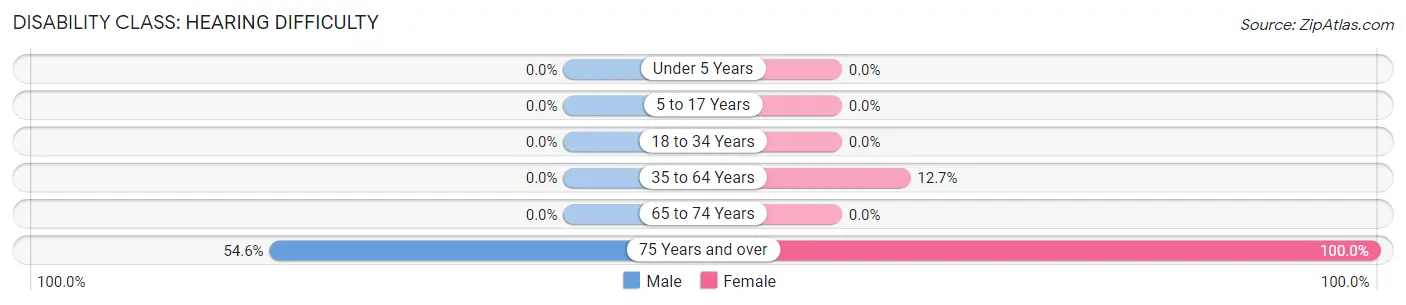
| Age Bracket | Male | Female |
| Under 5 Years | 0 (0.0%) | 0 (0.0%) |
| 5 to 17 Years | 0 (0.0%) | 0 (0.0%) |
| 18 to 34 Years | 0 (0.0%) | 0 (0.0%) |
| 35 to 64 Years | 0 (0.0%) | 7 (12.7%) |
| 65 to 74 Years | 0 (0.0%) | 0 (0.0%) |
| 75 Years and over | 6 (54.5%) | 10 (100.0%) |
Disability Class: Vision Difficulty
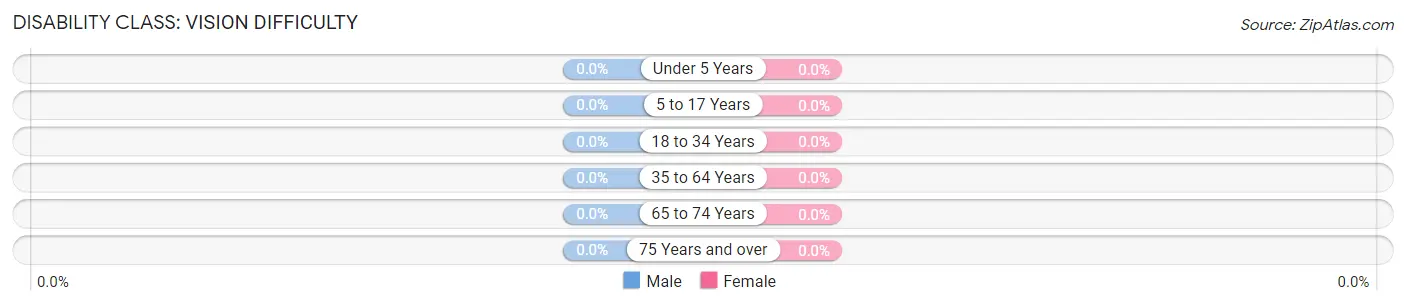
| Age Bracket | Male | Female |
| Under 5 Years | 0 (0.0%) | 0 (0.0%) |
| 5 to 17 Years | 0 (0.0%) | 0 (0.0%) |
| 18 to 34 Years | 0 (0.0%) | 0 (0.0%) |
| 35 to 64 Years | 0 (0.0%) | 0 (0.0%) |
| 65 to 74 Years | 0 (0.0%) | 0 (0.0%) |
| 75 Years and over | 0 (0.0%) | 0 (0.0%) |
Disability Class: Cognitive Difficulty

| Age Bracket | Male | Female |
| 5 to 17 Years | 0 (0.0%) | 0 (0.0%) |
| 18 to 34 Years | 0 (0.0%) | 0 (0.0%) |
| 35 to 64 Years | 0 (0.0%) | 0 (0.0%) |
| 65 to 74 Years | 0 (0.0%) | 0 (0.0%) |
| 75 Years and over | 0 (0.0%) | 0 (0.0%) |
Disability Class: Ambulatory Difficulty
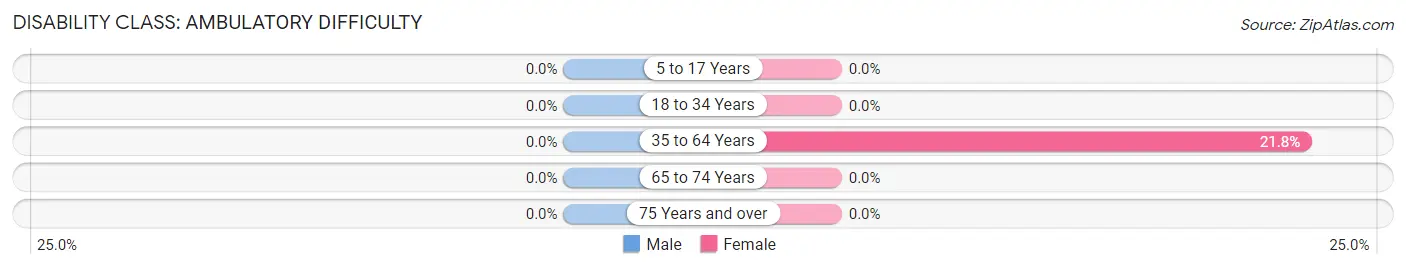
| Age Bracket | Male | Female |
| 5 to 17 Years | 0 (0.0%) | 0 (0.0%) |
| 18 to 34 Years | 0 (0.0%) | 0 (0.0%) |
| 35 to 64 Years | 0 (0.0%) | 12 (21.8%) |
| 65 to 74 Years | 0 (0.0%) | 0 (0.0%) |
| 75 Years and over | 0 (0.0%) | 0 (0.0%) |
Disability Class: Self-Care Difficulty
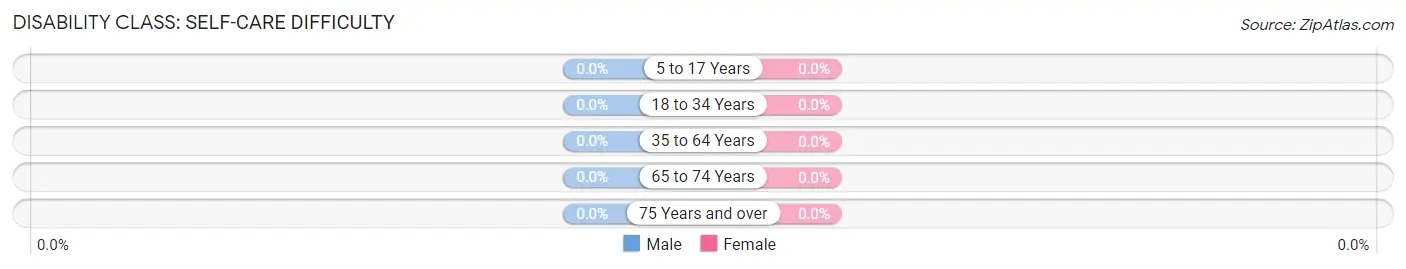
| Age Bracket | Male | Female |
| 5 to 17 Years | 0 (0.0%) | 0 (0.0%) |
| 18 to 34 Years | 0 (0.0%) | 0 (0.0%) |
| 35 to 64 Years | 0 (0.0%) | 0 (0.0%) |
| 65 to 74 Years | 0 (0.0%) | 0 (0.0%) |
| 75 Years and over | 0 (0.0%) | 0 (0.0%) |
Technology Access in Hainesburg
Computing Device Access in Hainesburg
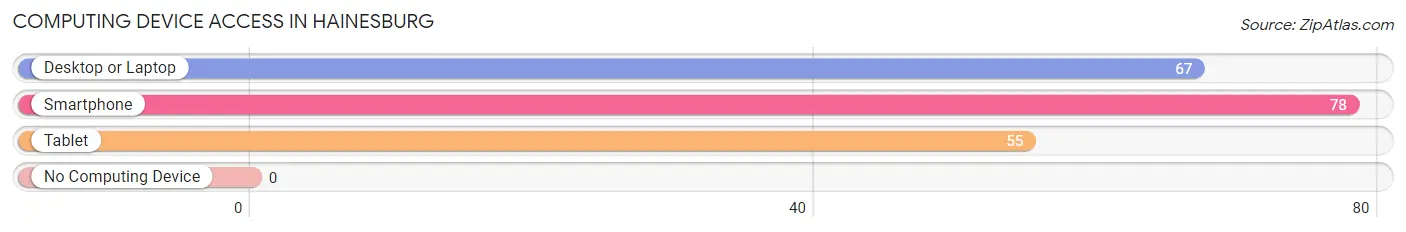
| Device Type | # Households | % Households |
| Desktop or Laptop | 67 | 83.8% |
| Smartphone | 78 | 97.5% |
| Tablet | 55 | 68.8% |
| No Computing Device | 0 | 0.0% |
| Total | 80 | 100.0% |
Internet Access in Hainesburg
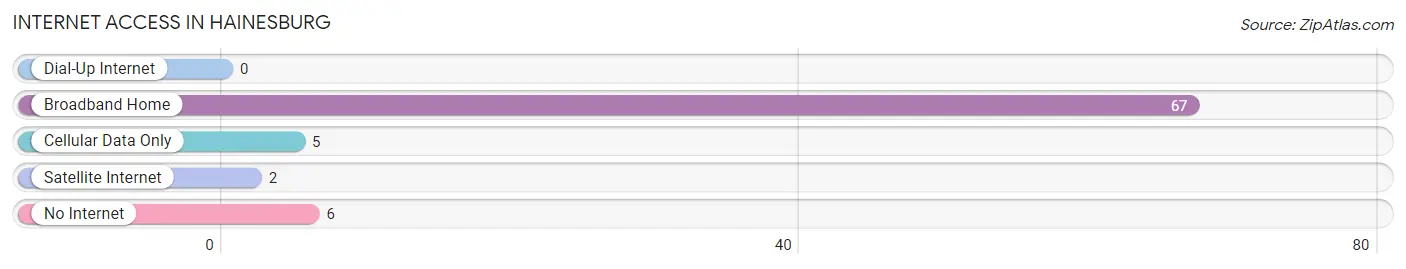
| Internet Type | # Households | % Households |
| Dial-Up Internet | 0 | 0.0% |
| Broadband Home | 67 | 83.8% |
| Cellular Data Only | 5 | 6.2% |
| Satellite Internet | 2 | 2.5% |
| No Internet | 6 | 7.5% |
| Total | 80 | 100.0% |
Hainesburg Summary
Hainesburg is a small unincorporated community located in Warren County, New Jersey. It is situated in the northwest corner of the county, near the border with Pennsylvania. The community is located in the Kittatinny Valley, a region of the Appalachian Mountains. The population of Hainesburg was estimated to be around 200 people in 2000.
History
Hainesburg was first settled in the late 1700s by German immigrants. The community was named after the Haines family, who were among the first settlers. The Haines family owned a large tract of land in the area, which was used for farming and timber production. The community grew slowly over the years, and by the early 1900s, it had become a small rural village.
Geography
Hainesburg is located in the Kittatinny Valley, a region of the Appalachian Mountains. The community is situated in the northwest corner of Warren County, near the border with Pennsylvania. The terrain is mostly hilly and forested, with some open fields and meadows. The climate is temperate, with cold winters and warm summers.
Economy
The economy of Hainesburg is largely based on agriculture and timber production. The community is home to several small farms, which produce a variety of crops, including corn, soybeans, and hay. The timber industry is also important to the local economy, with several sawmills located in the area. In addition, there are a few small businesses in the community, including a general store and a gas station.
Demographics
According to the 2000 census, the population of Hainesburg was estimated to be around 200 people. The racial makeup of the community was 97.5% White, 0.5% African American, 0.5% Native American, and 1.5% from other races. The median household income was $37,500, and the median family income was $41,250. The per capita income was $17,500.
Conclusion
Hainesburg is a small unincorporated community located in Warren County, New Jersey. It is situated in the northwest corner of the county, near the border with Pennsylvania. The community is located in the Kittatinny Valley, a region of the Appalachian Mountains. The population of Hainesburg was estimated to be around 200 people in 2000. The economy of Hainesburg is largely based on agriculture and timber production, and the racial makeup of the community is predominantly White. The median household income was $37,500, and the median family income was $41,250. Hainesburg is a small rural community with a rich history and a bright future.
Common Questions
What is Per Capita Income in Hainesburg?
Per Capita income in Hainesburg is $31,784.
What is the Median Family Income in Hainesburg?
Median Family Income in Hainesburg is $97,454.
What is the Median Household income in Hainesburg?
Median Household Income in Hainesburg is $96,759.
What is Inequality or Gini Index in Hainesburg?
Inequality or Gini Index in Hainesburg is 0.19.
What is the Total Population of Hainesburg?
Total Population of Hainesburg is 257.
What is the Total Male Population of Hainesburg?
Total Male Population of Hainesburg is 142.
What is the Total Female Population of Hainesburg?
Total Female Population of Hainesburg is 115.
What is the Ratio of Males per 100 Females in Hainesburg?
There are 123.48 Males per 100 Females in Hainesburg.
What is the Ratio of Females per 100 Males in Hainesburg?
There are 80.99 Females per 100 Males in Hainesburg.
What is the Median Population Age in Hainesburg?
Median Population Age in Hainesburg is 35.2 Years.
What is the Average Family Size in Hainesburg
Average Family Size in Hainesburg is 3.7 People.
What is the Average Household Size in Hainesburg
Average Household Size in Hainesburg is 3.2 People.
How Large is the Labor Force in Hainesburg?
There are 95 People in the Labor Forcein in Hainesburg.
What is the Percentage of People in the Labor Force in Hainesburg?
66.9% of People are in the Labor Force in Hainesburg.