Brass Castle, NJ Map & Demographics
Brass Castle Map
Brass Castle Overview
$47,538
PER CAPITA INCOME
$138,224
AVG FAMILY INCOME
$92,563
AVG HOUSEHOLD INCOME
0.39
INEQUALITY / GINI INDEX
1,471
TOTAL POPULATION
670
MALE POPULATION
801
FEMALE POPULATION
83.65
MALES / 100 FEMALES
119.55
FEMALES / 100 MALES
46.2
MEDIAN AGE
3.0
AVG FAMILY SIZE
2.6
AVG HOUSEHOLD SIZE
702
LABOR FORCE [ PEOPLE ]
61.0%
PERCENT IN LABOR FORCE
11.5%
UNEMPLOYMENT RATE
Income in Brass Castle
Income Overview in Brass Castle
Per Capita Income in Brass Castle is $47,538, while median incomes of families and households are $138,224 and $92,563 respectively.
| Characteristic | Number | Measure |
| Per Capita Income | 1,471 | $47,538 |
| Median Family Income | 435 | $138,224 |
| Mean Family Income | 435 | $138,831 |
| Median Household Income | 565 | $92,563 |
| Mean Household Income | 565 | $122,437 |
| Income Deficit | 435 | $0 |
| Wage / Income Gap (%) | 1,471 | 0.00% |
| Wage / Income Gap ($) | 1,471 | 100.00¢ per $1 |
| Gini / Inequality Index | 1,471 | 0.39 |
Earnings by Sex in Brass Castle
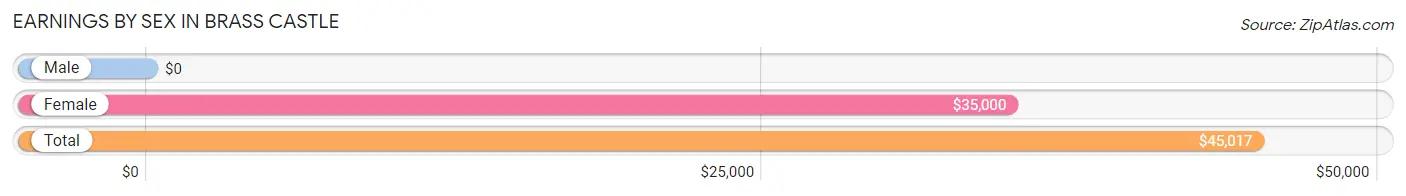
| Sex | Number | Average Earnings |
| Male | 295 (40.6%) | $0 |
| Female | 432 (59.4%) | $35,000 |
| Total | 727 (100.0%) | $45,017 |
Earnings by Sex by Income Bracket in Brass Castle
The most common earnings brackets in Brass Castle are $100,000+ for men (131 | 44.4%) and $30,000 to $34,999 for women (154 | 35.6%).
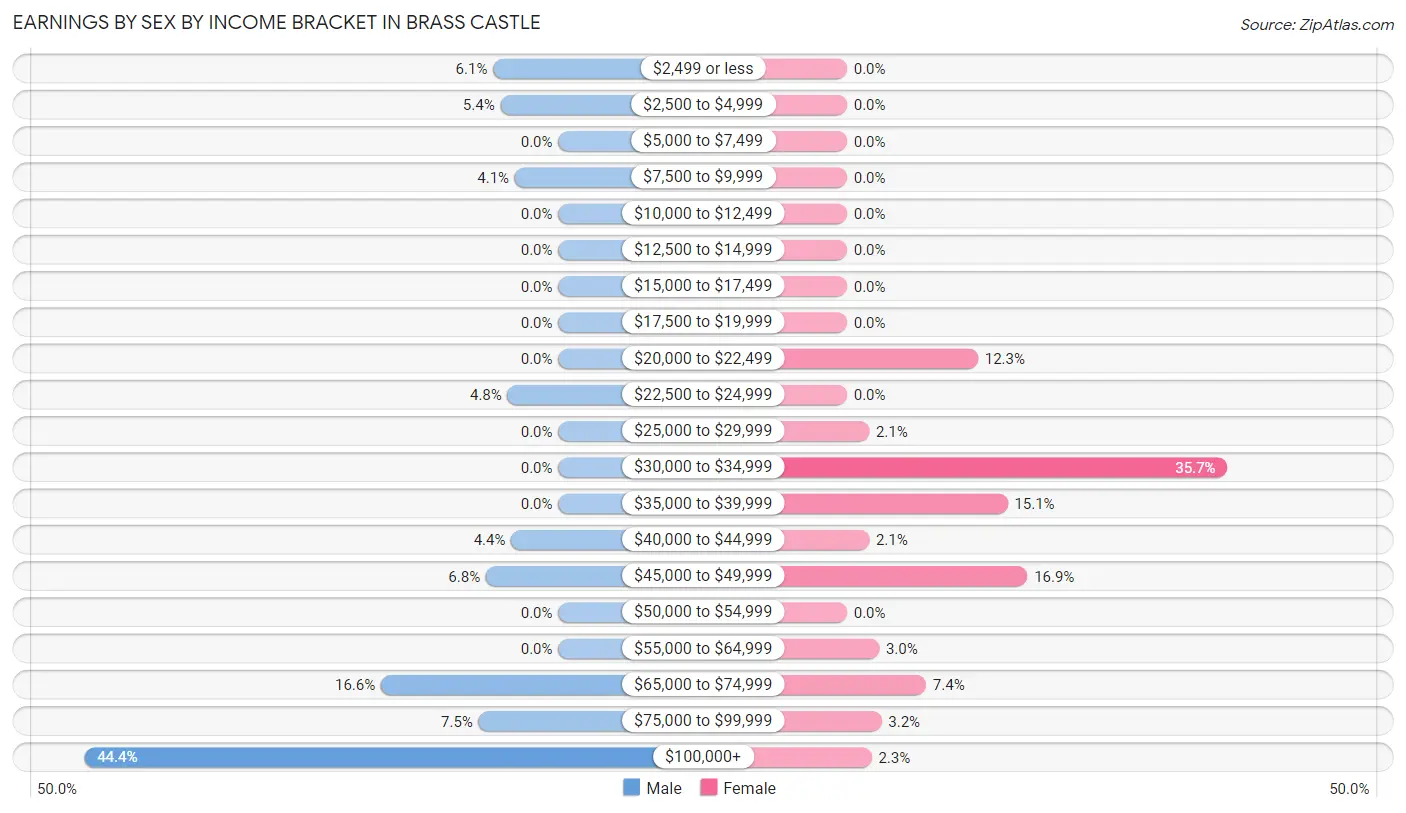
| Income | Male | Female |
| $2,499 or less | 18 (6.1%) | 0 (0.0%) |
| $2,500 to $4,999 | 16 (5.4%) | 0 (0.0%) |
| $5,000 to $7,499 | 0 (0.0%) | 0 (0.0%) |
| $7,500 to $9,999 | 12 (4.1%) | 0 (0.0%) |
| $10,000 to $12,499 | 0 (0.0%) | 0 (0.0%) |
| $12,500 to $14,999 | 0 (0.0%) | 0 (0.0%) |
| $15,000 to $17,499 | 0 (0.0%) | 0 (0.0%) |
| $17,500 to $19,999 | 0 (0.0%) | 0 (0.0%) |
| $20,000 to $22,499 | 0 (0.0%) | 53 (12.3%) |
| $22,500 to $24,999 | 14 (4.8%) | 0 (0.0%) |
| $25,000 to $29,999 | 0 (0.0%) | 9 (2.1%) |
| $30,000 to $34,999 | 0 (0.0%) | 154 (35.6%) |
| $35,000 to $39,999 | 0 (0.0%) | 65 (15.0%) |
| $40,000 to $44,999 | 13 (4.4%) | 9 (2.1%) |
| $45,000 to $49,999 | 20 (6.8%) | 73 (16.9%) |
| $50,000 to $54,999 | 0 (0.0%) | 0 (0.0%) |
| $55,000 to $64,999 | 0 (0.0%) | 13 (3.0%) |
| $65,000 to $74,999 | 49 (16.6%) | 32 (7.4%) |
| $75,000 to $99,999 | 22 (7.5%) | 14 (3.2%) |
| $100,000+ | 131 (44.4%) | 10 (2.3%) |
| Total | 295 (100.0%) | 432 (100.0%) |
Earnings by Sex by Educational Attainment in Brass Castle
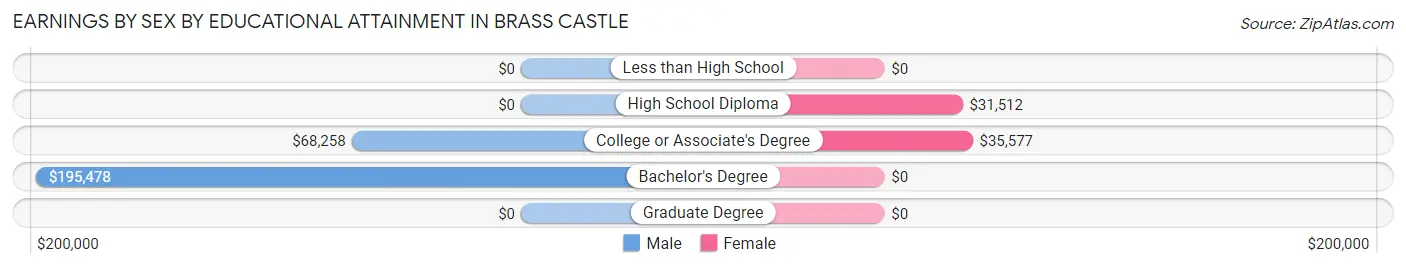
| Educational Attainment | Male Income | Female Income |
| Less than High School | - | - |
| High School Diploma | - | - |
| College or Associate's Degree | $68,258 | $35,577 |
| Bachelor's Degree | $195,478 | $0 |
| Graduate Degree | - | - |
| Total | - | - |
Family Income in Brass Castle
Family Income Brackets in Brass Castle
According to the Brass Castle family income data, there are 157 families falling into the $200,000+ income range, which is the most common income bracket and makes up 36.1% of all families.
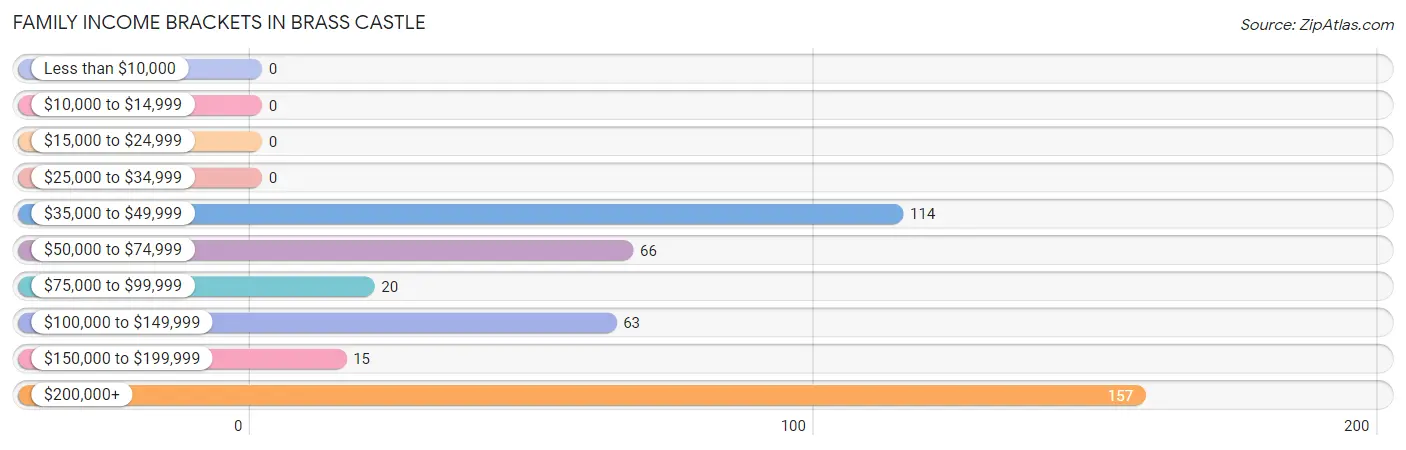
| Income Bracket | # Families | % Families |
| Less than $10,000 | 0 | 0.0% |
| $10,000 to $14,999 | 0 | 0.0% |
| $15,000 to $24,999 | 0 | 0.0% |
| $25,000 to $34,999 | 0 | 0.0% |
| $35,000 to $49,999 | 114 | 26.2% |
| $50,000 to $74,999 | 66 | 15.2% |
| $75,000 to $99,999 | 20 | 4.6% |
| $100,000 to $149,999 | 63 | 14.5% |
| $150,000 to $199,999 | 15 | 3.4% |
| $200,000+ | 157 | 36.1% |
Family Income by Famaliy Size in Brass Castle
3-person families (68 | 15.6%) account for the highest median family income in Brass Castle with $155,500 per family, while 3-person families (68 | 15.6%) have the highest median income of $51,833 per family member.
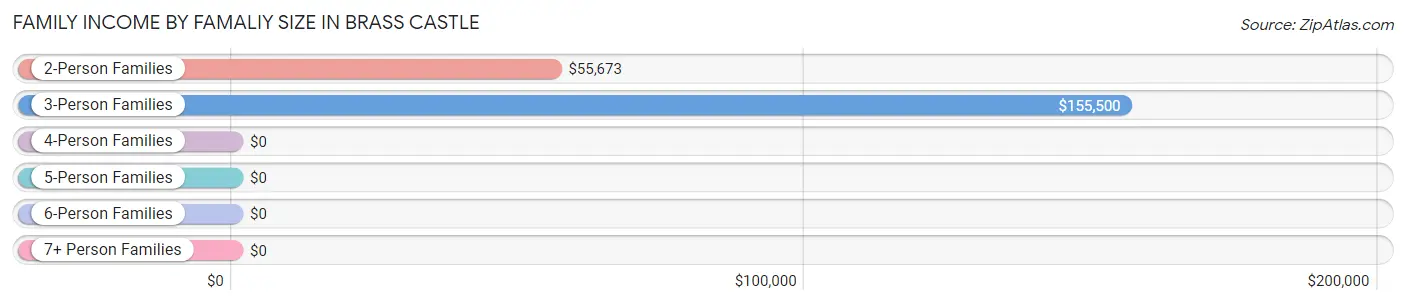
| Income Bracket | # Families | Median Income |
| 2-Person Families | 235 (54.0%) | $55,673 |
| 3-Person Families | 68 (15.6%) | $155,500 |
| 4-Person Families | 102 (23.4%) | $0 |
| 5-Person Families | 20 (4.6%) | $0 |
| 6-Person Families | 10 (2.3%) | $0 |
| 7+ Person Families | 0 (0.0%) | $0 |
| Total | 435 (100.0%) | $138,224 |
Family Income by Number of Earners in Brass Castle
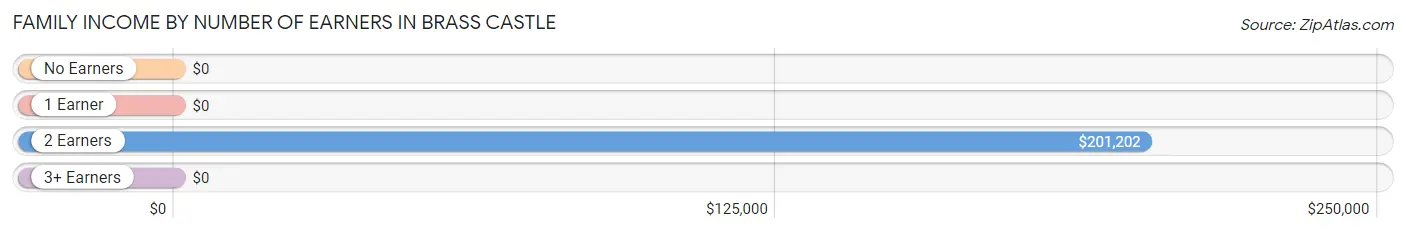
| Number of Earners | # Families | Median Income |
| No Earners | 50 (11.5%) | $0 |
| 1 Earner | 154 (35.4%) | $0 |
| 2 Earners | 231 (53.1%) | $201,202 |
| 3+ Earners | 0 (0.0%) | $0 |
| Total | 435 (100.0%) | $138,224 |
Household Income in Brass Castle
Household Income Brackets in Brass Castle
With 157 households falling in the category, the $200,000+ income range is the most frequent in Brass Castle, accounting for 27.8% of all households.
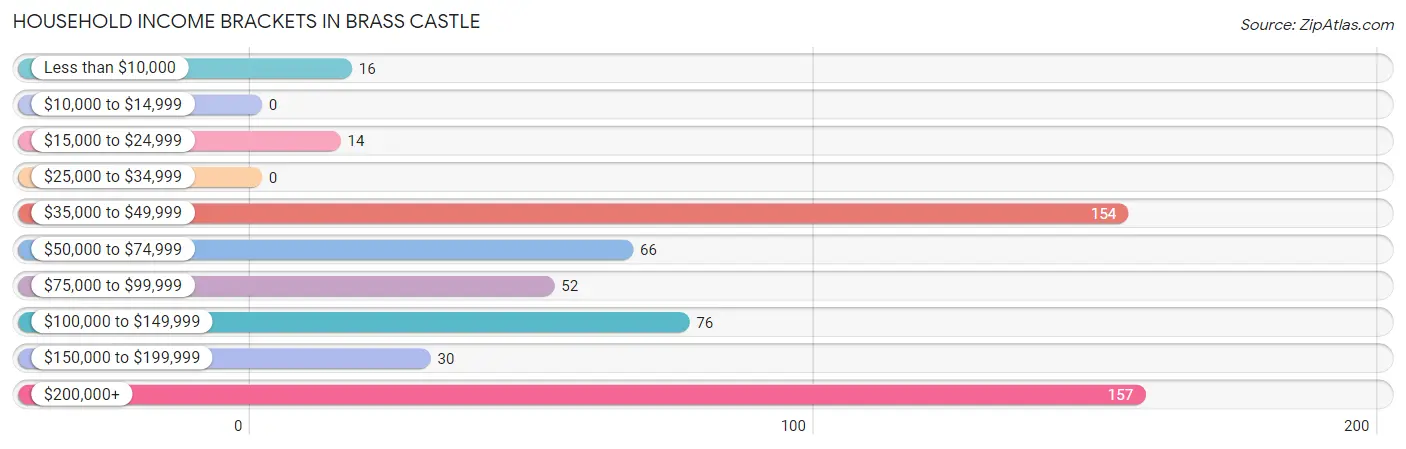
| Income Bracket | # Households | % Households |
| Less than $10,000 | 16 | 2.8% |
| $10,000 to $14,999 | 0 | 0.0% |
| $15,000 to $24,999 | 14 | 2.5% |
| $25,000 to $34,999 | 0 | 0.0% |
| $35,000 to $49,999 | 154 | 27.3% |
| $50,000 to $74,999 | 66 | 11.7% |
| $75,000 to $99,999 | 52 | 9.2% |
| $100,000 to $149,999 | 76 | 13.5% |
| $150,000 to $199,999 | 30 | 5.3% |
| $200,000+ | 157 | 27.8% |
Household Income by Householder Age in Brass Castle
The median household income in Brass Castle is $92,563, with the highest median household income of $202,756 found in the 45 to 64 years age bracket for the primary householder. A total of 215 households (38.1%) fall into this category.
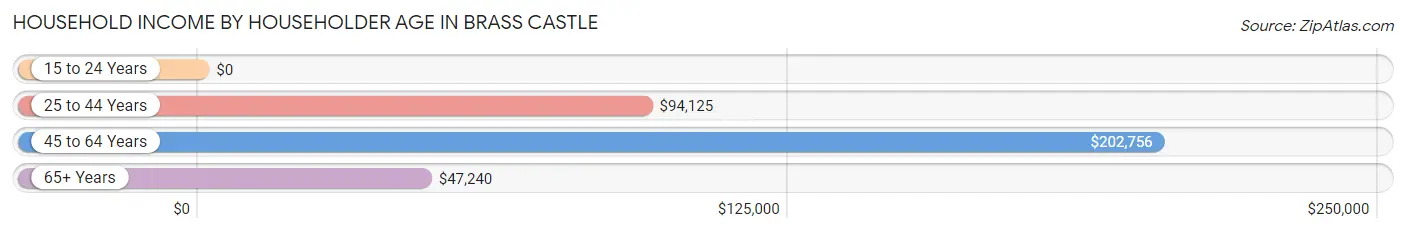
| Income Bracket | # Households | Median Income |
| 15 to 24 Years | 0 (0.0%) | $0 |
| 25 to 44 Years | 78 (13.8%) | $94,125 |
| 45 to 64 Years | 215 (38.1%) | $202,756 |
| 65+ Years | 272 (48.1%) | $47,240 |
| Total | 565 (100.0%) | $92,563 |
Poverty in Brass Castle
Income Below Poverty by Sex and Age in Brass Castle
With 3.4% poverty level for males and 1.9% for females among the residents of Brass Castle, 75 year old and over males and 18 to 24 year old females are the most vulnerable to poverty, with 16 males (33.3%) and 8 females (100.0%) in their respective age groups living below the poverty level.
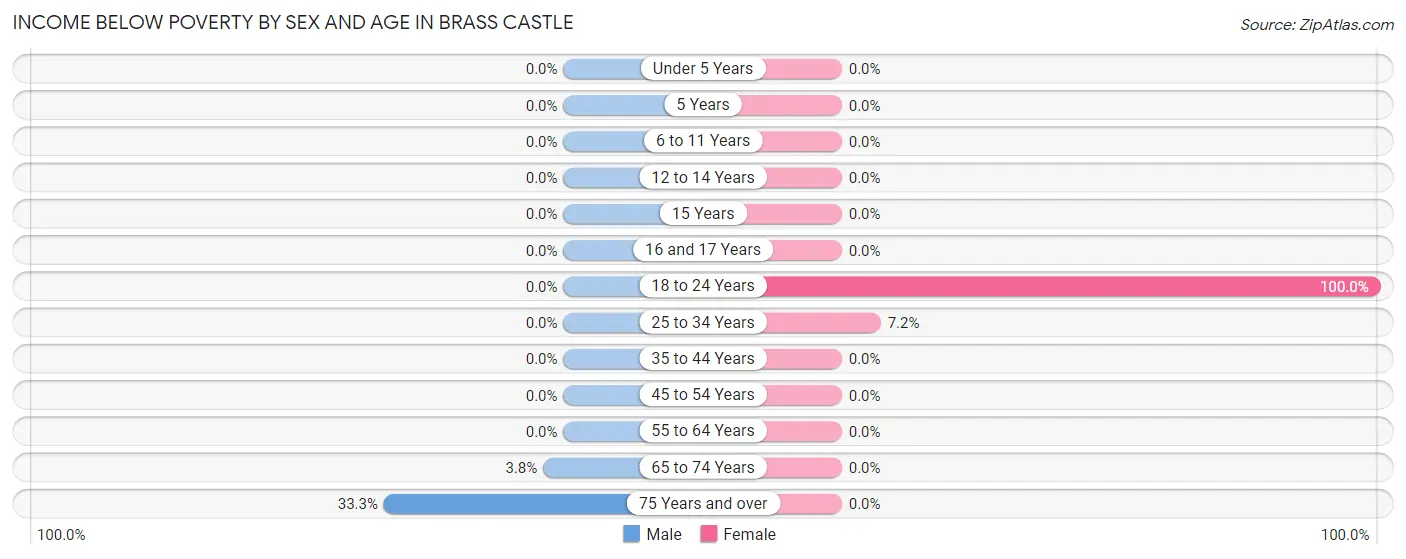
| Age Bracket | Male | Female |
| Under 5 Years | 0 (0.0%) | 0 (0.0%) |
| 5 Years | 0 (0.0%) | 0 (0.0%) |
| 6 to 11 Years | 0 (0.0%) | 0 (0.0%) |
| 12 to 14 Years | 0 (0.0%) | 0 (0.0%) |
| 15 Years | 0 (0.0%) | 0 (0.0%) |
| 16 and 17 Years | 0 (0.0%) | 0 (0.0%) |
| 18 to 24 Years | 0 (0.0%) | 8 (100.0%) |
| 25 to 34 Years | 0 (0.0%) | 7 (7.2%) |
| 35 to 44 Years | 0 (0.0%) | 0 (0.0%) |
| 45 to 54 Years | 0 (0.0%) | 0 (0.0%) |
| 55 to 64 Years | 0 (0.0%) | 0 (0.0%) |
| 65 to 74 Years | 7 (3.8%) | 0 (0.0%) |
| 75 Years and over | 16 (33.3%) | 0 (0.0%) |
| Total | 23 (3.4%) | 15 (1.9%) |
Income Above Poverty by Sex and Age in Brass Castle
According to the poverty statistics in Brass Castle, males aged under 5 years and females aged 6 to 11 years are the age groups that are most secure financially, with 100.0% of males and 100.0% of females in these age groups living above the poverty line.
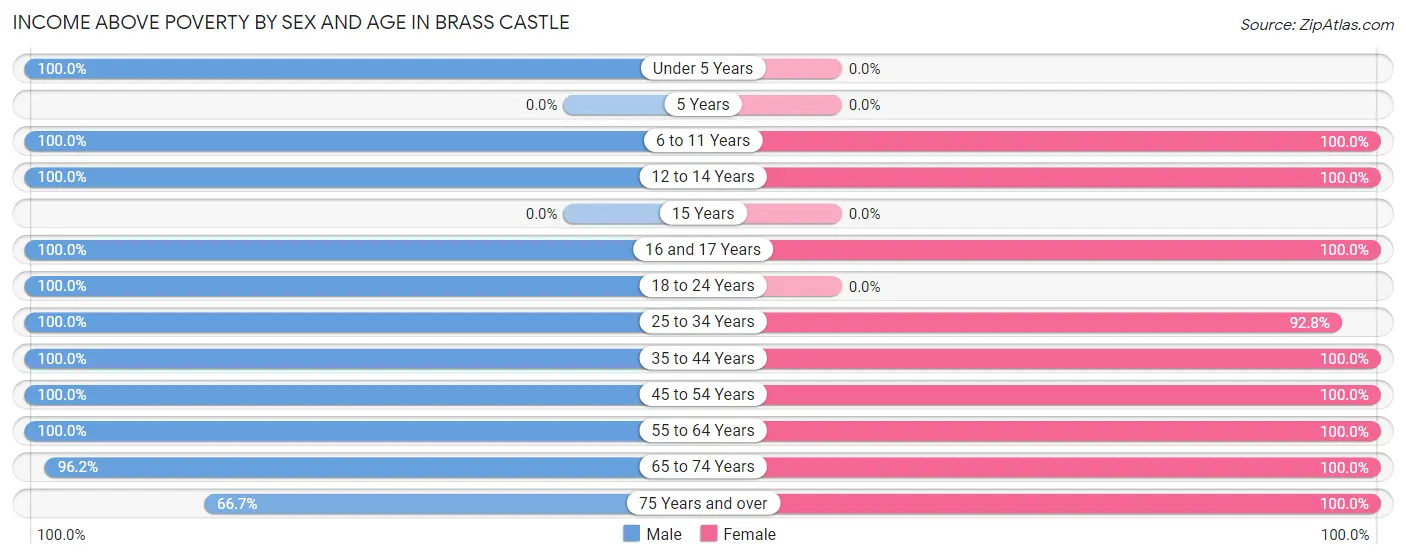
| Age Bracket | Male | Female |
| Under 5 Years | 39 (100.0%) | 0 (0.0%) |
| 5 Years | 0 (0.0%) | 0 (0.0%) |
| 6 to 11 Years | 71 (100.0%) | 57 (100.0%) |
| 12 to 14 Years | 57 (100.0%) | 96 (100.0%) |
| 15 Years | 0 (0.0%) | 0 (0.0%) |
| 16 and 17 Years | 6 (100.0%) | 56 (100.0%) |
| 18 to 24 Years | 12 (100.0%) | 0 (0.0%) |
| 25 to 34 Years | 50 (100.0%) | 90 (92.8%) |
| 35 to 44 Years | 36 (100.0%) | 77 (100.0%) |
| 45 to 54 Years | 124 (100.0%) | 95 (100.0%) |
| 55 to 64 Years | 41 (100.0%) | 164 (100.0%) |
| 65 to 74 Years | 179 (96.2%) | 103 (100.0%) |
| 75 Years and over | 32 (66.7%) | 48 (100.0%) |
| Total | 647 (96.6%) | 786 (98.1%) |
Income Below Poverty Among Married-Couple Families in Brass Castle
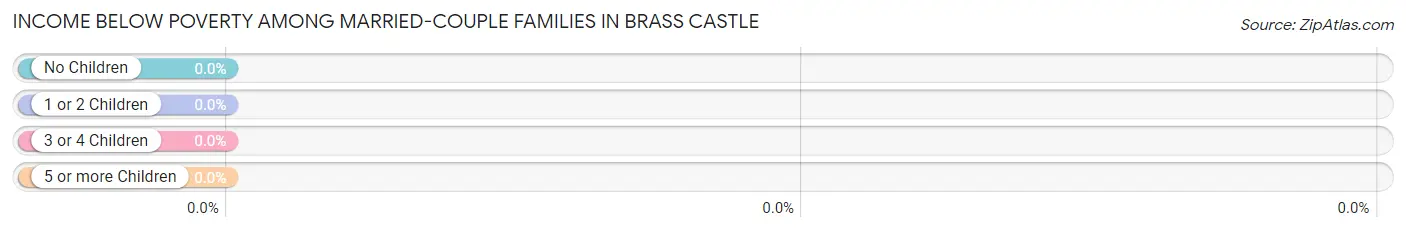
| Children | Above Poverty | Below Poverty |
| No Children | 232 (100.0%) | 0 (0.0%) |
| 1 or 2 Children | 154 (100.0%) | 0 (0.0%) |
| 3 or 4 Children | 10 (100.0%) | 0 (0.0%) |
| 5 or more Children | 0 (0.0%) | 0 (0.0%) |
| Total | 396 (100.0%) | 0 (0.0%) |
Income Below Poverty Among Single-Parent Households in Brass Castle
| Children | Single Father | Single Mother |
| No Children | 0 (0.0%) | 0 (0.0%) |
| 1 or 2 Children | 0 (0.0%) | 0 (0.0%) |
| 3 or 4 Children | 0 (0.0%) | 0 (0.0%) |
| 5 or more Children | 0 (0.0%) | 0 (0.0%) |
| Total | 0 (0.0%) | 0 (0.0%) |
Income Below Poverty Among Married-Couple vs Single-Parent Households in Brass Castle
| Children | Married-Couple Families | Single-Parent Households |
| No Children | 0 (0.0%) | 0 (0.0%) |
| 1 or 2 Children | 0 (0.0%) | 0 (0.0%) |
| 3 or 4 Children | 0 (0.0%) | 0 (0.0%) |
| 5 or more Children | 0 (0.0%) | 0 (0.0%) |
| Total | 0 (0.0%) | 0 (0.0%) |
Race in Brass Castle
The most populous races in Brass Castle are White / Caucasian (1,039 | 70.6%), Black / African American (240 | 16.3%), and Two or more Races (118 | 8.0%).
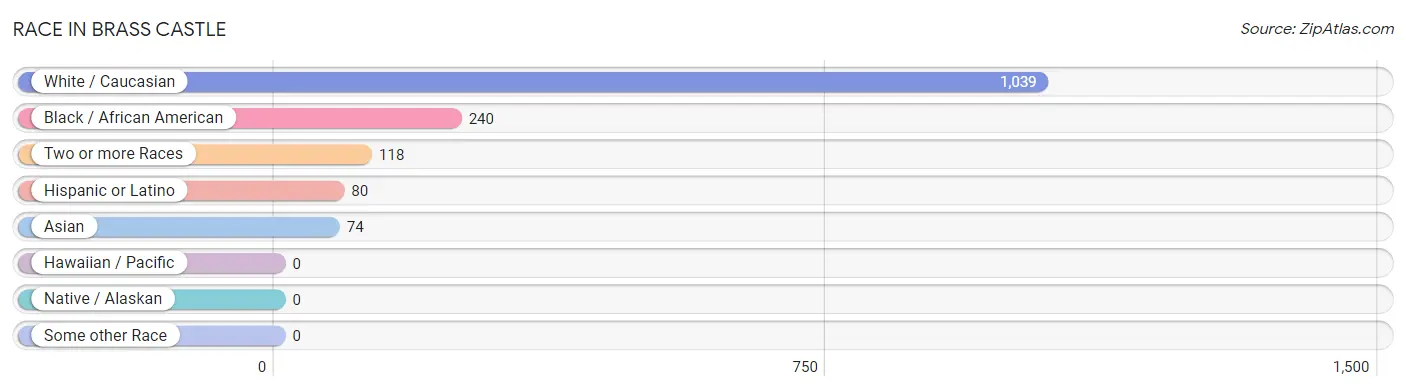
| Race | # Population | % Population |
| Asian | 74 | 5.0% |
| Black / African American | 240 | 16.3% |
| Hawaiian / Pacific | 0 | 0.0% |
| Hispanic or Latino | 80 | 5.4% |
| Native / Alaskan | 0 | 0.0% |
| White / Caucasian | 1,039 | 70.6% |
| Two or more Races | 118 | 8.0% |
| Some other Race | 0 | 0.0% |
| Total | 1,471 | 100.0% |
Ancestry in Brass Castle
The most populous ancestries reported in Brass Castle are German (294 | 20.0%), English (222 | 15.1%), American (220 | 15.0%), Italian (177 | 12.0%), and Dutch (86 | 5.9%), together accounting for 67.9% of all Brass Castle residents.
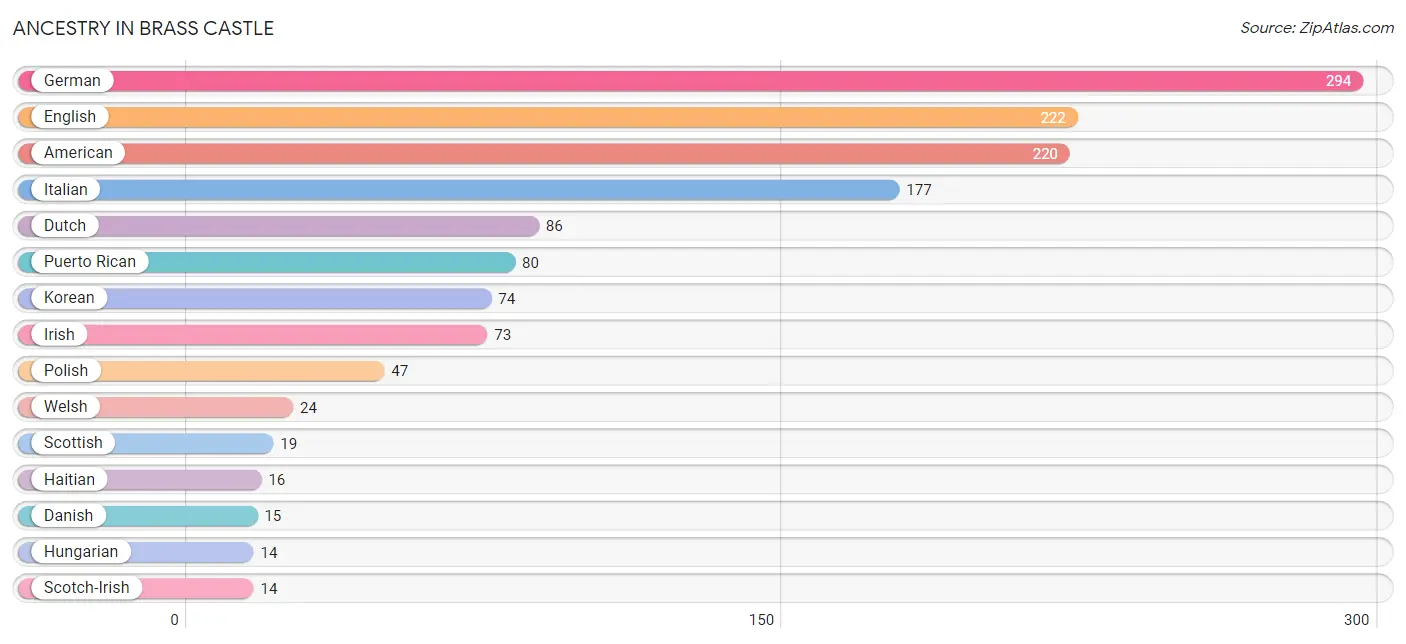
| Ancestry | # Population | % Population |
| American | 220 | 15.0% |
| Danish | 15 | 1.0% |
| Dutch | 86 | 5.9% |
| English | 222 | 15.1% |
| German | 294 | 20.0% |
| Greek | 12 | 0.8% |
| Haitian | 16 | 1.1% |
| Hungarian | 14 | 0.9% |
| Irish | 73 | 5.0% |
| Italian | 177 | 12.0% |
| Korean | 74 | 5.0% |
| Lithuanian | 12 | 0.8% |
| Polish | 47 | 3.2% |
| Portuguese | 11 | 0.7% |
| Puerto Rican | 80 | 5.4% |
| Russian | 9 | 0.6% |
| Scotch-Irish | 14 | 0.9% |
| Scottish | 19 | 1.3% |
| Subsaharan African | 10 | 0.7% |
| Ugandan | 10 | 0.7% |
| Welsh | 24 | 1.6% | View All 21 Rows |
Immigrants in Brass Castle
The most numerous immigrant groups reported in Brass Castle came from Europe (37 | 2.5%), Caribbean (36 | 2.5%), Haiti (36 | 2.5%), Latin America (36 | 2.5%), and Asia (26 | 1.8%), together accounting for 11.6% of all Brass Castle residents.
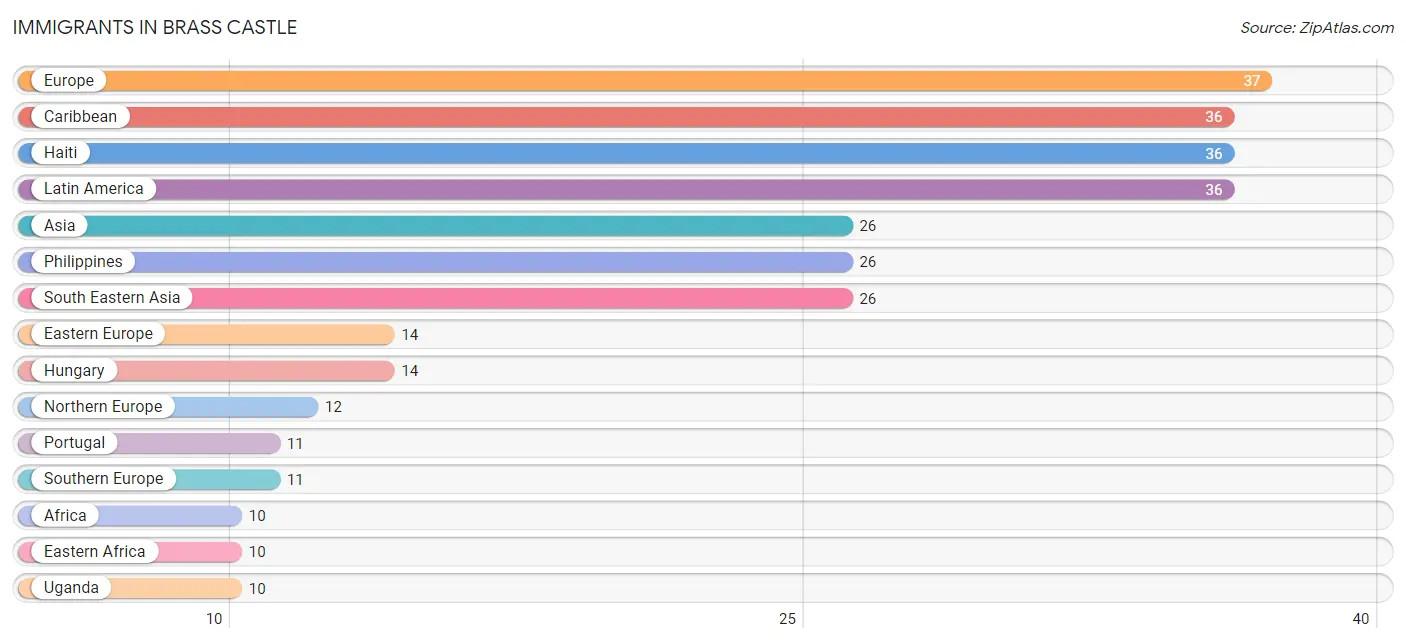
| Immigration Origin | # Population | % Population |
| Africa | 10 | 0.7% |
| Asia | 26 | 1.8% |
| Caribbean | 36 | 2.5% |
| Eastern Africa | 10 | 0.7% |
| Eastern Europe | 14 | 0.9% |
| England | 8 | 0.5% |
| Europe | 37 | 2.5% |
| Haiti | 36 | 2.5% |
| Hungary | 14 | 0.9% |
| Latin America | 36 | 2.5% |
| Northern Europe | 12 | 0.8% |
| Philippines | 26 | 1.8% |
| Portugal | 11 | 0.7% |
| Scotland | 4 | 0.3% |
| South Eastern Asia | 26 | 1.8% |
| Southern Europe | 11 | 0.7% |
| Uganda | 10 | 0.7% | View All 17 Rows |
Sex and Age in Brass Castle
Sex and Age in Brass Castle
The most populous age groups in Brass Castle are 65 to 69 Years (139 | 20.7%) for men and 55 to 59 Years (160 | 20.0%) for women.
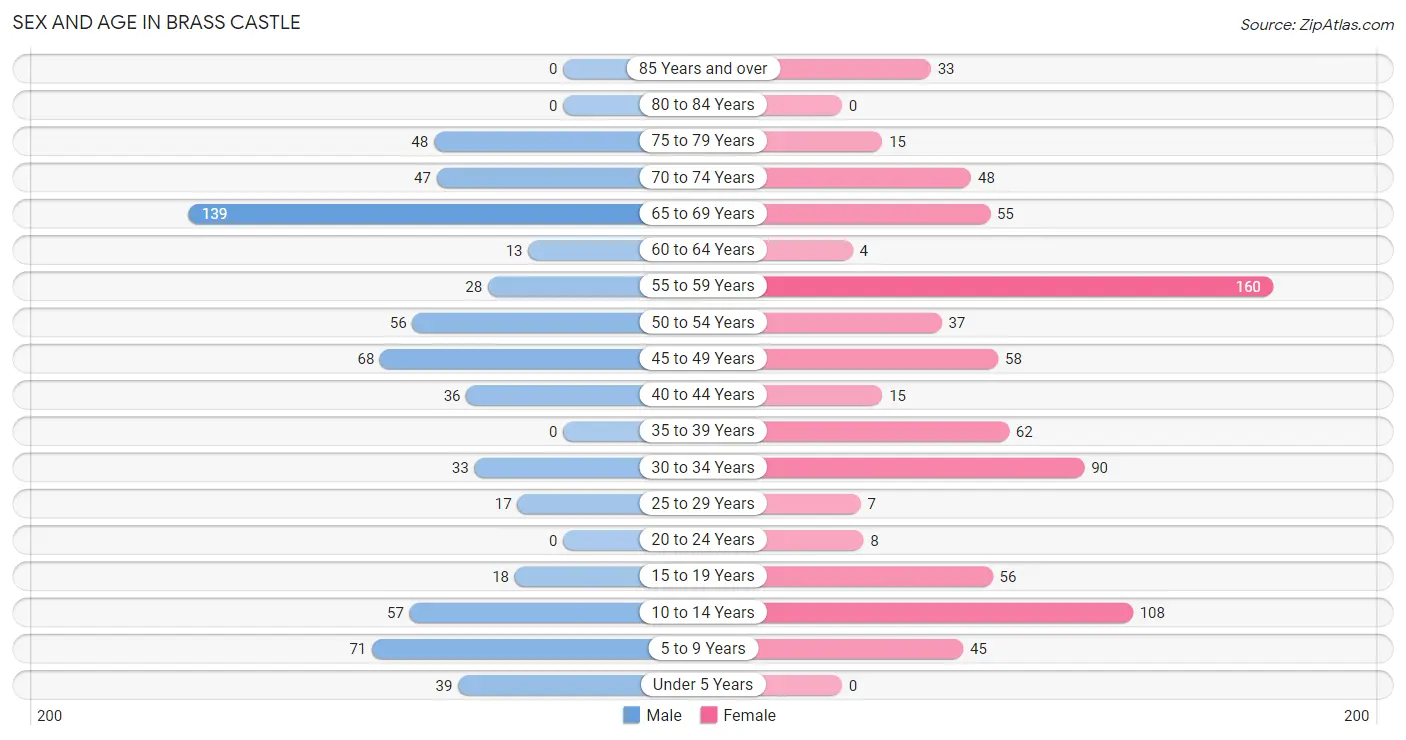
| Age Bracket | Male | Female |
| Under 5 Years | 39 (5.8%) | 0 (0.0%) |
| 5 to 9 Years | 71 (10.6%) | 45 (5.6%) |
| 10 to 14 Years | 57 (8.5%) | 108 (13.5%) |
| 15 to 19 Years | 18 (2.7%) | 56 (7.0%) |
| 20 to 24 Years | 0 (0.0%) | 8 (1.0%) |
| 25 to 29 Years | 17 (2.5%) | 7 (0.9%) |
| 30 to 34 Years | 33 (4.9%) | 90 (11.2%) |
| 35 to 39 Years | 0 (0.0%) | 62 (7.7%) |
| 40 to 44 Years | 36 (5.4%) | 15 (1.9%) |
| 45 to 49 Years | 68 (10.2%) | 58 (7.2%) |
| 50 to 54 Years | 56 (8.4%) | 37 (4.6%) |
| 55 to 59 Years | 28 (4.2%) | 160 (20.0%) |
| 60 to 64 Years | 13 (1.9%) | 4 (0.5%) |
| 65 to 69 Years | 139 (20.7%) | 55 (6.9%) |
| 70 to 74 Years | 47 (7.0%) | 48 (6.0%) |
| 75 to 79 Years | 48 (7.2%) | 15 (1.9%) |
| 80 to 84 Years | 0 (0.0%) | 0 (0.0%) |
| 85 Years and over | 0 (0.0%) | 33 (4.1%) |
| Total | 670 (100.0%) | 801 (100.0%) |
Families and Households in Brass Castle
Median Family Size in Brass Castle
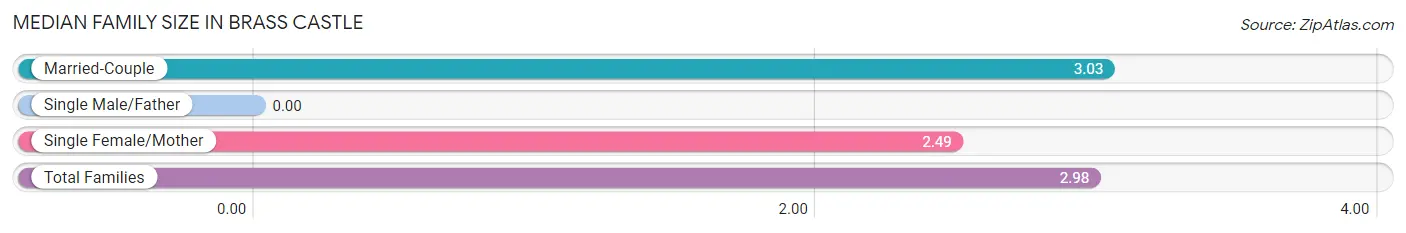
| Family Type | # Families | Family Size |
| Married-Couple | 396 (91.0%) | 3.03 |
| Single Male/Father | 0 (0.0%) | - |
| Single Female/Mother | 39 (9.0%) | 2.49 |
| Total Families | 435 (100.0%) | 2.98 |
Median Household Size in Brass Castle
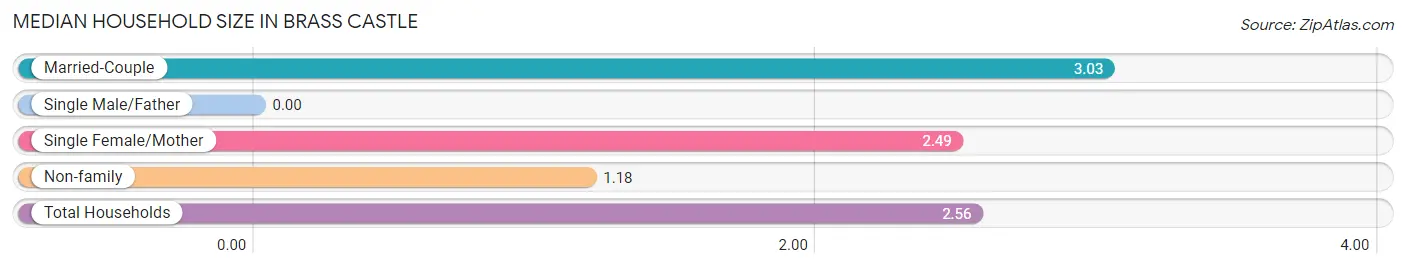
| Household Type | # Households | Household Size |
| Married-Couple | 396 (70.1%) | 3.03 |
| Single Male/Father | 0 (0.0%) | - |
| Single Female/Mother | 39 (6.9%) | 2.49 |
| Non-family | 130 (23.0%) | 1.18 |
| Total Households | 565 (100.0%) | 2.56 |
Household Size by Marriage Status in Brass Castle
Out of a total of 565 households in Brass Castle, 435 (77.0%) are family households, while 130 (23.0%) are nonfamily households. The most numerous type of family households are 2-person households, comprising 235, and the most common type of nonfamily households are 1-person households, comprising 102.
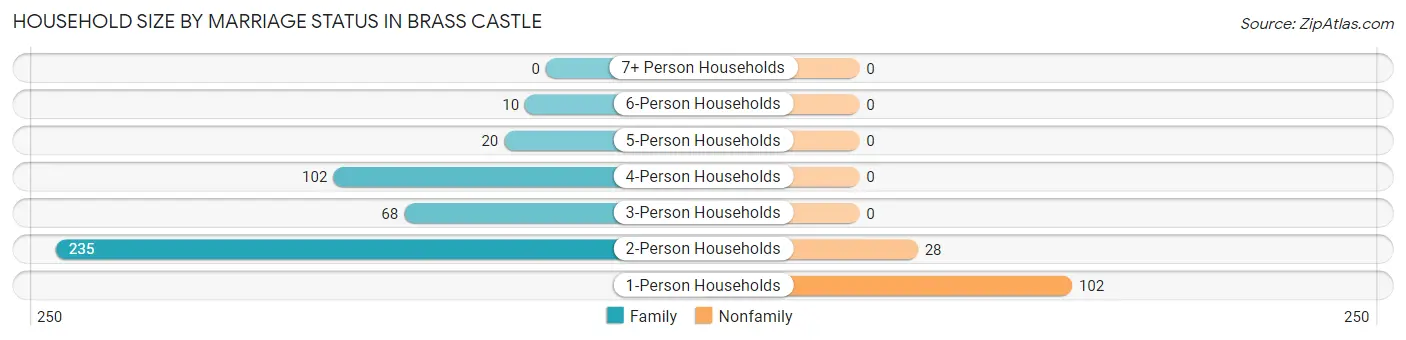
| Household Size | Family Households | Nonfamily Households |
| 1-Person Households | - | 102 (18.0%) |
| 2-Person Households | 235 (41.6%) | 28 (5.0%) |
| 3-Person Households | 68 (12.0%) | 0 (0.0%) |
| 4-Person Households | 102 (18.0%) | 0 (0.0%) |
| 5-Person Households | 20 (3.5%) | 0 (0.0%) |
| 6-Person Households | 10 (1.8%) | 0 (0.0%) |
| 7+ Person Households | 0 (0.0%) | 0 (0.0%) |
| Total | 435 (77.0%) | 130 (23.0%) |
Female Fertility in Brass Castle
Fertility by Age in Brass Castle
| Age Bracket | Women with Births | Births / 1,000 Women |
| 15 to 19 years | 0 (0.0%) | 0.0 |
| 20 to 34 years | 0 (0.0%) | 0.0 |
| 35 to 50 years | 0 (0.0%) | 0.0 |
| Total | 0 (0.0%) | 0.0 |
Fertility by Age by Marriage Status in Brass Castle
| Age Bracket | Married | Unmarried |
| 15 to 19 years | 0 (0.0%) | 0 (0.0%) |
| 20 to 34 years | 0 (0.0%) | 0 (0.0%) |
| 35 to 50 years | 0 (0.0%) | 0 (0.0%) |
| Total | 0 (0.0%) | 0 (0.0%) |
Fertility by Education in Brass Castle
| Educational Attainment | Women with Births | Births / 1,000 Women |
| Less than High School | 0 (0.0%) | 0.0 |
| High School Diploma | 0 (0.0%) | 0.0 |
| College or Associate's Degree | 0 (0.0%) | 0.0 |
| Bachelor's Degree | 0 (0.0%) | 0.0 |
| Graduate Degree | 0 (0.0%) | 0.0 |
| Total | 0 (0.0%) | 0.0 |
Fertility by Education by Marriage Status in Brass Castle
| Educational Attainment | Married | Unmarried |
| Less than High School | 0 (0.0%) | 0 (0.0%) |
| High School Diploma | 0 (0.0%) | 0 (0.0%) |
| College or Associate's Degree | 0 (0.0%) | 0 (0.0%) |
| Bachelor's Degree | 0 (0.0%) | 0 (0.0%) |
| Graduate Degree | 0 (0.0%) | 0 (0.0%) |
| Total | 0 (0.0%) | 0 (0.0%) |
Employment Characteristics in Brass Castle
Employment by Class of Employer in Brass Castle
Among the 621 employed individuals in Brass Castle, private company employees (471 | 75.8%), self-employed (not incorporated) (81 | 13.0%), and local government employees (41 | 6.6%) make up the most common classes of employment.
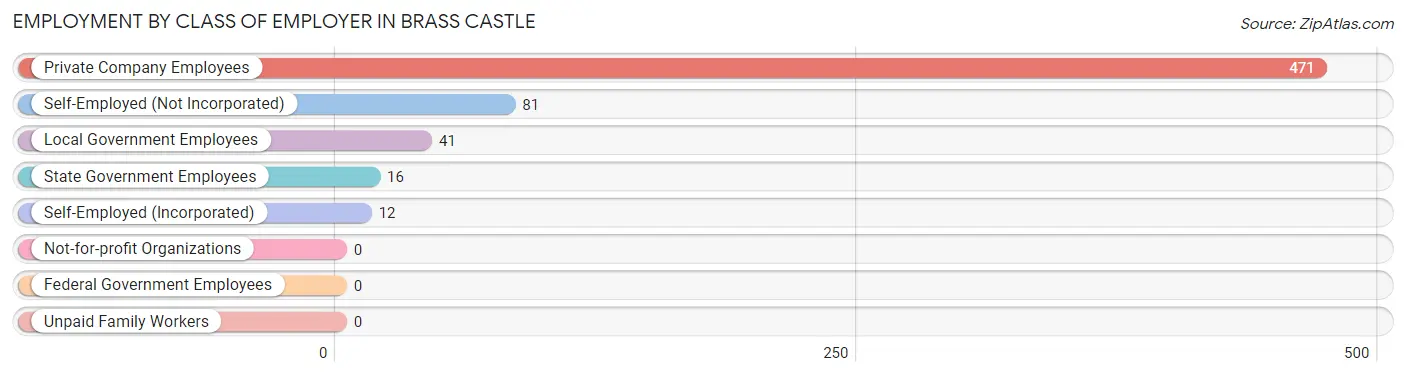
| Employer Class | # Employees | % Employees |
| Private Company Employees | 471 | 75.8% |
| Self-Employed (Incorporated) | 12 | 1.9% |
| Self-Employed (Not Incorporated) | 81 | 13.0% |
| Not-for-profit Organizations | 0 | 0.0% |
| Local Government Employees | 41 | 6.6% |
| State Government Employees | 16 | 2.6% |
| Federal Government Employees | 0 | 0.0% |
| Unpaid Family Workers | 0 | 0.0% |
| Total | 621 | 100.0% |
Employment Status by Age in Brass Castle
According to the labor force statistics for Brass Castle, out of the total population over 16 years of age (1,151), 61.0% or 702 individuals are in the labor force, with 11.5% or 81 of them unemployed. The age group with the highest labor force participation rate is 30 to 34 years, with 100.0% or 123 individuals in the labor force. Within the labor force, the 75 years and over age range has the highest percentage of unemployed individuals, with 61.5% or 16 of them being unemployed.
| Age Bracket | In Labor Force | Unemployed |
| 16 to 19 Years | 0 (0.0%) | 0 (0.0%) |
| 20 to 24 Years | 0 (0.0%) | 0 (0.0%) |
| 25 to 29 Years | 17 (70.8%) | 0 (0.0%) |
| 30 to 34 Years | 123 (100.0%) | 0 (0.0%) |
| 35 to 44 Years | 97 (85.8%) | 53 (54.6%) |
| 45 to 54 Years | 219 (100.0%) | 0 (0.0%) |
| 55 to 59 Years | 188 (100.0%) | 12 (6.4%) |
| 60 to 64 Years | 13 (76.5%) | 0 (0.0%) |
| 65 to 74 Years | 19 (6.6%) | 0 (0.0%) |
| 75 Years and over | 26 (27.1%) | 16 (61.5%) |
| Total | 702 (61.0%) | 81 (11.5%) |
Employment Status by Educational Attainment in Brass Castle
According to labor force statistics for Brass Castle, 96.1% of individuals (657) out of the total population between 25 and 64 years of age (684) are in the labor force, with 9.9% or 65 of them being unemployed. The group with the highest labor force participation rate are those with the educational attainment of bachelor's degree or higher, with 100.0% or 242 individuals in the labor force. Within the labor force, individuals with bachelor's degree or higher education have the highest percentage of unemployment, with 21.9% or 53 of them being unemployed.
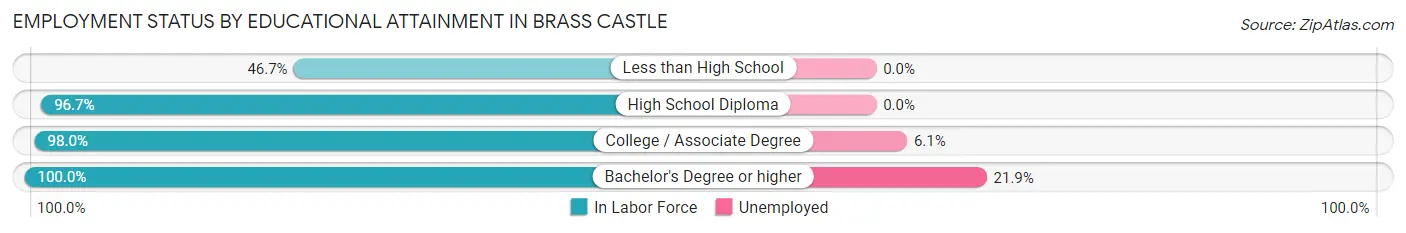
| Educational Attainment | In Labor Force | Unemployed |
| Less than High School | 14 (46.7%) | 0 (0.0%) |
| High School Diploma | 205 (96.7%) | 0 (0.0%) |
| College / Associate Degree | 196 (98.0%) | 12 (6.1%) |
| Bachelor's Degree or higher | 242 (100.0%) | 53 (21.9%) |
| Total | 657 (96.1%) | 68 (9.9%) |
Employment Occupations by Sex in Brass Castle
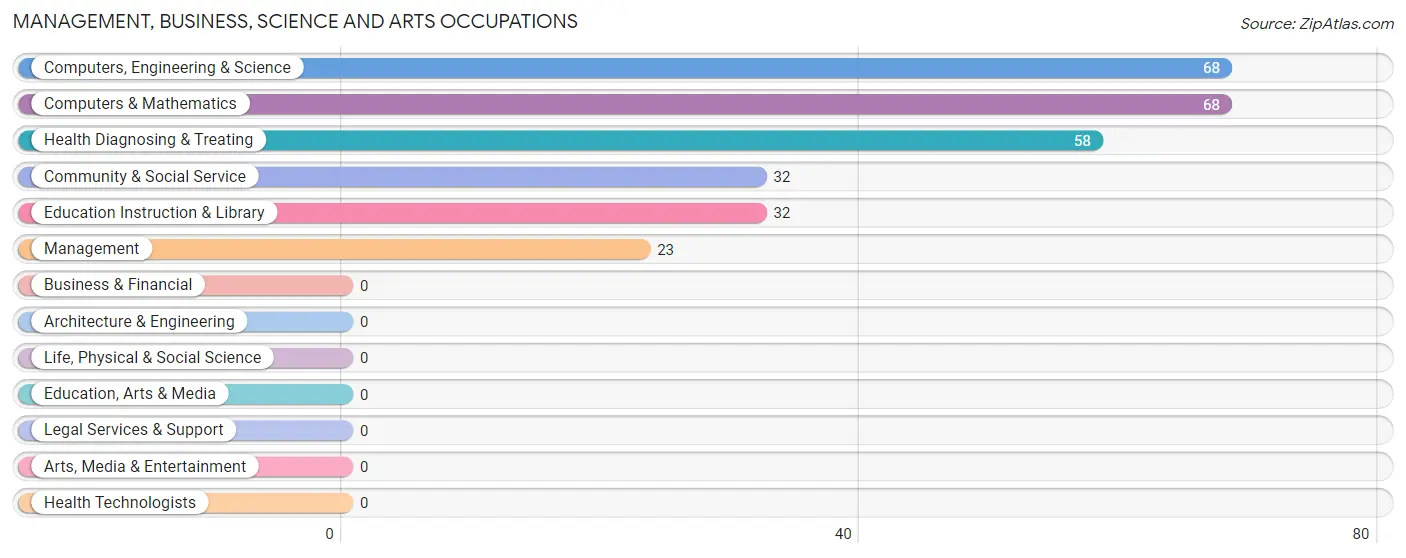
Management, Business, Science and Arts Occupations
The most common Management, Business, Science and Arts occupations in Brass Castle are Computers, Engineering & Science (68 | 11.0%), Computers & Mathematics (68 | 11.0%), Health Diagnosing & Treating (58 | 9.3%), Community & Social Service (32 | 5.1%), and Education Instruction & Library (32 | 5.1%).
Management, Business, Science and Arts Occupations by Sex
Within the Management, Business, Science and Arts occupations in Brass Castle, the most male-oriented occupations are Computers, Engineering & Science (100.0%), and Computers & Mathematics (100.0%), while the most female-oriented occupations are Management (100.0%), Community & Social Service (100.0%), and Education Instruction & Library (100.0%).
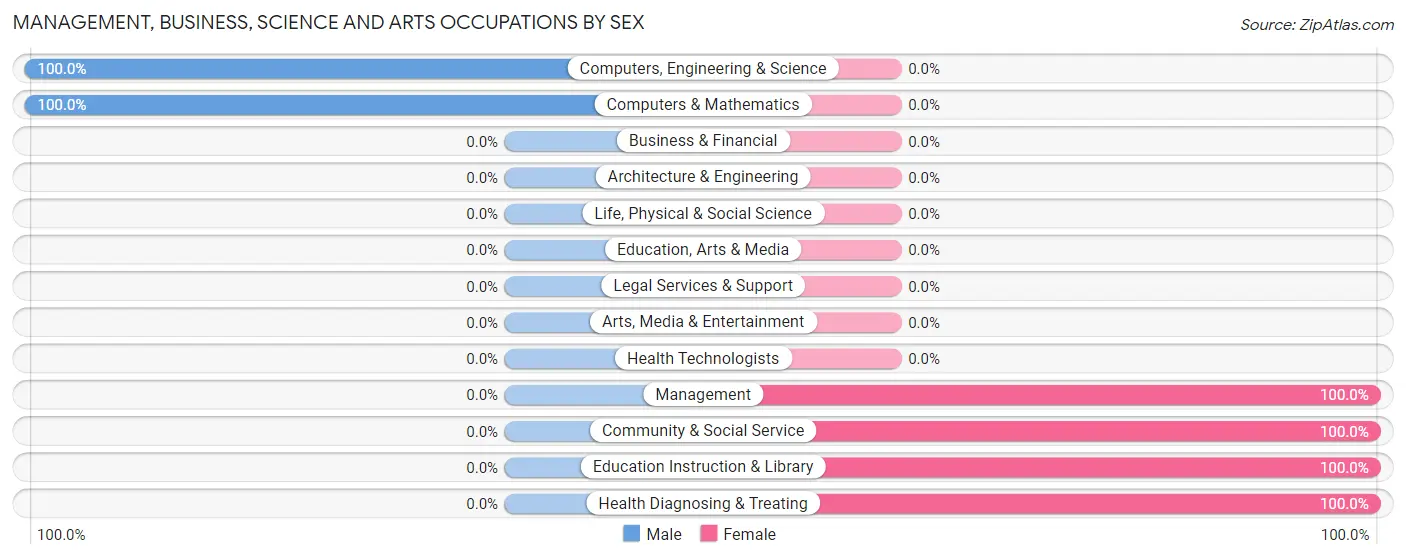
| Occupation | Male | Female |
| Management | 0 (0.0%) | 23 (100.0%) |
| Business & Financial | 0 (0.0%) | 0 (0.0%) |
| Computers, Engineering & Science | 68 (100.0%) | 0 (0.0%) |
| Computers & Mathematics | 68 (100.0%) | 0 (0.0%) |
| Architecture & Engineering | 0 (0.0%) | 0 (0.0%) |
| Life, Physical & Social Science | 0 (0.0%) | 0 (0.0%) |
| Community & Social Service | 0 (0.0%) | 32 (100.0%) |
| Education, Arts & Media | 0 (0.0%) | 0 (0.0%) |
| Legal Services & Support | 0 (0.0%) | 0 (0.0%) |
| Education Instruction & Library | 0 (0.0%) | 32 (100.0%) |
| Arts, Media & Entertainment | 0 (0.0%) | 0 (0.0%) |
| Health Diagnosing & Treating | 0 (0.0%) | 58 (100.0%) |
| Health Technologists | 0 (0.0%) | 0 (0.0%) |
| Total (Category) | 68 (37.6%) | 113 (62.4%) |
| Total (Overall) | 242 (39.0%) | 379 (61.0%) |
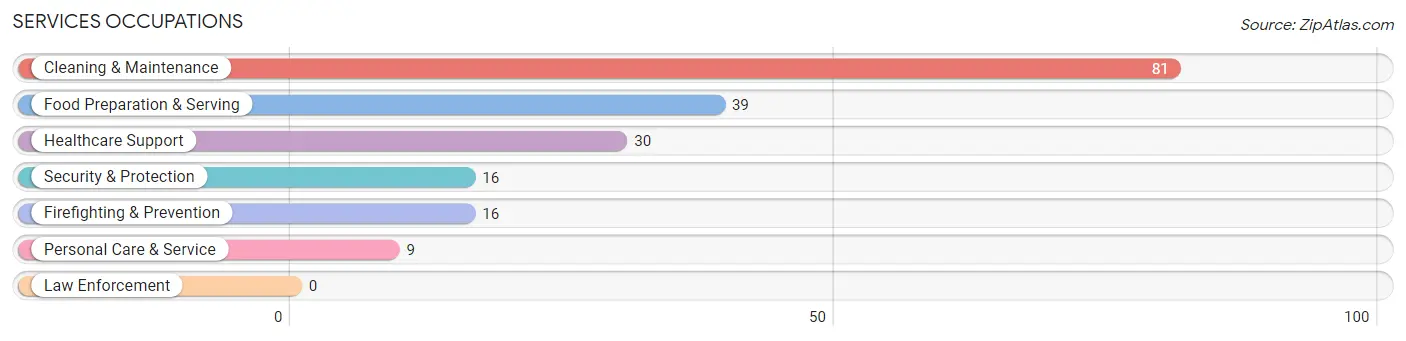
Services Occupations
The most common Services occupations in Brass Castle are Cleaning & Maintenance (81 | 13.0%), Food Preparation & Serving (39 | 6.3%), Healthcare Support (30 | 4.8%), Security & Protection (16 | 2.6%), and Firefighting & Prevention (16 | 2.6%).
Services Occupations by Sex
Within the Services occupations in Brass Castle, the most male-oriented occupations are Security & Protection (100.0%), and Firefighting & Prevention (100.0%), while the most female-oriented occupations are Healthcare Support (100.0%), Food Preparation & Serving (100.0%), and Cleaning & Maintenance (100.0%).
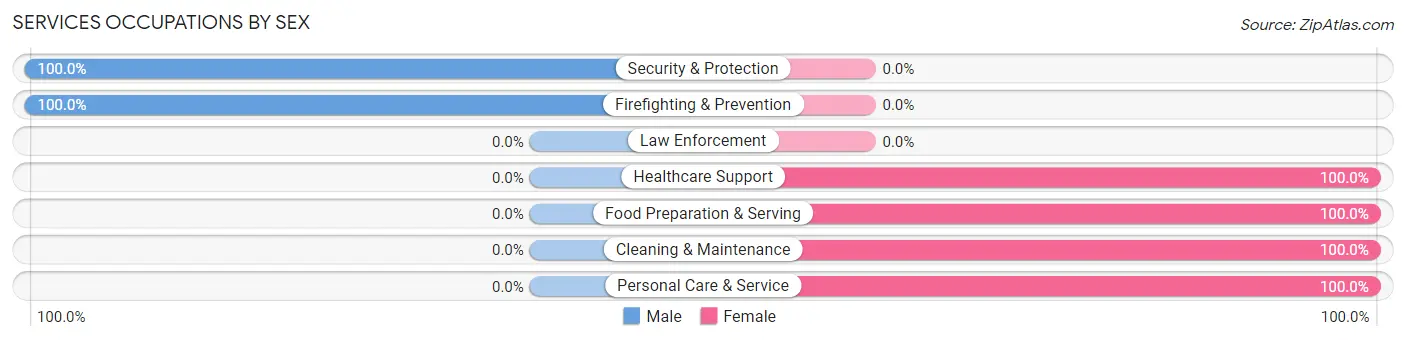
| Occupation | Male | Female |
| Healthcare Support | 0 (0.0%) | 30 (100.0%) |
| Security & Protection | 16 (100.0%) | 0 (0.0%) |
| Firefighting & Prevention | 16 (100.0%) | 0 (0.0%) |
| Law Enforcement | 0 (0.0%) | 0 (0.0%) |
| Food Preparation & Serving | 0 (0.0%) | 39 (100.0%) |
| Cleaning & Maintenance | 0 (0.0%) | 81 (100.0%) |
| Personal Care & Service | 0 (0.0%) | 9 (100.0%) |
| Total (Category) | 16 (9.1%) | 159 (90.9%) |
| Total (Overall) | 242 (39.0%) | 379 (61.0%) |
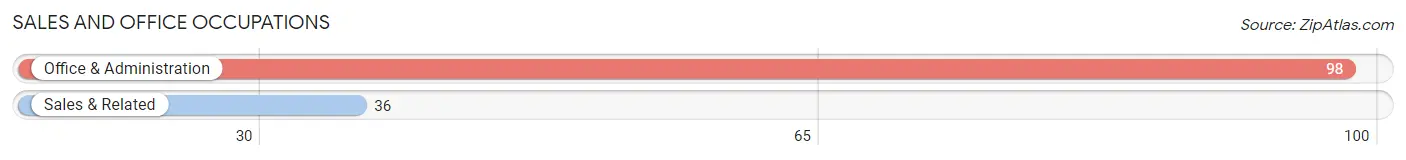
Sales and Office Occupations
The most common Sales and Office occupations in Brass Castle are Office & Administration (98 | 15.8%), and Sales & Related (36 | 5.8%).
Sales and Office Occupations by Sex
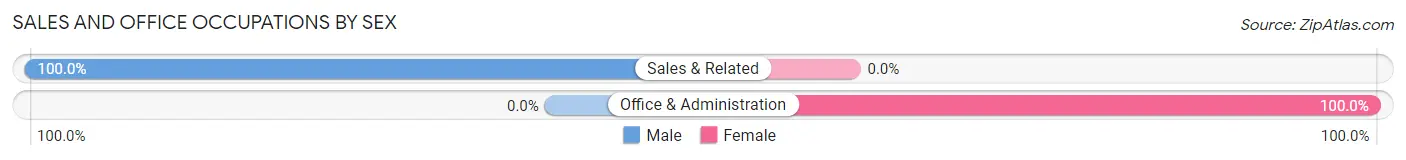
| Occupation | Male | Female |
| Sales & Related | 36 (100.0%) | 0 (0.0%) |
| Office & Administration | 0 (0.0%) | 98 (100.0%) |
| Total (Category) | 36 (26.9%) | 98 (73.1%) |
| Total (Overall) | 242 (39.0%) | 379 (61.0%) |
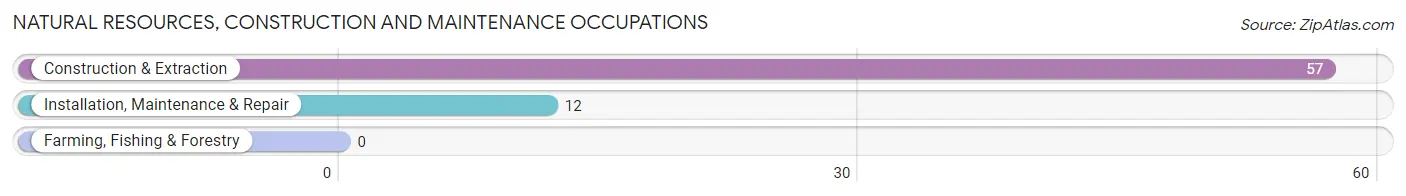
Natural Resources, Construction and Maintenance Occupations
The most common Natural Resources, Construction and Maintenance occupations in Brass Castle are Construction & Extraction (57 | 9.2%), and Installation, Maintenance & Repair (12 | 1.9%).
Natural Resources, Construction and Maintenance Occupations by Sex
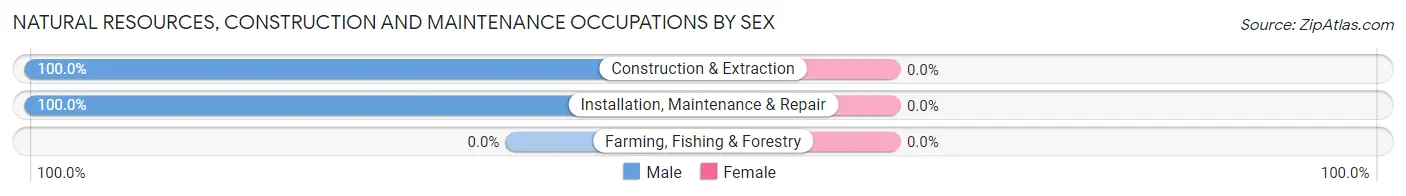
| Occupation | Male | Female |
| Farming, Fishing & Forestry | 0 (0.0%) | 0 (0.0%) |
| Construction & Extraction | 57 (100.0%) | 0 (0.0%) |
| Installation, Maintenance & Repair | 12 (100.0%) | 0 (0.0%) |
| Total (Category) | 69 (100.0%) | 0 (0.0%) |
| Total (Overall) | 242 (39.0%) | 379 (61.0%) |
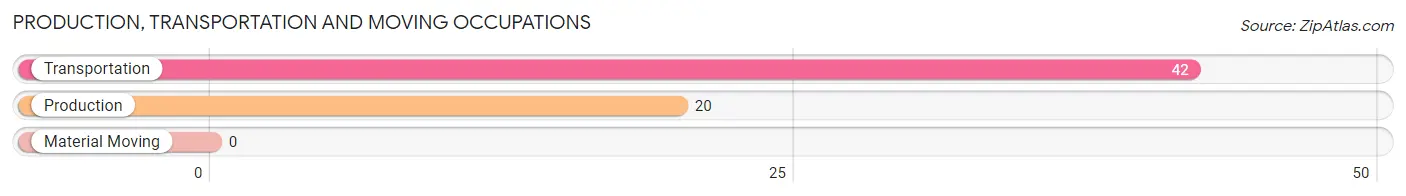
Production, Transportation and Moving Occupations
The most common Production, Transportation and Moving occupations in Brass Castle are Transportation (42 | 6.8%), and Production (20 | 3.2%).
Production, Transportation and Moving Occupations by Sex
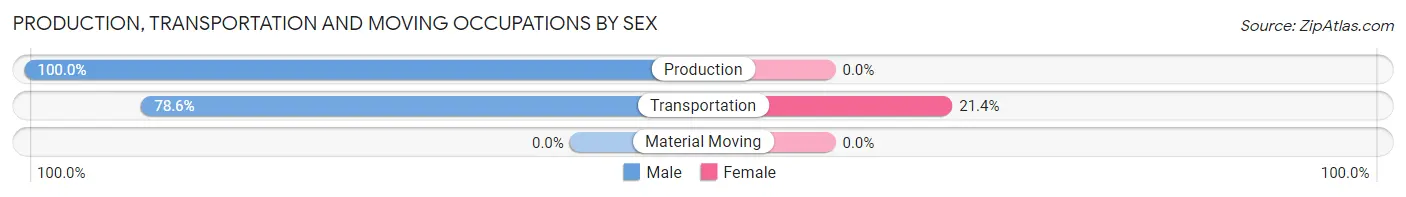
| Occupation | Male | Female |
| Production | 20 (100.0%) | 0 (0.0%) |
| Transportation | 33 (78.6%) | 9 (21.4%) |
| Material Moving | 0 (0.0%) | 0 (0.0%) |
| Total (Category) | 53 (85.5%) | 9 (14.5%) |
| Total (Overall) | 242 (39.0%) | 379 (61.0%) |
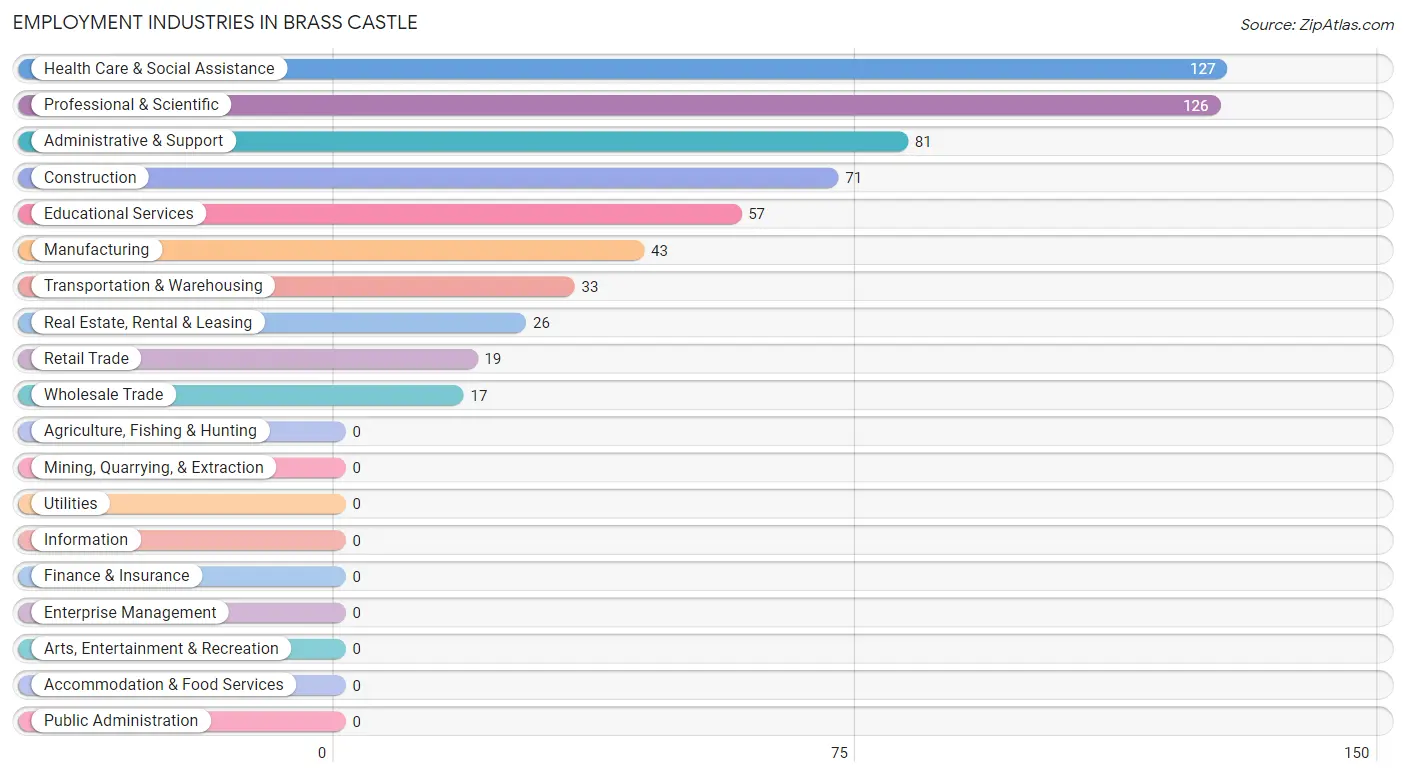
Employment Industries by Sex in Brass Castle
Employment Industries in Brass Castle
The major employment industries in Brass Castle include Health Care & Social Assistance (127 | 20.4%), Professional & Scientific (126 | 20.3%), Administrative & Support (81 | 13.0%), Construction (71 | 11.4%), and Educational Services (57 | 9.2%).
Employment Industries by Sex in Brass Castle
The Brass Castle industries that see more men than women are Wholesale Trade (100.0%), Retail Trade (100.0%), and Transportation & Warehousing (100.0%), whereas the industries that tend to have a higher number of women are Real Estate, Rental & Leasing (100.0%), Administrative & Support (100.0%), and Health Care & Social Assistance (100.0%).
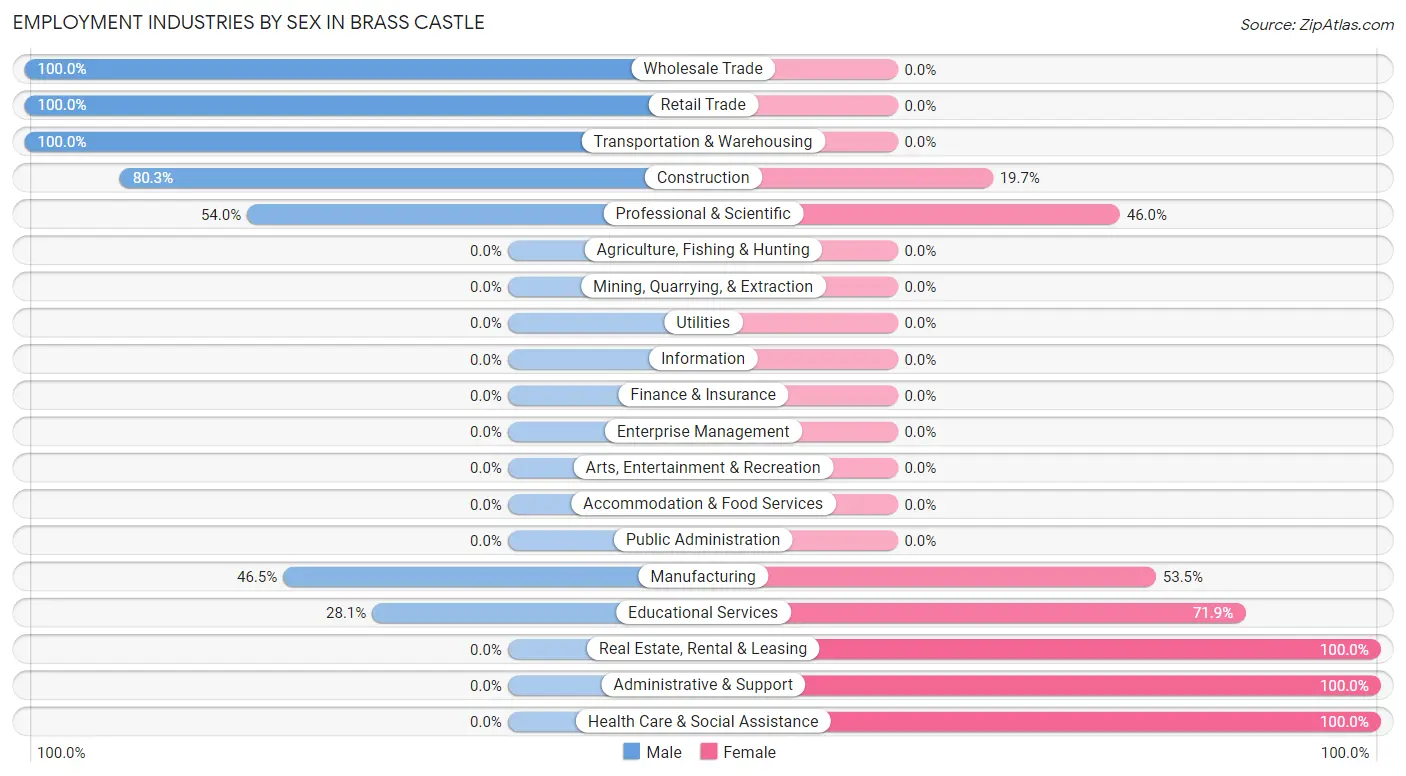
| Industry | Male | Female |
| Agriculture, Fishing & Hunting | 0 (0.0%) | 0 (0.0%) |
| Mining, Quarrying, & Extraction | 0 (0.0%) | 0 (0.0%) |
| Construction | 57 (80.3%) | 14 (19.7%) |
| Manufacturing | 20 (46.5%) | 23 (53.5%) |
| Wholesale Trade | 17 (100.0%) | 0 (0.0%) |
| Retail Trade | 19 (100.0%) | 0 (0.0%) |
| Transportation & Warehousing | 33 (100.0%) | 0 (0.0%) |
| Utilities | 0 (0.0%) | 0 (0.0%) |
| Information | 0 (0.0%) | 0 (0.0%) |
| Finance & Insurance | 0 (0.0%) | 0 (0.0%) |
| Real Estate, Rental & Leasing | 0 (0.0%) | 26 (100.0%) |
| Professional & Scientific | 68 (54.0%) | 58 (46.0%) |
| Enterprise Management | 0 (0.0%) | 0 (0.0%) |
| Administrative & Support | 0 (0.0%) | 81 (100.0%) |
| Educational Services | 16 (28.1%) | 41 (71.9%) |
| Health Care & Social Assistance | 0 (0.0%) | 127 (100.0%) |
| Arts, Entertainment & Recreation | 0 (0.0%) | 0 (0.0%) |
| Accommodation & Food Services | 0 (0.0%) | 0 (0.0%) |
| Public Administration | 0 (0.0%) | 0 (0.0%) |
| Total | 242 (39.0%) | 379 (61.0%) |
Education in Brass Castle
School Enrollment in Brass Castle
The most common levels of schooling among the 356 students in Brass Castle are graduate / professional (126 | 35.4%), high school (86 | 24.2%), and middle school (81 | 22.8%).
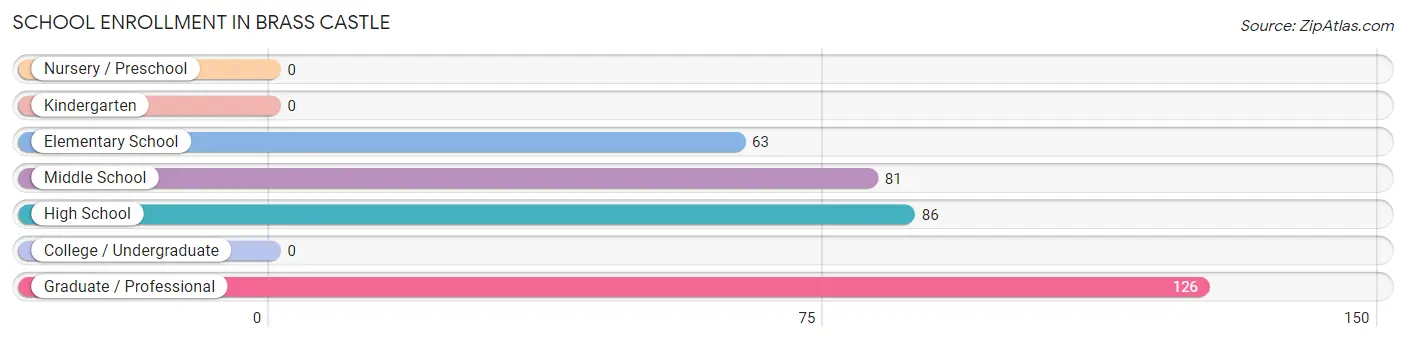
| School Level | # Students | % Students |
| Nursery / Preschool | 0 | 0.0% |
| Kindergarten | 0 | 0.0% |
| Elementary School | 63 | 17.7% |
| Middle School | 81 | 22.8% |
| High School | 86 | 24.2% |
| College / Undergraduate | 0 | 0.0% |
| Graduate / Professional | 126 | 35.4% |
| Total | 356 | 100.0% |
School Enrollment by Age by Funding Source in Brass Castle
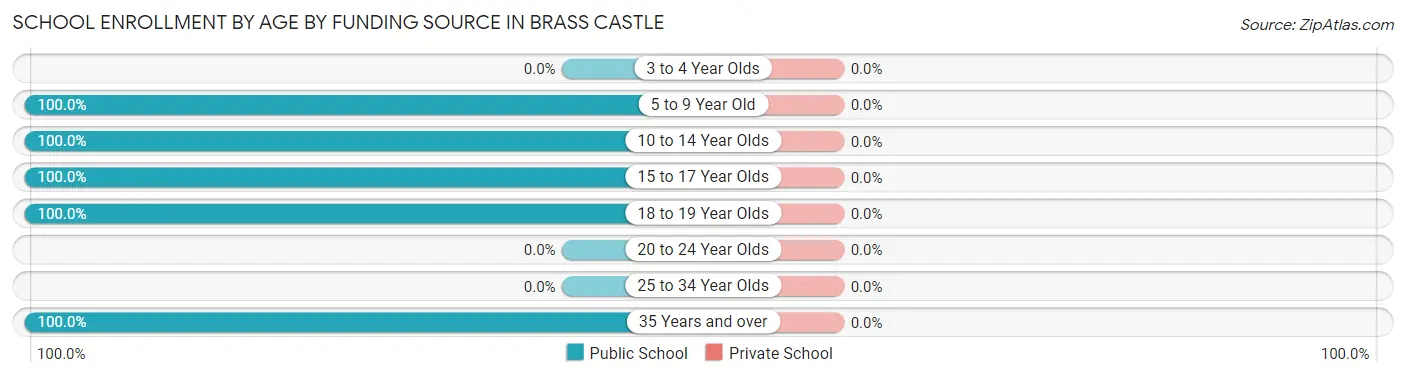
| Age Bracket | Public School | Private School |
| 3 to 4 Year Olds | 0 (0.0%) | 0 (0.0%) |
| 5 to 9 Year Old | 63 (100.0%) | 0 (0.0%) |
| 10 to 14 Year Olds | 93 (100.0%) | 0 (0.0%) |
| 15 to 17 Year Olds | 62 (100.0%) | 0 (0.0%) |
| 18 to 19 Year Olds | 12 (100.0%) | 0 (0.0%) |
| 20 to 24 Year Olds | 0 (0.0%) | 0 (0.0%) |
| 25 to 34 Year Olds | 0 (0.0%) | 0 (0.0%) |
| 35 Years and over | 126 (100.0%) | 0 (0.0%) |
| Total | 356 (100.0%) | 0 (0.0%) |
Educational Attainment by Field of Study in Brass Castle
Education (143 | 29.7%), computers & mathematics (86 | 17.8%), liberal arts & history (72 | 14.9%), psychology (58 | 12.0%), and business (53 | 11.0%) are the most common fields of study among 482 individuals in Brass Castle who have obtained a bachelor's degree or higher.
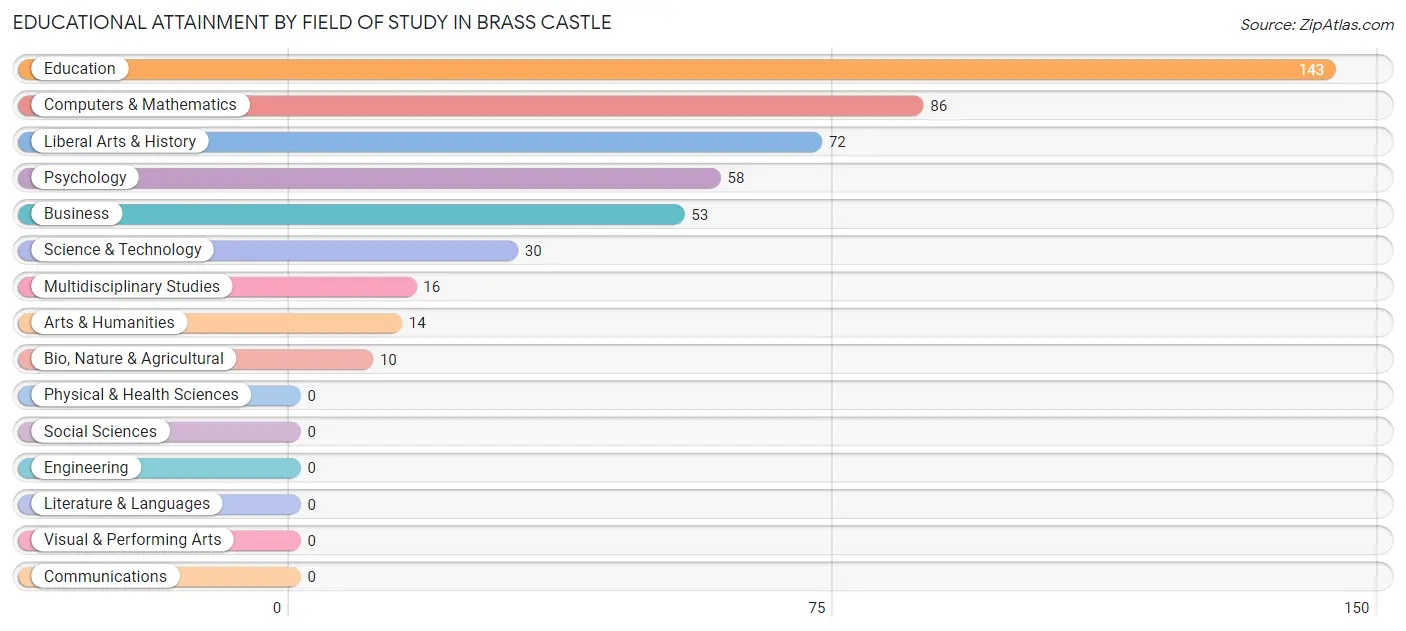
| Field of Study | # Graduates | % Graduates |
| Computers & Mathematics | 86 | 17.8% |
| Bio, Nature & Agricultural | 10 | 2.1% |
| Physical & Health Sciences | 0 | 0.0% |
| Psychology | 58 | 12.0% |
| Social Sciences | 0 | 0.0% |
| Engineering | 0 | 0.0% |
| Multidisciplinary Studies | 16 | 3.3% |
| Science & Technology | 30 | 6.2% |
| Business | 53 | 11.0% |
| Education | 143 | 29.7% |
| Literature & Languages | 0 | 0.0% |
| Liberal Arts & History | 72 | 14.9% |
| Visual & Performing Arts | 0 | 0.0% |
| Communications | 0 | 0.0% |
| Arts & Humanities | 14 | 2.9% |
| Total | 482 | 100.0% |
Transportation & Commute in Brass Castle
Vehicle Availability by Sex in Brass Castle
The most prevalent vehicle ownership categories in Brass Castle are males with 2 vehicles (139, accounting for 57.4%) and females with 2 vehicles (276, making up 36.7%).
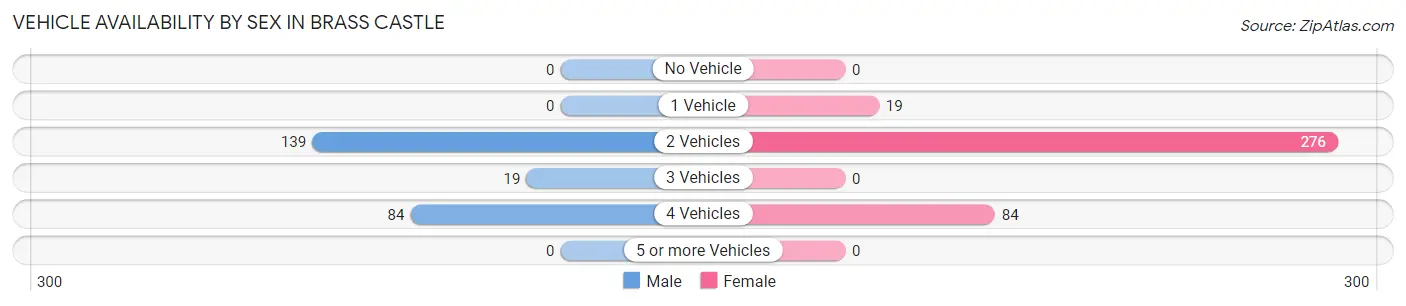
| Vehicles Available | Male | Female |
| No Vehicle | 0 (0.0%) | 0 (0.0%) |
| 1 Vehicle | 0 (0.0%) | 19 (5.0%) |
| 2 Vehicles | 139 (57.4%) | 276 (72.8%) |
| 3 Vehicles | 19 (7.9%) | 0 (0.0%) |
| 4 Vehicles | 84 (34.7%) | 84 (22.2%) |
| 5 or more Vehicles | 0 (0.0%) | 0 (0.0%) |
| Total | 242 (100.0%) | 379 (100.0%) |
Commute Time in Brass Castle
The most frequently occuring commute durations in Brass Castle are 60 to 89 minutes (148 commuters, 24.2%), 30 to 34 minutes (139 commuters, 22.8%), and 35 to 39 minutes (129 commuters, 21.1%).
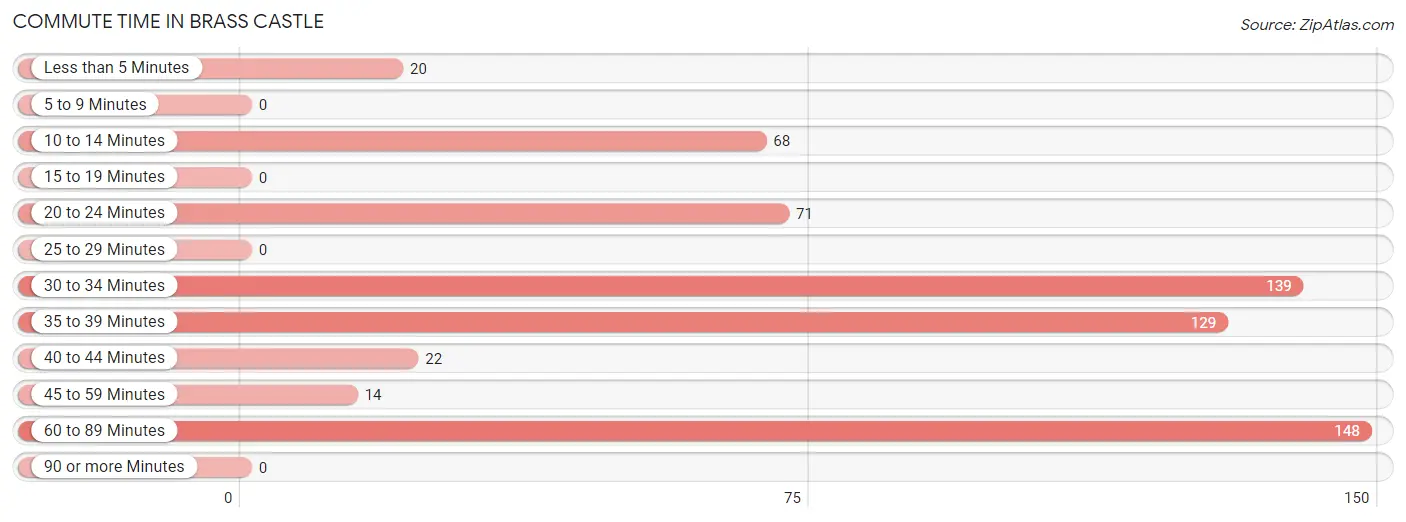
| Commute Time | # Commuters | % Commuters |
| Less than 5 Minutes | 20 | 3.3% |
| 5 to 9 Minutes | 0 | 0.0% |
| 10 to 14 Minutes | 68 | 11.1% |
| 15 to 19 Minutes | 0 | 0.0% |
| 20 to 24 Minutes | 71 | 11.6% |
| 25 to 29 Minutes | 0 | 0.0% |
| 30 to 34 Minutes | 139 | 22.8% |
| 35 to 39 Minutes | 129 | 21.1% |
| 40 to 44 Minutes | 22 | 3.6% |
| 45 to 59 Minutes | 14 | 2.3% |
| 60 to 89 Minutes | 148 | 24.2% |
| 90 or more Minutes | 0 | 0.0% |
Commute Time by Sex in Brass Castle
The most common commute times in Brass Castle are 60 to 89 minutes (148 commuters, 61.2%) for males and 35 to 39 minutes (116 commuters, 31.4%) for females.
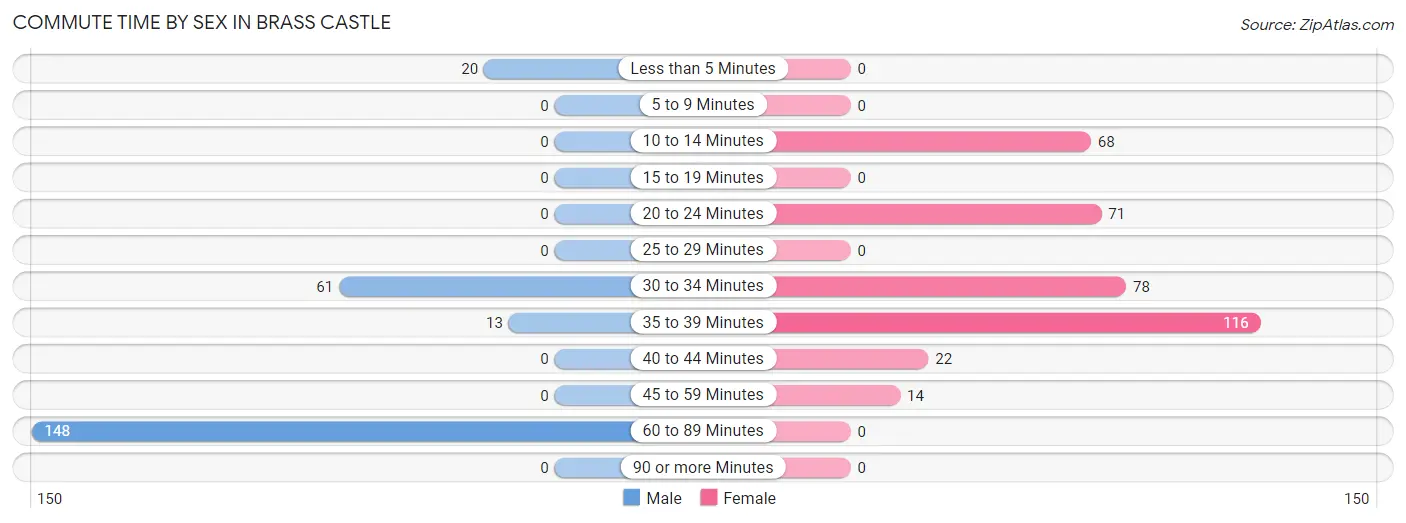
| Commute Time | Male | Female |
| Less than 5 Minutes | 20 (8.3%) | 0 (0.0%) |
| 5 to 9 Minutes | 0 (0.0%) | 0 (0.0%) |
| 10 to 14 Minutes | 0 (0.0%) | 68 (18.4%) |
| 15 to 19 Minutes | 0 (0.0%) | 0 (0.0%) |
| 20 to 24 Minutes | 0 (0.0%) | 71 (19.2%) |
| 25 to 29 Minutes | 0 (0.0%) | 0 (0.0%) |
| 30 to 34 Minutes | 61 (25.2%) | 78 (21.1%) |
| 35 to 39 Minutes | 13 (5.4%) | 116 (31.4%) |
| 40 to 44 Minutes | 0 (0.0%) | 22 (6.0%) |
| 45 to 59 Minutes | 0 (0.0%) | 14 (3.8%) |
| 60 to 89 Minutes | 148 (61.2%) | 0 (0.0%) |
| 90 or more Minutes | 0 (0.0%) | 0 (0.0%) |
Time of Departure to Work by Sex in Brass Castle
The most frequent times of departure to work in Brass Castle are 12:00 AM to 4:59 AM (77, 31.8%) for males and 7:00 AM to 7:29 AM (148, 40.1%) for females.
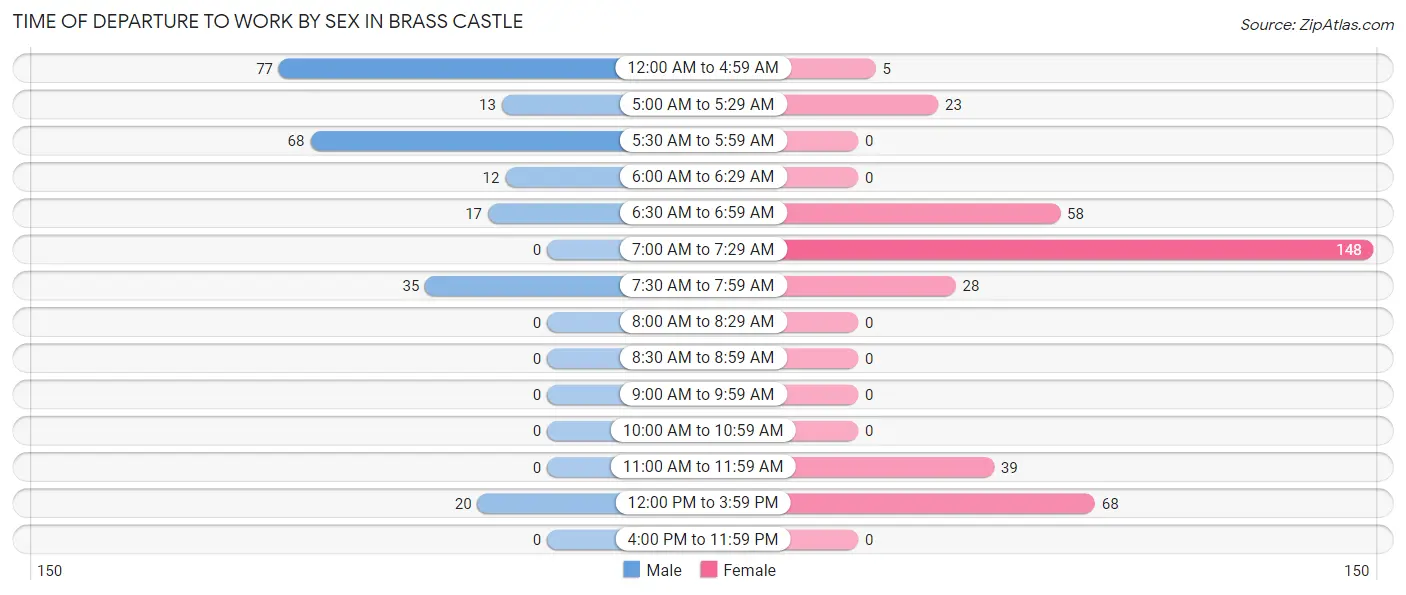
| Time of Departure | Male | Female |
| 12:00 AM to 4:59 AM | 77 (31.8%) | 5 (1.4%) |
| 5:00 AM to 5:29 AM | 13 (5.4%) | 23 (6.2%) |
| 5:30 AM to 5:59 AM | 68 (28.1%) | 0 (0.0%) |
| 6:00 AM to 6:29 AM | 12 (5.0%) | 0 (0.0%) |
| 6:30 AM to 6:59 AM | 17 (7.0%) | 58 (15.7%) |
| 7:00 AM to 7:29 AM | 0 (0.0%) | 148 (40.1%) |
| 7:30 AM to 7:59 AM | 35 (14.5%) | 28 (7.6%) |
| 8:00 AM to 8:29 AM | 0 (0.0%) | 0 (0.0%) |
| 8:30 AM to 8:59 AM | 0 (0.0%) | 0 (0.0%) |
| 9:00 AM to 9:59 AM | 0 (0.0%) | 0 (0.0%) |
| 10:00 AM to 10:59 AM | 0 (0.0%) | 0 (0.0%) |
| 11:00 AM to 11:59 AM | 0 (0.0%) | 39 (10.6%) |
| 12:00 PM to 3:59 PM | 20 (8.3%) | 68 (18.4%) |
| 4:00 PM to 11:59 PM | 0 (0.0%) | 0 (0.0%) |
| Total | 242 (100.0%) | 369 (100.0%) |
Housing Occupancy in Brass Castle
Occupancy by Ownership in Brass Castle
Of the total 565 dwellings in Brass Castle, owner-occupied units account for 526 (93.1%), while renter-occupied units make up 39 (6.9%).
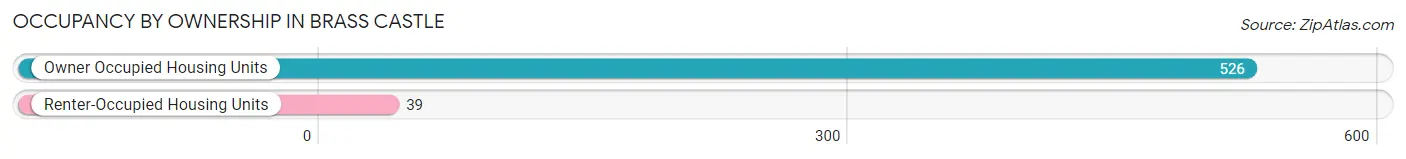
| Occupancy | # Housing Units | % Housing Units |
| Owner Occupied Housing Units | 526 | 93.1% |
| Renter-Occupied Housing Units | 39 | 6.9% |
| Total Occupied Housing Units | 565 | 100.0% |
Occupancy by Household Size in Brass Castle
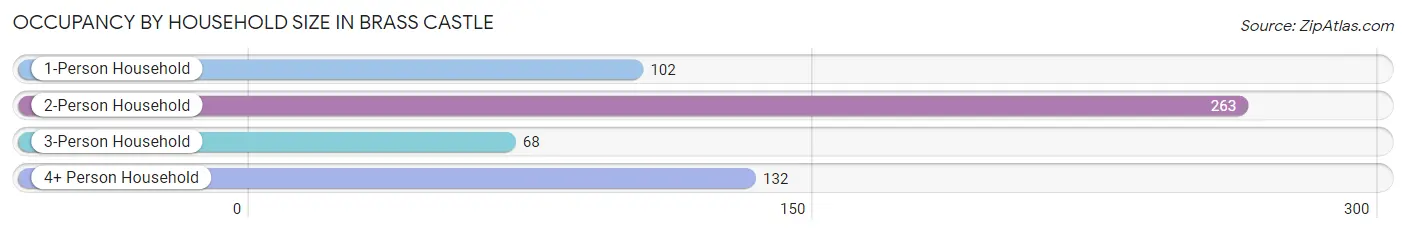
| Household Size | # Housing Units | % Housing Units |
| 1-Person Household | 102 | 18.0% |
| 2-Person Household | 263 | 46.6% |
| 3-Person Household | 68 | 12.0% |
| 4+ Person Household | 132 | 23.4% |
| Total Housing Units | 565 | 100.0% |
Occupancy by Ownership by Household Size in Brass Castle
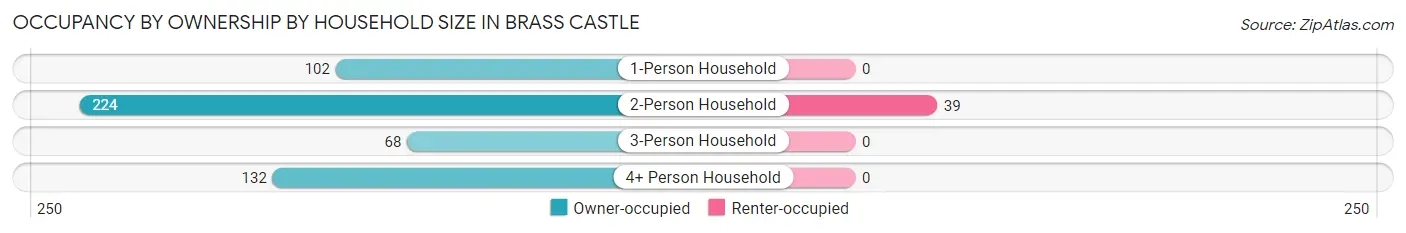
| Household Size | Owner-occupied | Renter-occupied |
| 1-Person Household | 102 (100.0%) | 0 (0.0%) |
| 2-Person Household | 224 (85.2%) | 39 (14.8%) |
| 3-Person Household | 68 (100.0%) | 0 (0.0%) |
| 4+ Person Household | 132 (100.0%) | 0 (0.0%) |
| Total Housing Units | 526 (93.1%) | 39 (6.9%) |
Occupancy by Educational Attainment in Brass Castle
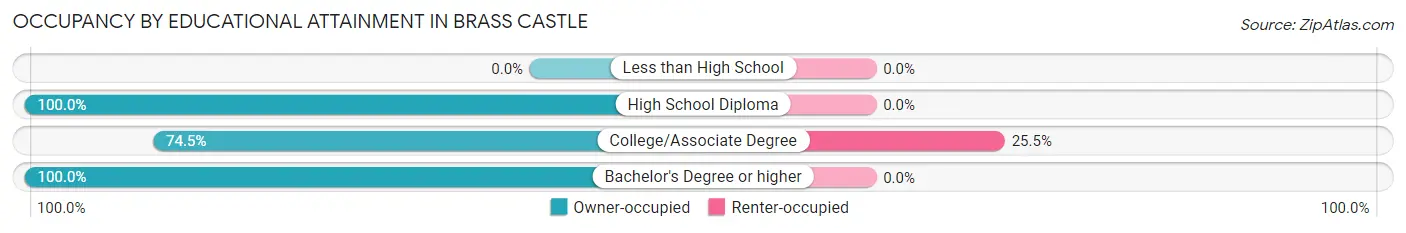
| Household Size | Owner-occupied | Renter-occupied |
| Less than High School | 0 (0.0%) | 0 (0.0%) |
| High School Diploma | 213 (100.0%) | 0 (0.0%) |
| College/Associate Degree | 114 (74.5%) | 39 (25.5%) |
| Bachelor's Degree or higher | 199 (100.0%) | 0 (0.0%) |
Occupancy by Age of Householder in Brass Castle
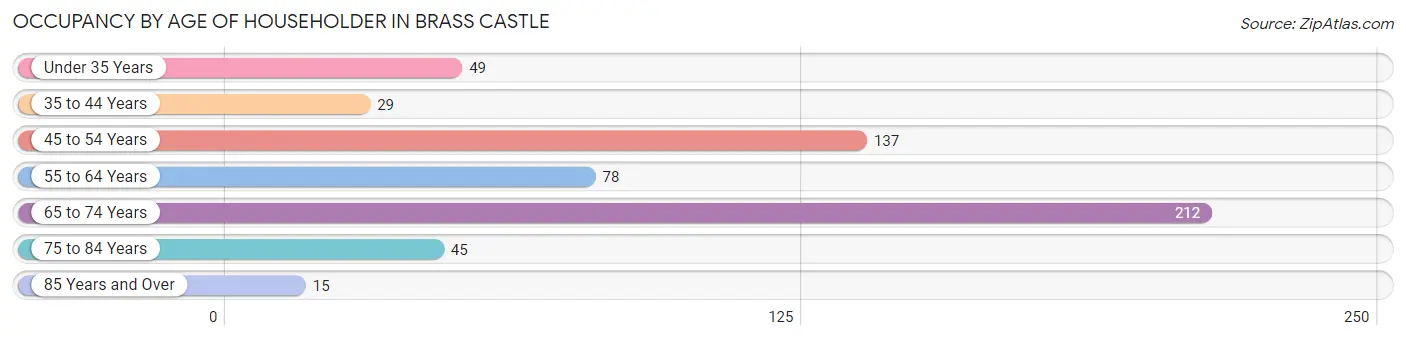
| Age Bracket | # Households | % Households |
| Under 35 Years | 49 | 8.7% |
| 35 to 44 Years | 29 | 5.1% |
| 45 to 54 Years | 137 | 24.2% |
| 55 to 64 Years | 78 | 13.8% |
| 65 to 74 Years | 212 | 37.5% |
| 75 to 84 Years | 45 | 8.0% |
| 85 Years and Over | 15 | 2.6% |
| Total | 565 | 100.0% |
Housing Finances in Brass Castle
Median Income by Occupancy in Brass Castle
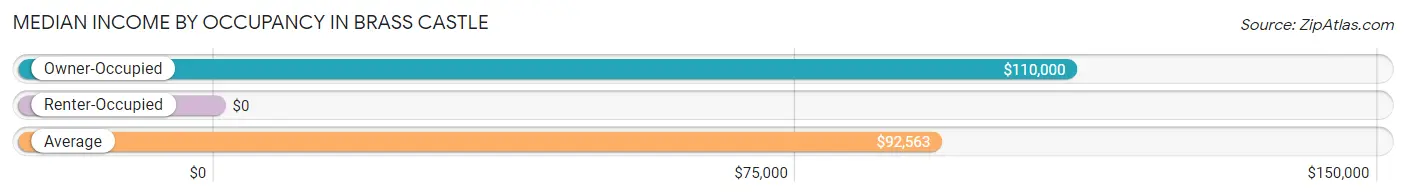
| Occupancy Type | # Households | Median Income |
| Owner-Occupied | 526 (93.1%) | $110,000 |
| Renter-Occupied | 39 (6.9%) | $0 |
| Average | 565 (100.0%) | $92,563 |
Occupancy by Householder Income Bracket in Brass Castle
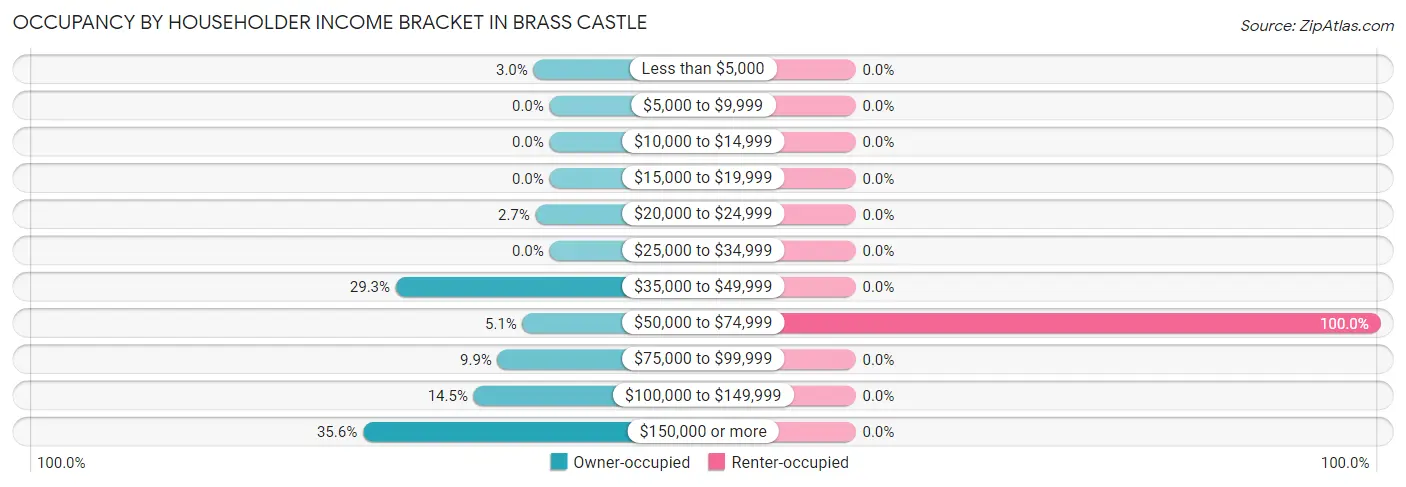
| Income Bracket | Owner-occupied | Renter-occupied |
| Less than $5,000 | 16 (3.0%) | 0 (0.0%) |
| $5,000 to $9,999 | 0 (0.0%) | 0 (0.0%) |
| $10,000 to $14,999 | 0 (0.0%) | 0 (0.0%) |
| $15,000 to $19,999 | 0 (0.0%) | 0 (0.0%) |
| $20,000 to $24,999 | 14 (2.7%) | 0 (0.0%) |
| $25,000 to $34,999 | 0 (0.0%) | 0 (0.0%) |
| $35,000 to $49,999 | 154 (29.3%) | 0 (0.0%) |
| $50,000 to $74,999 | 27 (5.1%) | 39 (100.0%) |
| $75,000 to $99,999 | 52 (9.9%) | 0 (0.0%) |
| $100,000 to $149,999 | 76 (14.4%) | 0 (0.0%) |
| $150,000 or more | 187 (35.5%) | 0 (0.0%) |
| Total | 526 (100.0%) | 39 (100.0%) |
Monthly Housing Cost Tiers in Brass Castle
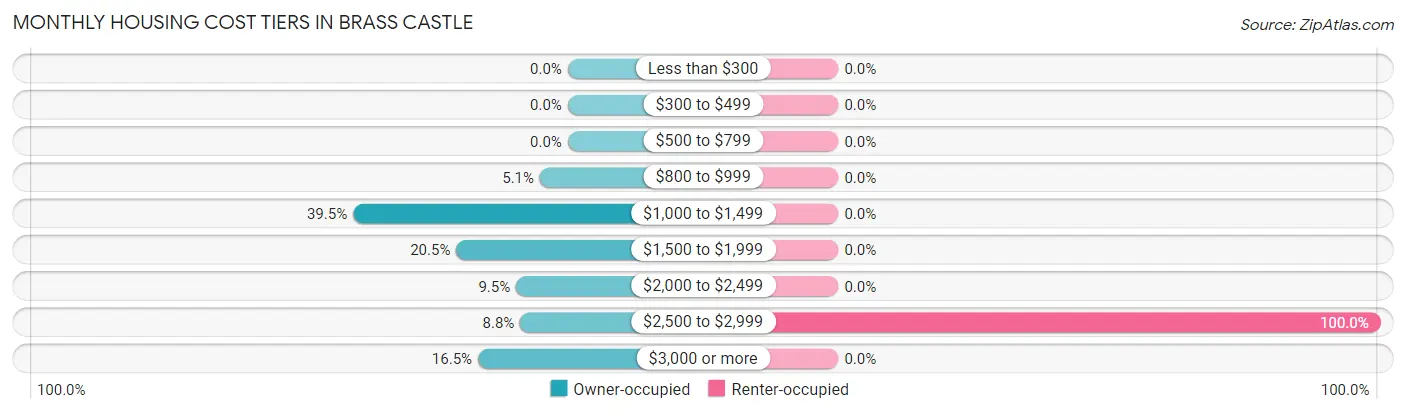
| Monthly Cost | Owner-occupied | Renter-occupied |
| Less than $300 | 0 (0.0%) | 0 (0.0%) |
| $300 to $499 | 0 (0.0%) | 0 (0.0%) |
| $500 to $799 | 0 (0.0%) | 0 (0.0%) |
| $800 to $999 | 27 (5.1%) | 0 (0.0%) |
| $1,000 to $1,499 | 208 (39.5%) | 0 (0.0%) |
| $1,500 to $1,999 | 108 (20.5%) | 0 (0.0%) |
| $2,000 to $2,499 | 50 (9.5%) | 0 (0.0%) |
| $2,500 to $2,999 | 46 (8.7%) | 39 (100.0%) |
| $3,000 or more | 87 (16.5%) | 0 (0.0%) |
| Total | 526 (100.0%) | 39 (100.0%) |
Physical Housing Characteristics in Brass Castle
Housing Structures in Brass Castle
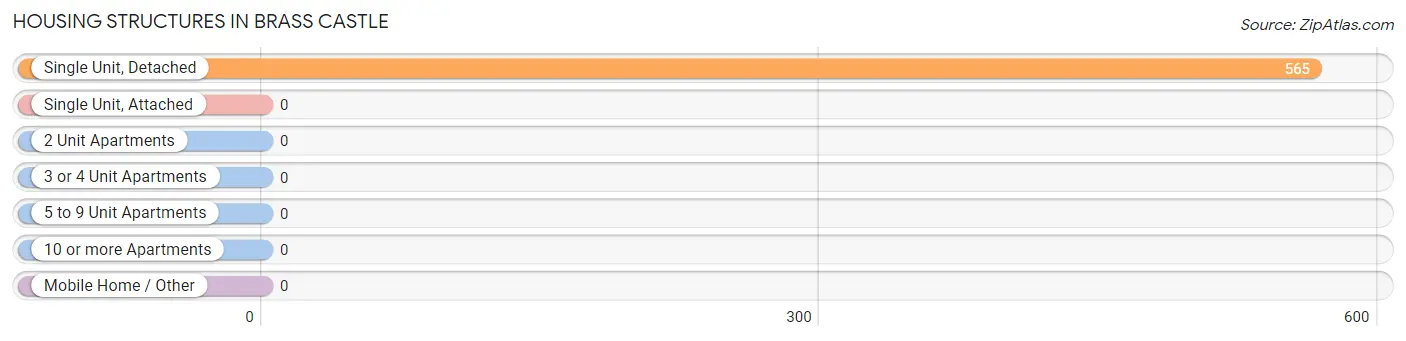
| Structure Type | # Housing Units | % Housing Units |
| Single Unit, Detached | 565 | 100.0% |
| Single Unit, Attached | 0 | 0.0% |
| 2 Unit Apartments | 0 | 0.0% |
| 3 or 4 Unit Apartments | 0 | 0.0% |
| 5 to 9 Unit Apartments | 0 | 0.0% |
| 10 or more Apartments | 0 | 0.0% |
| Mobile Home / Other | 0 | 0.0% |
| Total | 565 | 100.0% |
Housing Structures by Occupancy in Brass Castle
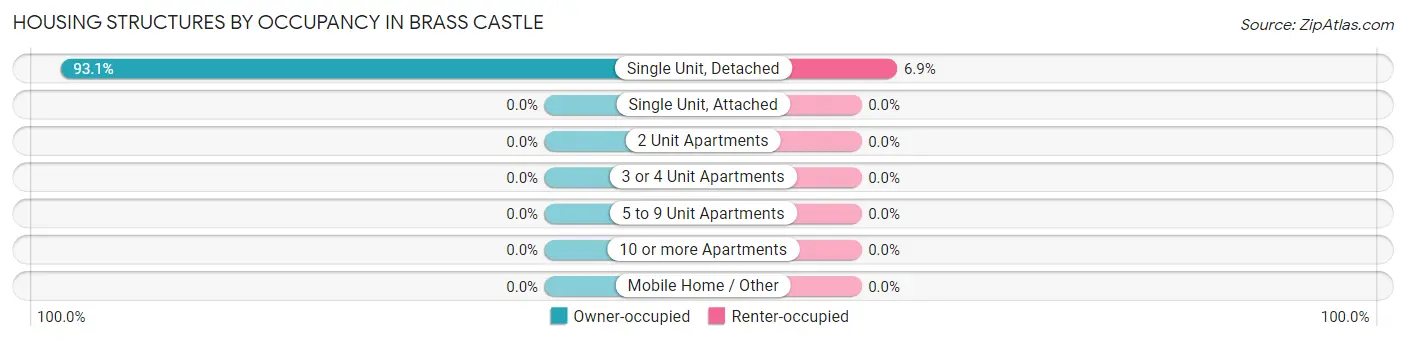
| Structure Type | Owner-occupied | Renter-occupied |
| Single Unit, Detached | 526 (93.1%) | 39 (6.9%) |
| Single Unit, Attached | 0 (0.0%) | 0 (0.0%) |
| 2 Unit Apartments | 0 (0.0%) | 0 (0.0%) |
| 3 or 4 Unit Apartments | 0 (0.0%) | 0 (0.0%) |
| 5 to 9 Unit Apartments | 0 (0.0%) | 0 (0.0%) |
| 10 or more Apartments | 0 (0.0%) | 0 (0.0%) |
| Mobile Home / Other | 0 (0.0%) | 0 (0.0%) |
| Total | 526 (93.1%) | 39 (6.9%) |
Housing Structures by Number of Rooms in Brass Castle
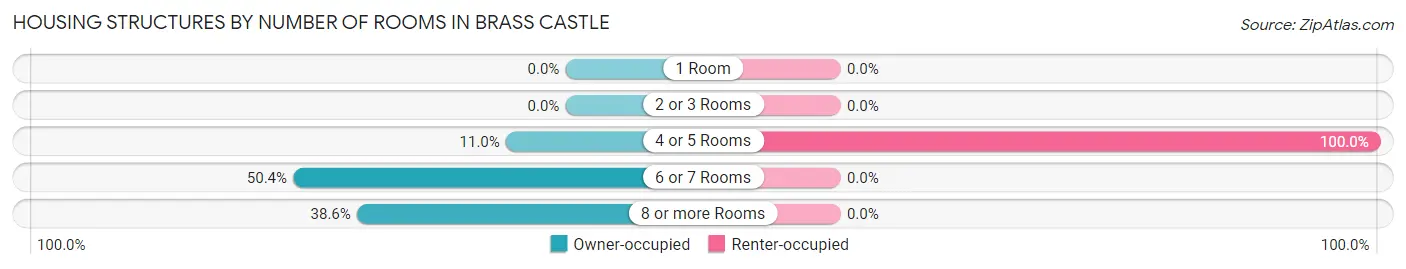
| Number of Rooms | Owner-occupied | Renter-occupied |
| 1 Room | 0 (0.0%) | 0 (0.0%) |
| 2 or 3 Rooms | 0 (0.0%) | 0 (0.0%) |
| 4 or 5 Rooms | 58 (11.0%) | 39 (100.0%) |
| 6 or 7 Rooms | 265 (50.4%) | 0 (0.0%) |
| 8 or more Rooms | 203 (38.6%) | 0 (0.0%) |
| Total | 526 (100.0%) | 39 (100.0%) |
Housing Structure by Heating Type in Brass Castle
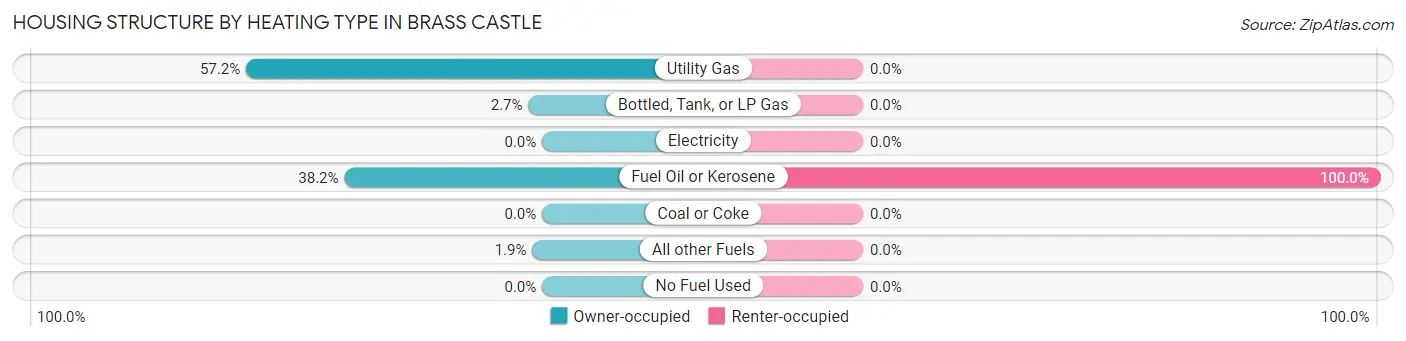
| Heating Type | Owner-occupied | Renter-occupied |
| Utility Gas | 301 (57.2%) | 0 (0.0%) |
| Bottled, Tank, or LP Gas | 14 (2.7%) | 0 (0.0%) |
| Electricity | 0 (0.0%) | 0 (0.0%) |
| Fuel Oil or Kerosene | 201 (38.2%) | 39 (100.0%) |
| Coal or Coke | 0 (0.0%) | 0 (0.0%) |
| All other Fuels | 10 (1.9%) | 0 (0.0%) |
| No Fuel Used | 0 (0.0%) | 0 (0.0%) |
| Total | 526 (100.0%) | 39 (100.0%) |
Household Vehicle Usage in Brass Castle
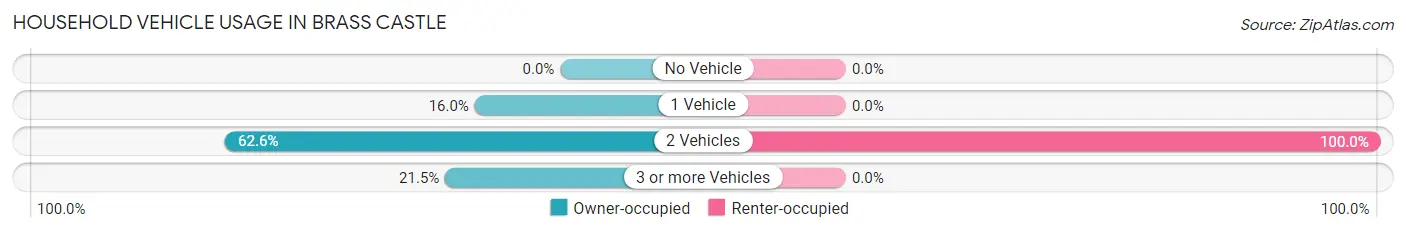
| Vehicles per Household | Owner-occupied | Renter-occupied |
| No Vehicle | 0 (0.0%) | 0 (0.0%) |
| 1 Vehicle | 84 (16.0%) | 0 (0.0%) |
| 2 Vehicles | 329 (62.5%) | 39 (100.0%) |
| 3 or more Vehicles | 113 (21.5%) | 0 (0.0%) |
| Total | 526 (100.0%) | 39 (100.0%) |
Real Estate & Mortgages in Brass Castle
Real Estate and Mortgage Overview in Brass Castle
| Characteristic | Without Mortgage | With Mortgage |
| Housing Units | 165 | 361 |
| Median Property Value | $395,800 | $329,400 |
| Median Household Income | $128,438 | $112 |
| Monthly Housing Costs | $1,233 | $87 |
| Real Estate Taxes | $9,659 | $0 |
Property Value by Mortgage Status in Brass Castle
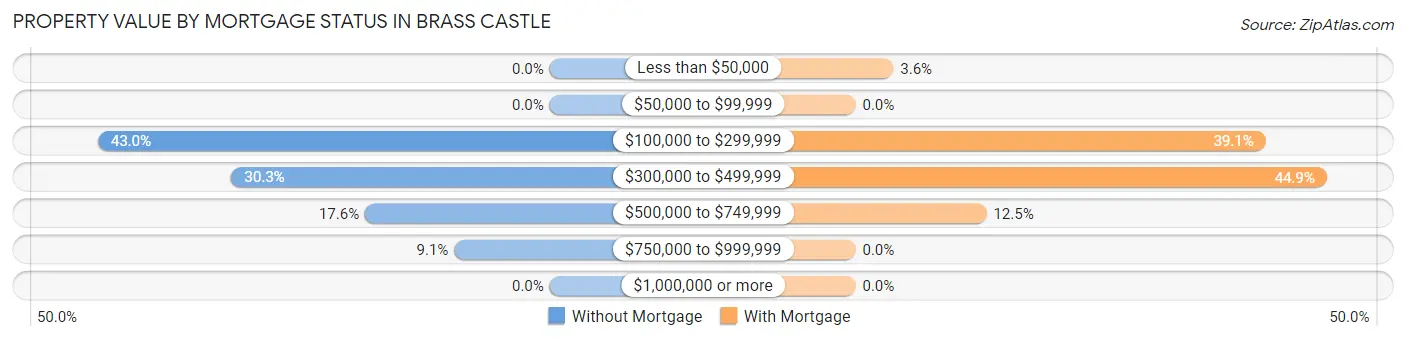
| Property Value | Without Mortgage | With Mortgage |
| Less than $50,000 | 0 (0.0%) | 13 (3.6%) |
| $50,000 to $99,999 | 0 (0.0%) | 0 (0.0%) |
| $100,000 to $299,999 | 71 (43.0%) | 141 (39.1%) |
| $300,000 to $499,999 | 50 (30.3%) | 162 (44.9%) |
| $500,000 to $749,999 | 29 (17.6%) | 45 (12.5%) |
| $750,000 to $999,999 | 15 (9.1%) | 0 (0.0%) |
| $1,000,000 or more | 0 (0.0%) | 0 (0.0%) |
| Total | 165 (100.0%) | 361 (100.0%) |
Household Income by Mortgage Status in Brass Castle
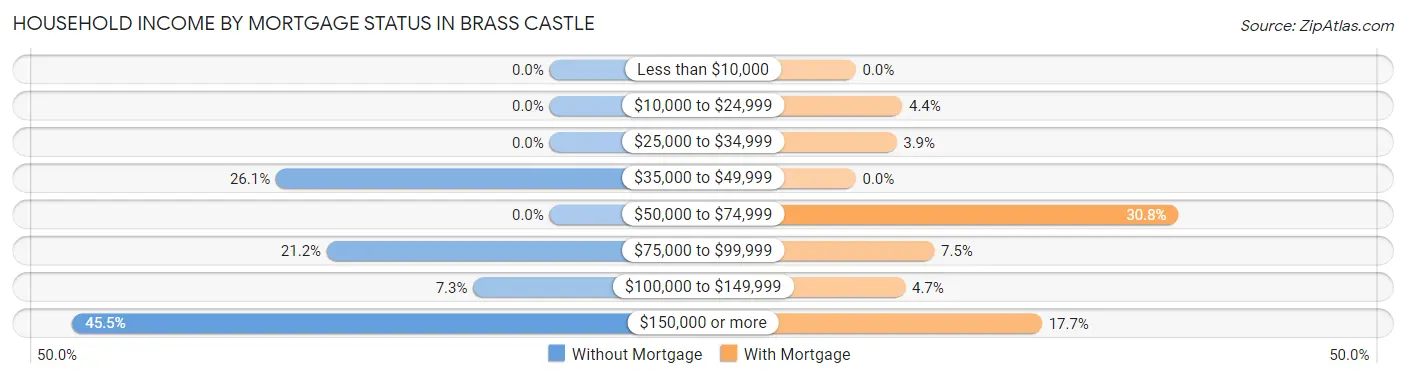
| Household Income | Without Mortgage | With Mortgage |
| Less than $10,000 | 0 (0.0%) | 0 (0.0%) |
| $10,000 to $24,999 | 0 (0.0%) | 16 (4.4%) |
| $25,000 to $34,999 | 0 (0.0%) | 14 (3.9%) |
| $35,000 to $49,999 | 43 (26.1%) | 0 (0.0%) |
| $50,000 to $74,999 | 0 (0.0%) | 111 (30.7%) |
| $75,000 to $99,999 | 35 (21.2%) | 27 (7.5%) |
| $100,000 to $149,999 | 12 (7.3%) | 17 (4.7%) |
| $150,000 or more | 75 (45.5%) | 64 (17.7%) |
| Total | 165 (100.0%) | 361 (100.0%) |
Property Value to Household Income Ratio in Brass Castle
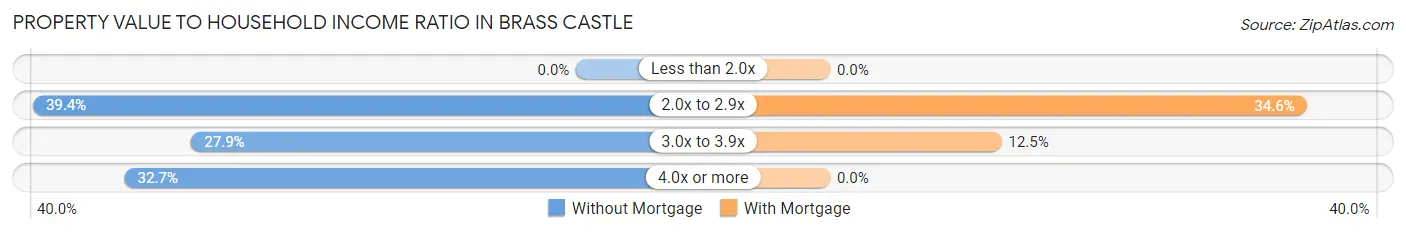
| Value-to-Income Ratio | Without Mortgage | With Mortgage |
| Less than 2.0x | 0 (0.0%) | 0 (0.0%) |
| 2.0x to 2.9x | 65 (39.4%) | 125 (34.6%) |
| 3.0x to 3.9x | 46 (27.9%) | 45 (12.5%) |
| 4.0x or more | 54 (32.7%) | 0 (0.0%) |
| Total | 165 (100.0%) | 361 (100.0%) |
Real Estate Taxes by Mortgage Status in Brass Castle
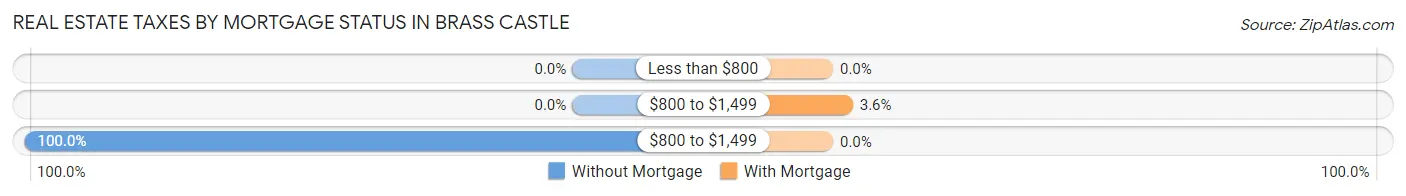
| Property Taxes | Without Mortgage | With Mortgage |
| Less than $800 | 0 (0.0%) | 0 (0.0%) |
| $800 to $1,499 | 0 (0.0%) | 13 (3.6%) |
| $800 to $1,499 | 165 (100.0%) | 0 (0.0%) |
| Total | 165 (100.0%) | 361 (100.0%) |
Health & Disability in Brass Castle
Health Insurance Coverage by Age in Brass Castle
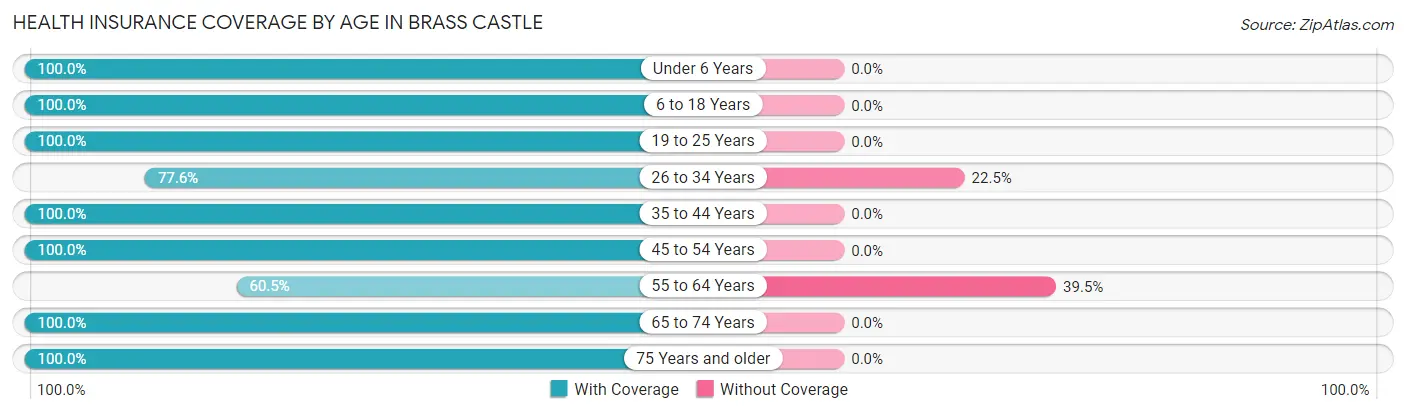
| Age Bracket | With Coverage | Without Coverage |
| Under 6 Years | 39 (100.0%) | 0 (0.0%) |
| 6 to 18 Years | 343 (100.0%) | 0 (0.0%) |
| 19 to 25 Years | 20 (100.0%) | 0 (0.0%) |
| 26 to 34 Years | 114 (77.5%) | 33 (22.5%) |
| 35 to 44 Years | 113 (100.0%) | 0 (0.0%) |
| 45 to 54 Years | 219 (100.0%) | 0 (0.0%) |
| 55 to 64 Years | 124 (60.5%) | 81 (39.5%) |
| 65 to 74 Years | 289 (100.0%) | 0 (0.0%) |
| 75 Years and older | 96 (100.0%) | 0 (0.0%) |
| Total | 1,357 (92.2%) | 114 (7.7%) |
Health Insurance Coverage by Citizenship Status in Brass Castle
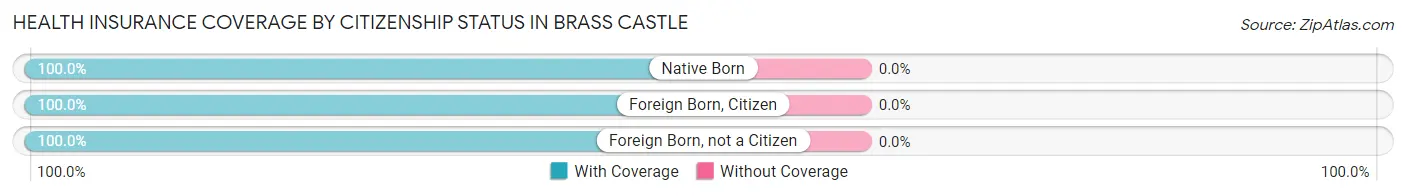
| Citizenship Status | With Coverage | Without Coverage |
| Native Born | 39 (100.0%) | 0 (0.0%) |
| Foreign Born, Citizen | 343 (100.0%) | 0 (0.0%) |
| Foreign Born, not a Citizen | 20 (100.0%) | 0 (0.0%) |
Health Insurance Coverage by Household Income in Brass Castle
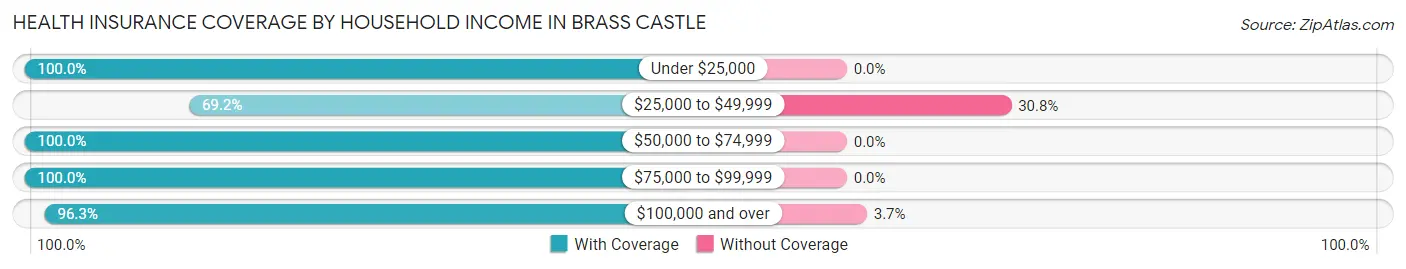
| Household Income | With Coverage | Without Coverage |
| Under $25,000 | 30 (100.0%) | 0 (0.0%) |
| $25,000 to $49,999 | 182 (69.2%) | 81 (30.8%) |
| $50,000 to $74,999 | 149 (100.0%) | 0 (0.0%) |
| $75,000 to $99,999 | 125 (100.0%) | 0 (0.0%) |
| $100,000 and over | 849 (96.3%) | 33 (3.7%) |
Public vs Private Health Insurance Coverage by Age in Brass Castle
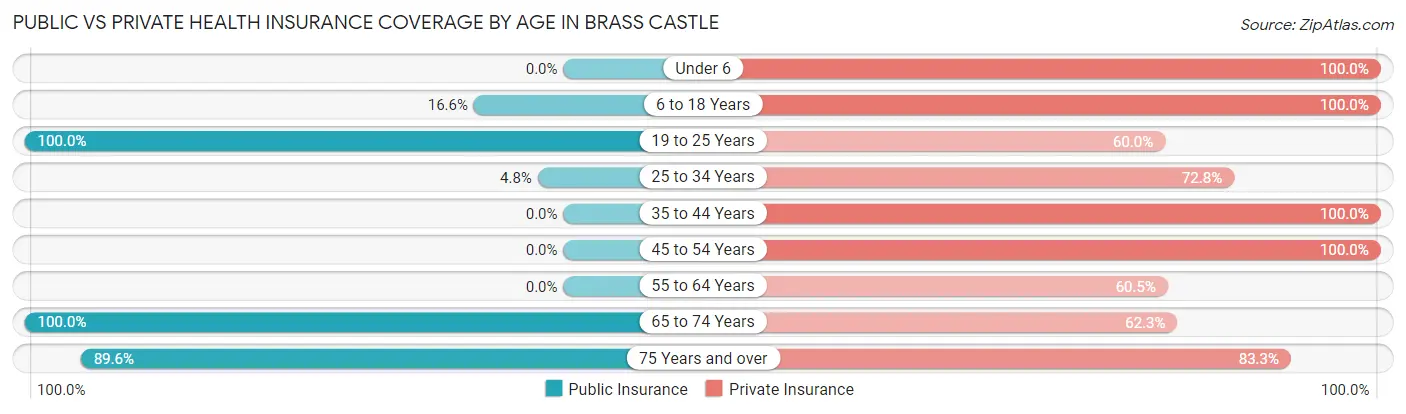
| Age Bracket | Public Insurance | Private Insurance |
| Under 6 | 0 (0.0%) | 39 (100.0%) |
| 6 to 18 Years | 57 (16.6%) | 343 (100.0%) |
| 19 to 25 Years | 20 (100.0%) | 12 (60.0%) |
| 25 to 34 Years | 7 (4.8%) | 107 (72.8%) |
| 35 to 44 Years | 0 (0.0%) | 113 (100.0%) |
| 45 to 54 Years | 0 (0.0%) | 219 (100.0%) |
| 55 to 64 Years | 0 (0.0%) | 124 (60.5%) |
| 65 to 74 Years | 289 (100.0%) | 180 (62.3%) |
| 75 Years and over | 86 (89.6%) | 80 (83.3%) |
| Total | 459 (31.2%) | 1,217 (82.7%) |
Disability Status by Sex by Age in Brass Castle
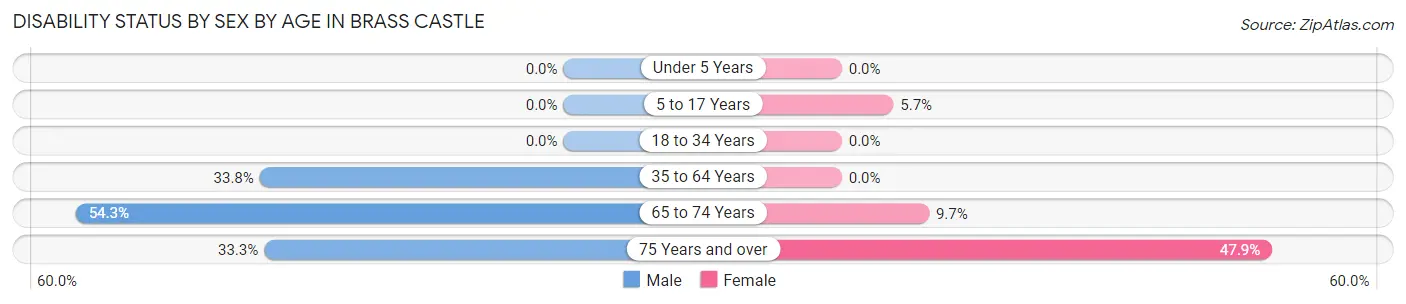
| Age Bracket | Male | Female |
| Under 5 Years | 0 (0.0%) | 0 (0.0%) |
| 5 to 17 Years | 0 (0.0%) | 12 (5.7%) |
| 18 to 34 Years | 0 (0.0%) | 0 (0.0%) |
| 35 to 64 Years | 68 (33.8%) | 0 (0.0%) |
| 65 to 74 Years | 101 (54.3%) | 10 (9.7%) |
| 75 Years and over | 16 (33.3%) | 23 (47.9%) |
Disability Class by Sex by Age in Brass Castle
Disability Class: Hearing Difficulty
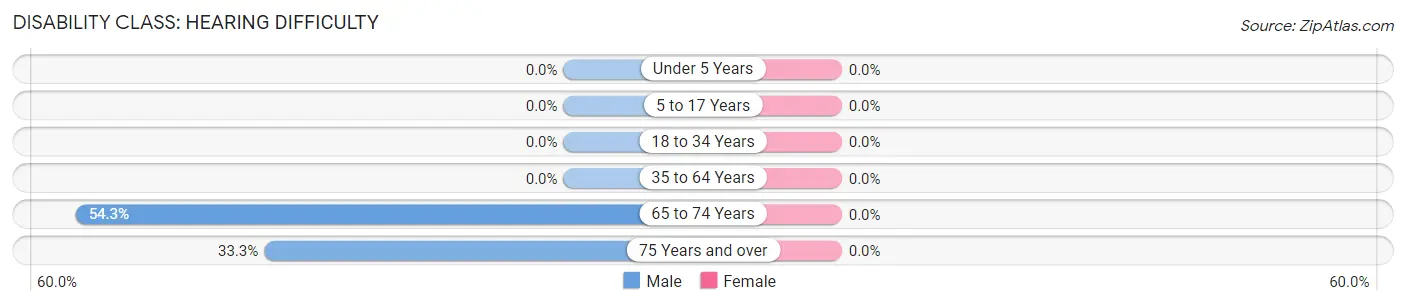
| Age Bracket | Male | Female |
| Under 5 Years | 0 (0.0%) | 0 (0.0%) |
| 5 to 17 Years | 0 (0.0%) | 0 (0.0%) |
| 18 to 34 Years | 0 (0.0%) | 0 (0.0%) |
| 35 to 64 Years | 0 (0.0%) | 0 (0.0%) |
| 65 to 74 Years | 101 (54.3%) | 0 (0.0%) |
| 75 Years and over | 16 (33.3%) | 0 (0.0%) |
Disability Class: Vision Difficulty
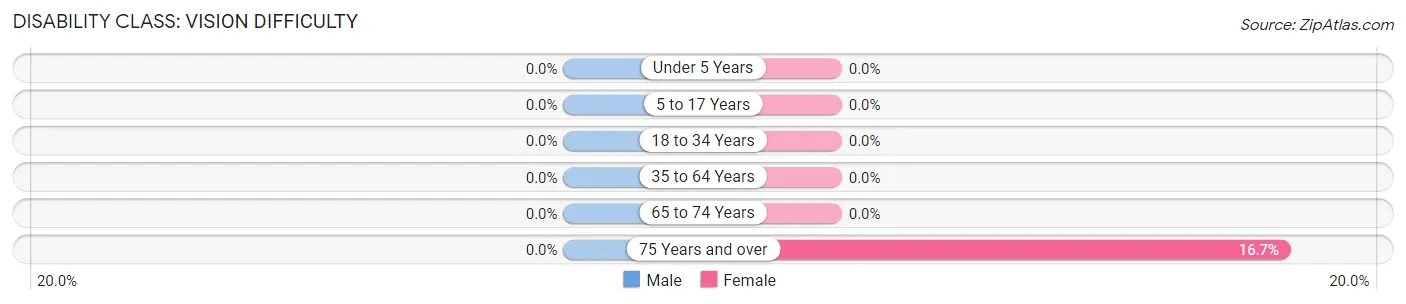
| Age Bracket | Male | Female |
| Under 5 Years | 0 (0.0%) | 0 (0.0%) |
| 5 to 17 Years | 0 (0.0%) | 0 (0.0%) |
| 18 to 34 Years | 0 (0.0%) | 0 (0.0%) |
| 35 to 64 Years | 0 (0.0%) | 0 (0.0%) |
| 65 to 74 Years | 0 (0.0%) | 0 (0.0%) |
| 75 Years and over | 0 (0.0%) | 8 (16.7%) |
Disability Class: Cognitive Difficulty
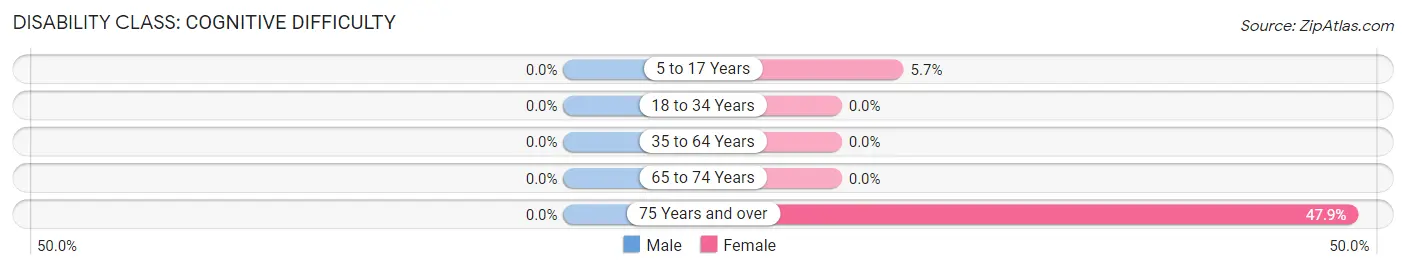
| Age Bracket | Male | Female |
| 5 to 17 Years | 0 (0.0%) | 12 (5.7%) |
| 18 to 34 Years | 0 (0.0%) | 0 (0.0%) |
| 35 to 64 Years | 0 (0.0%) | 0 (0.0%) |
| 65 to 74 Years | 0 (0.0%) | 0 (0.0%) |
| 75 Years and over | 0 (0.0%) | 23 (47.9%) |
Disability Class: Ambulatory Difficulty
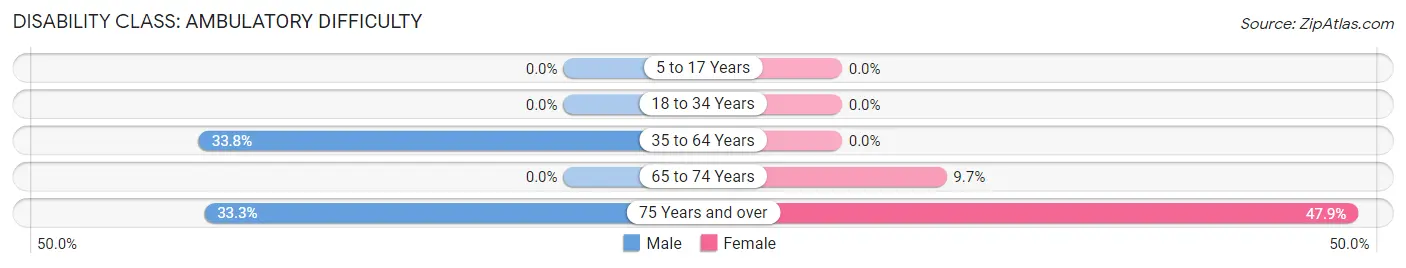
| Age Bracket | Male | Female |
| 5 to 17 Years | 0 (0.0%) | 0 (0.0%) |
| 18 to 34 Years | 0 (0.0%) | 0 (0.0%) |
| 35 to 64 Years | 68 (33.8%) | 0 (0.0%) |
| 65 to 74 Years | 0 (0.0%) | 10 (9.7%) |
| 75 Years and over | 16 (33.3%) | 23 (47.9%) |
Disability Class: Self-Care Difficulty
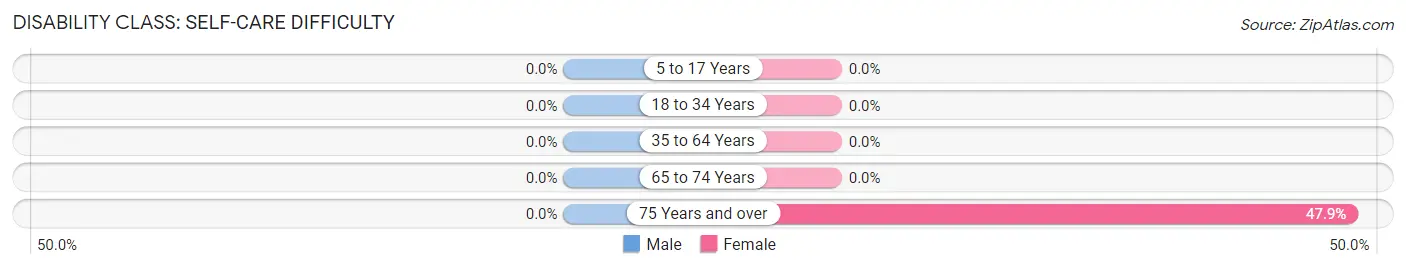
| Age Bracket | Male | Female |
| 5 to 17 Years | 0 (0.0%) | 0 (0.0%) |
| 18 to 34 Years | 0 (0.0%) | 0 (0.0%) |
| 35 to 64 Years | 0 (0.0%) | 0 (0.0%) |
| 65 to 74 Years | 0 (0.0%) | 0 (0.0%) |
| 75 Years and over | 0 (0.0%) | 23 (47.9%) |
Technology Access in Brass Castle
Computing Device Access in Brass Castle
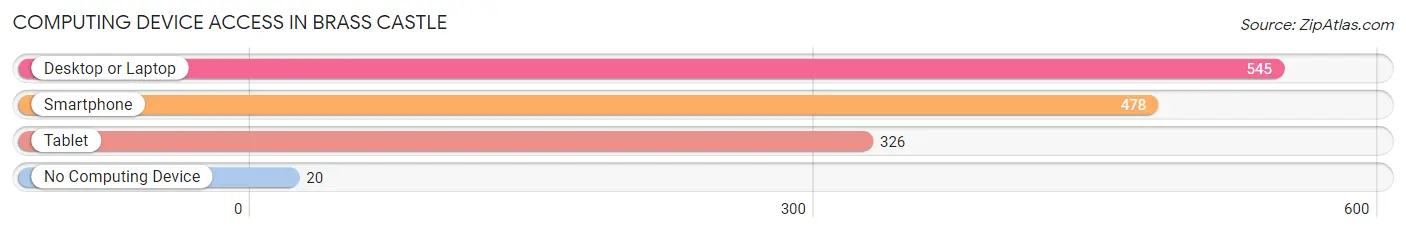
| Device Type | # Households | % Households |
| Desktop or Laptop | 545 | 96.5% |
| Smartphone | 478 | 84.6% |
| Tablet | 326 | 57.7% |
| No Computing Device | 20 | 3.5% |
| Total | 565 | 100.0% |
Internet Access in Brass Castle
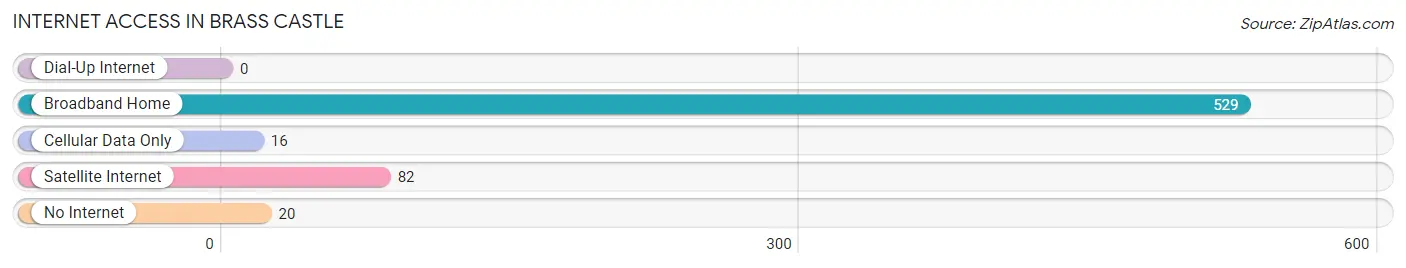
| Internet Type | # Households | % Households |
| Dial-Up Internet | 0 | 0.0% |
| Broadband Home | 529 | 93.6% |
| Cellular Data Only | 16 | 2.8% |
| Satellite Internet | 82 | 14.5% |
| No Internet | 20 | 3.5% |
| Total | 565 | 100.0% |
Brass Castle Summary
Brass Castle, NJ is a small unincorporated community located in Morris County, New Jersey. It is situated in the foothills of the Appalachian Mountains, approximately 25 miles northwest of Newark. The community is bordered by the towns of Washington Township, Mount Olive Township, and Chester Township.
History
The area that is now Brass Castle, NJ was first settled in the late 1700s by Dutch and German immigrants. The community was originally known as “Brass Castle” due to the presence of a large brass foundry in the area. The foundry was established in 1820 and operated until the early 1900s. The foundry was responsible for producing a variety of brass products, including door knobs, hinges, and other hardware.
The community was officially incorporated in 1891 and was named after the foundry. The town was home to a variety of businesses, including a general store, a post office, a blacksmith shop, and a hotel. The town also had a school, which was built in 1892 and served the local community until it closed in the 1950s.
Geography
Brass Castle, NJ is located in the foothills of the Appalachian Mountains. The town is situated in a rural area and is surrounded by rolling hills and forests. The town is located approximately 25 miles northwest of Newark and is bordered by the towns of Washington Township, Mount Olive Township, and Chester Township.
The town is located at an elevation of 1,000 feet and has a total area of 0.3 square miles. The town is located in a humid continental climate zone and experiences hot, humid summers and cold, snowy winters.
Economy
The economy of Brass Castle, NJ is largely based on agriculture and tourism. The town is home to several farms, which produce a variety of crops, including corn, soybeans, and hay. The town is also home to several wineries, which produce a variety of wines.
The town is also a popular tourist destination, as it is located in a scenic area and is home to several historic sites. The town is home to the Brass Castle Foundry, which is listed on the National Register of Historic Places. The town is also home to several other historic sites, including the Brass Castle Schoolhouse and the Brass Castle Hotel.
Demographics
As of the 2010 census, the population of Brass Castle, NJ was 1,092. The population is largely white (94.3%) and the median age is 44. The median household income is $76,250 and the median home value is $310,000. The town is home to a variety of religious denominations, including Catholic (44.2%), Protestant (25.2%), and Jewish (2.2%).
Conclusion
Brass Castle, NJ is a small unincorporated community located in Morris County, New Jersey. The town was originally known as “Brass Castle” due to the presence of a large brass foundry in the area. The town is situated in the foothills of the Appalachian Mountains and is surrounded by rolling hills and forests. The economy of the town is largely based on agriculture and tourism. The population of the town is largely white and the median age is 44. The town is home to a variety of religious denominations and is a popular tourist destination due to its scenic location and historic sites.
Common Questions
What is Per Capita Income in Brass Castle?
Per Capita income in Brass Castle is $47,538.
What is the Median Family Income in Brass Castle?
Median Family Income in Brass Castle is $138,224.
What is the Median Household income in Brass Castle?
Median Household Income in Brass Castle is $92,563.
What is Inequality or Gini Index in Brass Castle?
Inequality or Gini Index in Brass Castle is 0.39.
What is the Total Population of Brass Castle?
Total Population of Brass Castle is 1,471.
What is the Total Male Population of Brass Castle?
Total Male Population of Brass Castle is 670.
What is the Total Female Population of Brass Castle?
Total Female Population of Brass Castle is 801.
What is the Ratio of Males per 100 Females in Brass Castle?
There are 83.65 Males per 100 Females in Brass Castle.
What is the Ratio of Females per 100 Males in Brass Castle?
There are 119.55 Females per 100 Males in Brass Castle.
What is the Median Population Age in Brass Castle?
Median Population Age in Brass Castle is 46.2 Years.
What is the Average Family Size in Brass Castle
Average Family Size in Brass Castle is 3.0 People.
What is the Average Household Size in Brass Castle
Average Household Size in Brass Castle is 2.6 People.
How Large is the Labor Force in Brass Castle?
There are 702 People in the Labor Forcein in Brass Castle.
What is the Percentage of People in the Labor Force in Brass Castle?
61.0% of People are in the Labor Force in Brass Castle.
What is the Unemployment Rate in Brass Castle?
Unemployment Rate in Brass Castle is 11.5%.