Whittingham, NJ Map & Demographics
Whittingham Map
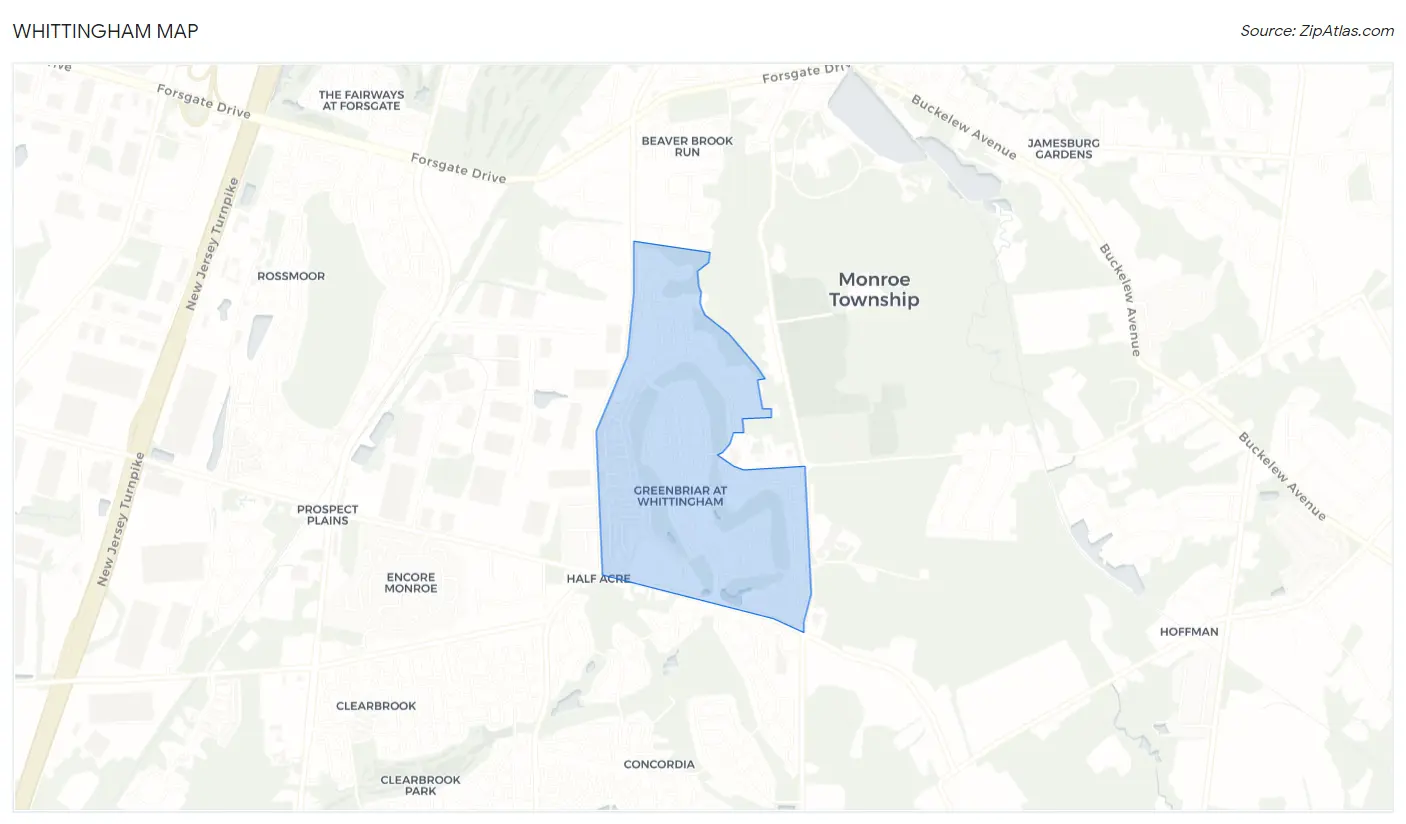
Whittingham Overview
$55,877
PER CAPITA INCOME
$74,008
AVG FAMILY INCOME
$71,996
AVG HOUSEHOLD INCOME
73.2%
WAGE / INCOME GAP [ % ]
26.8¢/ $1
WAGE / INCOME GAP [ $ ]
$9,363
FAMILY INCOME DEFICIT
0.38
INEQUALITY / GINI INDEX
2,423
TOTAL POPULATION
1,068
MALE POPULATION
1,355
FEMALE POPULATION
78.82
MALES / 100 FEMALES
126.87
FEMALES / 100 MALES
76.0
MEDIAN AGE
2.0
AVG FAMILY SIZE
1.6
AVG HOUSEHOLD SIZE
383
LABOR FORCE [ PEOPLE ]
15.8%
PERCENT IN LABOR FORCE
2.4%
UNEMPLOYMENT RATE
Income in Whittingham
Income Overview in Whittingham
Per Capita Income in Whittingham is $55,877, while median incomes of families and households are $74,008 and $71,996 respectively.
| Characteristic | Number | Measure |
| Per Capita Income | 2,423 | $55,877 |
| Median Family Income | 866 | $74,008 |
| Mean Family Income | 866 | $95,258 |
| Median Household Income | 1,508 | $71,996 |
| Mean Household Income | 1,508 | $90,049 |
| Income Deficit | 866 | $9,363 |
| Wage / Income Gap (%) | 2,423 | 73.18% |
| Wage / Income Gap ($) | 2,423 | 26.82¢ per $1 |
| Gini / Inequality Index | 2,423 | 0.38 |
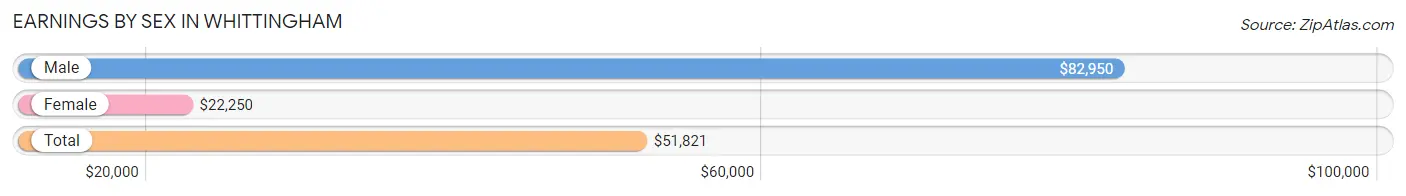
Earnings by Sex in Whittingham
Average Earnings in Whittingham are $51,821, $82,950 for men and $22,250 for women, a difference of 73.2%.
| Sex | Number | Average Earnings |
| Male | 225 (50.3%) | $82,950 |
| Female | 222 (49.7%) | $22,250 |
| Total | 447 (100.0%) | $51,821 |
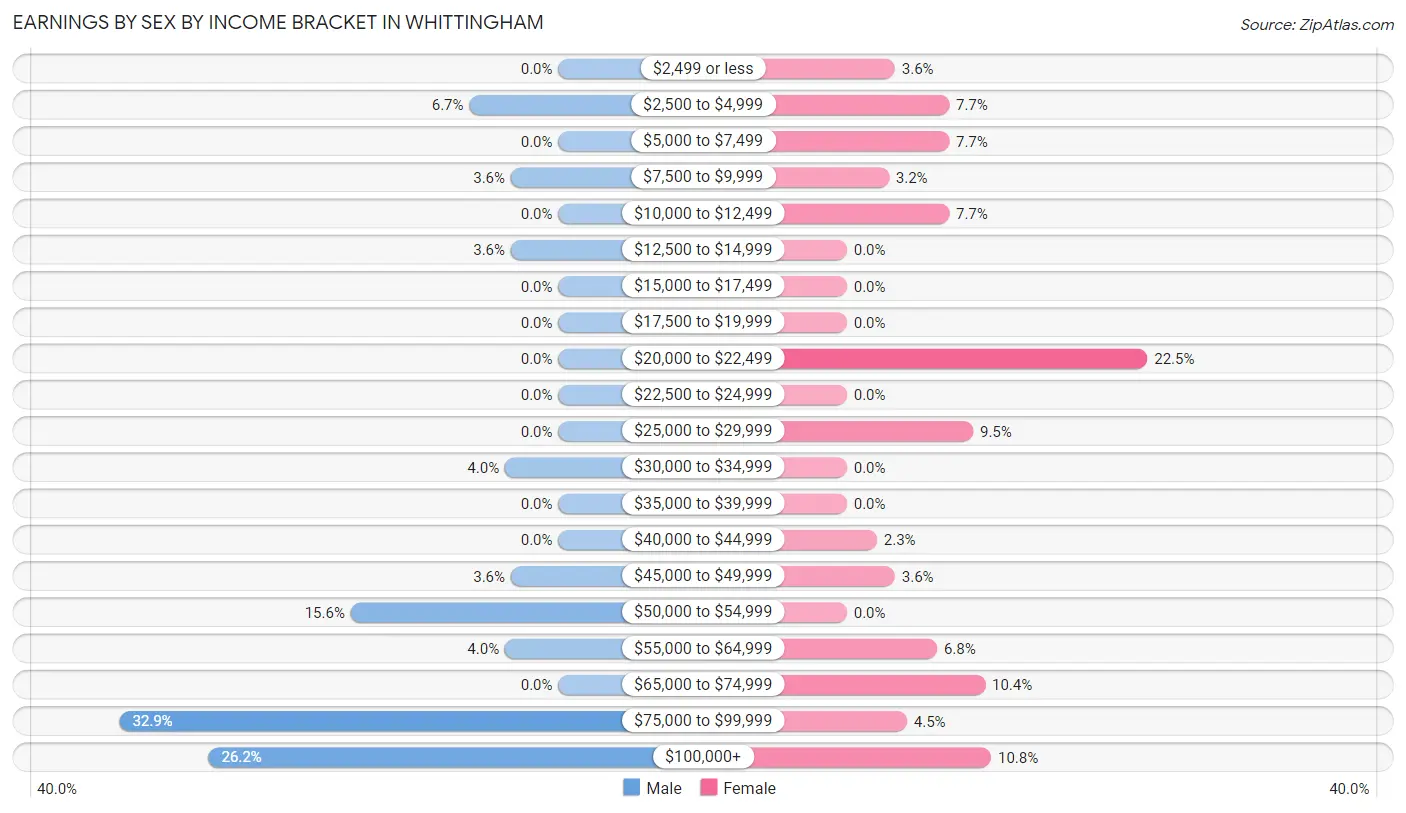
Earnings by Sex by Income Bracket in Whittingham
The most common earnings brackets in Whittingham are $75,000 to $99,999 for men (74 | 32.9%) and $20,000 to $22,499 for women (50 | 22.5%).
| Income | Male | Female |
| $2,499 or less | 0 (0.0%) | 8 (3.6%) |
| $2,500 to $4,999 | 15 (6.7%) | 17 (7.7%) |
| $5,000 to $7,499 | 0 (0.0%) | 17 (7.7%) |
| $7,500 to $9,999 | 8 (3.6%) | 7 (3.2%) |
| $10,000 to $12,499 | 0 (0.0%) | 17 (7.7%) |
| $12,500 to $14,999 | 8 (3.6%) | 0 (0.0%) |
| $15,000 to $17,499 | 0 (0.0%) | 0 (0.0%) |
| $17,500 to $19,999 | 0 (0.0%) | 0 (0.0%) |
| $20,000 to $22,499 | 0 (0.0%) | 50 (22.5%) |
| $22,500 to $24,999 | 0 (0.0%) | 0 (0.0%) |
| $25,000 to $29,999 | 0 (0.0%) | 21 (9.5%) |
| $30,000 to $34,999 | 9 (4.0%) | 0 (0.0%) |
| $35,000 to $39,999 | 0 (0.0%) | 0 (0.0%) |
| $40,000 to $44,999 | 0 (0.0%) | 5 (2.2%) |
| $45,000 to $49,999 | 8 (3.6%) | 8 (3.6%) |
| $50,000 to $54,999 | 35 (15.6%) | 0 (0.0%) |
| $55,000 to $64,999 | 9 (4.0%) | 15 (6.8%) |
| $65,000 to $74,999 | 0 (0.0%) | 23 (10.4%) |
| $75,000 to $99,999 | 74 (32.9%) | 10 (4.5%) |
| $100,000+ | 59 (26.2%) | 24 (10.8%) |
| Total | 225 (100.0%) | 222 (100.0%) |
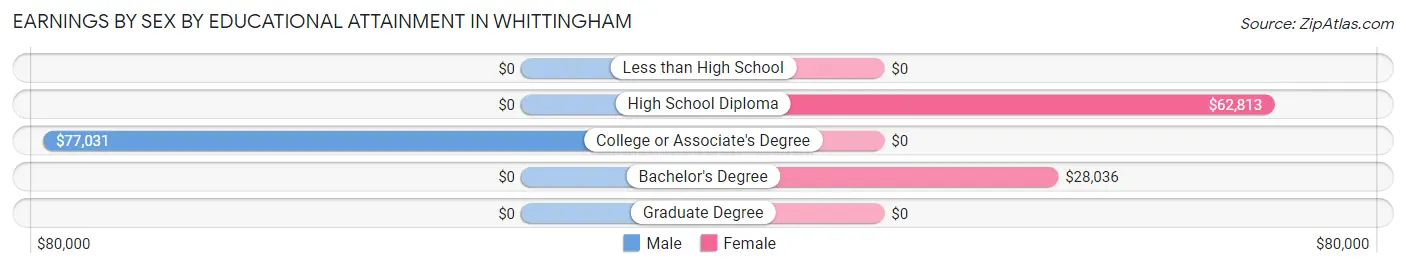
Earnings by Sex by Educational Attainment in Whittingham
Average earnings in Whittingham are $82,950 for men and $22,250 for women, a difference of 73.2%. Men with an educational attainment of college or associate's degree enjoy the highest average annual earnings of $77,031, while those with college or associate's degree education earn the least with $77,031. Women with an educational attainment of high school diploma earn the most with the average annual earnings of $62,813, while those with bachelor's degree education have the smallest earnings of $28,036.
| Educational Attainment | Male Income | Female Income |
| Less than High School | - | - |
| High School Diploma | - | - |
| College or Associate's Degree | $77,031 | $0 |
| Bachelor's Degree | - | - |
| Graduate Degree | - | - |
| Total | $82,950 | $22,250 |
Family Income in Whittingham
Family Income Brackets in Whittingham
According to the Whittingham family income data, there are 384 families falling into the $50,000 to $74,999 income range, which is the most common income bracket and makes up 44.3% of all families. Conversely, the $15,000 to $24,999 income bracket is the least frequent group with only 8 families (0.9%) belonging to this category.
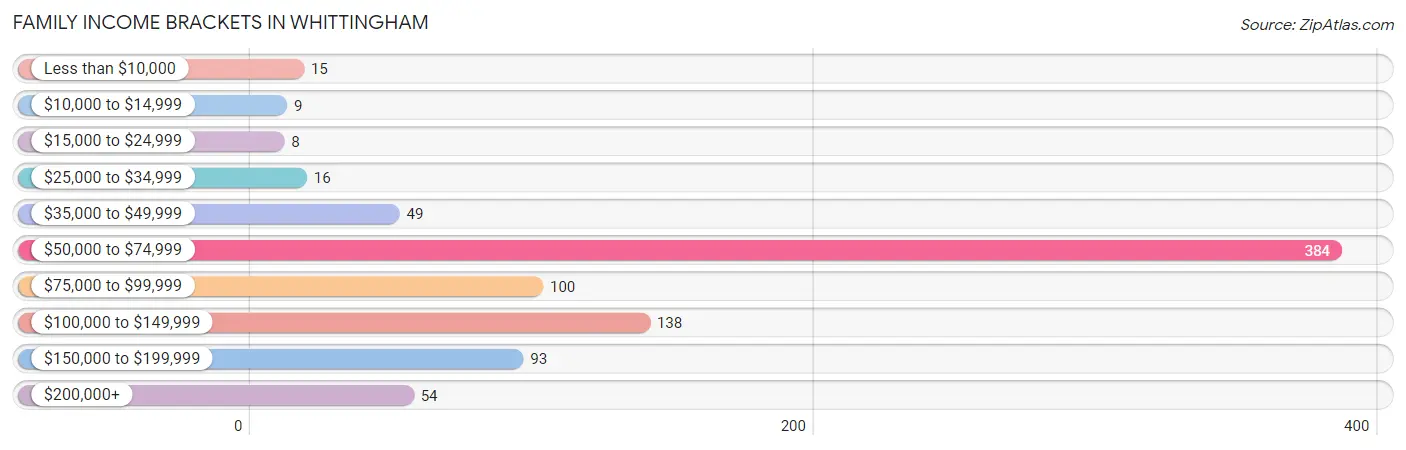
| Income Bracket | # Families | % Families |
| Less than $10,000 | 15 | 1.7% |
| $10,000 to $14,999 | 9 | 1.0% |
| $15,000 to $24,999 | 8 | 0.9% |
| $25,000 to $34,999 | 16 | 1.8% |
| $35,000 to $49,999 | 49 | 5.7% |
| $50,000 to $74,999 | 384 | 44.3% |
| $75,000 to $99,999 | 100 | 11.5% |
| $100,000 to $149,999 | 138 | 15.9% |
| $150,000 to $199,999 | 93 | 10.7% |
| $200,000+ | 54 | 6.2% |
Family Income by Famaliy Size in Whittingham
2-person families (838 | 96.8%) account for the highest median family income in Whittingham with $73,864 per family, while 2-person families (838 | 96.8%) have the highest median income of $36,932 per family member.
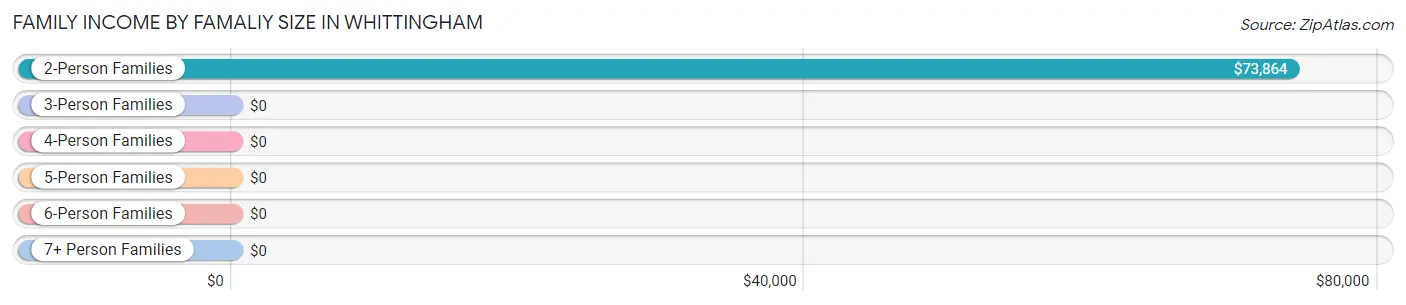
| Income Bracket | # Families | Median Income |
| 2-Person Families | 838 (96.8%) | $73,864 |
| 3-Person Families | 28 (3.2%) | $0 |
| 4-Person Families | 0 (0.0%) | $0 |
| 5-Person Families | 0 (0.0%) | $0 |
| 6-Person Families | 0 (0.0%) | $0 |
| 7+ Person Families | 0 (0.0%) | $0 |
| Total | 866 (100.0%) | $74,008 |
Family Income by Number of Earners in Whittingham
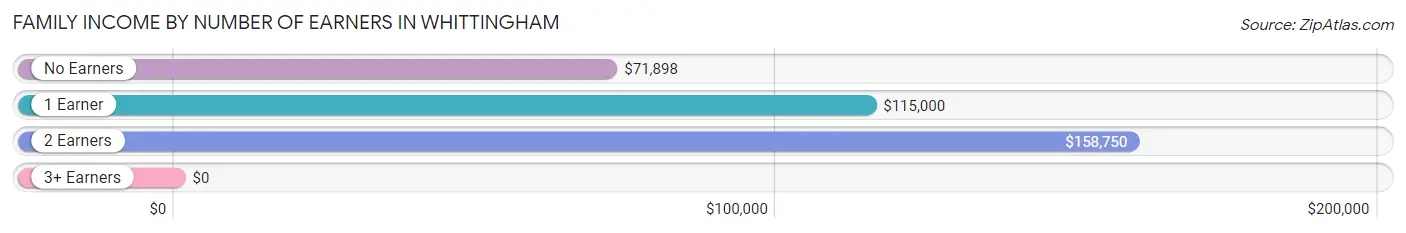
| Number of Earners | # Families | Median Income |
| No Earners | 576 (66.5%) | $71,898 |
| 1 Earner | 222 (25.6%) | $115,000 |
| 2 Earners | 68 (7.9%) | $158,750 |
| 3+ Earners | 0 (0.0%) | $0 |
| Total | 866 (100.0%) | $74,008 |
Household Income in Whittingham
Household Income Brackets in Whittingham
With 538 households falling in the category, the $50,000 to $74,999 income range is the most frequent in Whittingham, accounting for 35.7% of all households. In contrast, only 41 households (2.7%) fall into the $10,000 to $14,999 income bracket, making it the least populous group.
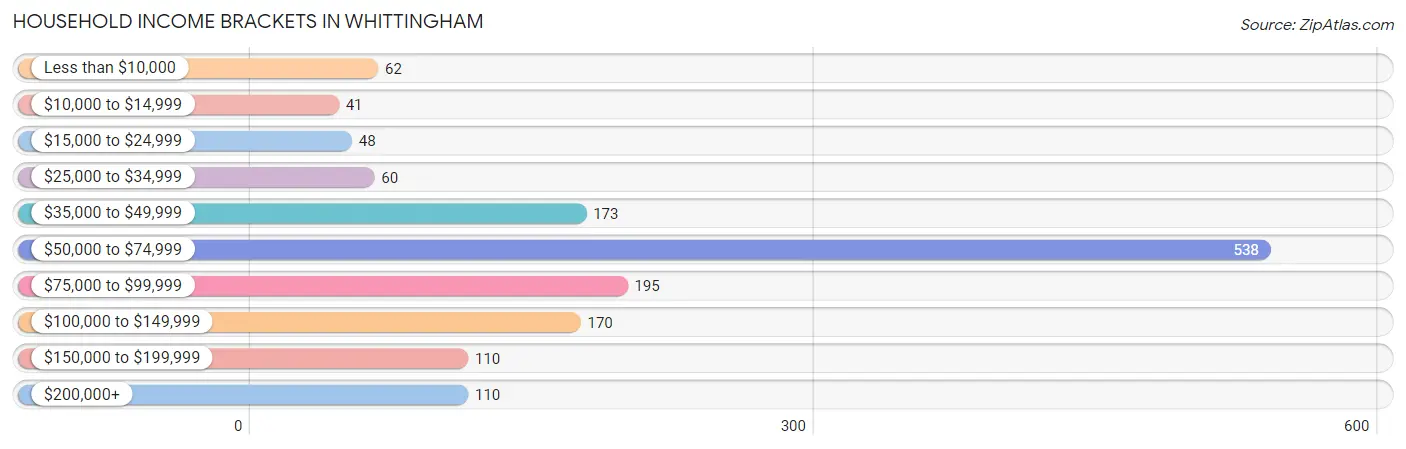
| Income Bracket | # Households | % Households |
| Less than $10,000 | 62 | 4.1% |
| $10,000 to $14,999 | 41 | 2.7% |
| $15,000 to $24,999 | 48 | 3.2% |
| $25,000 to $34,999 | 60 | 4.0% |
| $35,000 to $49,999 | 173 | 11.5% |
| $50,000 to $74,999 | 538 | 35.7% |
| $75,000 to $99,999 | 195 | 12.9% |
| $100,000 to $149,999 | 170 | 11.3% |
| $150,000 to $199,999 | 110 | 7.3% |
| $200,000+ | 110 | 7.3% |
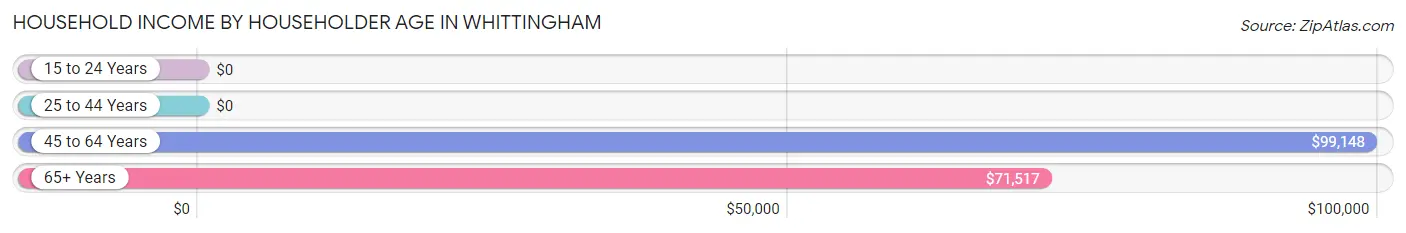
Household Income by Householder Age in Whittingham
The median household income in Whittingham is $71,996, with the highest median household income of $99,148 found in the 45 to 64 years age bracket for the primary householder. A total of 151 households (10.0%) fall into this category.
| Income Bracket | # Households | Median Income |
| 15 to 24 Years | 0 (0.0%) | $0 |
| 25 to 44 Years | 0 (0.0%) | $0 |
| 45 to 64 Years | 151 (10.0%) | $99,148 |
| 65+ Years | 1,357 (90.0%) | $71,517 |
| Total | 1,508 (100.0%) | $71,996 |
Poverty in Whittingham
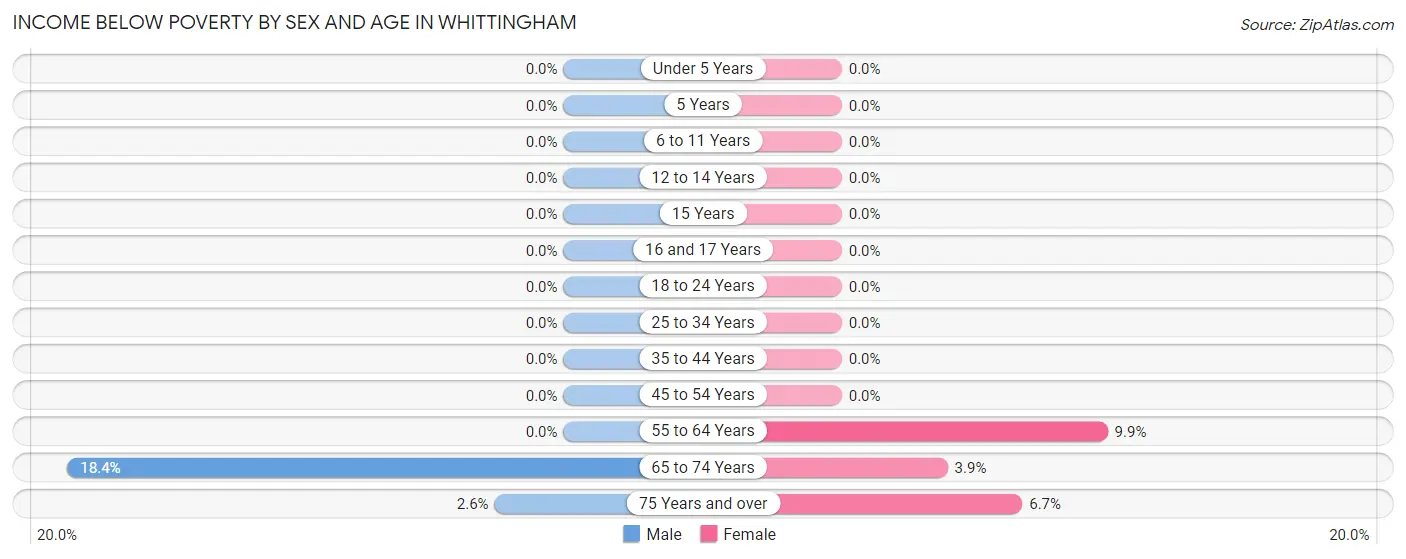
Income Below Poverty by Sex and Age in Whittingham
With 5.9% poverty level for males and 6.1% for females among the residents of Whittingham, 65 to 74 year old males and 55 to 64 year old females are the most vulnerable to poverty, with 44 males (18.4%) and 15 females (9.9%) in their respective age groups living below the poverty level.
| Age Bracket | Male | Female |
| Under 5 Years | 0 (0.0%) | 0 (0.0%) |
| 5 Years | 0 (0.0%) | 0 (0.0%) |
| 6 to 11 Years | 0 (0.0%) | 0 (0.0%) |
| 12 to 14 Years | 0 (0.0%) | 0 (0.0%) |
| 15 Years | 0 (0.0%) | 0 (0.0%) |
| 16 and 17 Years | 0 (0.0%) | 0 (0.0%) |
| 18 to 24 Years | 0 (0.0%) | 0 (0.0%) |
| 25 to 34 Years | 0 (0.0%) | 0 (0.0%) |
| 35 to 44 Years | 0 (0.0%) | 0 (0.0%) |
| 45 to 54 Years | 0 (0.0%) | 0 (0.0%) |
| 55 to 64 Years | 0 (0.0%) | 15 (9.9%) |
| 65 to 74 Years | 44 (18.4%) | 17 (3.9%) |
| 75 Years and over | 19 (2.6%) | 51 (6.7%) |
| Total | 63 (5.9%) | 83 (6.1%) |
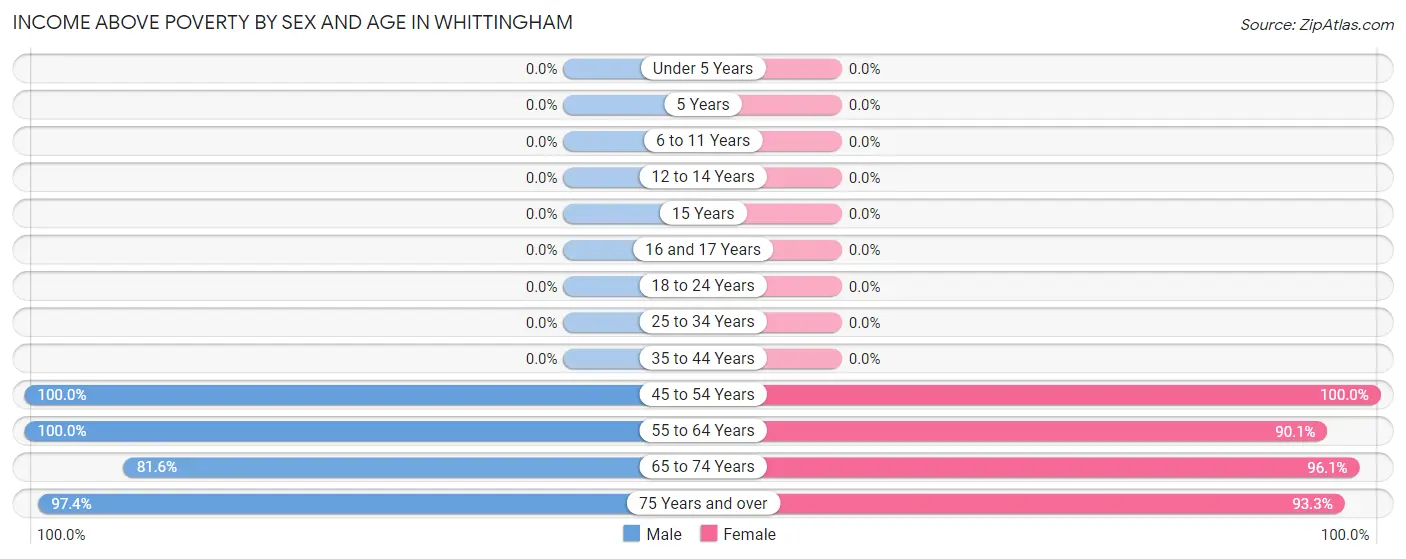
Income Above Poverty by Sex and Age in Whittingham
According to the poverty statistics in Whittingham, males aged 45 to 54 years and females aged 45 to 54 years are the age groups that are most secure financially, with 100.0% of males and 100.0% of females in these age groups living above the poverty line.
| Age Bracket | Male | Female |
| Under 5 Years | 0 (0.0%) | 0 (0.0%) |
| 5 Years | 0 (0.0%) | 0 (0.0%) |
| 6 to 11 Years | 0 (0.0%) | 0 (0.0%) |
| 12 to 14 Years | 0 (0.0%) | 0 (0.0%) |
| 15 Years | 0 (0.0%) | 0 (0.0%) |
| 16 and 17 Years | 0 (0.0%) | 0 (0.0%) |
| 18 to 24 Years | 0 (0.0%) | 0 (0.0%) |
| 25 to 34 Years | 0 (0.0%) | 0 (0.0%) |
| 35 to 44 Years | 0 (0.0%) | 0 (0.0%) |
| 45 to 54 Years | 7 (100.0%) | 9 (100.0%) |
| 55 to 64 Years | 81 (100.0%) | 137 (90.1%) |
| 65 to 74 Years | 195 (81.6%) | 416 (96.1%) |
| 75 Years and over | 722 (97.4%) | 710 (93.3%) |
| Total | 1,005 (94.1%) | 1,272 (93.9%) |
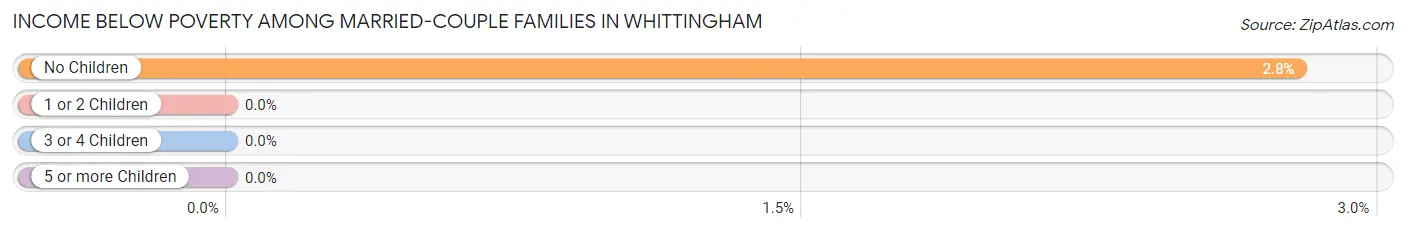
Income Below Poverty Among Married-Couple Families in Whittingham
The poverty statistics for married-couple families in Whittingham show that 2.8% or 24 of the total 859 families live below the poverty line. Families with no children have the highest poverty rate of 2.8%, comprising of 24 families. On the other hand, families with no children have the lowest poverty rate of 2.8%, which includes 24 families.
| Children | Above Poverty | Below Poverty |
| No Children | 835 (97.2%) | 24 (2.8%) |
| 1 or 2 Children | 0 (0.0%) | 0 (0.0%) |
| 3 or 4 Children | 0 (0.0%) | 0 (0.0%) |
| 5 or more Children | 0 (0.0%) | 0 (0.0%) |
| Total | 835 (97.2%) | 24 (2.8%) |
Income Below Poverty Among Single-Parent Households in Whittingham
| Children | Single Father | Single Mother |
| No Children | 0 (0.0%) | 0 (0.0%) |
| 1 or 2 Children | 0 (0.0%) | 0 (0.0%) |
| 3 or 4 Children | 0 (0.0%) | 0 (0.0%) |
| 5 or more Children | 0 (0.0%) | 0 (0.0%) |
| Total | 0 (0.0%) | 0 (0.0%) |
Income Below Poverty Among Married-Couple vs Single-Parent Households in Whittingham
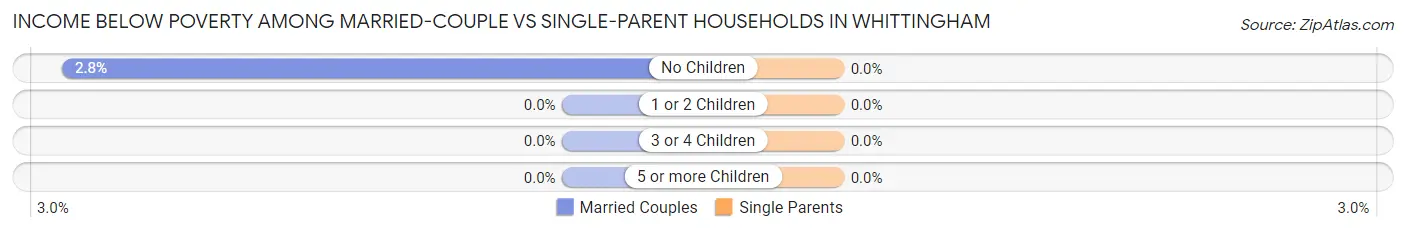
| Children | Married-Couple Families | Single-Parent Households |
| No Children | 24 (2.8%) | 0 (0.0%) |
| 1 or 2 Children | 0 (0.0%) | 0 (0.0%) |
| 3 or 4 Children | 0 (0.0%) | 0 (0.0%) |
| 5 or more Children | 0 (0.0%) | 0 (0.0%) |
| Total | 24 (2.8%) | 0 (0.0%) |
Race in Whittingham
The most populous races in Whittingham are White / Caucasian (2,238 | 92.4%), Asian (97 | 4.0%), and Black / African American (40 | 1.7%).
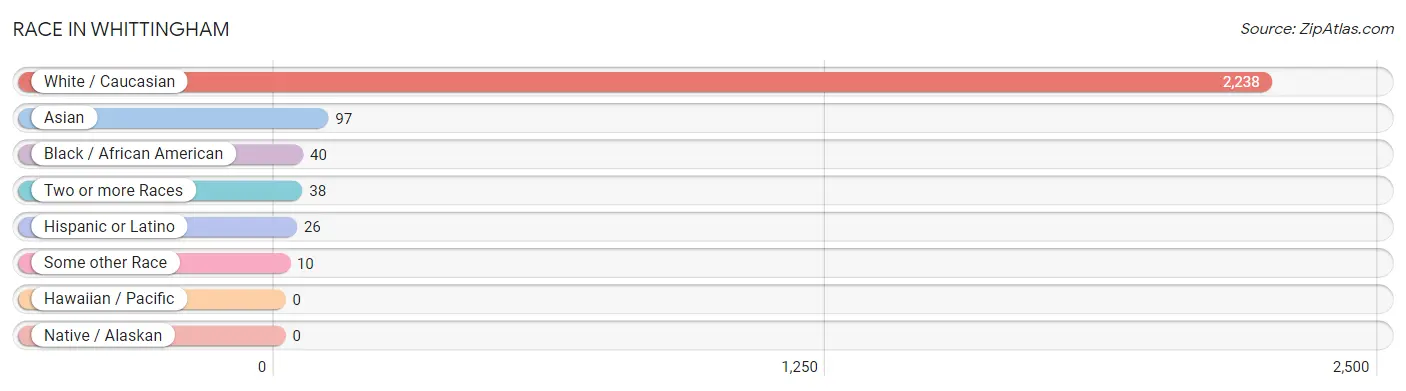
| Race | # Population | % Population |
| Asian | 97 | 4.0% |
| Black / African American | 40 | 1.7% |
| Hawaiian / Pacific | 0 | 0.0% |
| Hispanic or Latino | 26 | 1.1% |
| Native / Alaskan | 0 | 0.0% |
| White / Caucasian | 2,238 | 92.4% |
| Two or more Races | 38 | 1.6% |
| Some other Race | 10 | 0.4% |
| Total | 2,423 | 100.0% |
Ancestry in Whittingham
The most populous ancestries reported in Whittingham are Italian (908 | 37.5%), Russian (243 | 10.0%), Polish (183 | 7.5%), Irish (133 | 5.5%), and American (90 | 3.7%), together accounting for 64.2% of all Whittingham residents.
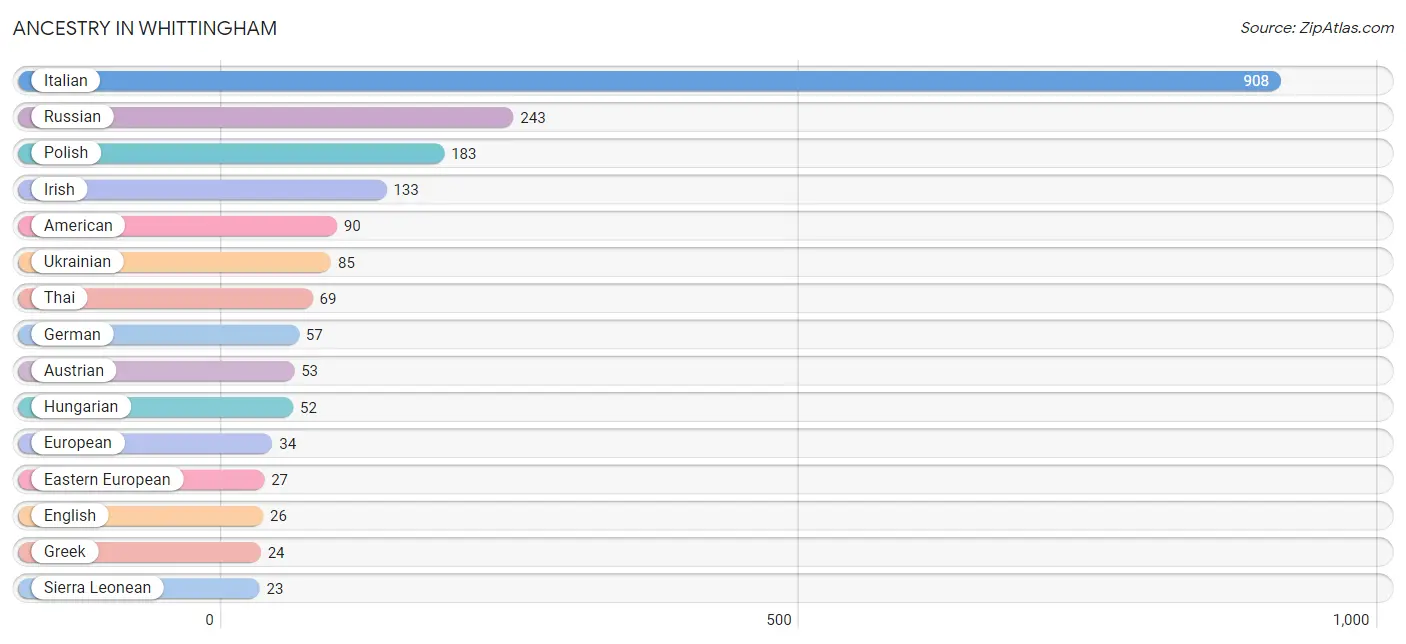
| Ancestry | # Population | % Population |
| American | 90 | 3.7% |
| Arab | 9 | 0.4% |
| Armenian | 16 | 0.7% |
| Austrian | 53 | 2.2% |
| Canadian | 9 | 0.4% |
| Czechoslovakian | 8 | 0.3% |
| Eastern European | 27 | 1.1% |
| Egyptian | 9 | 0.4% |
| English | 26 | 1.1% |
| European | 34 | 1.4% |
| Filipino | 20 | 0.8% |
| French | 9 | 0.4% |
| German | 57 | 2.4% |
| Greek | 24 | 1.0% |
| Hungarian | 52 | 2.1% |
| Indian (Asian) | 8 | 0.3% |
| Irish | 133 | 5.5% |
| Israeli | 8 | 0.3% |
| Italian | 908 | 37.5% |
| Lithuanian | 17 | 0.7% |
| Mexican | 8 | 0.3% |
| Norwegian | 16 | 0.7% |
| Peruvian | 10 | 0.4% |
| Polish | 183 | 7.5% |
| Romanian | 8 | 0.3% |
| Russian | 243 | 10.0% |
| Sierra Leonean | 23 | 0.9% |
| Slovak | 8 | 0.3% |
| South American | 10 | 0.4% |
| Soviet Union | 5 | 0.2% |
| Spaniard | 8 | 0.3% |
| Subsaharan African | 23 | 0.9% |
| Thai | 69 | 2.9% |
| Ukrainian | 85 | 3.5% | View All 34 Rows |
Immigrants in Whittingham
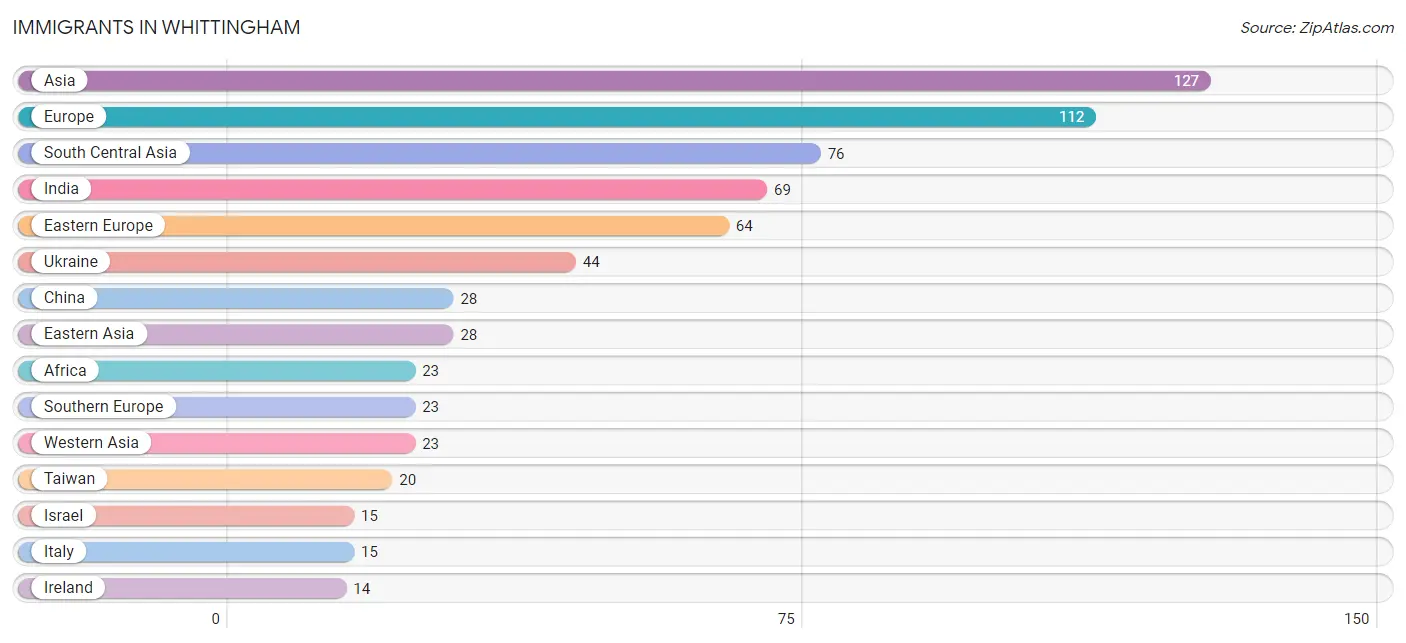
The most numerous immigrant groups reported in Whittingham came from Asia (127 | 5.2%), Europe (112 | 4.6%), South Central Asia (76 | 3.1%), India (69 | 2.9%), and Eastern Europe (64 | 2.6%), together accounting for 18.5% of all Whittingham residents.
| Immigration Origin | # Population | % Population |
| Africa | 23 | 0.9% |
| Asia | 127 | 5.2% |
| China | 28 | 1.2% |
| Eastern Asia | 28 | 1.2% |
| Eastern Europe | 64 | 2.6% |
| Europe | 112 | 4.6% |
| Germany | 11 | 0.4% |
| Greece | 8 | 0.3% |
| Hong Kong | 8 | 0.3% |
| India | 69 | 2.9% |
| Ireland | 14 | 0.6% |
| Israel | 15 | 0.6% |
| Italy | 15 | 0.6% |
| Latin America | 10 | 0.4% |
| Northern Europe | 14 | 0.6% |
| Peru | 10 | 0.4% |
| Poland | 10 | 0.4% |
| South America | 10 | 0.4% |
| South Central Asia | 76 | 3.1% |
| Southern Europe | 23 | 0.9% |
| Taiwan | 20 | 0.8% |
| Turkey | 8 | 0.3% |
| Ukraine | 44 | 1.8% |
| Uzbekistan | 7 | 0.3% |
| Western Asia | 23 | 0.9% |
| Western Europe | 11 | 0.4% | View All 26 Rows |
Sex and Age in Whittingham
Sex and Age in Whittingham
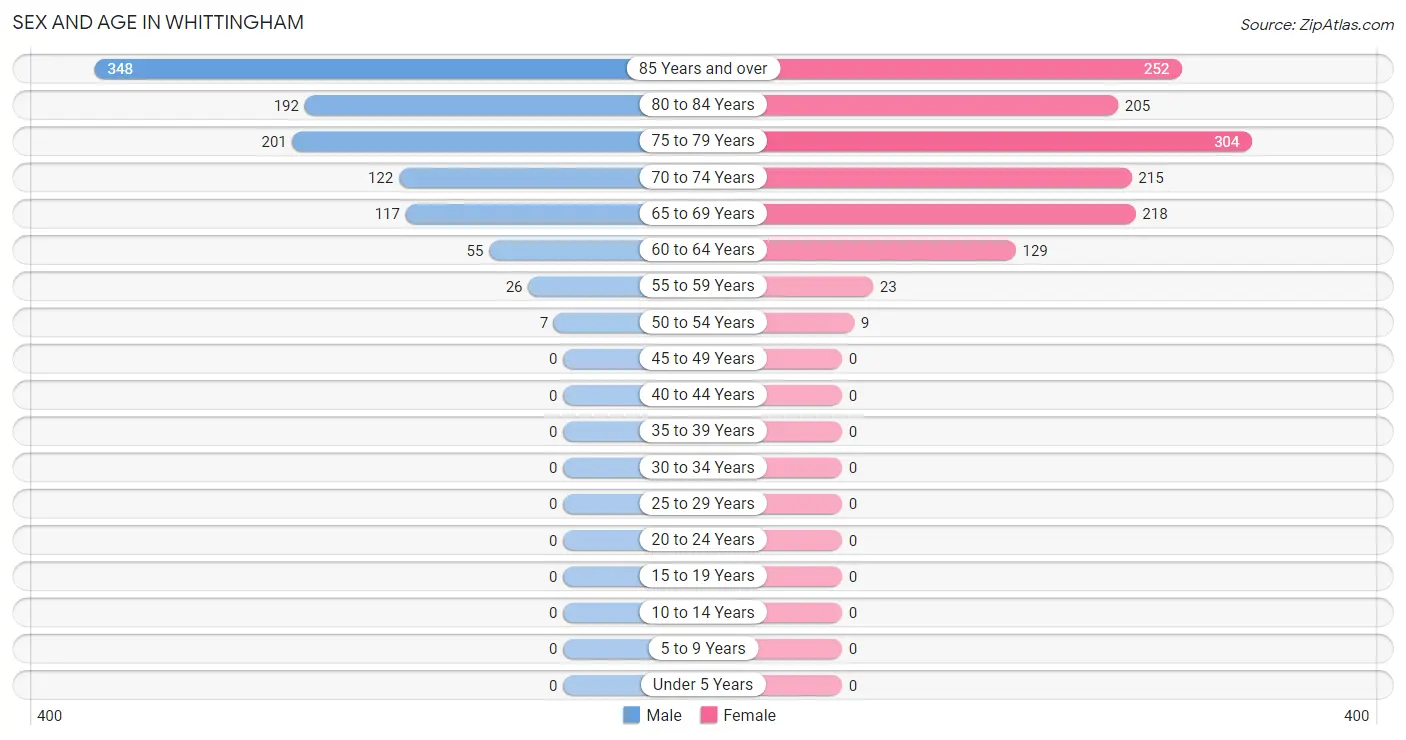
The most populous age groups in Whittingham are 85 Years and over (348 | 32.6%) for men and 75 to 79 Years (304 | 22.4%) for women.
| Age Bracket | Male | Female |
| Under 5 Years | 0 (0.0%) | 0 (0.0%) |
| 5 to 9 Years | 0 (0.0%) | 0 (0.0%) |
| 10 to 14 Years | 0 (0.0%) | 0 (0.0%) |
| 15 to 19 Years | 0 (0.0%) | 0 (0.0%) |
| 20 to 24 Years | 0 (0.0%) | 0 (0.0%) |
| 25 to 29 Years | 0 (0.0%) | 0 (0.0%) |
| 30 to 34 Years | 0 (0.0%) | 0 (0.0%) |
| 35 to 39 Years | 0 (0.0%) | 0 (0.0%) |
| 40 to 44 Years | 0 (0.0%) | 0 (0.0%) |
| 45 to 49 Years | 0 (0.0%) | 0 (0.0%) |
| 50 to 54 Years | 7 (0.7%) | 9 (0.7%) |
| 55 to 59 Years | 26 (2.4%) | 23 (1.7%) |
| 60 to 64 Years | 55 (5.1%) | 129 (9.5%) |
| 65 to 69 Years | 117 (11.0%) | 218 (16.1%) |
| 70 to 74 Years | 122 (11.4%) | 215 (15.9%) |
| 75 to 79 Years | 201 (18.8%) | 304 (22.4%) |
| 80 to 84 Years | 192 (18.0%) | 205 (15.1%) |
| 85 Years and over | 348 (32.6%) | 252 (18.6%) |
| Total | 1,068 (100.0%) | 1,355 (100.0%) |
Families and Households in Whittingham
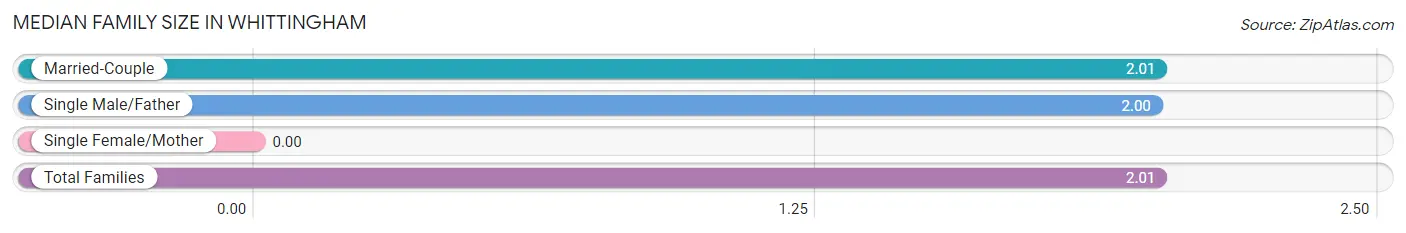
Median Family Size in Whittingham
| Family Type | # Families | Family Size |
| Married-Couple | 859 (99.2%) | 2.01 |
| Single Male/Father | 7 (0.8%) | 2.00 |
| Single Female/Mother | 0 (0.0%) | - |
| Total Families | 866 (100.0%) | 2.01 |
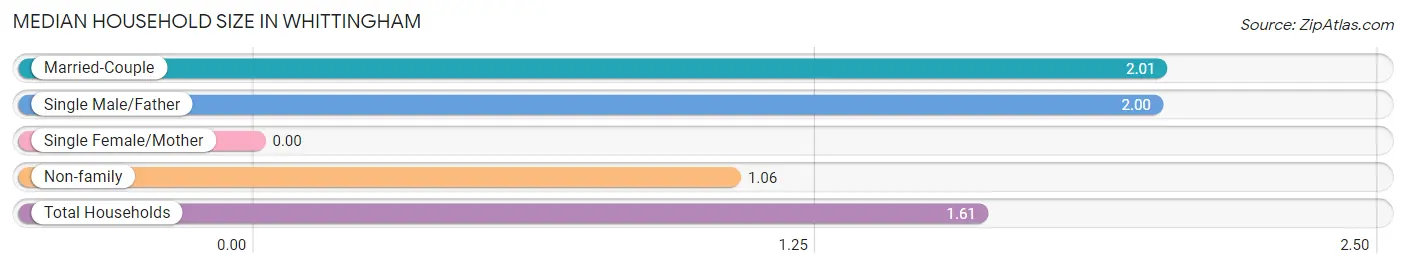
Median Household Size in Whittingham
| Household Type | # Households | Household Size |
| Married-Couple | 859 (57.0%) | 2.01 |
| Single Male/Father | 7 (0.5%) | 2.00 |
| Single Female/Mother | 0 (0.0%) | - |
| Non-family | 642 (42.6%) | 1.06 |
| Total Households | 1,508 (100.0%) | 1.61 |
Household Size by Marriage Status in Whittingham
Out of a total of 1,508 households in Whittingham, 866 (57.4%) are family households, while 642 (42.6%) are nonfamily households. The most numerous type of family households are 2-person households, comprising 838, and the most common type of nonfamily households are 1-person households, comprising 606.
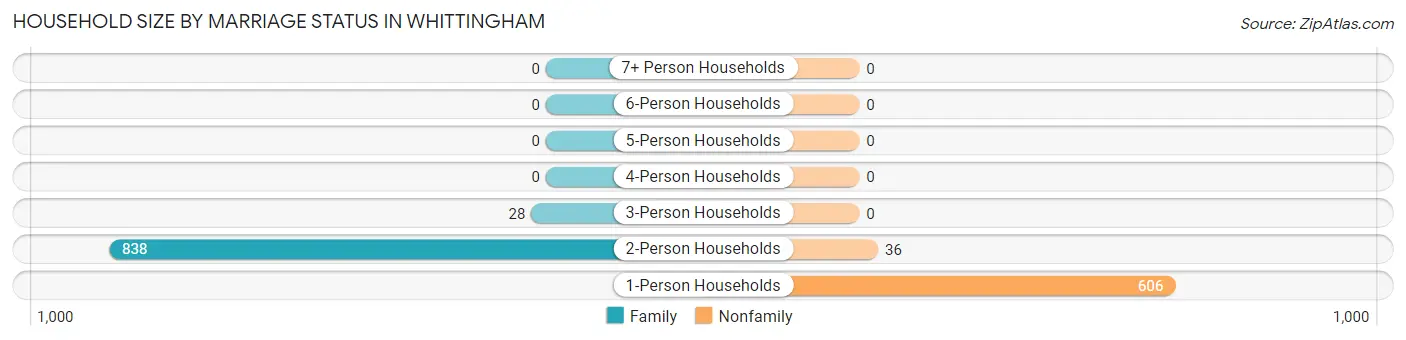
| Household Size | Family Households | Nonfamily Households |
| 1-Person Households | - | 606 (40.2%) |
| 2-Person Households | 838 (55.6%) | 36 (2.4%) |
| 3-Person Households | 28 (1.9%) | 0 (0.0%) |
| 4-Person Households | 0 (0.0%) | 0 (0.0%) |
| 5-Person Households | 0 (0.0%) | 0 (0.0%) |
| 6-Person Households | 0 (0.0%) | 0 (0.0%) |
| 7+ Person Households | 0 (0.0%) | 0 (0.0%) |
| Total | 866 (57.4%) | 642 (42.6%) |
Female Fertility in Whittingham
Fertility by Age in Whittingham
| Age Bracket | Women with Births | Births / 1,000 Women |
| 15 to 19 years | 0 (0.0%) | 0.0 |
| 20 to 34 years | 0 (0.0%) | 0.0 |
| 35 to 50 years | 0 (0.0%) | 0.0 |
| Total | 0 (0.0%) | 0.0 |
Fertility by Age by Marriage Status in Whittingham
| Age Bracket | Married | Unmarried |
| 15 to 19 years | 0 (0.0%) | 0 (0.0%) |
| 20 to 34 years | 0 (0.0%) | 0 (0.0%) |
| 35 to 50 years | 0 (0.0%) | 0 (0.0%) |
| Total | 0 (0.0%) | 0 (0.0%) |
Fertility by Education in Whittingham
| Educational Attainment | Women with Births | Births / 1,000 Women |
| Less than High School | 0 (0.0%) | 0.0 |
| High School Diploma | 0 (0.0%) | 0.0 |
| College or Associate's Degree | 0 (0.0%) | 0.0 |
| Bachelor's Degree | 0 (0.0%) | 0.0 |
| Graduate Degree | 0 (0.0%) | 0.0 |
| Total | 0 (0.0%) | 0.0 |
Fertility by Education by Marriage Status in Whittingham
| Educational Attainment | Married | Unmarried |
| Less than High School | 0 (0.0%) | 0 (0.0%) |
| High School Diploma | 0 (0.0%) | 0 (0.0%) |
| College or Associate's Degree | 0 (0.0%) | 0 (0.0%) |
| Bachelor's Degree | 0 (0.0%) | 0 (0.0%) |
| Graduate Degree | 0 (0.0%) | 0 (0.0%) |
| Total | 0 (0.0%) | 0 (0.0%) |
Employment Characteristics in Whittingham
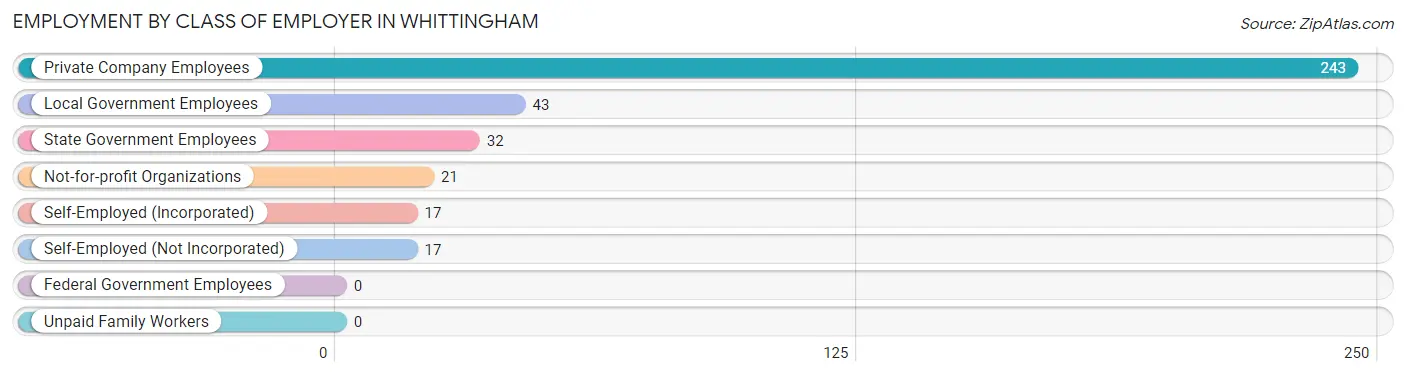
Employment by Class of Employer in Whittingham
Among the 373 employed individuals in Whittingham, private company employees (243 | 65.1%), local government employees (43 | 11.5%), and state government employees (32 | 8.6%) make up the most common classes of employment.
| Employer Class | # Employees | % Employees |
| Private Company Employees | 243 | 65.1% |
| Self-Employed (Incorporated) | 17 | 4.6% |
| Self-Employed (Not Incorporated) | 17 | 4.6% |
| Not-for-profit Organizations | 21 | 5.6% |
| Local Government Employees | 43 | 11.5% |
| State Government Employees | 32 | 8.6% |
| Federal Government Employees | 0 | 0.0% |
| Unpaid Family Workers | 0 | 0.0% |
| Total | 373 | 100.0% |
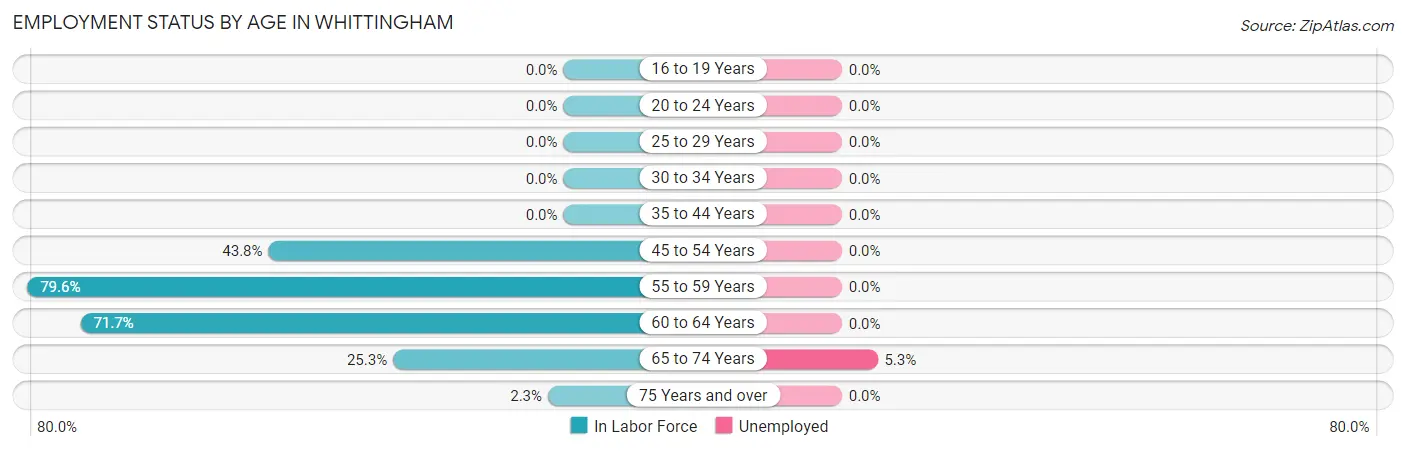
Employment Status by Age in Whittingham
According to the labor force statistics for Whittingham, out of the total population over 16 years of age (2,423), 15.8% or 383 individuals are in the labor force, with 2.4% or 9 of them unemployed. The age group with the highest labor force participation rate is 55 to 59 years, with 79.6% or 39 individuals in the labor force. Within the labor force, the 65 to 74 years age range has the highest percentage of unemployed individuals, with 5.3% or 9 of them being unemployed.
| Age Bracket | In Labor Force | Unemployed |
| 16 to 19 Years | 0 (0.0%) | 0 (0.0%) |
| 20 to 24 Years | 0 (0.0%) | 0 (0.0%) |
| 25 to 29 Years | 0 (0.0%) | 0 (0.0%) |
| 30 to 34 Years | 0 (0.0%) | 0 (0.0%) |
| 35 to 44 Years | 0 (0.0%) | 0 (0.0%) |
| 45 to 54 Years | 7 (43.8%) | 0 (0.0%) |
| 55 to 59 Years | 39 (79.6%) | 0 (0.0%) |
| 60 to 64 Years | 132 (71.7%) | 0 (0.0%) |
| 65 to 74 Years | 170 (25.3%) | 9 (5.3%) |
| 75 Years and over | 35 (2.3%) | 0 (0.0%) |
| Total | 383 (15.8%) | 9 (2.4%) |
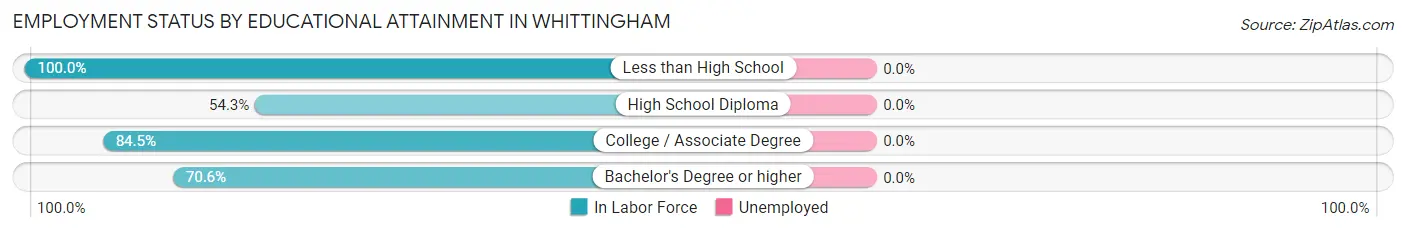
Employment Status by Educational Attainment in Whittingham
| Educational Attainment | In Labor Force | Unemployed |
| Less than High School | 25 (100.0%) | 0 (0.0%) |
| High School Diploma | 44 (54.3%) | 0 (0.0%) |
| College / Associate Degree | 49 (84.5%) | 0 (0.0%) |
| Bachelor's Degree or higher | 60 (70.6%) | 0 (0.0%) |
| Total | 178 (71.5%) | 0 (0.0%) |
Employment Occupations by Sex in Whittingham
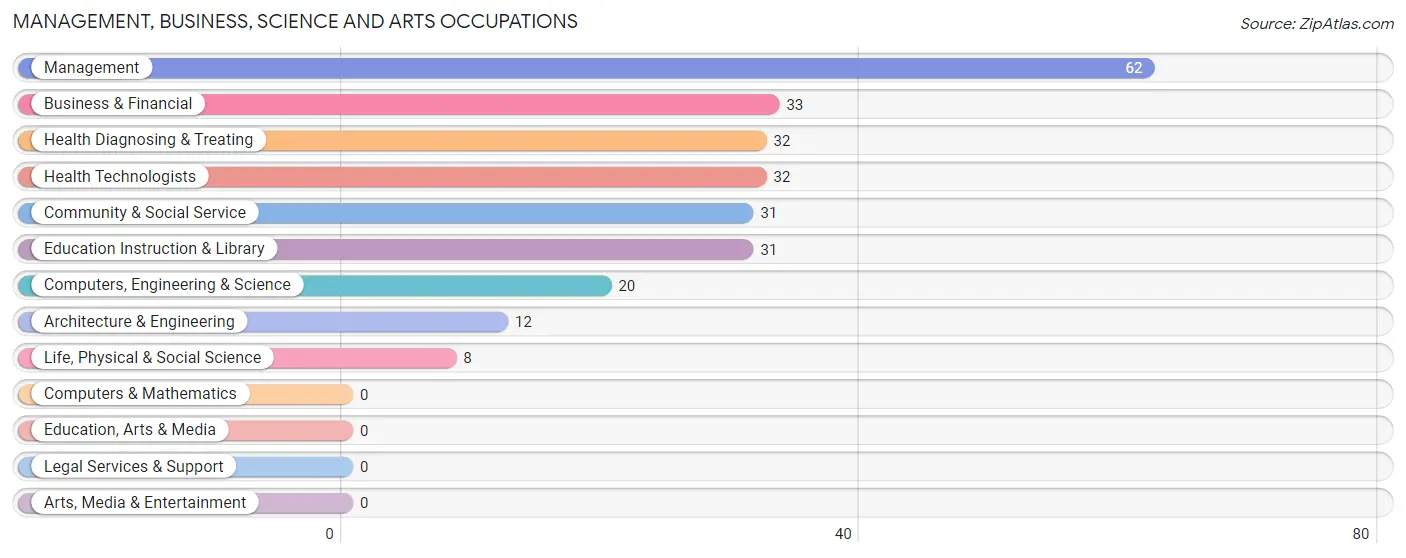
Management, Business, Science and Arts Occupations
The most common Management, Business, Science and Arts occupations in Whittingham are Management (62 | 16.6%), Business & Financial (33 | 8.8%), Health Diagnosing & Treating (32 | 8.6%), Health Technologists (32 | 8.6%), and Community & Social Service (31 | 8.3%).
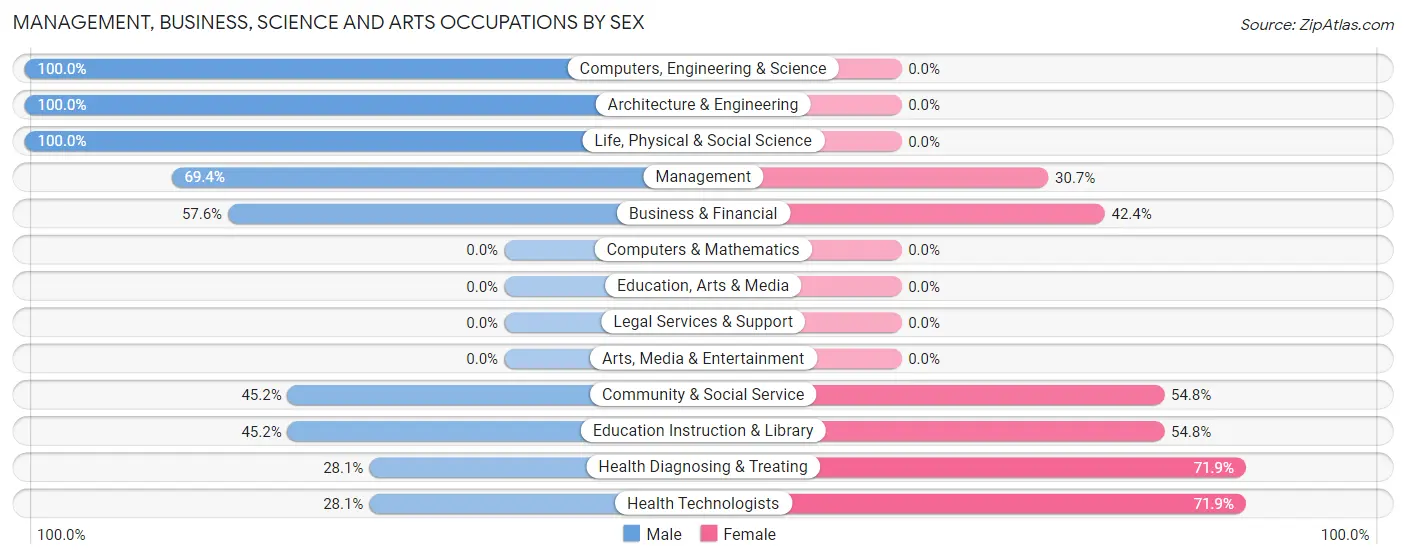
Management, Business, Science and Arts Occupations by Sex
Within the Management, Business, Science and Arts occupations in Whittingham, the most male-oriented occupations are Computers, Engineering & Science (100.0%), Architecture & Engineering (100.0%), and Life, Physical & Social Science (100.0%), while the most female-oriented occupations are Health Diagnosing & Treating (71.9%), Health Technologists (71.9%), and Community & Social Service (54.8%).
| Occupation | Male | Female |
| Management | 43 (69.4%) | 19 (30.6%) |
| Business & Financial | 19 (57.6%) | 14 (42.4%) |
| Computers, Engineering & Science | 20 (100.0%) | 0 (0.0%) |
| Computers & Mathematics | 0 (0.0%) | 0 (0.0%) |
| Architecture & Engineering | 12 (100.0%) | 0 (0.0%) |
| Life, Physical & Social Science | 8 (100.0%) | 0 (0.0%) |
| Community & Social Service | 14 (45.2%) | 17 (54.8%) |
| Education, Arts & Media | 0 (0.0%) | 0 (0.0%) |
| Legal Services & Support | 0 (0.0%) | 0 (0.0%) |
| Education Instruction & Library | 14 (45.2%) | 17 (54.8%) |
| Arts, Media & Entertainment | 0 (0.0%) | 0 (0.0%) |
| Health Diagnosing & Treating | 9 (28.1%) | 23 (71.9%) |
| Health Technologists | 9 (28.1%) | 23 (71.9%) |
| Total (Category) | 105 (59.0%) | 73 (41.0%) |
| Total (Overall) | 218 (58.5%) | 155 (41.5%) |
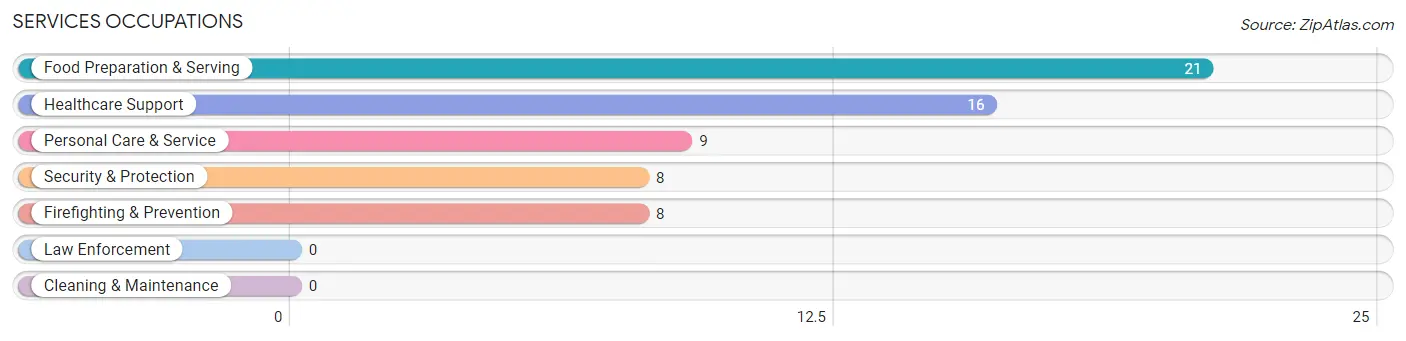
Services Occupations
The most common Services occupations in Whittingham are Food Preparation & Serving (21 | 5.6%), Healthcare Support (16 | 4.3%), Personal Care & Service (9 | 2.4%), Security & Protection (8 | 2.1%), and Firefighting & Prevention (8 | 2.1%).
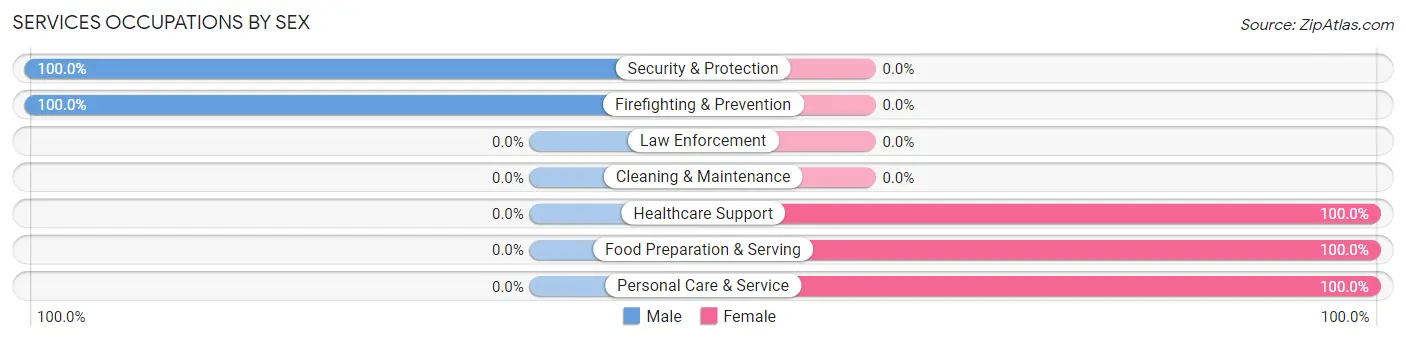
Services Occupations by Sex
Within the Services occupations in Whittingham, the most male-oriented occupations are Security & Protection (100.0%), and Firefighting & Prevention (100.0%), while the most female-oriented occupations are Healthcare Support (100.0%), Food Preparation & Serving (100.0%), and Personal Care & Service (100.0%).
| Occupation | Male | Female |
| Healthcare Support | 0 (0.0%) | 16 (100.0%) |
| Security & Protection | 8 (100.0%) | 0 (0.0%) |
| Firefighting & Prevention | 8 (100.0%) | 0 (0.0%) |
| Law Enforcement | 0 (0.0%) | 0 (0.0%) |
| Food Preparation & Serving | 0 (0.0%) | 21 (100.0%) |
| Cleaning & Maintenance | 0 (0.0%) | 0 (0.0%) |
| Personal Care & Service | 0 (0.0%) | 9 (100.0%) |
| Total (Category) | 8 (14.8%) | 46 (85.2%) |
| Total (Overall) | 218 (58.5%) | 155 (41.5%) |
Sales and Office Occupations
The most common Sales and Office occupations in Whittingham are Office & Administration (46 | 12.3%), and Sales & Related (24 | 6.4%).
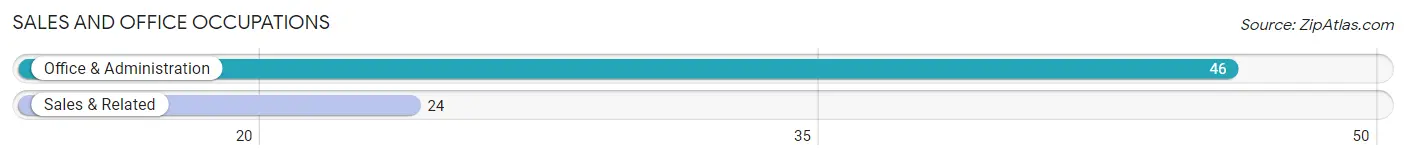
Sales and Office Occupations by Sex
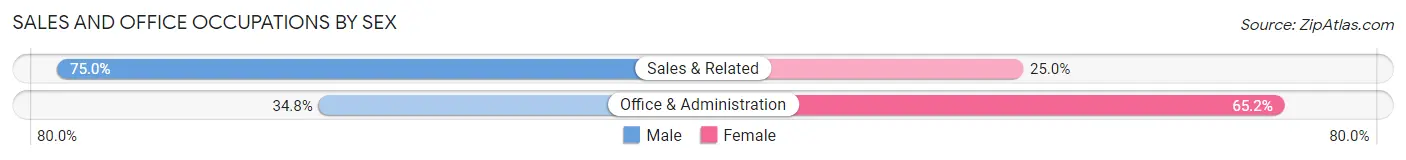
| Occupation | Male | Female |
| Sales & Related | 18 (75.0%) | 6 (25.0%) |
| Office & Administration | 16 (34.8%) | 30 (65.2%) |
| Total (Category) | 34 (48.6%) | 36 (51.4%) |
| Total (Overall) | 218 (58.5%) | 155 (41.5%) |
Natural Resources, Construction and Maintenance Occupations
The most common Natural Resources, Construction and Maintenance occupations in Whittingham are , and Construction & Extraction (13 | 3.5%).
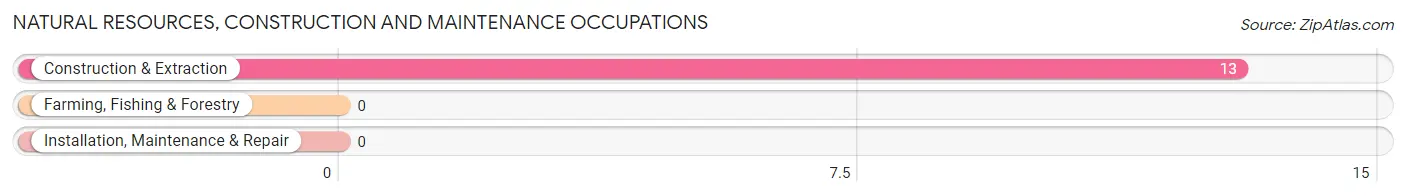
Natural Resources, Construction and Maintenance Occupations by Sex
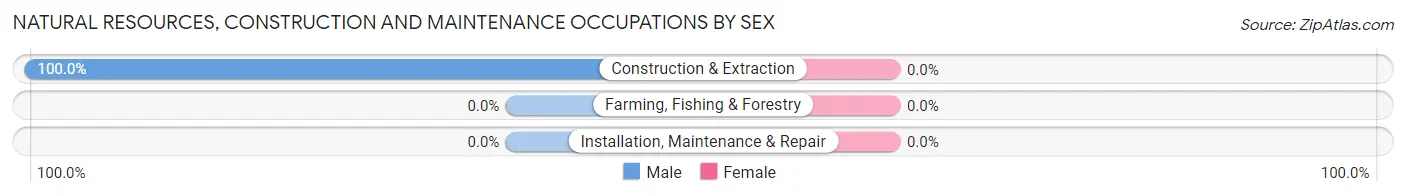
| Occupation | Male | Female |
| Farming, Fishing & Forestry | 0 (0.0%) | 0 (0.0%) |
| Construction & Extraction | 13 (100.0%) | 0 (0.0%) |
| Installation, Maintenance & Repair | 0 (0.0%) | 0 (0.0%) |
| Total (Category) | 13 (100.0%) | 0 (0.0%) |
| Total (Overall) | 218 (58.5%) | 155 (41.5%) |
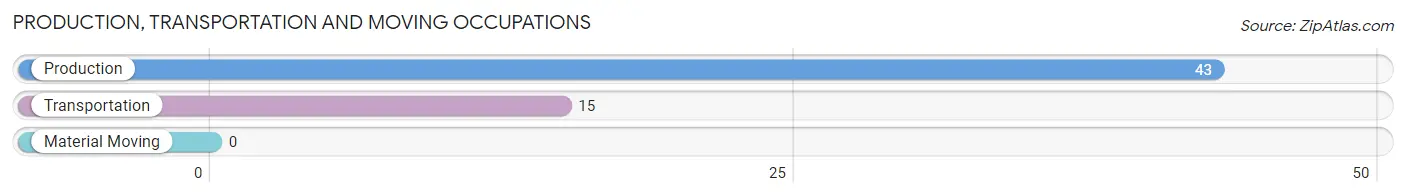
Production, Transportation and Moving Occupations
The most common Production, Transportation and Moving occupations in Whittingham are Production (43 | 11.5%), and Transportation (15 | 4.0%).
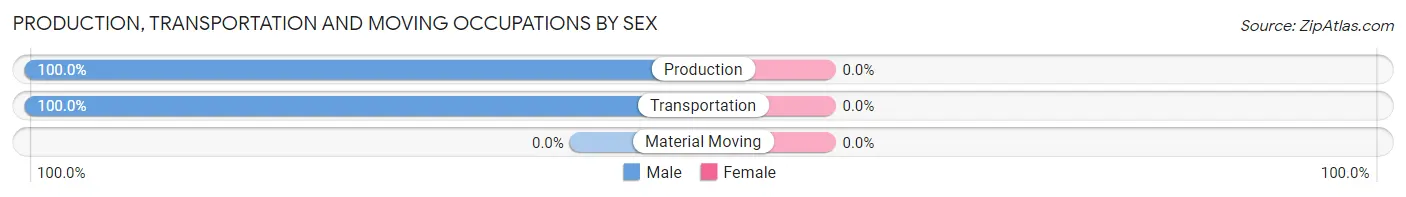
Production, Transportation and Moving Occupations by Sex
| Occupation | Male | Female |
| Production | 43 (100.0%) | 0 (0.0%) |
| Transportation | 15 (100.0%) | 0 (0.0%) |
| Material Moving | 0 (0.0%) | 0 (0.0%) |
| Total (Category) | 58 (100.0%) | 0 (0.0%) |
| Total (Overall) | 218 (58.5%) | 155 (41.5%) |
Employment Industries by Sex in Whittingham
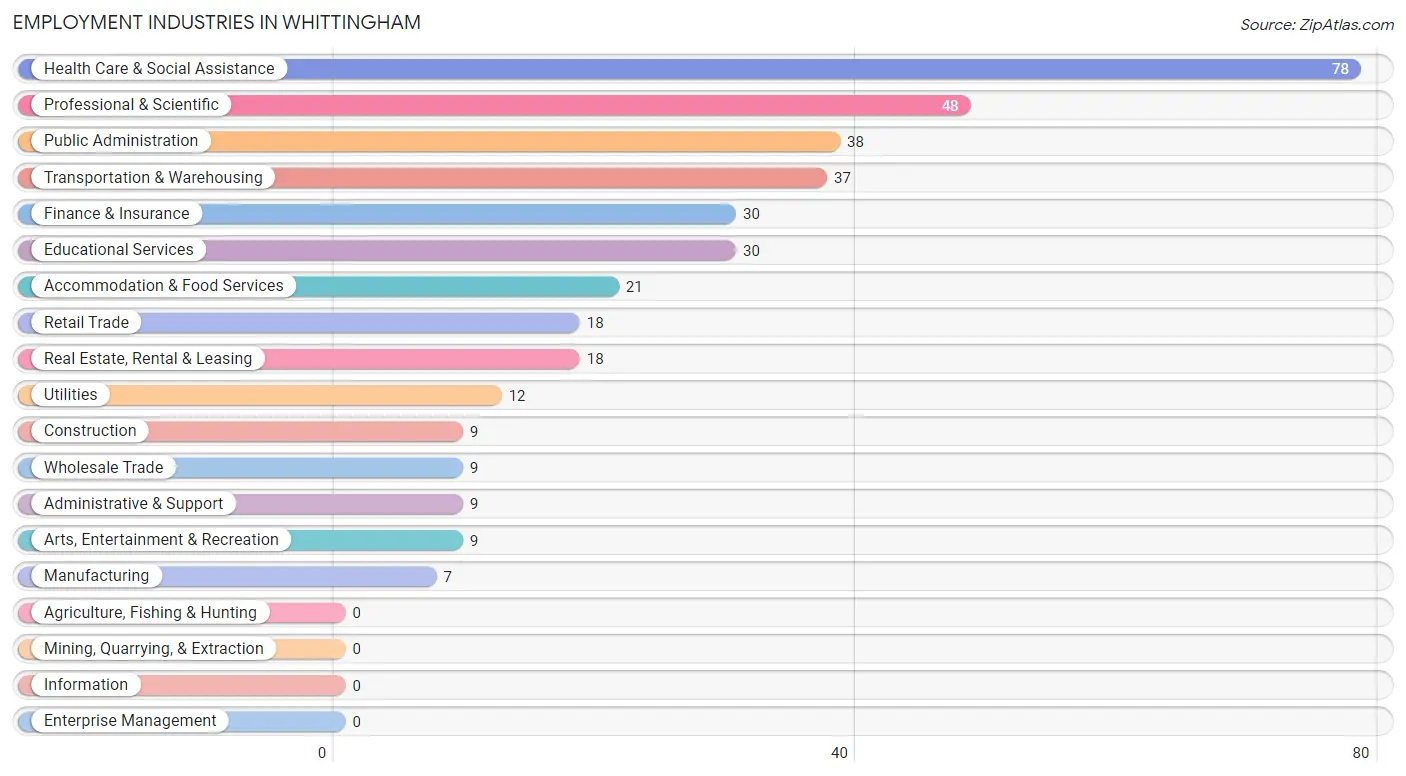
Employment Industries in Whittingham
The major employment industries in Whittingham include Health Care & Social Assistance (78 | 20.9%), Professional & Scientific (48 | 12.9%), Public Administration (38 | 10.2%), Transportation & Warehousing (37 | 9.9%), and Finance & Insurance (30 | 8.0%).
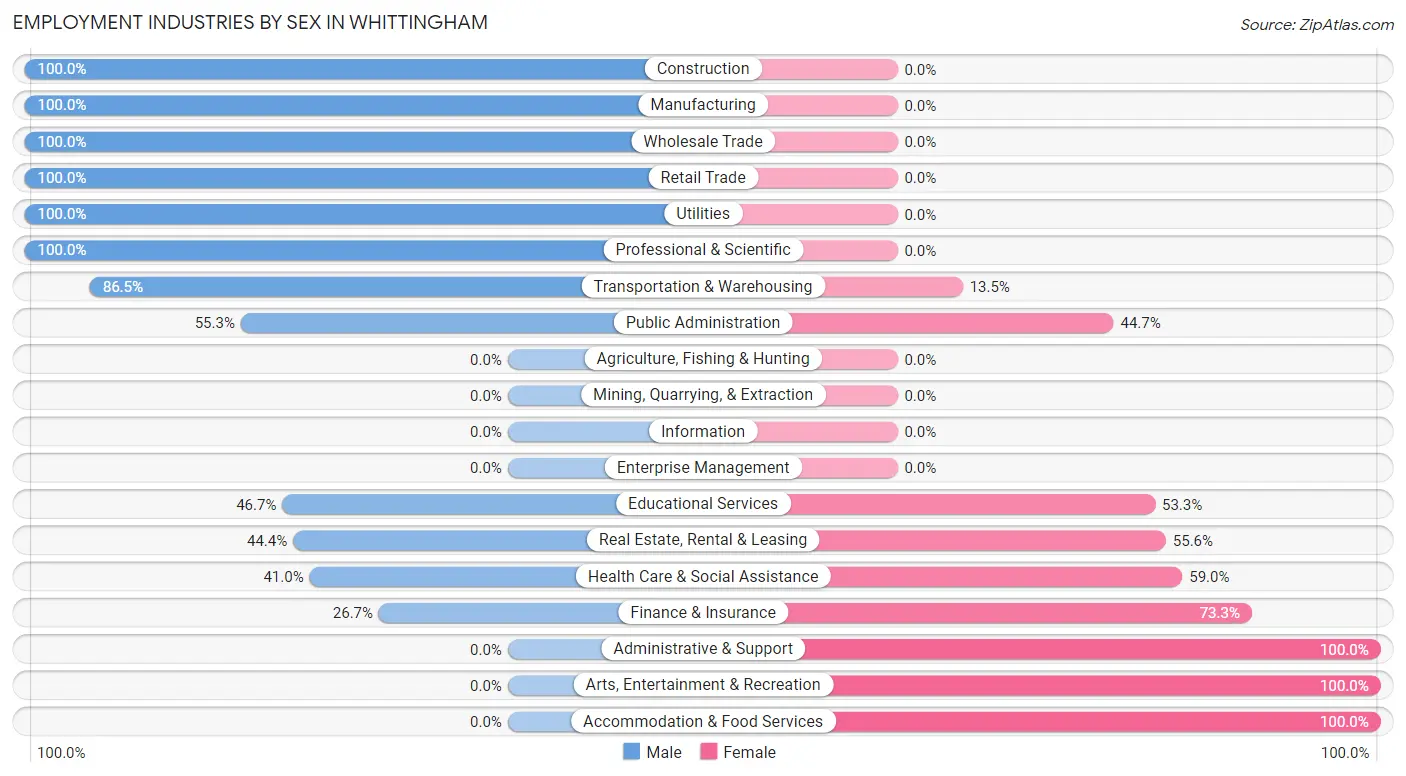
Employment Industries by Sex in Whittingham
The Whittingham industries that see more men than women are Construction (100.0%), Manufacturing (100.0%), and Wholesale Trade (100.0%), whereas the industries that tend to have a higher number of women are Administrative & Support (100.0%), Arts, Entertainment & Recreation (100.0%), and Accommodation & Food Services (100.0%).
| Industry | Male | Female |
| Agriculture, Fishing & Hunting | 0 (0.0%) | 0 (0.0%) |
| Mining, Quarrying, & Extraction | 0 (0.0%) | 0 (0.0%) |
| Construction | 9 (100.0%) | 0 (0.0%) |
| Manufacturing | 7 (100.0%) | 0 (0.0%) |
| Wholesale Trade | 9 (100.0%) | 0 (0.0%) |
| Retail Trade | 18 (100.0%) | 0 (0.0%) |
| Transportation & Warehousing | 32 (86.5%) | 5 (13.5%) |
| Utilities | 12 (100.0%) | 0 (0.0%) |
| Information | 0 (0.0%) | 0 (0.0%) |
| Finance & Insurance | 8 (26.7%) | 22 (73.3%) |
| Real Estate, Rental & Leasing | 8 (44.4%) | 10 (55.6%) |
| Professional & Scientific | 48 (100.0%) | 0 (0.0%) |
| Enterprise Management | 0 (0.0%) | 0 (0.0%) |
| Administrative & Support | 0 (0.0%) | 9 (100.0%) |
| Educational Services | 14 (46.7%) | 16 (53.3%) |
| Health Care & Social Assistance | 32 (41.0%) | 46 (59.0%) |
| Arts, Entertainment & Recreation | 0 (0.0%) | 9 (100.0%) |
| Accommodation & Food Services | 0 (0.0%) | 21 (100.0%) |
| Public Administration | 21 (55.3%) | 17 (44.7%) |
| Total | 218 (58.5%) | 155 (41.5%) |
Education in Whittingham
School Enrollment in Whittingham
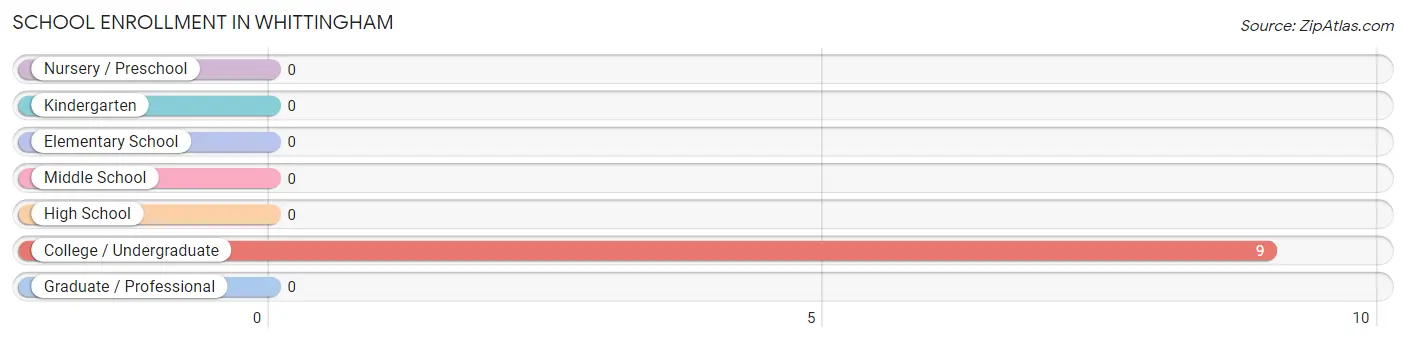
| School Level | # Students | % Students |
| Nursery / Preschool | 0 | 0.0% |
| Kindergarten | 0 | 0.0% |
| Elementary School | 0 | 0.0% |
| Middle School | 0 | 0.0% |
| High School | 0 | 0.0% |
| College / Undergraduate | 9 | 100.0% |
| Graduate / Professional | 0 | 0.0% |
| Total | 9 | 100.0% |
School Enrollment by Age by Funding Source in Whittingham
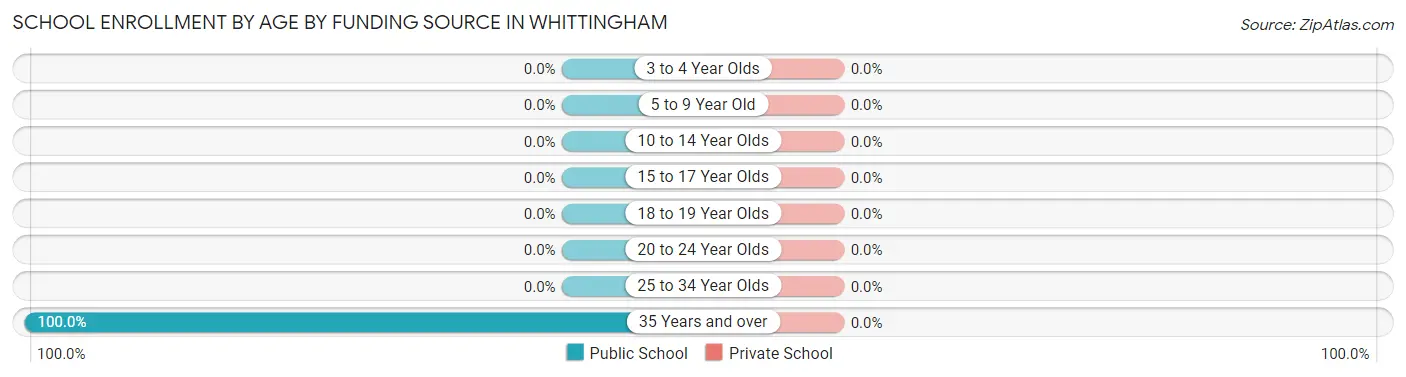
| Age Bracket | Public School | Private School |
| 3 to 4 Year Olds | 0 (0.0%) | 0 (0.0%) |
| 5 to 9 Year Old | 0 (0.0%) | 0 (0.0%) |
| 10 to 14 Year Olds | 0 (0.0%) | 0 (0.0%) |
| 15 to 17 Year Olds | 0 (0.0%) | 0 (0.0%) |
| 18 to 19 Year Olds | 0 (0.0%) | 0 (0.0%) |
| 20 to 24 Year Olds | 0 (0.0%) | 0 (0.0%) |
| 25 to 34 Year Olds | 0 (0.0%) | 0 (0.0%) |
| 35 Years and over | 9 (100.0%) | 0 (0.0%) |
| Total | 9 (100.0%) | 0 (0.0%) |
Educational Attainment by Field of Study in Whittingham
Education (329 | 31.9%), business (207 | 20.1%), social sciences (145 | 14.1%), science & technology (73 | 7.1%), and engineering (64 | 6.2%) are the most common fields of study among 1,031 individuals in Whittingham who have obtained a bachelor's degree or higher.
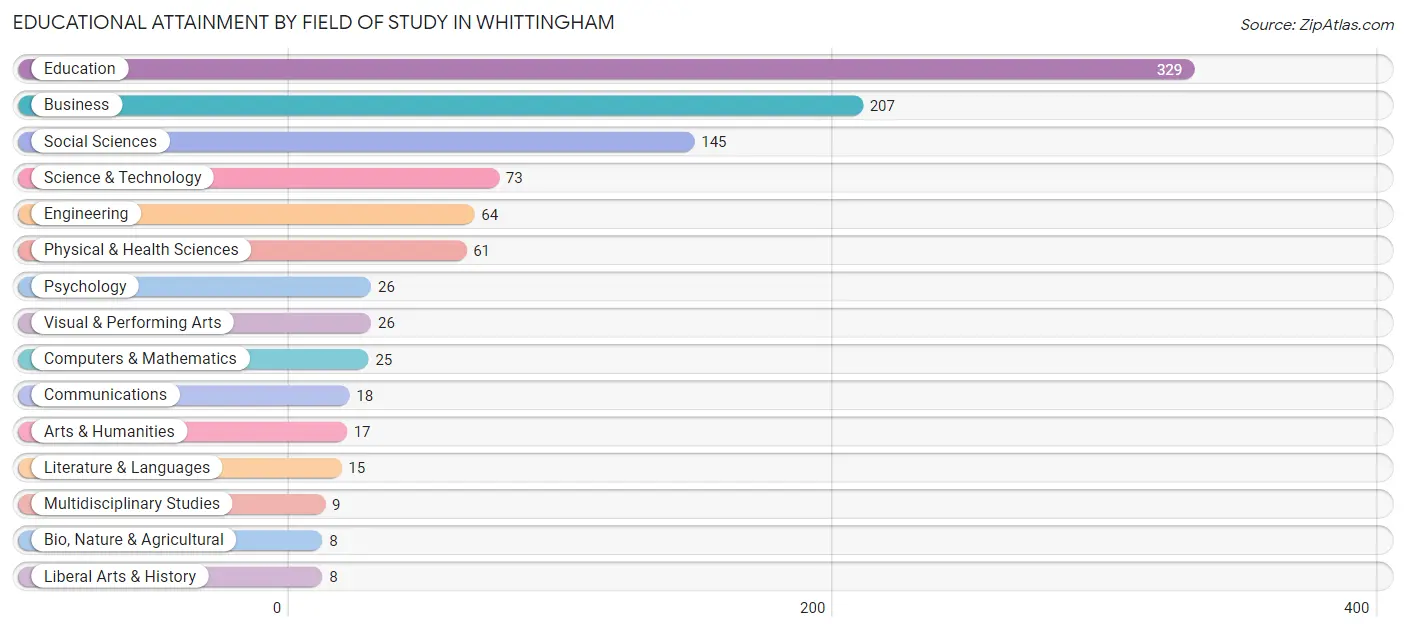
| Field of Study | # Graduates | % Graduates |
| Computers & Mathematics | 25 | 2.4% |
| Bio, Nature & Agricultural | 8 | 0.8% |
| Physical & Health Sciences | 61 | 5.9% |
| Psychology | 26 | 2.5% |
| Social Sciences | 145 | 14.1% |
| Engineering | 64 | 6.2% |
| Multidisciplinary Studies | 9 | 0.9% |
| Science & Technology | 73 | 7.1% |
| Business | 207 | 20.1% |
| Education | 329 | 31.9% |
| Literature & Languages | 15 | 1.5% |
| Liberal Arts & History | 8 | 0.8% |
| Visual & Performing Arts | 26 | 2.5% |
| Communications | 18 | 1.8% |
| Arts & Humanities | 17 | 1.7% |
| Total | 1,031 | 100.0% |
Transportation & Commute in Whittingham
Vehicle Availability by Sex in Whittingham
The most prevalent vehicle ownership categories in Whittingham are males with 2 vehicles (150, accounting for 68.8%) and females with 2 vehicles (85, making up 96.8%).
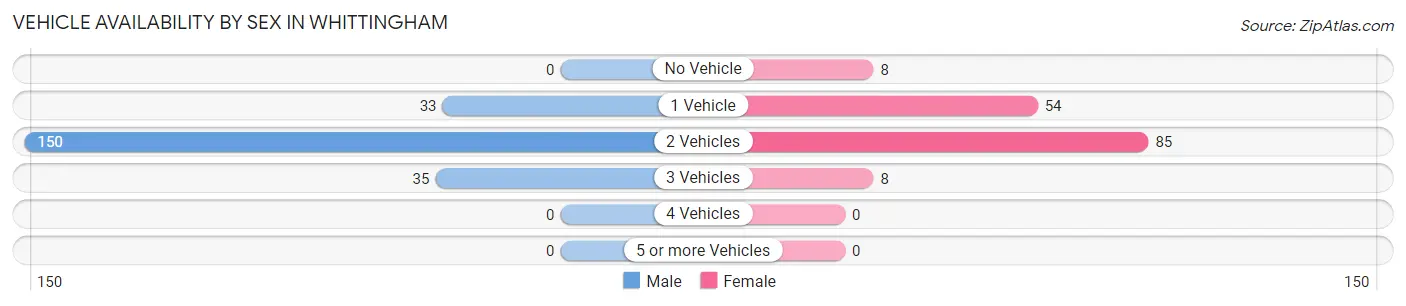
| Vehicles Available | Male | Female |
| No Vehicle | 0 (0.0%) | 8 (5.2%) |
| 1 Vehicle | 33 (15.1%) | 54 (34.8%) |
| 2 Vehicles | 150 (68.8%) | 85 (54.8%) |
| 3 Vehicles | 35 (16.1%) | 8 (5.2%) |
| 4 Vehicles | 0 (0.0%) | 0 (0.0%) |
| 5 or more Vehicles | 0 (0.0%) | 0 (0.0%) |
| Total | 218 (100.0%) | 155 (100.0%) |
Commute Time in Whittingham
The most frequently occuring commute durations in Whittingham are 15 to 19 minutes (63 commuters, 21.1%), 30 to 34 minutes (45 commuters, 15.1%), and 90 or more minutes (42 commuters, 14.1%).
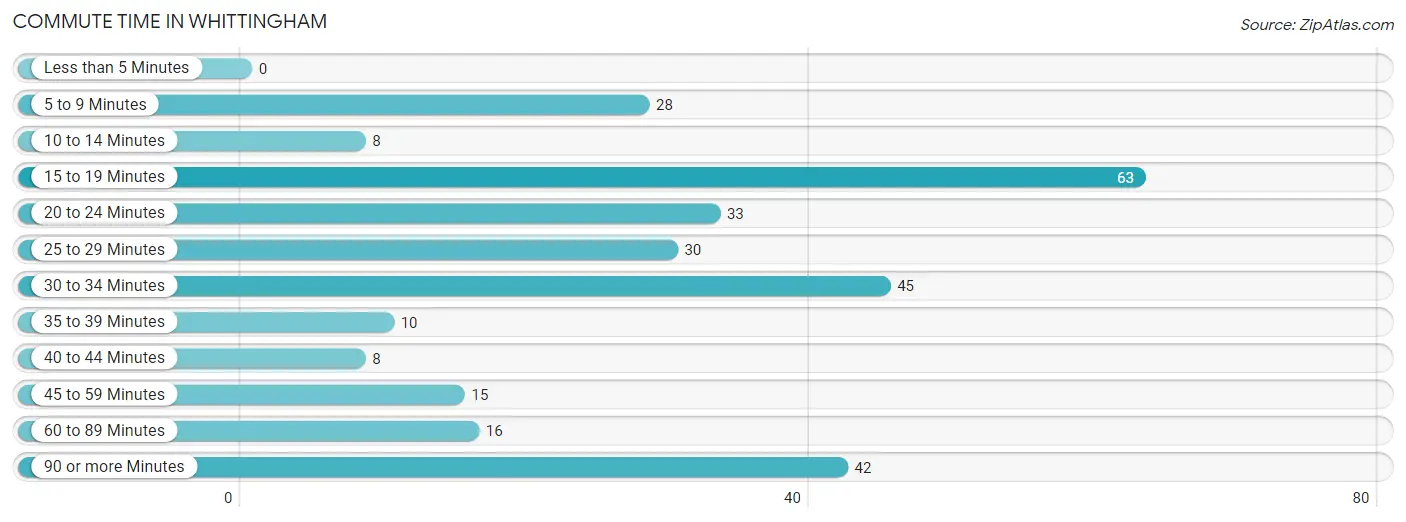
| Commute Time | # Commuters | % Commuters |
| Less than 5 Minutes | 0 | 0.0% |
| 5 to 9 Minutes | 28 | 9.4% |
| 10 to 14 Minutes | 8 | 2.7% |
| 15 to 19 Minutes | 63 | 21.1% |
| 20 to 24 Minutes | 33 | 11.1% |
| 25 to 29 Minutes | 30 | 10.1% |
| 30 to 34 Minutes | 45 | 15.1% |
| 35 to 39 Minutes | 10 | 3.4% |
| 40 to 44 Minutes | 8 | 2.7% |
| 45 to 59 Minutes | 15 | 5.0% |
| 60 to 89 Minutes | 16 | 5.4% |
| 90 or more Minutes | 42 | 14.1% |
Commute Time by Sex in Whittingham
The most common commute times in Whittingham are 15 to 19 minutes (48 commuters, 27.3%) for males and 30 to 34 minutes (28 commuters, 23.0%) for females.
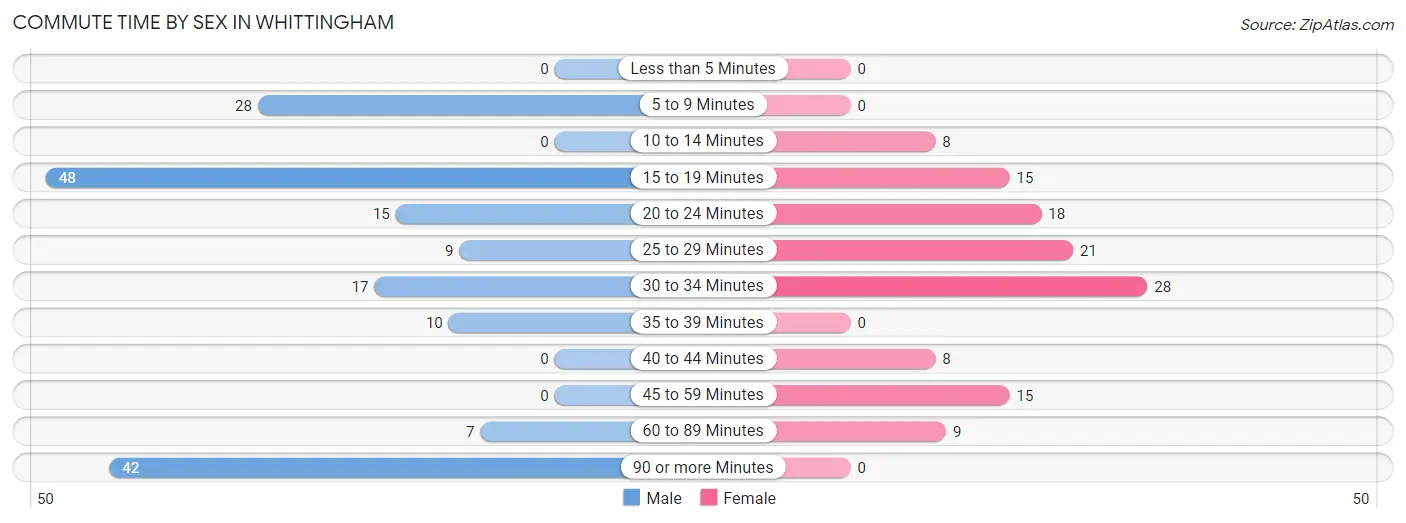
| Commute Time | Male | Female |
| Less than 5 Minutes | 0 (0.0%) | 0 (0.0%) |
| 5 to 9 Minutes | 28 (15.9%) | 0 (0.0%) |
| 10 to 14 Minutes | 0 (0.0%) | 8 (6.6%) |
| 15 to 19 Minutes | 48 (27.3%) | 15 (12.3%) |
| 20 to 24 Minutes | 15 (8.5%) | 18 (14.7%) |
| 25 to 29 Minutes | 9 (5.1%) | 21 (17.2%) |
| 30 to 34 Minutes | 17 (9.7%) | 28 (23.0%) |
| 35 to 39 Minutes | 10 (5.7%) | 0 (0.0%) |
| 40 to 44 Minutes | 0 (0.0%) | 8 (6.6%) |
| 45 to 59 Minutes | 0 (0.0%) | 15 (12.3%) |
| 60 to 89 Minutes | 7 (4.0%) | 9 (7.4%) |
| 90 or more Minutes | 42 (23.9%) | 0 (0.0%) |
Time of Departure to Work by Sex in Whittingham
The most frequent times of departure to work in Whittingham are 8:30 AM to 8:59 AM (33, 18.8%) for males and 9:00 AM to 9:59 AM (36, 29.5%) for females.
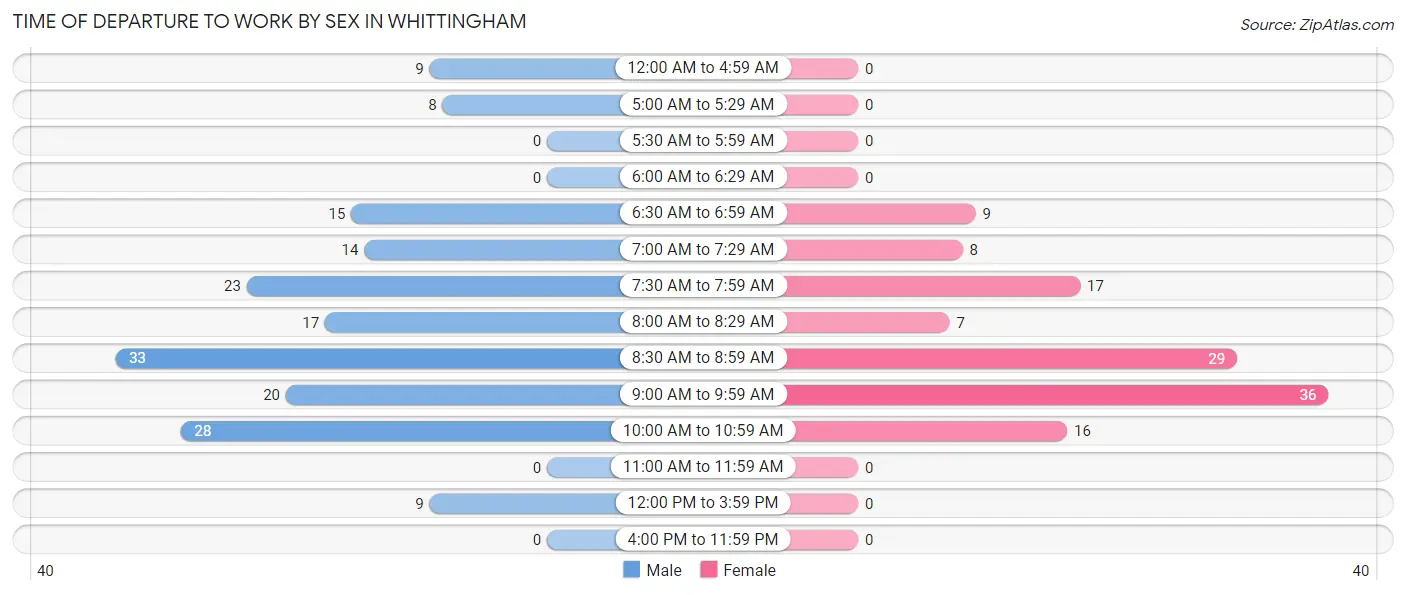
| Time of Departure | Male | Female |
| 12:00 AM to 4:59 AM | 9 (5.1%) | 0 (0.0%) |
| 5:00 AM to 5:29 AM | 8 (4.5%) | 0 (0.0%) |
| 5:30 AM to 5:59 AM | 0 (0.0%) | 0 (0.0%) |
| 6:00 AM to 6:29 AM | 0 (0.0%) | 0 (0.0%) |
| 6:30 AM to 6:59 AM | 15 (8.5%) | 9 (7.4%) |
| 7:00 AM to 7:29 AM | 14 (8.0%) | 8 (6.6%) |
| 7:30 AM to 7:59 AM | 23 (13.1%) | 17 (13.9%) |
| 8:00 AM to 8:29 AM | 17 (9.7%) | 7 (5.7%) |
| 8:30 AM to 8:59 AM | 33 (18.8%) | 29 (23.8%) |
| 9:00 AM to 9:59 AM | 20 (11.4%) | 36 (29.5%) |
| 10:00 AM to 10:59 AM | 28 (15.9%) | 16 (13.1%) |
| 11:00 AM to 11:59 AM | 0 (0.0%) | 0 (0.0%) |
| 12:00 PM to 3:59 PM | 9 (5.1%) | 0 (0.0%) |
| 4:00 PM to 11:59 PM | 0 (0.0%) | 0 (0.0%) |
| Total | 176 (100.0%) | 122 (100.0%) |
Housing Occupancy in Whittingham
Occupancy by Ownership in Whittingham
Of the total 1,508 dwellings in Whittingham, owner-occupied units account for 1,451 (96.2%), while renter-occupied units make up 57 (3.8%).
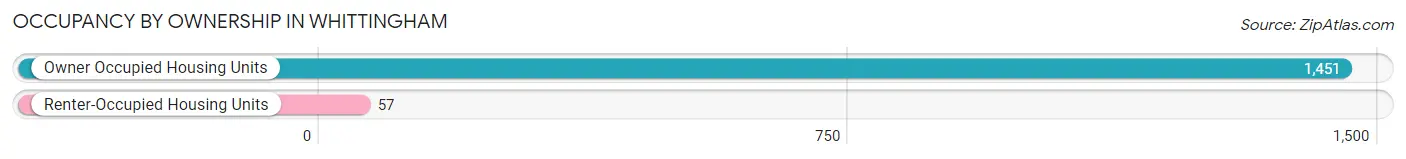
| Occupancy | # Housing Units | % Housing Units |
| Owner Occupied Housing Units | 1,451 | 96.2% |
| Renter-Occupied Housing Units | 57 | 3.8% |
| Total Occupied Housing Units | 1,508 | 100.0% |
Occupancy by Household Size in Whittingham
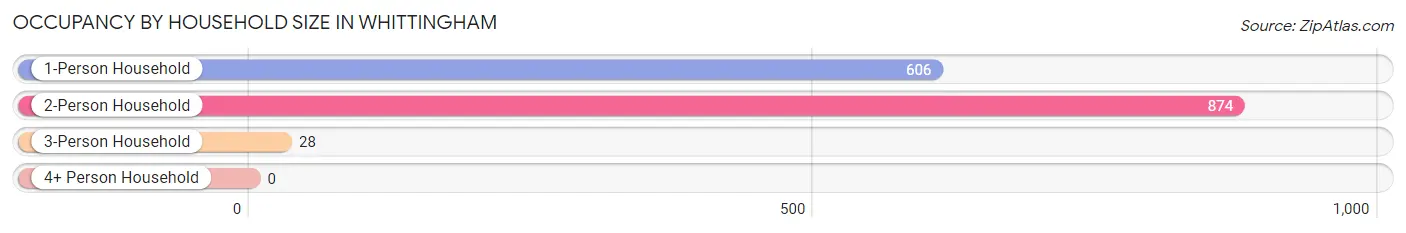
| Household Size | # Housing Units | % Housing Units |
| 1-Person Household | 606 | 40.2% |
| 2-Person Household | 874 | 58.0% |
| 3-Person Household | 28 | 1.9% |
| 4+ Person Household | 0 | 0.0% |
| Total Housing Units | 1,508 | 100.0% |
Occupancy by Ownership by Household Size in Whittingham
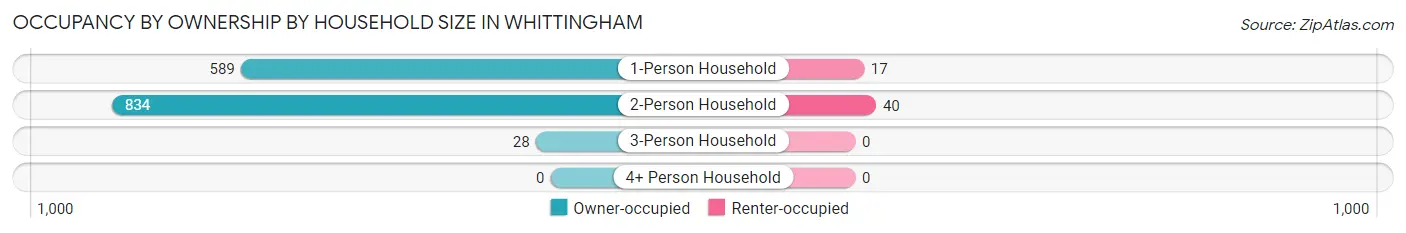
| Household Size | Owner-occupied | Renter-occupied |
| 1-Person Household | 589 (97.2%) | 17 (2.8%) |
| 2-Person Household | 834 (95.4%) | 40 (4.6%) |
| 3-Person Household | 28 (100.0%) | 0 (0.0%) |
| 4+ Person Household | 0 (0.0%) | 0 (0.0%) |
| Total Housing Units | 1,451 (96.2%) | 57 (3.8%) |
Occupancy by Educational Attainment in Whittingham
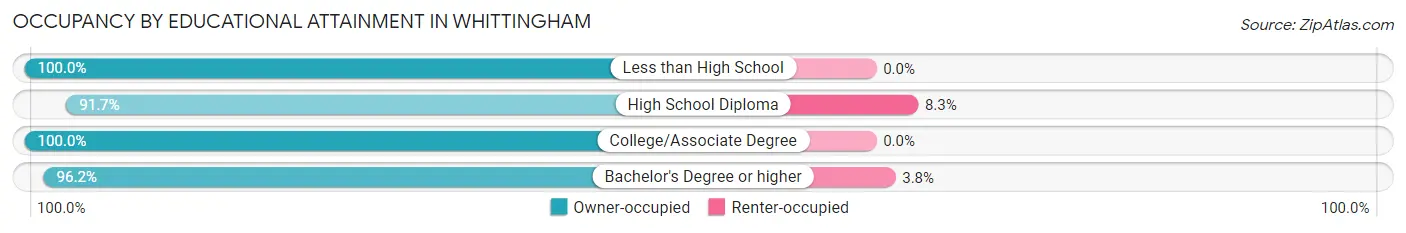
| Household Size | Owner-occupied | Renter-occupied |
| Less than High School | 15 (100.0%) | 0 (0.0%) |
| High School Diploma | 354 (91.7%) | 32 (8.3%) |
| College/Associate Degree | 447 (100.0%) | 0 (0.0%) |
| Bachelor's Degree or higher | 635 (96.2%) | 25 (3.8%) |
Occupancy by Age of Householder in Whittingham
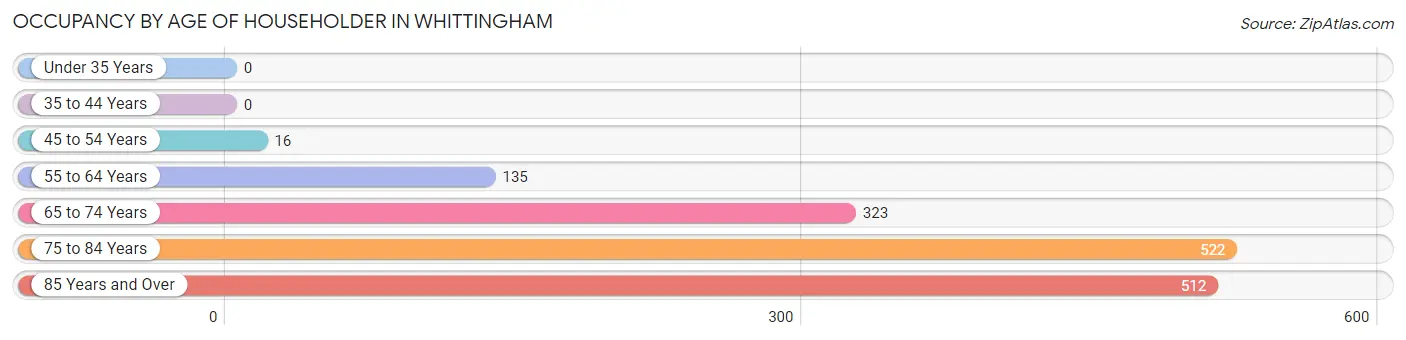
| Age Bracket | # Households | % Households |
| Under 35 Years | 0 | 0.0% |
| 35 to 44 Years | 0 | 0.0% |
| 45 to 54 Years | 16 | 1.1% |
| 55 to 64 Years | 135 | 8.9% |
| 65 to 74 Years | 323 | 21.4% |
| 75 to 84 Years | 522 | 34.6% |
| 85 Years and Over | 512 | 34.0% |
| Total | 1,508 | 100.0% |
Housing Finances in Whittingham
Median Income by Occupancy in Whittingham
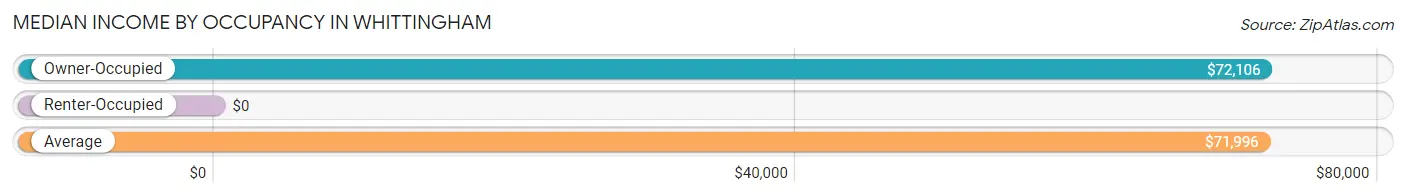
| Occupancy Type | # Households | Median Income |
| Owner-Occupied | 1,451 (96.2%) | $72,106 |
| Renter-Occupied | 57 (3.8%) | $0 |
| Average | 1,508 (100.0%) | $71,996 |
Occupancy by Householder Income Bracket in Whittingham
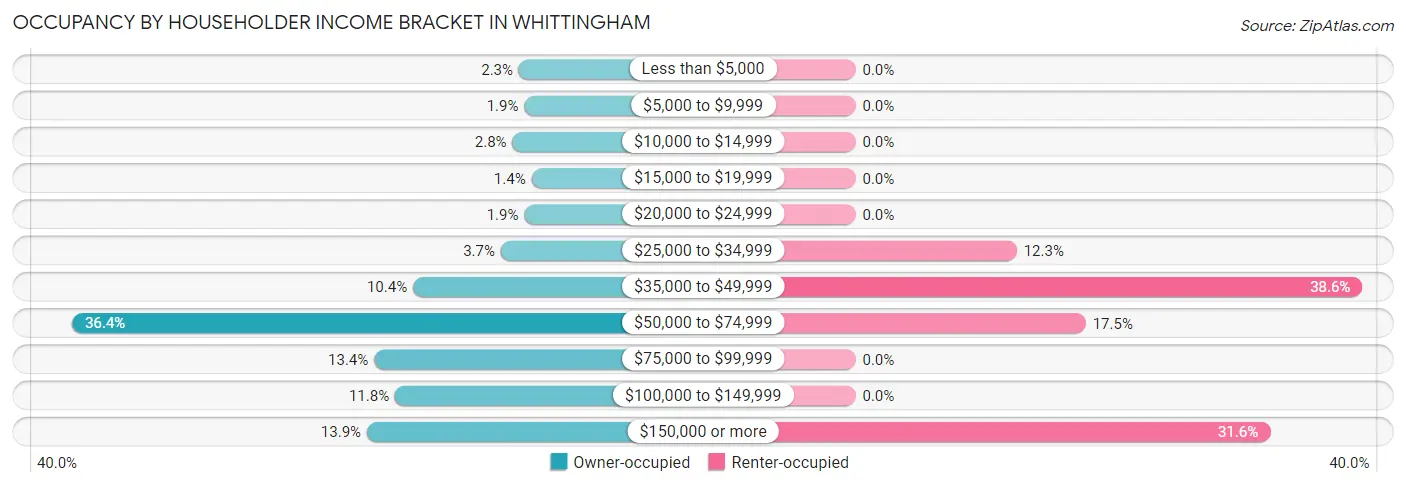
| Income Bracket | Owner-occupied | Renter-occupied |
| Less than $5,000 | 34 (2.3%) | 0 (0.0%) |
| $5,000 to $9,999 | 28 (1.9%) | 0 (0.0%) |
| $10,000 to $14,999 | 41 (2.8%) | 0 (0.0%) |
| $15,000 to $19,999 | 20 (1.4%) | 0 (0.0%) |
| $20,000 to $24,999 | 28 (1.9%) | 0 (0.0%) |
| $25,000 to $34,999 | 54 (3.7%) | 7 (12.3%) |
| $35,000 to $49,999 | 151 (10.4%) | 22 (38.6%) |
| $50,000 to $74,999 | 528 (36.4%) | 10 (17.5%) |
| $75,000 to $99,999 | 194 (13.4%) | 0 (0.0%) |
| $100,000 to $149,999 | 171 (11.8%) | 0 (0.0%) |
| $150,000 or more | 202 (13.9%) | 18 (31.6%) |
| Total | 1,451 (100.0%) | 57 (100.0%) |
Monthly Housing Cost Tiers in Whittingham
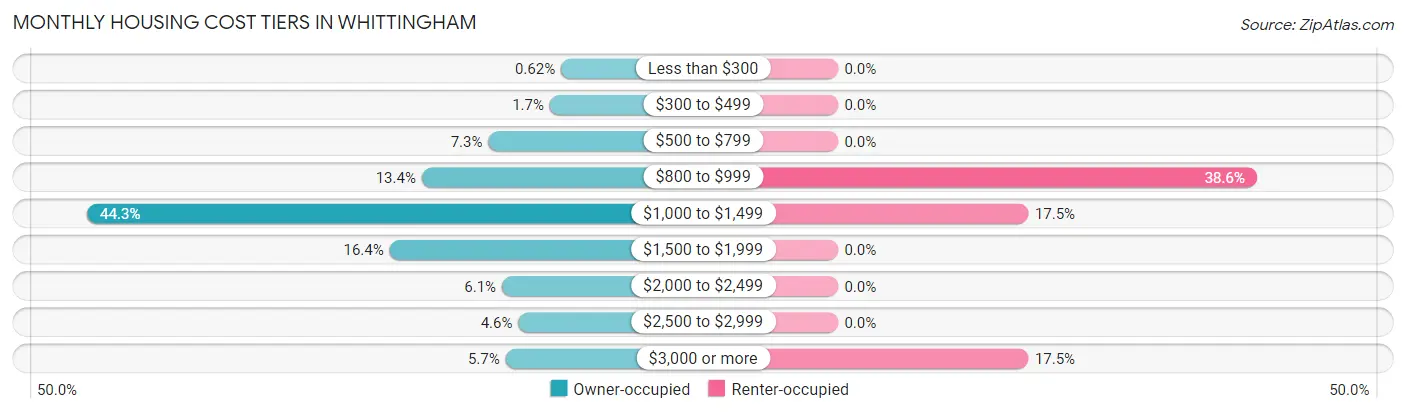
| Monthly Cost | Owner-occupied | Renter-occupied |
| Less than $300 | 9 (0.6%) | 0 (0.0%) |
| $300 to $499 | 24 (1.7%) | 0 (0.0%) |
| $500 to $799 | 106 (7.3%) | 0 (0.0%) |
| $800 to $999 | 195 (13.4%) | 22 (38.6%) |
| $1,000 to $1,499 | 642 (44.3%) | 10 (17.5%) |
| $1,500 to $1,999 | 238 (16.4%) | 0 (0.0%) |
| $2,000 to $2,499 | 88 (6.1%) | 0 (0.0%) |
| $2,500 to $2,999 | 66 (4.5%) | 0 (0.0%) |
| $3,000 or more | 83 (5.7%) | 10 (17.5%) |
| Total | 1,451 (100.0%) | 57 (100.0%) |
Physical Housing Characteristics in Whittingham
Housing Structures in Whittingham
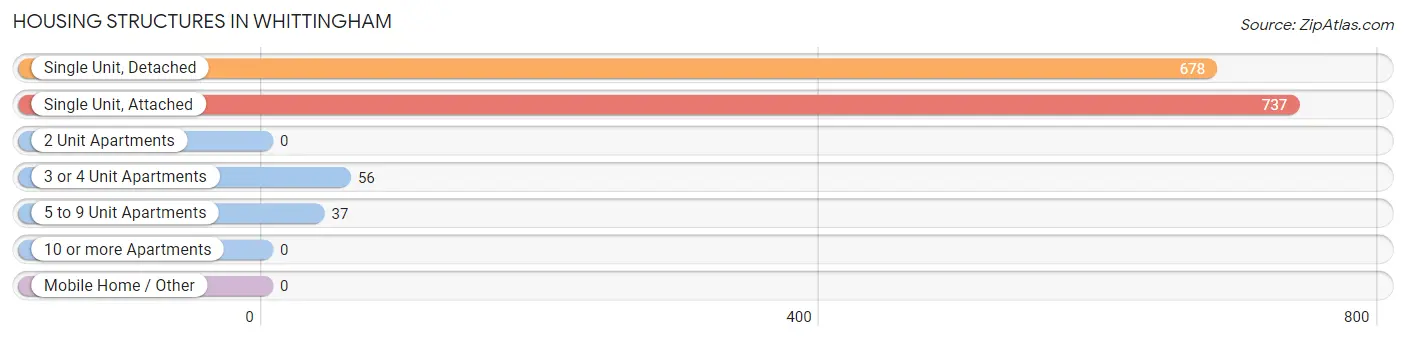
| Structure Type | # Housing Units | % Housing Units |
| Single Unit, Detached | 678 | 45.0% |
| Single Unit, Attached | 737 | 48.9% |
| 2 Unit Apartments | 0 | 0.0% |
| 3 or 4 Unit Apartments | 56 | 3.7% |
| 5 to 9 Unit Apartments | 37 | 2.5% |
| 10 or more Apartments | 0 | 0.0% |
| Mobile Home / Other | 0 | 0.0% |
| Total | 1,508 | 100.0% |
Housing Structures by Occupancy in Whittingham
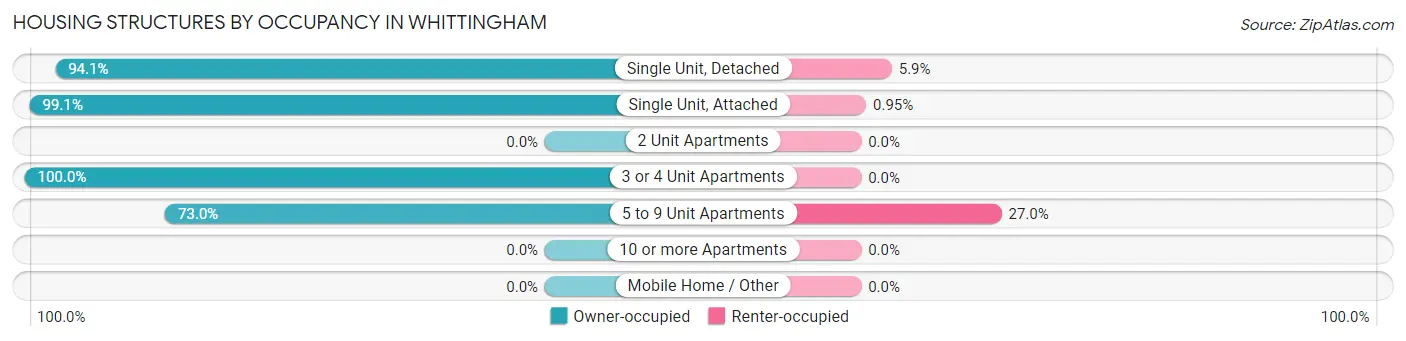
| Structure Type | Owner-occupied | Renter-occupied |
| Single Unit, Detached | 638 (94.1%) | 40 (5.9%) |
| Single Unit, Attached | 730 (99.1%) | 7 (0.9%) |
| 2 Unit Apartments | 0 (0.0%) | 0 (0.0%) |
| 3 or 4 Unit Apartments | 56 (100.0%) | 0 (0.0%) |
| 5 to 9 Unit Apartments | 27 (73.0%) | 10 (27.0%) |
| 10 or more Apartments | 0 (0.0%) | 0 (0.0%) |
| Mobile Home / Other | 0 (0.0%) | 0 (0.0%) |
| Total | 1,451 (96.2%) | 57 (3.8%) |
Housing Structures by Number of Rooms in Whittingham
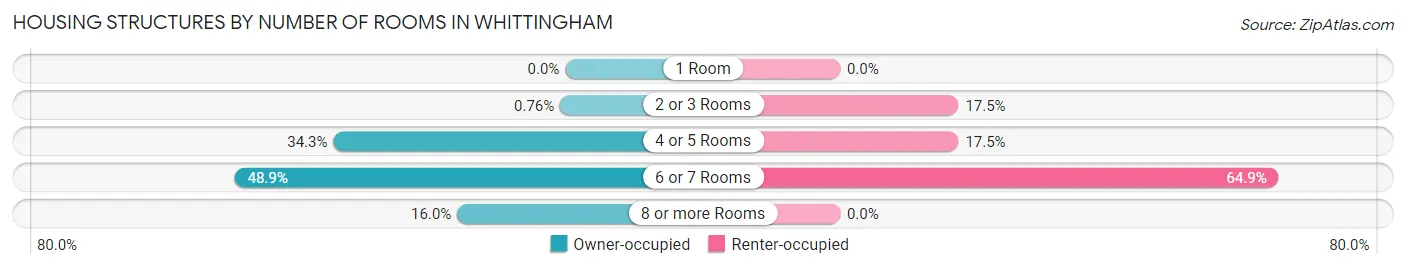
| Number of Rooms | Owner-occupied | Renter-occupied |
| 1 Room | 0 (0.0%) | 0 (0.0%) |
| 2 or 3 Rooms | 11 (0.8%) | 10 (17.5%) |
| 4 or 5 Rooms | 498 (34.3%) | 10 (17.5%) |
| 6 or 7 Rooms | 710 (48.9%) | 37 (64.9%) |
| 8 or more Rooms | 232 (16.0%) | 0 (0.0%) |
| Total | 1,451 (100.0%) | 57 (100.0%) |
Housing Structure by Heating Type in Whittingham
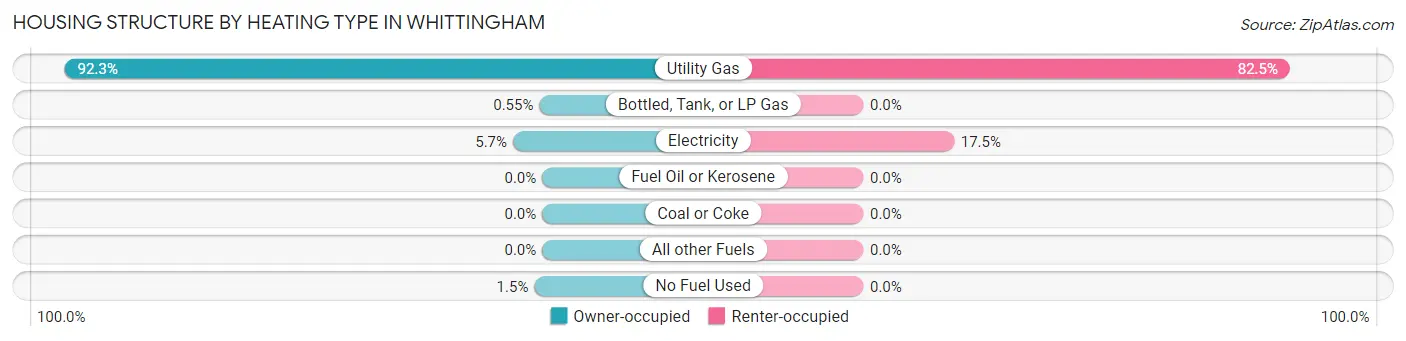
| Heating Type | Owner-occupied | Renter-occupied |
| Utility Gas | 1,339 (92.3%) | 47 (82.5%) |
| Bottled, Tank, or LP Gas | 8 (0.5%) | 0 (0.0%) |
| Electricity | 82 (5.7%) | 10 (17.5%) |
| Fuel Oil or Kerosene | 0 (0.0%) | 0 (0.0%) |
| Coal or Coke | 0 (0.0%) | 0 (0.0%) |
| All other Fuels | 0 (0.0%) | 0 (0.0%) |
| No Fuel Used | 22 (1.5%) | 0 (0.0%) |
| Total | 1,451 (100.0%) | 57 (100.0%) |
Household Vehicle Usage in Whittingham
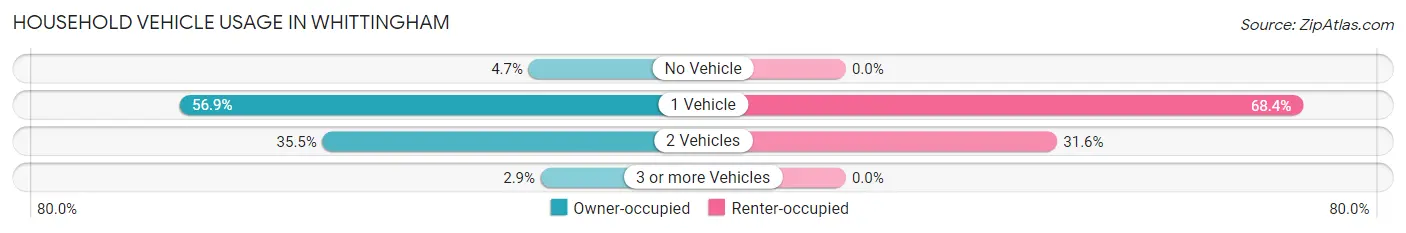
| Vehicles per Household | Owner-occupied | Renter-occupied |
| No Vehicle | 68 (4.7%) | 0 (0.0%) |
| 1 Vehicle | 826 (56.9%) | 39 (68.4%) |
| 2 Vehicles | 515 (35.5%) | 18 (31.6%) |
| 3 or more Vehicles | 42 (2.9%) | 0 (0.0%) |
| Total | 1,451 (100.0%) | 57 (100.0%) |
Real Estate & Mortgages in Whittingham
Real Estate and Mortgage Overview in Whittingham
| Characteristic | Without Mortgage | With Mortgage |
| Housing Units | 990 | 461 |
| Median Property Value | $372,200 | $362,200 |
| Median Household Income | $70,978 | $44 |
| Monthly Housing Costs | $1,142 | $73 |
| Real Estate Taxes | $5,951 | $0 |
Property Value by Mortgage Status in Whittingham
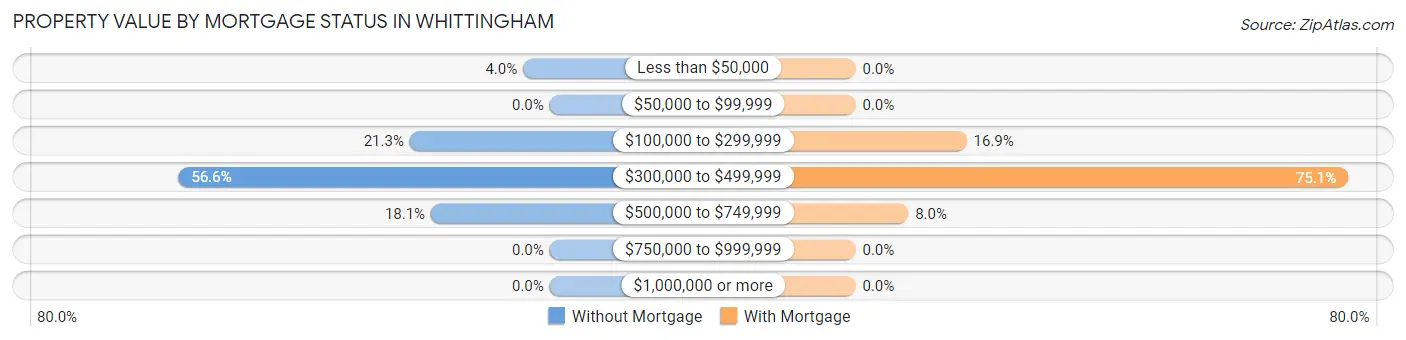
| Property Value | Without Mortgage | With Mortgage |
| Less than $50,000 | 40 (4.0%) | 0 (0.0%) |
| $50,000 to $99,999 | 0 (0.0%) | 0 (0.0%) |
| $100,000 to $299,999 | 211 (21.3%) | 78 (16.9%) |
| $300,000 to $499,999 | 560 (56.6%) | 346 (75.0%) |
| $500,000 to $749,999 | 179 (18.1%) | 37 (8.0%) |
| $750,000 to $999,999 | 0 (0.0%) | 0 (0.0%) |
| $1,000,000 or more | 0 (0.0%) | 0 (0.0%) |
| Total | 990 (100.0%) | 461 (100.0%) |
Household Income by Mortgage Status in Whittingham
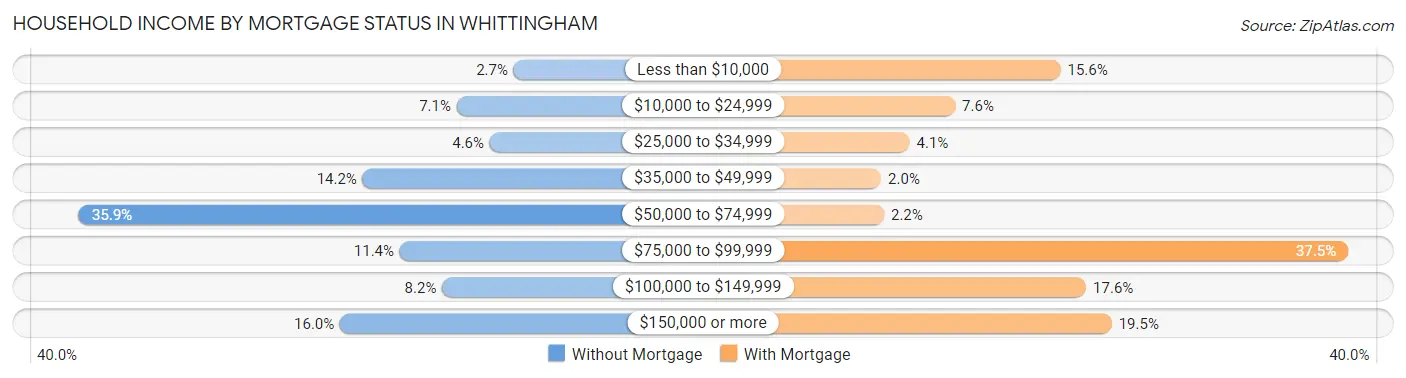
| Household Income | Without Mortgage | With Mortgage |
| Less than $10,000 | 27 (2.7%) | 72 (15.6%) |
| $10,000 to $24,999 | 70 (7.1%) | 35 (7.6%) |
| $25,000 to $34,999 | 45 (4.5%) | 19 (4.1%) |
| $35,000 to $49,999 | 141 (14.2%) | 9 (1.9%) |
| $50,000 to $74,999 | 355 (35.9%) | 10 (2.2%) |
| $75,000 to $99,999 | 113 (11.4%) | 173 (37.5%) |
| $100,000 to $149,999 | 81 (8.2%) | 81 (17.6%) |
| $150,000 or more | 158 (16.0%) | 90 (19.5%) |
| Total | 990 (100.0%) | 461 (100.0%) |
Property Value to Household Income Ratio in Whittingham
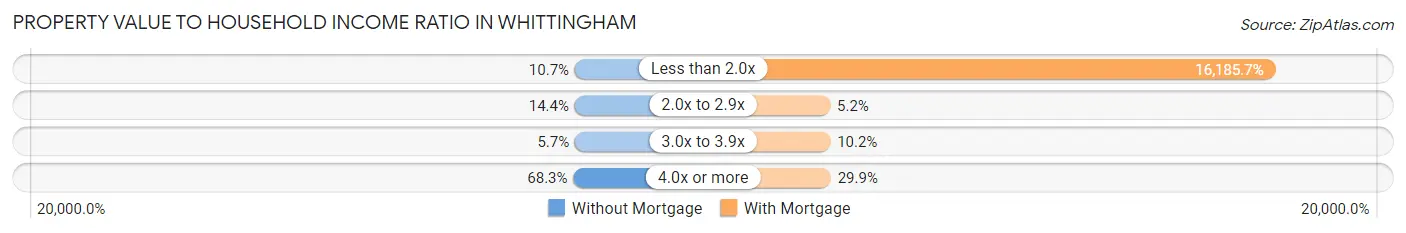
| Value-to-Income Ratio | Without Mortgage | With Mortgage |
| Less than 2.0x | 106 (10.7%) | 74,616 (16,185.7%) |
| 2.0x to 2.9x | 143 (14.4%) | 24 (5.2%) |
| 3.0x to 3.9x | 56 (5.7%) | 47 (10.2%) |
| 4.0x or more | 676 (68.3%) | 138 (29.9%) |
| Total | 990 (100.0%) | 461 (100.0%) |
Real Estate Taxes by Mortgage Status in Whittingham
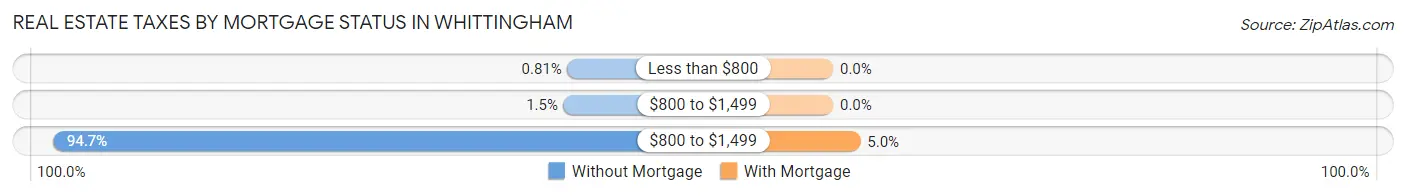
| Property Taxes | Without Mortgage | With Mortgage |
| Less than $800 | 8 (0.8%) | 0 (0.0%) |
| $800 to $1,499 | 15 (1.5%) | 0 (0.0%) |
| $800 to $1,499 | 937 (94.7%) | 23 (5.0%) |
| Total | 990 (100.0%) | 461 (100.0%) |
Health & Disability in Whittingham
Health Insurance Coverage by Age in Whittingham
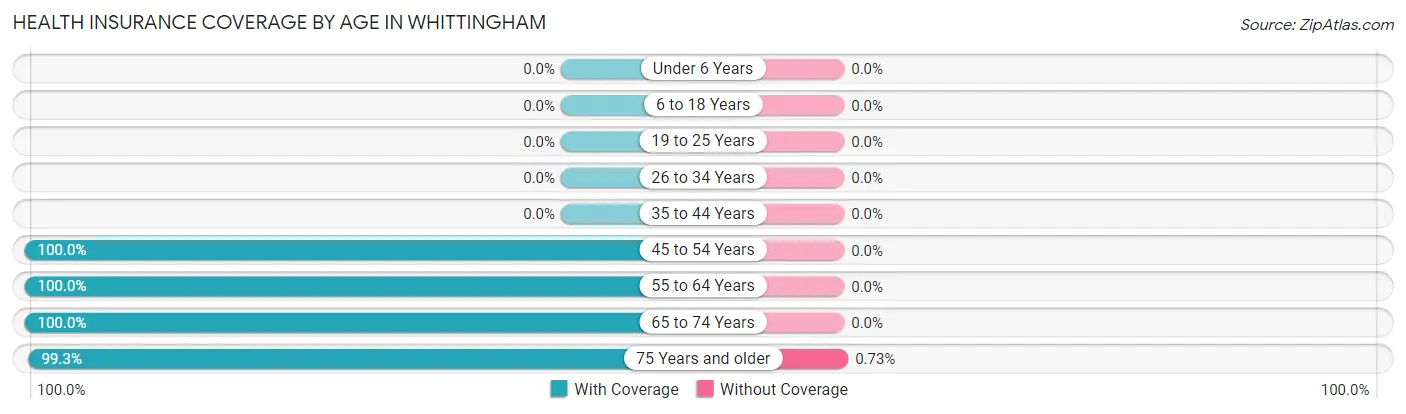
| Age Bracket | With Coverage | Without Coverage |
| Under 6 Years | 0 (0.0%) | 0 (0.0%) |
| 6 to 18 Years | 0 (0.0%) | 0 (0.0%) |
| 19 to 25 Years | 0 (0.0%) | 0 (0.0%) |
| 26 to 34 Years | 0 (0.0%) | 0 (0.0%) |
| 35 to 44 Years | 0 (0.0%) | 0 (0.0%) |
| 45 to 54 Years | 16 (100.0%) | 0 (0.0%) |
| 55 to 64 Years | 233 (100.0%) | 0 (0.0%) |
| 65 to 74 Years | 672 (100.0%) | 0 (0.0%) |
| 75 Years and older | 1,491 (99.3%) | 11 (0.7%) |
| Total | 2,412 (99.6%) | 11 (0.4%) |
Health Insurance Coverage by Citizenship Status in Whittingham
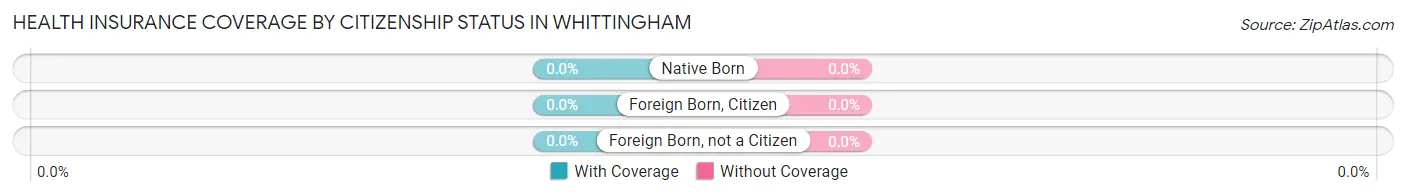
| Citizenship Status | With Coverage | Without Coverage |
| Native Born | 0 (0.0%) | 0 (0.0%) |
| Foreign Born, Citizen | 0 (0.0%) | 0 (0.0%) |
| Foreign Born, not a Citizen | 0 (0.0%) | 0 (0.0%) |
Health Insurance Coverage by Household Income in Whittingham
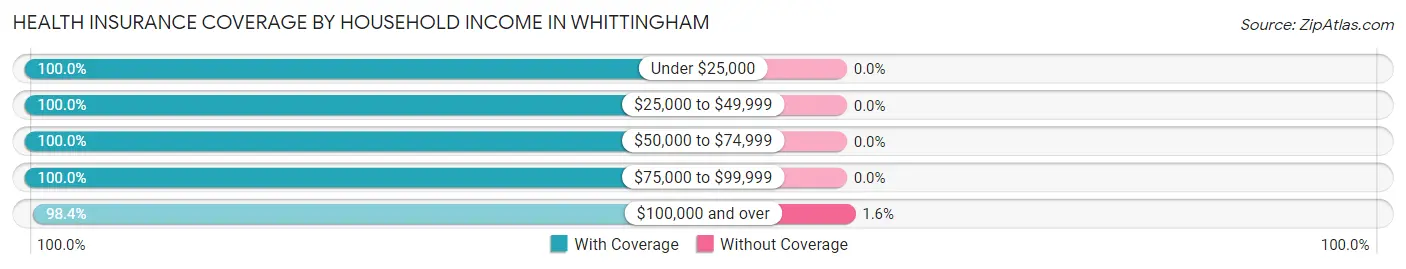
| Household Income | With Coverage | Without Coverage |
| Under $25,000 | 185 (100.0%) | 0 (0.0%) |
| $25,000 to $49,999 | 303 (100.0%) | 0 (0.0%) |
| $50,000 to $74,999 | 929 (100.0%) | 0 (0.0%) |
| $75,000 to $99,999 | 315 (100.0%) | 0 (0.0%) |
| $100,000 and over | 680 (98.4%) | 11 (1.6%) |
Public vs Private Health Insurance Coverage by Age in Whittingham
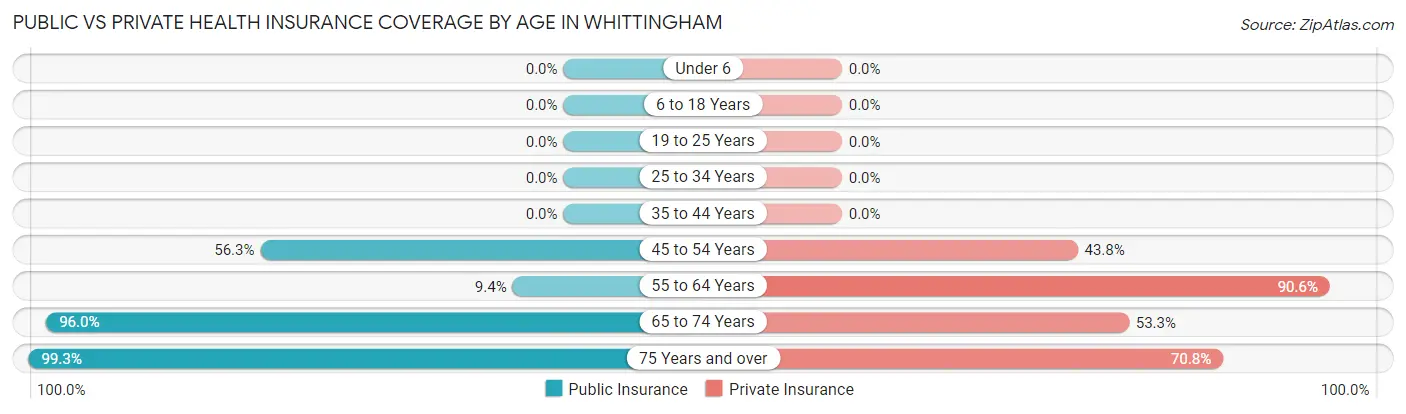
| Age Bracket | Public Insurance | Private Insurance |
| Under 6 | 0 (0.0%) | 0 (0.0%) |
| 6 to 18 Years | 0 (0.0%) | 0 (0.0%) |
| 19 to 25 Years | 0 (0.0%) | 0 (0.0%) |
| 25 to 34 Years | 0 (0.0%) | 0 (0.0%) |
| 35 to 44 Years | 0 (0.0%) | 0 (0.0%) |
| 45 to 54 Years | 9 (56.2%) | 7 (43.8%) |
| 55 to 64 Years | 22 (9.4%) | 211 (90.6%) |
| 65 to 74 Years | 645 (96.0%) | 358 (53.3%) |
| 75 Years and over | 1,491 (99.3%) | 1,063 (70.8%) |
| Total | 2,167 (89.4%) | 1,639 (67.6%) |
Disability Status by Sex by Age in Whittingham
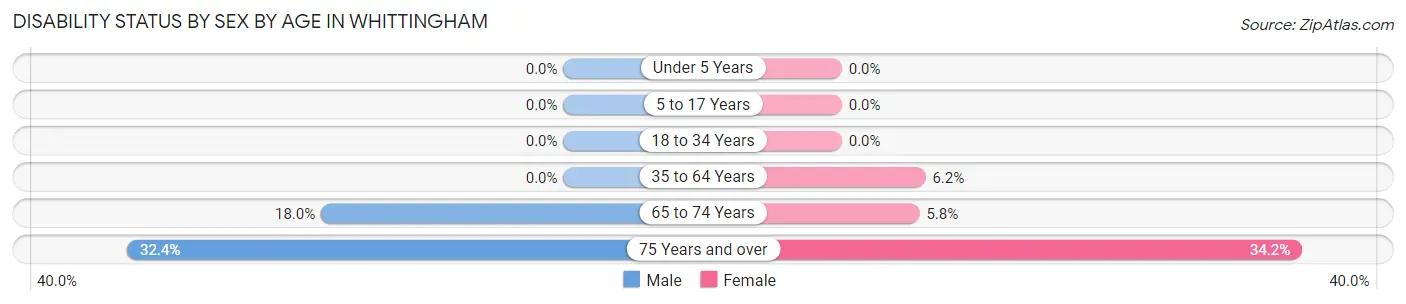
| Age Bracket | Male | Female |
| Under 5 Years | 0 (0.0%) | 0 (0.0%) |
| 5 to 17 Years | 0 (0.0%) | 0 (0.0%) |
| 18 to 34 Years | 0 (0.0%) | 0 (0.0%) |
| 35 to 64 Years | 0 (0.0%) | 10 (6.2%) |
| 65 to 74 Years | 43 (18.0%) | 25 (5.8%) |
| 75 Years and over | 240 (32.4%) | 260 (34.2%) |
Disability Class by Sex by Age in Whittingham
Disability Class: Hearing Difficulty
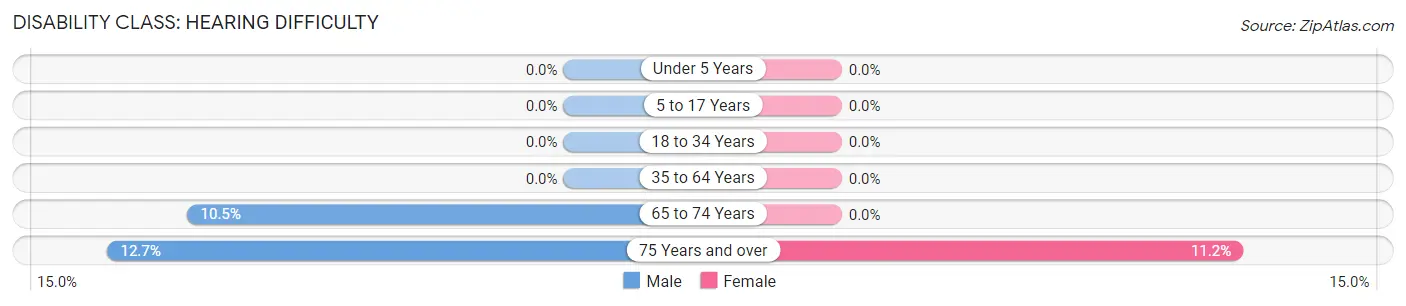
| Age Bracket | Male | Female |
| Under 5 Years | 0 (0.0%) | 0 (0.0%) |
| 5 to 17 Years | 0 (0.0%) | 0 (0.0%) |
| 18 to 34 Years | 0 (0.0%) | 0 (0.0%) |
| 35 to 64 Years | 0 (0.0%) | 0 (0.0%) |
| 65 to 74 Years | 25 (10.5%) | 0 (0.0%) |
| 75 Years and over | 94 (12.7%) | 85 (11.2%) |
Disability Class: Vision Difficulty
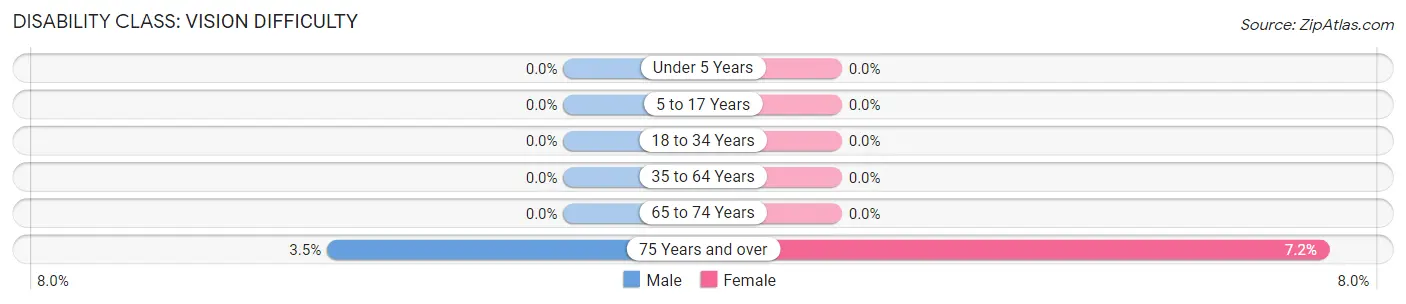
| Age Bracket | Male | Female |
| Under 5 Years | 0 (0.0%) | 0 (0.0%) |
| 5 to 17 Years | 0 (0.0%) | 0 (0.0%) |
| 18 to 34 Years | 0 (0.0%) | 0 (0.0%) |
| 35 to 64 Years | 0 (0.0%) | 0 (0.0%) |
| 65 to 74 Years | 0 (0.0%) | 0 (0.0%) |
| 75 Years and over | 26 (3.5%) | 55 (7.2%) |
Disability Class: Cognitive Difficulty
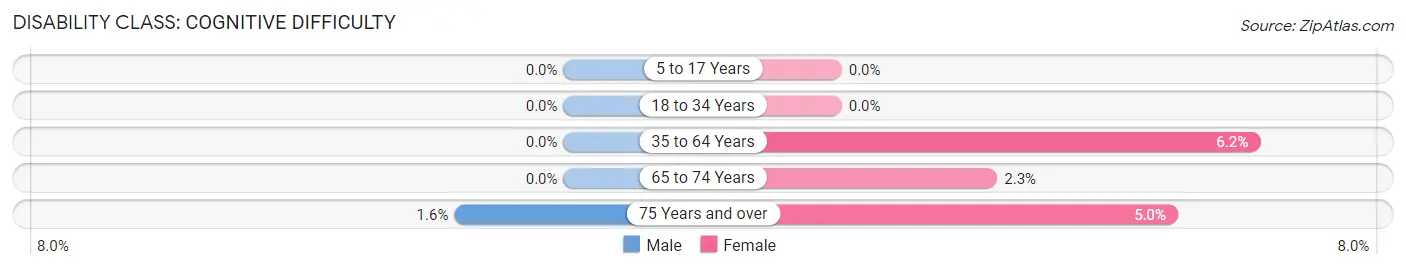
| Age Bracket | Male | Female |
| 5 to 17 Years | 0 (0.0%) | 0 (0.0%) |
| 18 to 34 Years | 0 (0.0%) | 0 (0.0%) |
| 35 to 64 Years | 0 (0.0%) | 10 (6.2%) |
| 65 to 74 Years | 0 (0.0%) | 10 (2.3%) |
| 75 Years and over | 12 (1.6%) | 38 (5.0%) |
Disability Class: Ambulatory Difficulty
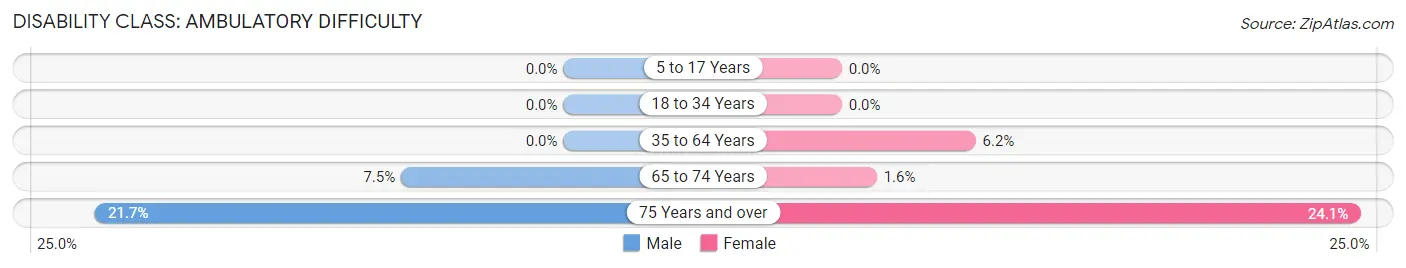
| Age Bracket | Male | Female |
| 5 to 17 Years | 0 (0.0%) | 0 (0.0%) |
| 18 to 34 Years | 0 (0.0%) | 0 (0.0%) |
| 35 to 64 Years | 0 (0.0%) | 10 (6.2%) |
| 65 to 74 Years | 18 (7.5%) | 7 (1.6%) |
| 75 Years and over | 161 (21.7%) | 183 (24.0%) |
Disability Class: Self-Care Difficulty
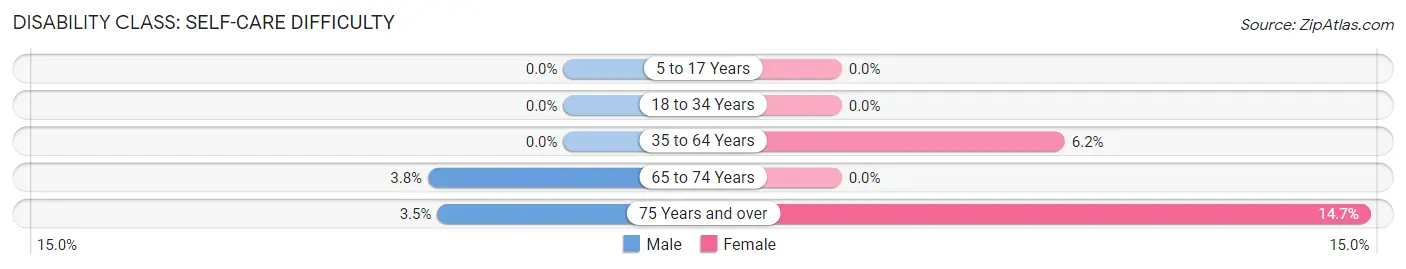
| Age Bracket | Male | Female |
| 5 to 17 Years | 0 (0.0%) | 0 (0.0%) |
| 18 to 34 Years | 0 (0.0%) | 0 (0.0%) |
| 35 to 64 Years | 0 (0.0%) | 10 (6.2%) |
| 65 to 74 Years | 9 (3.8%) | 0 (0.0%) |
| 75 Years and over | 26 (3.5%) | 112 (14.7%) |
Technology Access in Whittingham
Computing Device Access in Whittingham
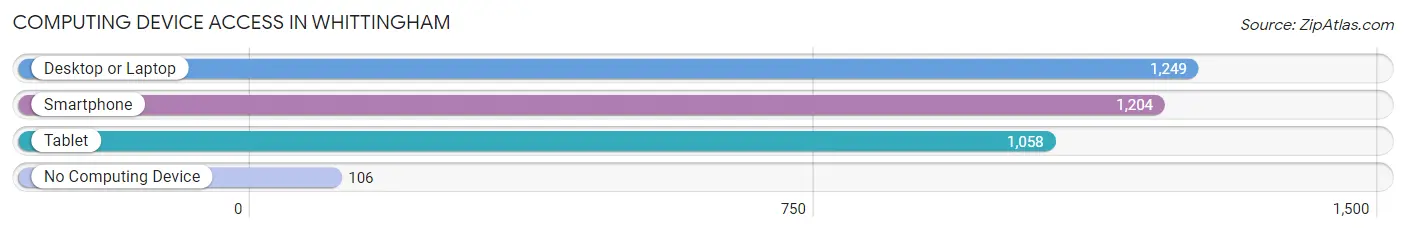
| Device Type | # Households | % Households |
| Desktop or Laptop | 1,249 | 82.8% |
| Smartphone | 1,204 | 79.8% |
| Tablet | 1,058 | 70.2% |
| No Computing Device | 106 | 7.0% |
| Total | 1,508 | 100.0% |
Internet Access in Whittingham
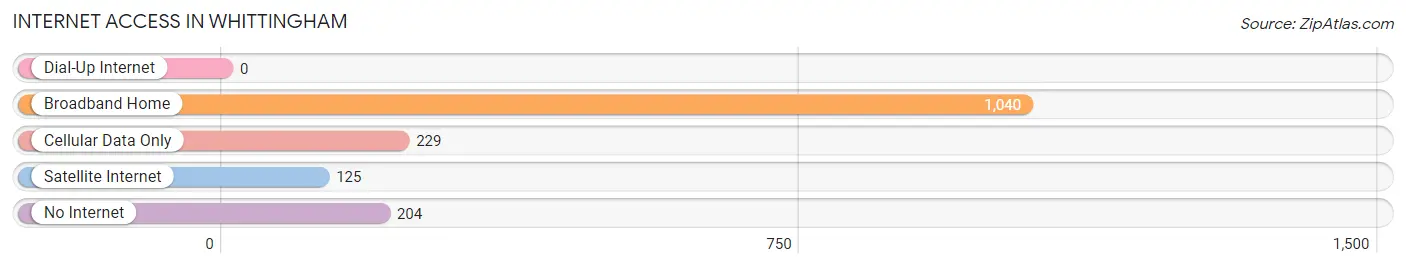
| Internet Type | # Households | % Households |
| Dial-Up Internet | 0 | 0.0% |
| Broadband Home | 1,040 | 69.0% |
| Cellular Data Only | 229 | 15.2% |
| Satellite Internet | 125 | 8.3% |
| No Internet | 204 | 13.5% |
| Total | 1,508 | 100.0% |
Whittingham Summary
Nestled in the rolling hills of Morris County, New Jersey, the small town of Whittingham is a picturesque community with a rich history and a bright future. Located just 30 miles from New York City, Whittingham is a rural oasis that offers its residents a peaceful respite from the hustle and bustle of the big city.
History
Whittingham was first settled in the late 1700s by a group of Dutch settlers who named the town after their leader, John Whittingham. The town was officially incorporated in 1845 and quickly became a thriving agricultural community. The town’s main industry was dairy farming, and the town was home to several large dairy farms. In the late 1800s, the town began to diversify its economy and began to attract a variety of businesses, including a brickyard, a sawmill, and a tannery.
In the early 1900s, the town began to experience a population boom as more and more people moved to the area. This influx of people led to the construction of several new businesses, including a movie theater, a bowling alley, and a variety of shops and restaurants. The town also saw the construction of several new churches and schools.
Geography
Whittingham is located in the rolling hills of Morris County, New Jersey. The town is bordered by the towns of Chester, Mendham, and Randolph. The town is situated on the banks of the Whippany River, which flows through the center of town. The town is home to several parks and recreational areas, including the Whippany River Park and the Whittingham Wildlife Preserve.
Economy
Whittingham’s economy is largely based on agriculture and tourism. The town is home to several large dairy farms, as well as a variety of small businesses, including restaurants, shops, and other services. The town also attracts a large number of tourists each year, who come to enjoy the town’s natural beauty and its many recreational activities.
Demographics
As of the 2010 census, the population of Whittingham was 4,845. The town is predominantly white (90.3%), with a small percentage of African Americans (3.2%), Asians (2.2%), and Hispanics (2.2%). The median household income in Whittingham is $90,845, and the median home value is $521,000.
Whittingham is a small town with a big heart. Its rich history, beautiful scenery, and friendly people make it a great place to live and visit. With its close proximity to New York City, Whittingham offers its residents the best of both worlds – the peace and quiet of a rural community and the convenience of a big city.
Common Questions
What is Per Capita Income in Whittingham?
Per Capita income in Whittingham is $55,877.
What is the Median Family Income in Whittingham?
Median Family Income in Whittingham is $74,008.
What is the Median Household income in Whittingham?
Median Household Income in Whittingham is $71,996.
What is Income or Wage Gap in Whittingham?
Income or Wage Gap in Whittingham is 73.2%.
Women in Whittingham earn 26.8 cents for every dollar earned by a man.
What is Family Income Deficit in Whittingham?
Family Income Deficit in Whittingham is $9,363.
Families that are below poverty line in Whittingham earn $9,363 less on average than the poverty threshold level.
What is Inequality or Gini Index in Whittingham?
Inequality or Gini Index in Whittingham is 0.38.
What is the Total Population of Whittingham?
Total Population of Whittingham is 2,423.
What is the Total Male Population of Whittingham?
Total Male Population of Whittingham is 1,068.
What is the Total Female Population of Whittingham?
Total Female Population of Whittingham is 1,355.
What is the Ratio of Males per 100 Females in Whittingham?
There are 78.82 Males per 100 Females in Whittingham.
What is the Ratio of Females per 100 Males in Whittingham?
There are 126.87 Females per 100 Males in Whittingham.
What is the Median Population Age in Whittingham?
Median Population Age in Whittingham is 76.0 Years.
What is the Average Family Size in Whittingham
Average Family Size in Whittingham is 2.0 People.
What is the Average Household Size in Whittingham
Average Household Size in Whittingham is 1.6 People.
How Large is the Labor Force in Whittingham?
There are 383 People in the Labor Forcein in Whittingham.
What is the Percentage of People in the Labor Force in Whittingham?
15.8% of People are in the Labor Force in Whittingham.
What is the Unemployment Rate in Whittingham?
Unemployment Rate in Whittingham is 2.4%.