Crestwood Village, NJ Map & Demographics
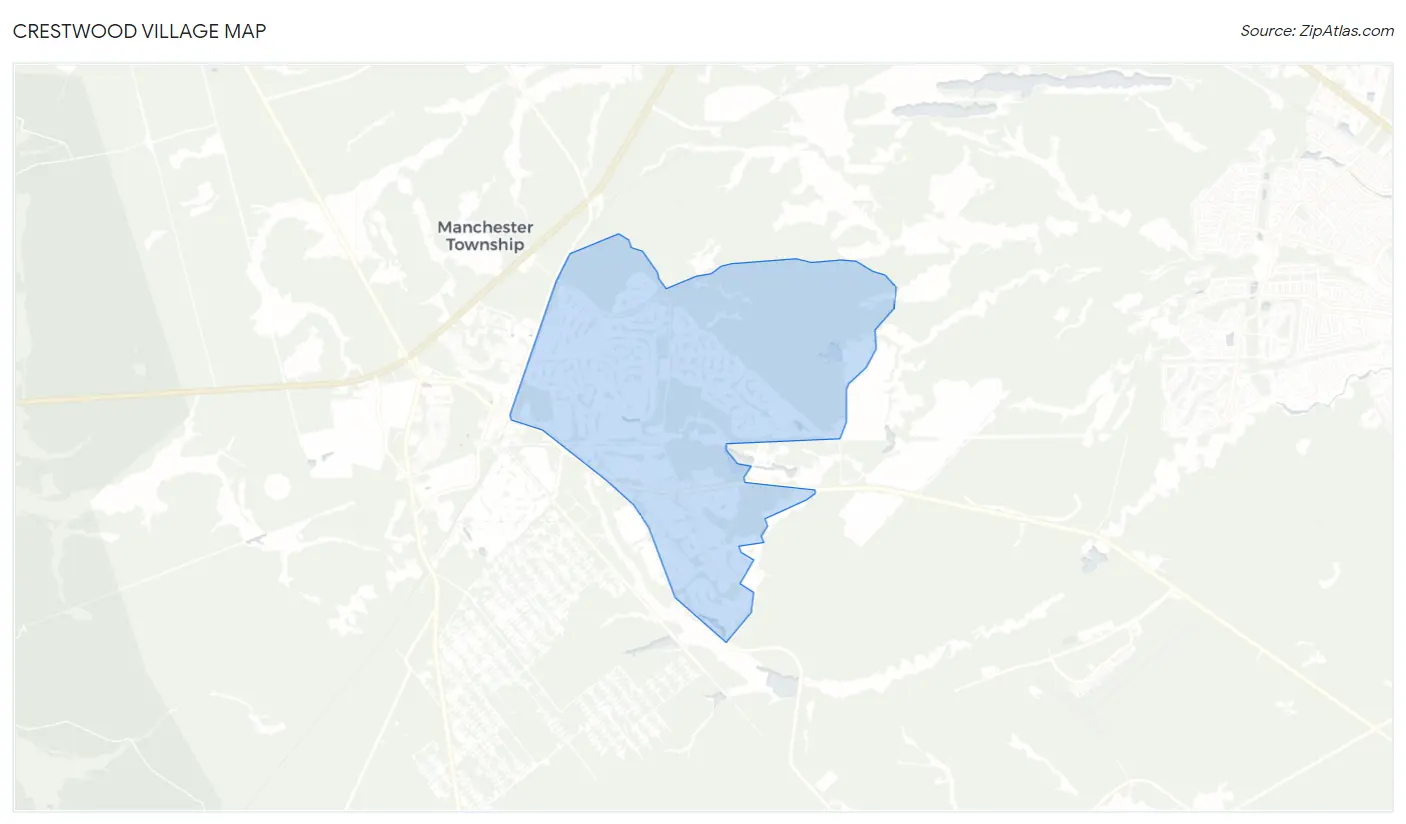
Crestwood Village Map
Crestwood Village Overview
$36,447
PER CAPITA INCOME
$64,492
AVG FAMILY INCOME
$37,214
AVG HOUSEHOLD INCOME
25.7%
WAGE / INCOME GAP [ % ]
74.3¢/ $1
WAGE / INCOME GAP [ $ ]
0.42
INEQUALITY / GINI INDEX
8,479
TOTAL POPULATION
3,426
MALE POPULATION
5,053
FEMALE POPULATION
67.80
MALES / 100 FEMALES
147.49
FEMALES / 100 MALES
72.3
MEDIAN AGE
2.1
AVG FAMILY SIZE
1.4
AVG HOUSEHOLD SIZE
1,934
LABOR FORCE [ PEOPLE ]
22.9%
PERCENT IN LABOR FORCE
13.0%
UNEMPLOYMENT RATE
Income in Crestwood Village
Income Overview in Crestwood Village
Per Capita Income in Crestwood Village is $36,447, while median incomes of families and households are $64,492 and $37,214 respectively.
| Characteristic | Number | Measure |
| Per Capita Income | 8,479 | $36,447 |
| Median Family Income | 1,967 | $64,492 |
| Mean Family Income | 1,967 | $74,454 |
| Median Household Income | 5,979 | $37,214 |
| Mean Household Income | 5,979 | $51,108 |
| Income Deficit | 1,967 | $0 |
| Wage / Income Gap (%) | 8,479 | 25.66% |
| Wage / Income Gap ($) | 8,479 | 74.34¢ per $1 |
| Gini / Inequality Index | 8,479 | 0.42 |
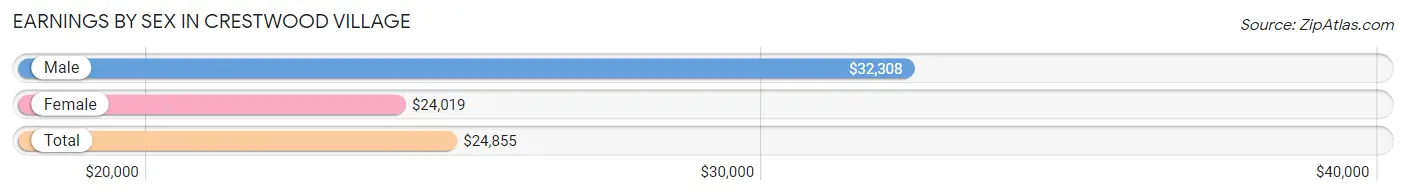
Earnings by Sex in Crestwood Village
Average Earnings in Crestwood Village are $24,855, $32,308 for men and $24,019 for women, a difference of 25.7%.
| Sex | Number | Average Earnings |
| Male | 962 (43.8%) | $32,308 |
| Female | 1,237 (56.2%) | $24,019 |
| Total | 2,199 (100.0%) | $24,855 |
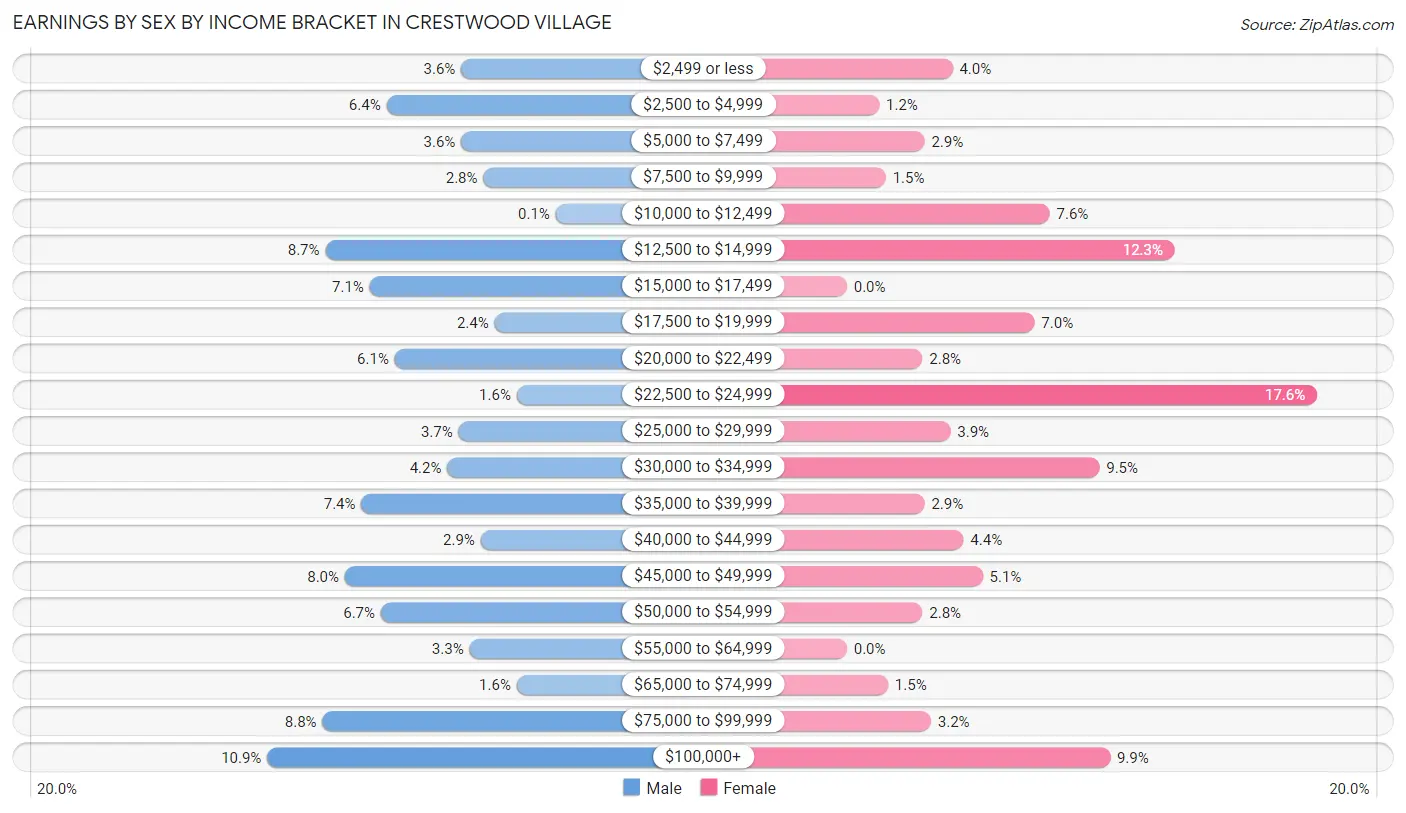
Earnings by Sex by Income Bracket in Crestwood Village
The most common earnings brackets in Crestwood Village are $100,000+ for men (105 | 10.9%) and $22,500 to $24,999 for women (218 | 17.6%).
| Income | Male | Female |
| $2,499 or less | 35 (3.6%) | 49 (4.0%) |
| $2,500 to $4,999 | 62 (6.4%) | 15 (1.2%) |
| $5,000 to $7,499 | 35 (3.6%) | 36 (2.9%) |
| $7,500 to $9,999 | 27 (2.8%) | 18 (1.5%) |
| $10,000 to $12,499 | 1 (0.1%) | 94 (7.6%) |
| $12,500 to $14,999 | 84 (8.7%) | 152 (12.3%) |
| $15,000 to $17,499 | 68 (7.1%) | 0 (0.0%) |
| $17,500 to $19,999 | 23 (2.4%) | 87 (7.0%) |
| $20,000 to $22,499 | 59 (6.1%) | 35 (2.8%) |
| $22,500 to $24,999 | 15 (1.6%) | 218 (17.6%) |
| $25,000 to $29,999 | 36 (3.7%) | 48 (3.9%) |
| $30,000 to $34,999 | 40 (4.2%) | 117 (9.5%) |
| $35,000 to $39,999 | 71 (7.4%) | 36 (2.9%) |
| $40,000 to $44,999 | 28 (2.9%) | 54 (4.4%) |
| $45,000 to $49,999 | 77 (8.0%) | 63 (5.1%) |
| $50,000 to $54,999 | 64 (6.7%) | 35 (2.8%) |
| $55,000 to $64,999 | 32 (3.3%) | 0 (0.0%) |
| $65,000 to $74,999 | 15 (1.6%) | 19 (1.5%) |
| $75,000 to $99,999 | 85 (8.8%) | 39 (3.2%) |
| $100,000+ | 105 (10.9%) | 122 (9.9%) |
| Total | 962 (100.0%) | 1,237 (100.0%) |
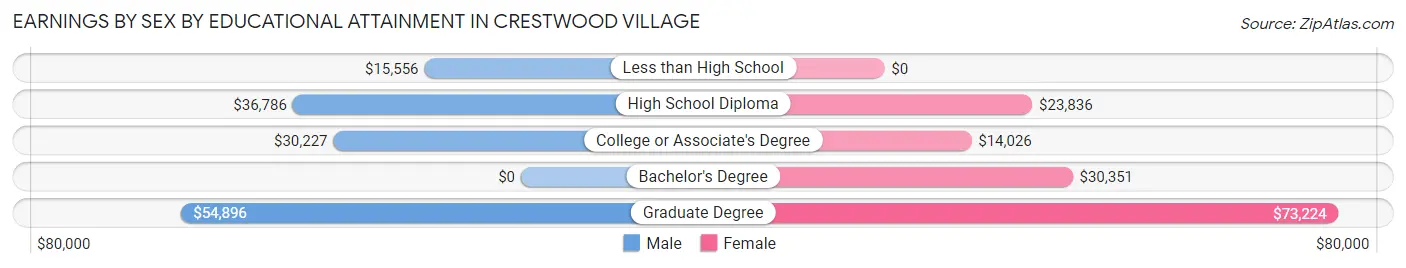
Earnings by Sex by Educational Attainment in Crestwood Village
Average earnings in Crestwood Village are $32,308 for men and $24,140 for women, a difference of 25.3%. Men with an educational attainment of graduate degree enjoy the highest average annual earnings of $54,896, while those with less than high school education earn the least with $15,556. Women with an educational attainment of graduate degree earn the most with the average annual earnings of $73,224, while those with college or associate's degree education have the smallest earnings of $14,026.
| Educational Attainment | Male Income | Female Income |
| Less than High School | $15,556 | $0 |
| High School Diploma | $36,786 | $23,836 |
| College or Associate's Degree | $30,227 | $14,026 |
| Bachelor's Degree | - | - |
| Graduate Degree | $54,896 | $73,224 |
| Total | $32,308 | $24,140 |
Family Income in Crestwood Village
Family Income Brackets in Crestwood Village
According to the Crestwood Village family income data, there are 472 families falling into the $50,000 to $74,999 income range, which is the most common income bracket and makes up 24.0% of all families. Conversely, the less than $10,000 income bracket is the least frequent group with only 28 families (1.4%) belonging to this category.
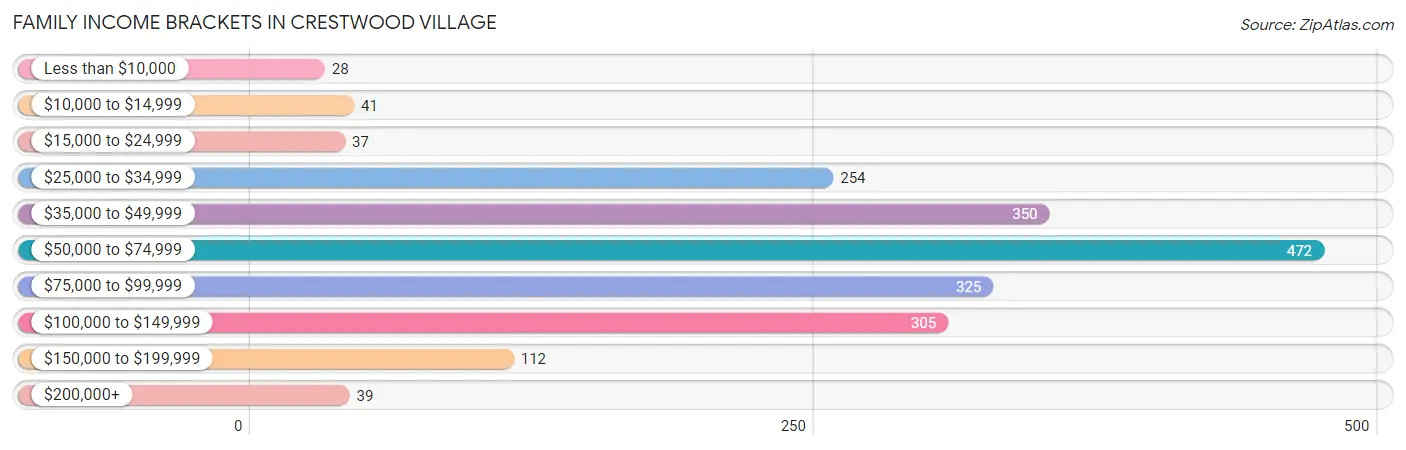
| Income Bracket | # Families | % Families |
| Less than $10,000 | 28 | 1.4% |
| $10,000 to $14,999 | 41 | 2.1% |
| $15,000 to $24,999 | 37 | 1.9% |
| $25,000 to $34,999 | 254 | 12.9% |
| $35,000 to $49,999 | 350 | 17.8% |
| $50,000 to $74,999 | 472 | 24.0% |
| $75,000 to $99,999 | 325 | 16.5% |
| $100,000 to $149,999 | 305 | 15.5% |
| $150,000 to $199,999 | 112 | 5.7% |
| $200,000+ | 39 | 2.0% |
Family Income by Famaliy Size in Crestwood Village
2-person families (1,787 | 90.8%) account for the highest median family income in Crestwood Village with $65,324 per family, while 2-person families (1,787 | 90.8%) have the highest median income of $32,662 per family member.
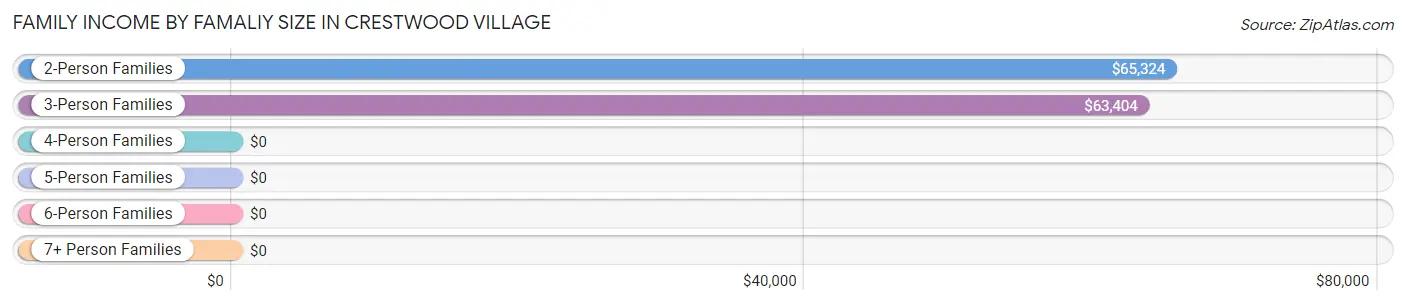
| Income Bracket | # Families | Median Income |
| 2-Person Families | 1,787 (90.8%) | $65,324 |
| 3-Person Families | 180 (9.1%) | $63,404 |
| 4-Person Families | 0 (0.0%) | $0 |
| 5-Person Families | 0 (0.0%) | $0 |
| 6-Person Families | 0 (0.0%) | $0 |
| 7+ Person Families | 0 (0.0%) | $0 |
| Total | 1,967 (100.0%) | $64,492 |
Family Income by Number of Earners in Crestwood Village
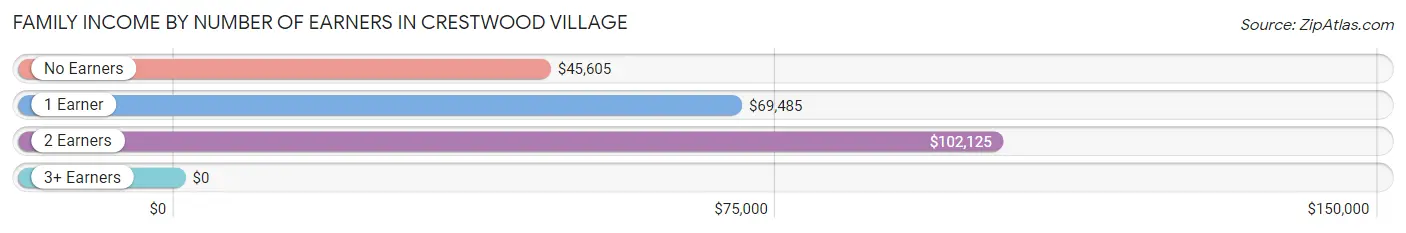
| Number of Earners | # Families | Median Income |
| No Earners | 1,007 (51.2%) | $45,605 |
| 1 Earner | 601 (30.5%) | $69,485 |
| 2 Earners | 359 (18.2%) | $102,125 |
| 3+ Earners | 0 (0.0%) | $0 |
| Total | 1,967 (100.0%) | $64,492 |
Household Income in Crestwood Village
Household Income Brackets in Crestwood Village
With 1,118 households falling in the category, the $15,000 to $24,999 income range is the most frequent in Crestwood Village, accounting for 18.7% of all households. In contrast, only 66 households (1.1%) fall into the $200,000+ income bracket, making it the least populous group.
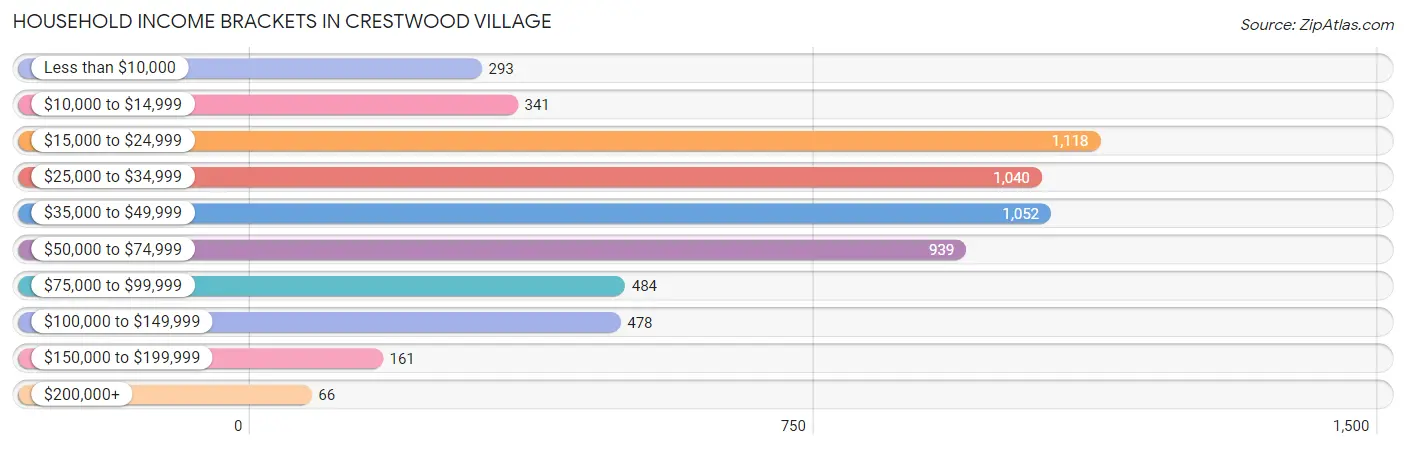
| Income Bracket | # Households | % Households |
| Less than $10,000 | 293 | 4.9% |
| $10,000 to $14,999 | 341 | 5.7% |
| $15,000 to $24,999 | 1,118 | 18.7% |
| $25,000 to $34,999 | 1,040 | 17.4% |
| $35,000 to $49,999 | 1,052 | 17.6% |
| $50,000 to $74,999 | 939 | 15.7% |
| $75,000 to $99,999 | 484 | 8.1% |
| $100,000 to $149,999 | 478 | 8.0% |
| $150,000 to $199,999 | 161 | 2.7% |
| $200,000+ | 66 | 1.1% |
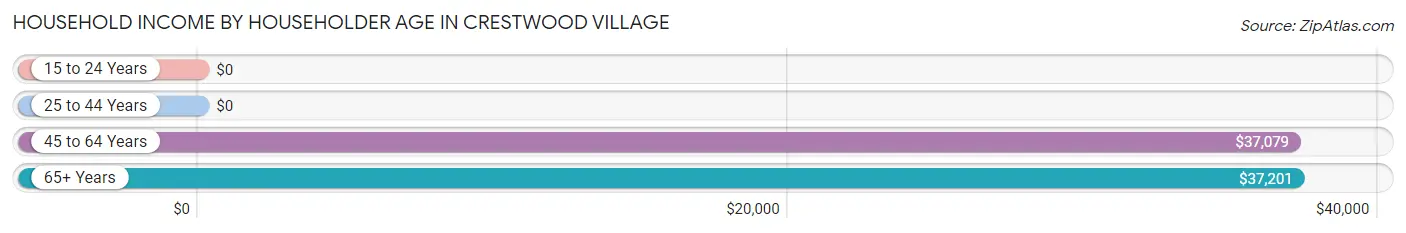
Household Income by Householder Age in Crestwood Village
The median household income in Crestwood Village is $37,214, with the highest median household income of $37,201 found in the 65+ years age bracket for the primary householder. A total of 4,700 households (78.6%) fall into this category.
| Income Bracket | # Households | Median Income |
| 15 to 24 Years | 0 (0.0%) | $0 |
| 25 to 44 Years | 45 (0.7%) | $0 |
| 45 to 64 Years | 1,234 (20.6%) | $37,079 |
| 65+ Years | 4,700 (78.6%) | $37,201 |
| Total | 5,979 (100.0%) | $37,214 |
Poverty in Crestwood Village
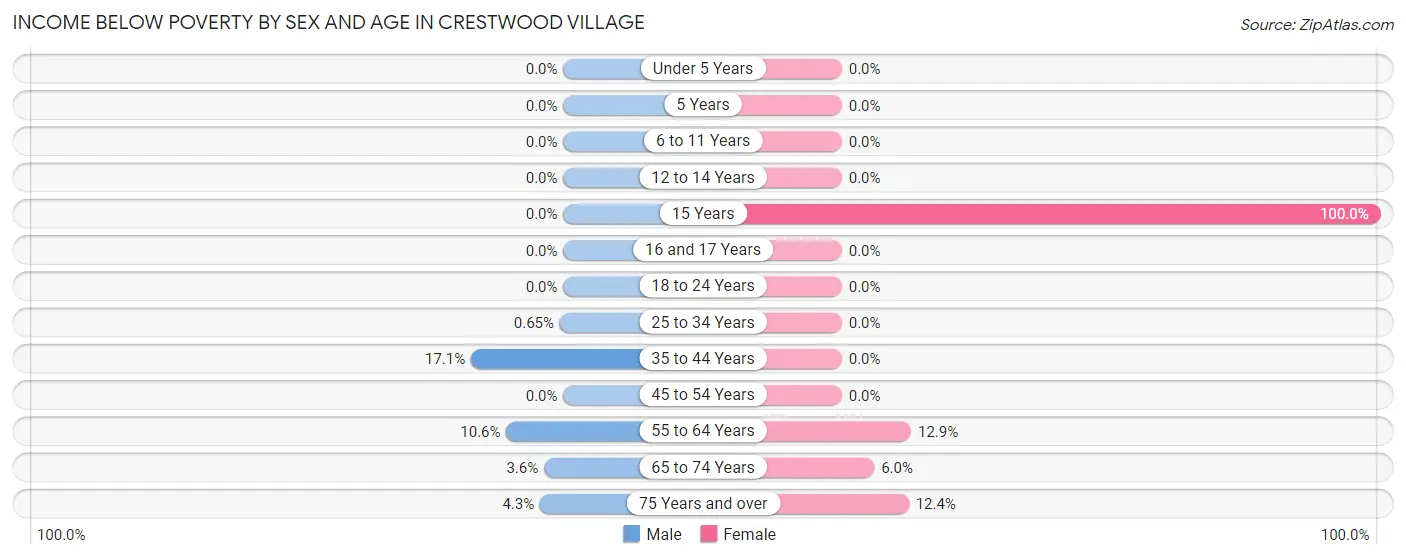
Income Below Poverty by Sex and Age in Crestwood Village
With 5.2% poverty level for males and 10.6% for females among the residents of Crestwood Village, 35 to 44 year old males and 15 year old females are the most vulnerable to poverty, with 18 males (17.1%) and 22 females (100.0%) in their respective age groups living below the poverty level.
| Age Bracket | Male | Female |
| Under 5 Years | 0 (0.0%) | 0 (0.0%) |
| 5 Years | 0 (0.0%) | 0 (0.0%) |
| 6 to 11 Years | 0 (0.0%) | 0 (0.0%) |
| 12 to 14 Years | 0 (0.0%) | 0 (0.0%) |
| 15 Years | 0 (0.0%) | 22 (100.0%) |
| 16 and 17 Years | 0 (0.0%) | 0 (0.0%) |
| 18 to 24 Years | 0 (0.0%) | 0 (0.0%) |
| 25 to 34 Years | 1 (0.6%) | 0 (0.0%) |
| 35 to 44 Years | 18 (17.1%) | 0 (0.0%) |
| 45 to 54 Years | 0 (0.0%) | 0 (0.0%) |
| 55 to 64 Years | 64 (10.6%) | 144 (12.9%) |
| 65 to 74 Years | 44 (3.6%) | 83 (6.0%) |
| 75 Years and over | 51 (4.3%) | 285 (12.4%) |
| Total | 178 (5.2%) | 534 (10.6%) |
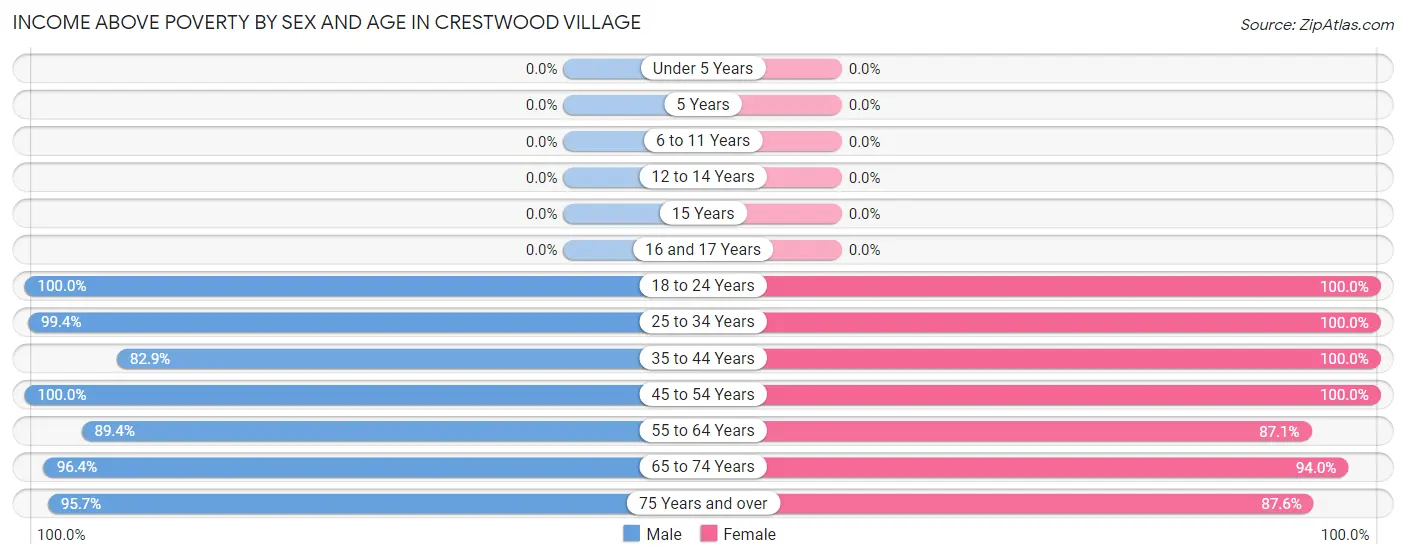
Income Above Poverty by Sex and Age in Crestwood Village
According to the poverty statistics in Crestwood Village, males aged 18 to 24 years and females aged 18 to 24 years are the age groups that are most secure financially, with 100.0% of males and 100.0% of females in these age groups living above the poverty line.
| Age Bracket | Male | Female |
| Under 5 Years | 0 (0.0%) | 0 (0.0%) |
| 5 Years | 0 (0.0%) | 0 (0.0%) |
| 6 to 11 Years | 0 (0.0%) | 0 (0.0%) |
| 12 to 14 Years | 0 (0.0%) | 0 (0.0%) |
| 15 Years | 0 (0.0%) | 0 (0.0%) |
| 16 and 17 Years | 0 (0.0%) | 0 (0.0%) |
| 18 to 24 Years | 57 (100.0%) | 21 (100.0%) |
| 25 to 34 Years | 152 (99.4%) | 32 (100.0%) |
| 35 to 44 Years | 87 (82.9%) | 14 (100.0%) |
| 45 to 54 Years | 61 (100.0%) | 135 (100.0%) |
| 55 to 64 Years | 541 (89.4%) | 976 (87.1%) |
| 65 to 74 Years | 1,185 (96.4%) | 1,295 (94.0%) |
| 75 Years and over | 1,130 (95.7%) | 2,010 (87.6%) |
| Total | 3,213 (94.8%) | 4,483 (89.4%) |
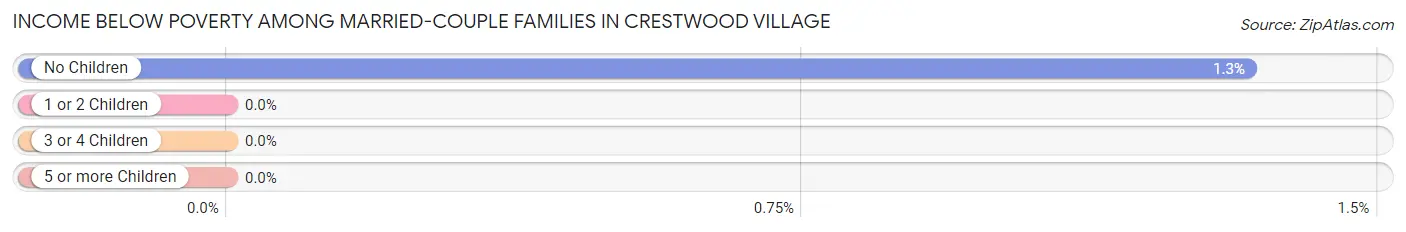
Income Below Poverty Among Married-Couple Families in Crestwood Village
The poverty statistics for married-couple families in Crestwood Village show that 1.3% or 20 of the total 1,503 families live below the poverty line. Families with no children have the highest poverty rate of 1.3%, comprising of 20 families. On the other hand, families with no children have the lowest poverty rate of 1.3%, which includes 20 families.
| Children | Above Poverty | Below Poverty |
| No Children | 1,483 (98.7%) | 20 (1.3%) |
| 1 or 2 Children | 0 (0.0%) | 0 (0.0%) |
| 3 or 4 Children | 0 (0.0%) | 0 (0.0%) |
| 5 or more Children | 0 (0.0%) | 0 (0.0%) |
| Total | 1,483 (98.7%) | 20 (1.3%) |
Income Below Poverty Among Single-Parent Households in Crestwood Village
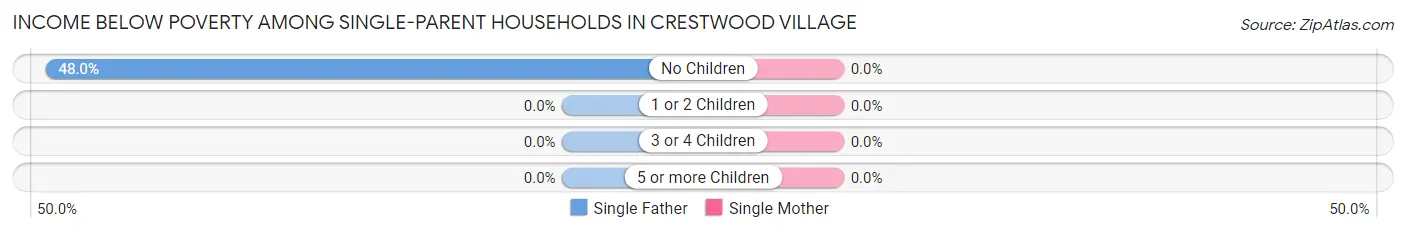
| Children | Single Father | Single Mother |
| No Children | 49 (48.0%) | 0 (0.0%) |
| 1 or 2 Children | 0 (0.0%) | 0 (0.0%) |
| 3 or 4 Children | 0 (0.0%) | 0 (0.0%) |
| 5 or more Children | 0 (0.0%) | 0 (0.0%) |
| Total | 49 (48.0%) | 0 (0.0%) |
Income Below Poverty Among Married-Couple vs Single-Parent Households in Crestwood Village
The poverty data for Crestwood Village shows that 20 of the married-couple family households (1.3%) and 49 of the single-parent households (10.6%) are living below the poverty level. Within the married-couple family households, those with no children have the highest poverty rate, with 20 households (1.3%) falling below the poverty line. Among the single-parent households, those with no children have the highest poverty rate, with 49 household (10.6%) living below poverty.
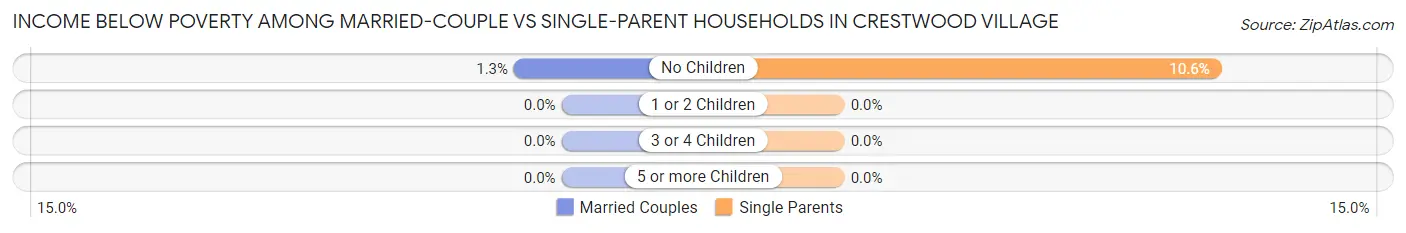
| Children | Married-Couple Families | Single-Parent Households |
| No Children | 20 (1.3%) | 49 (10.6%) |
| 1 or 2 Children | 0 (0.0%) | 0 (0.0%) |
| 3 or 4 Children | 0 (0.0%) | 0 (0.0%) |
| 5 or more Children | 0 (0.0%) | 0 (0.0%) |
| Total | 20 (1.3%) | 49 (10.6%) |
Race in Crestwood Village
The most populous races in Crestwood Village are White / Caucasian (7,947 | 93.7%), Hispanic or Latino (356 | 4.2%), and Black / African American (177 | 2.1%).
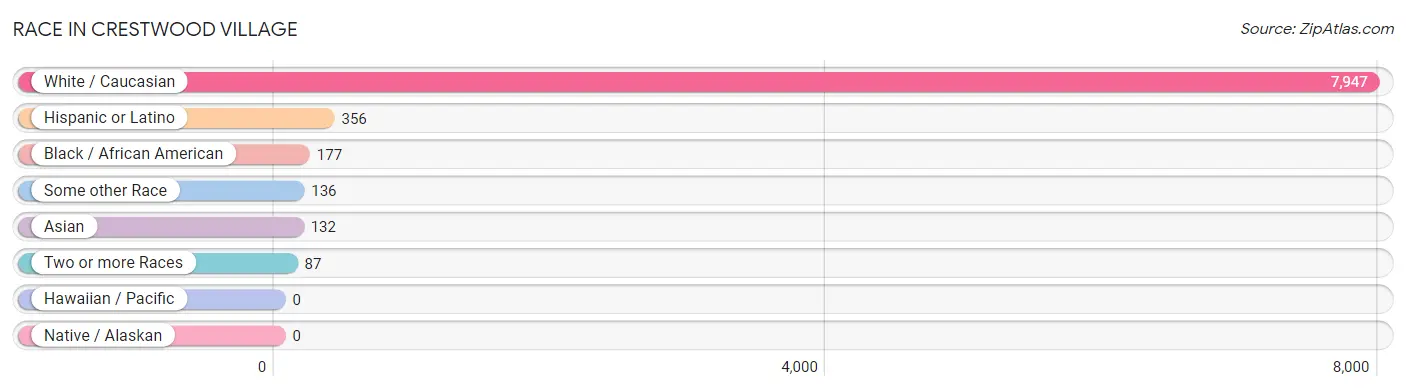
| Race | # Population | % Population |
| Asian | 132 | 1.6% |
| Black / African American | 177 | 2.1% |
| Hawaiian / Pacific | 0 | 0.0% |
| Hispanic or Latino | 356 | 4.2% |
| Native / Alaskan | 0 | 0.0% |
| White / Caucasian | 7,947 | 93.7% |
| Two or more Races | 87 | 1.0% |
| Some other Race | 136 | 1.6% |
| Total | 8,479 | 100.0% |
Ancestry in Crestwood Village
The most populous ancestries reported in Crestwood Village are Irish (2,207 | 26.0%), Italian (2,002 | 23.6%), German (1,763 | 20.8%), English (1,020 | 12.0%), and Polish (1,010 | 11.9%), together accounting for 94.4% of all Crestwood Village residents.
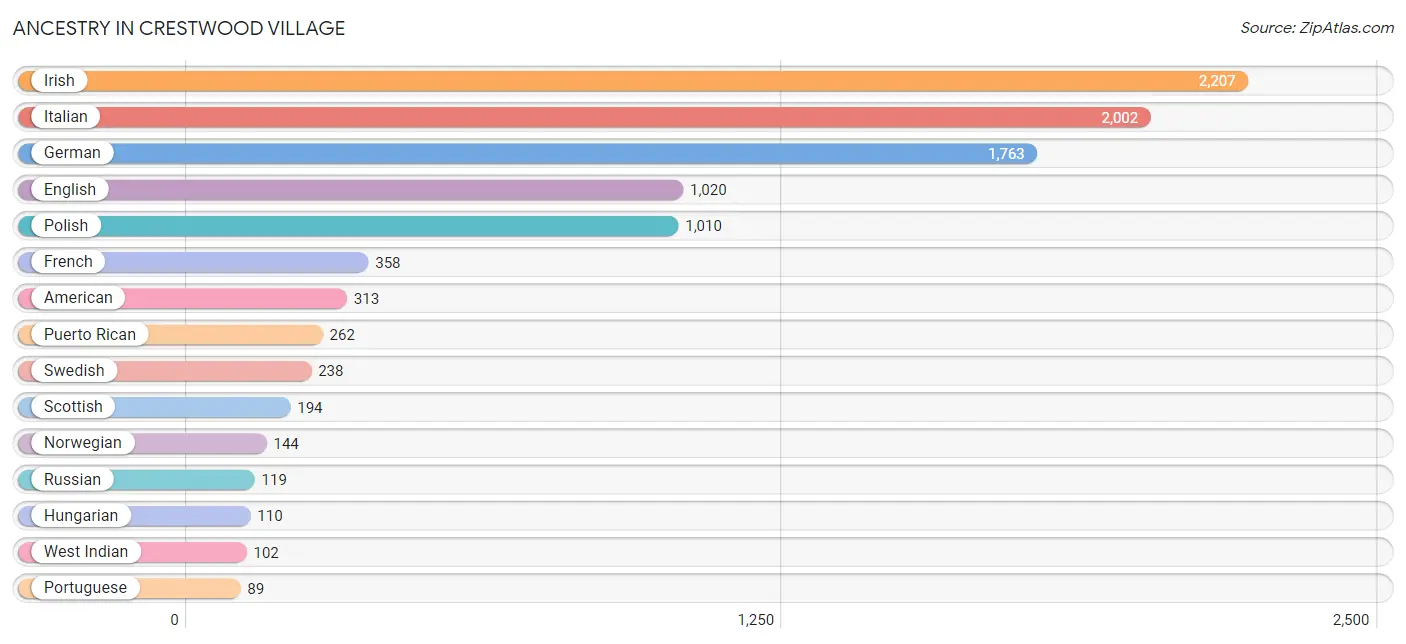
| Ancestry | # Population | % Population |
| American | 313 | 3.7% |
| Arab | 65 | 0.8% |
| Austrian | 15 | 0.2% |
| Belgian | 12 | 0.1% |
| Burmese | 39 | 0.5% |
| Cuban | 30 | 0.4% |
| Czechoslovakian | 19 | 0.2% |
| Danish | 81 | 1.0% |
| Dutch | 72 | 0.9% |
| Eastern European | 14 | 0.2% |
| Ecuadorian | 13 | 0.2% |
| English | 1,020 | 12.0% |
| European | 54 | 0.6% |
| French | 358 | 4.2% |
| French Canadian | 40 | 0.5% |
| German | 1,763 | 20.8% |
| Greek | 26 | 0.3% |
| Hungarian | 110 | 1.3% |
| Indian (Asian) | 23 | 0.3% |
| Irish | 2,207 | 26.0% |
| Italian | 2,002 | 23.6% |
| Jamaican | 35 | 0.4% |
| Korean | 70 | 0.8% |
| Lebanese | 65 | 0.8% |
| Mexican | 13 | 0.2% |
| Norwegian | 144 | 1.7% |
| Peruvian | 19 | 0.2% |
| Polish | 1,010 | 11.9% |
| Portuguese | 89 | 1.1% |
| Puerto Rican | 262 | 3.1% |
| Romanian | 23 | 0.3% |
| Russian | 119 | 1.4% |
| Scotch-Irish | 40 | 0.5% |
| Scottish | 194 | 2.3% |
| Slavic | 1 | 0.0% |
| Slovak | 68 | 0.8% |
| South American | 51 | 0.6% |
| Swedish | 238 | 2.8% |
| Ukrainian | 17 | 0.2% |
| Uruguayan | 19 | 0.2% |
| Welsh | 52 | 0.6% |
| West Indian | 102 | 1.2% | View All 42 Rows |
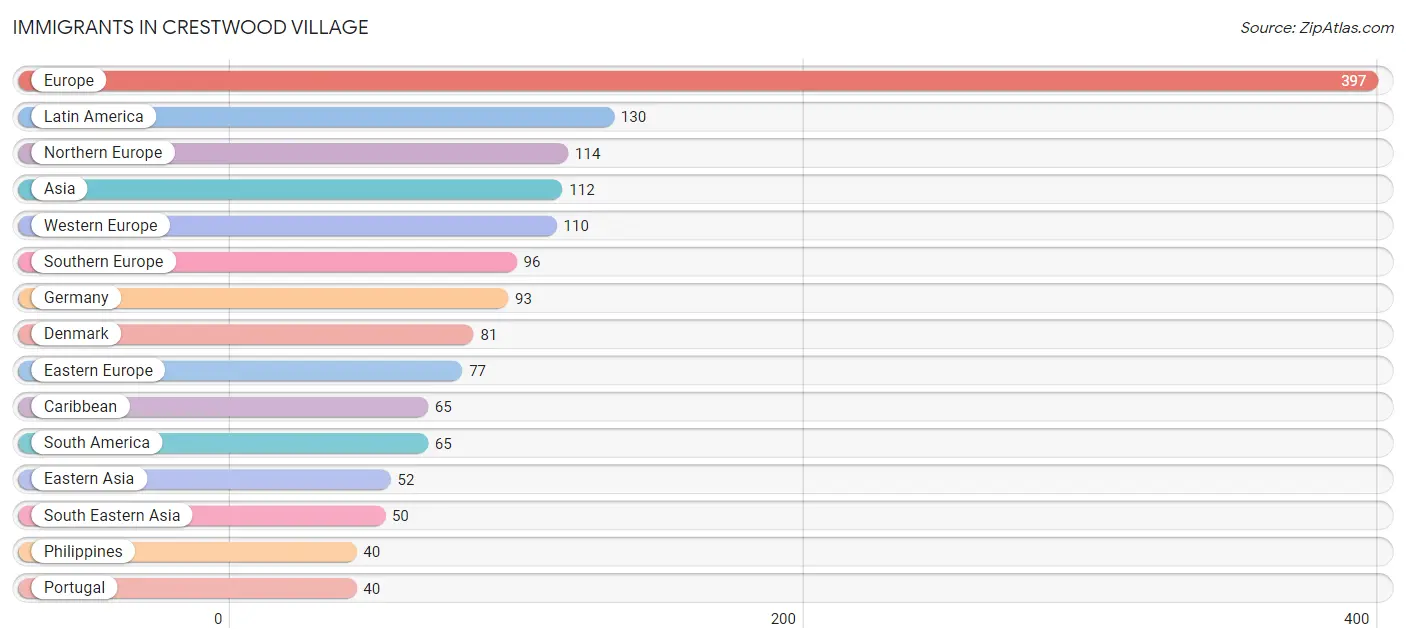
Immigrants in Crestwood Village
The most numerous immigrant groups reported in Crestwood Village came from Europe (397 | 4.7%), Latin America (130 | 1.5%), Northern Europe (114 | 1.3%), Asia (112 | 1.3%), and Western Europe (110 | 1.3%), together accounting for 10.2% of all Crestwood Village residents.
| Immigration Origin | # Population | % Population |
| Asia | 112 | 1.3% |
| Brazil | 14 | 0.2% |
| Canada | 17 | 0.2% |
| Caribbean | 65 | 0.8% |
| China | 13 | 0.2% |
| Cuba | 30 | 0.4% |
| Denmark | 81 | 1.0% |
| Eastern Asia | 52 | 0.6% |
| Eastern Europe | 77 | 0.9% |
| Ecuador | 32 | 0.4% |
| Europe | 397 | 4.7% |
| Germany | 93 | 1.1% |
| Greece | 10 | 0.1% |
| Ireland | 33 | 0.4% |
| Italy | 18 | 0.2% |
| Jamaica | 35 | 0.4% |
| Korea | 39 | 0.5% |
| Latin America | 130 | 1.5% |
| Moldova | 17 | 0.2% |
| Netherlands | 17 | 0.2% |
| Northern Europe | 114 | 1.3% |
| Philippines | 40 | 0.5% |
| Poland | 26 | 0.3% |
| Portugal | 40 | 0.5% |
| Romania | 34 | 0.4% |
| Singapore | 10 | 0.1% |
| South America | 65 | 0.8% |
| South Central Asia | 10 | 0.1% |
| South Eastern Asia | 50 | 0.6% |
| Southern Europe | 96 | 1.1% |
| Spain | 28 | 0.3% |
| Taiwan | 13 | 0.2% |
| Uruguay | 19 | 0.2% |
| Uzbekistan | 10 | 0.1% |
| Western Europe | 110 | 1.3% | View All 35 Rows |
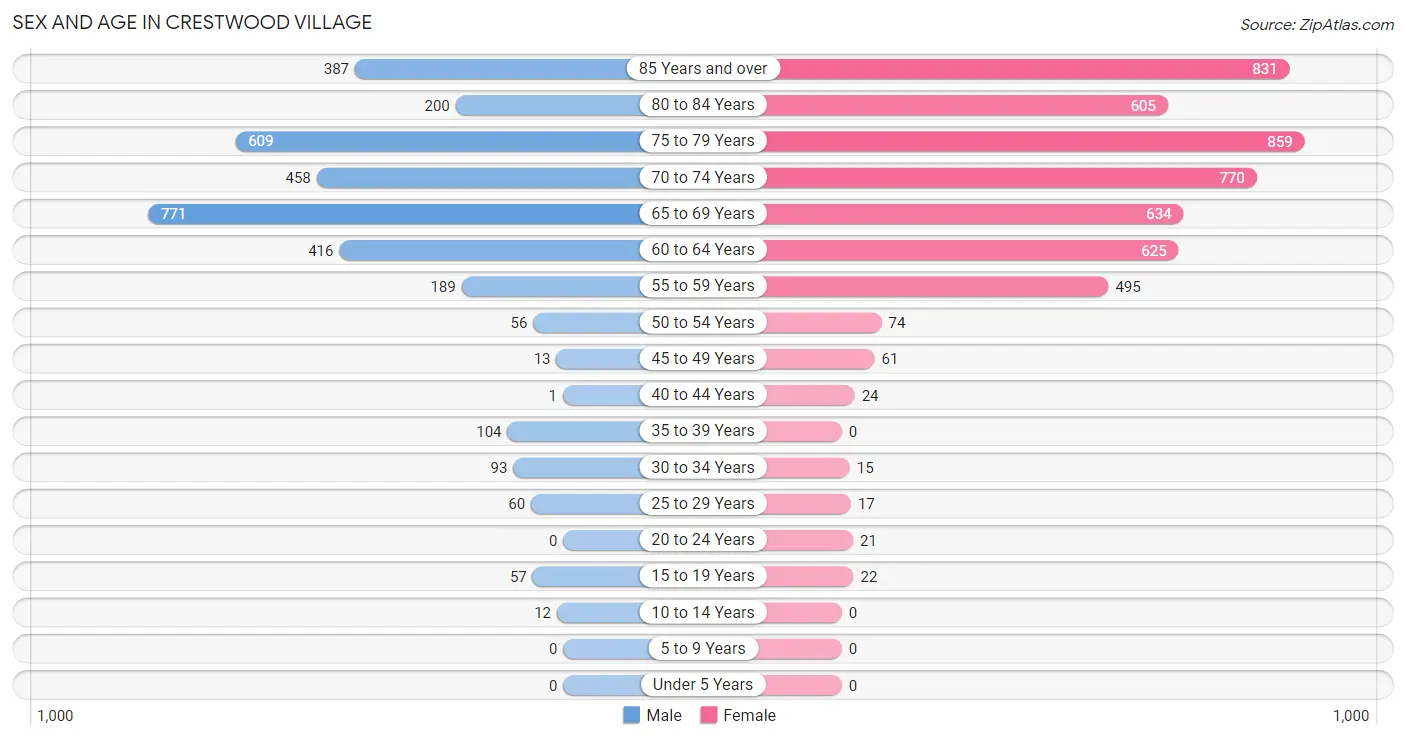
Sex and Age in Crestwood Village
Sex and Age in Crestwood Village
The most populous age groups in Crestwood Village are 65 to 69 Years (771 | 22.5%) for men and 75 to 79 Years (859 | 17.0%) for women.
| Age Bracket | Male | Female |
| Under 5 Years | 0 (0.0%) | 0 (0.0%) |
| 5 to 9 Years | 0 (0.0%) | 0 (0.0%) |
| 10 to 14 Years | 12 (0.4%) | 0 (0.0%) |
| 15 to 19 Years | 57 (1.7%) | 22 (0.4%) |
| 20 to 24 Years | 0 (0.0%) | 21 (0.4%) |
| 25 to 29 Years | 60 (1.8%) | 17 (0.3%) |
| 30 to 34 Years | 93 (2.7%) | 15 (0.3%) |
| 35 to 39 Years | 104 (3.0%) | 0 (0.0%) |
| 40 to 44 Years | 1 (0.0%) | 24 (0.5%) |
| 45 to 49 Years | 13 (0.4%) | 61 (1.2%) |
| 50 to 54 Years | 56 (1.6%) | 74 (1.5%) |
| 55 to 59 Years | 189 (5.5%) | 495 (9.8%) |
| 60 to 64 Years | 416 (12.1%) | 625 (12.4%) |
| 65 to 69 Years | 771 (22.5%) | 634 (12.6%) |
| 70 to 74 Years | 458 (13.4%) | 770 (15.2%) |
| 75 to 79 Years | 609 (17.8%) | 859 (17.0%) |
| 80 to 84 Years | 200 (5.8%) | 605 (12.0%) |
| 85 Years and over | 387 (11.3%) | 831 (16.5%) |
| Total | 3,426 (100.0%) | 5,053 (100.0%) |
Families and Households in Crestwood Village
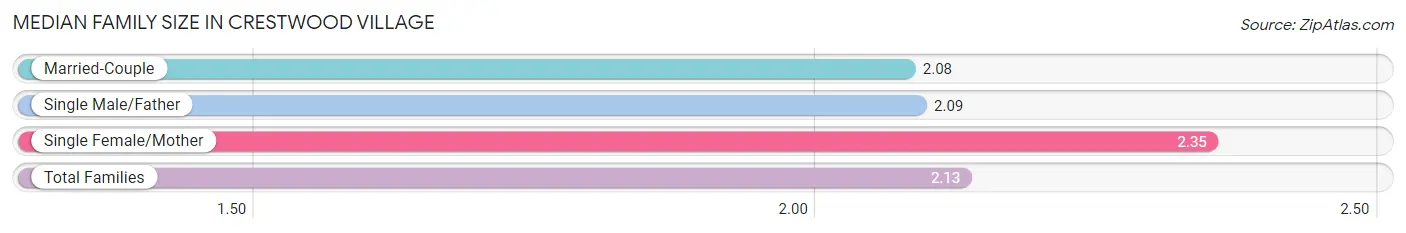
Median Family Size in Crestwood Village
The median family size in Crestwood Village is 2.13 persons per family, with single female/mother families (362 | 18.4%) accounting for the largest median family size of 2.35 persons per family. On the other hand, married-couple families (1,503 | 76.4%) represent the smallest median family size with 2.08 persons per family.
| Family Type | # Families | Family Size |
| Married-Couple | 1,503 (76.4%) | 2.08 |
| Single Male/Father | 102 (5.2%) | 2.09 |
| Single Female/Mother | 362 (18.4%) | 2.35 |
| Total Families | 1,967 (100.0%) | 2.13 |
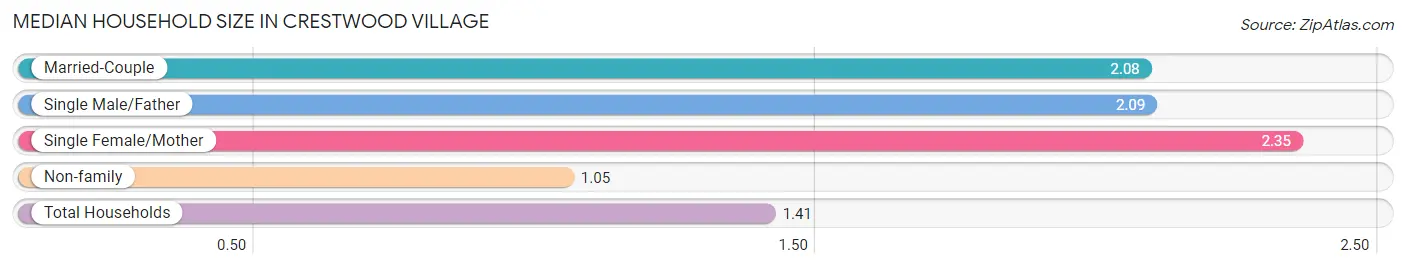
Median Household Size in Crestwood Village
The median household size in Crestwood Village is 1.41 persons per household, with single female/mother households (362 | 6.0%) accounting for the largest median household size of 2.35 persons per household. non-family households (4,012 | 67.1%) represent the smallest median household size with 1.05 persons per household.
| Household Type | # Households | Household Size |
| Married-Couple | 1,503 (25.1%) | 2.08 |
| Single Male/Father | 102 (1.7%) | 2.09 |
| Single Female/Mother | 362 (6.0%) | 2.35 |
| Non-family | 4,012 (67.1%) | 1.05 |
| Total Households | 5,979 (100.0%) | 1.41 |
Household Size by Marriage Status in Crestwood Village
Out of a total of 5,979 households in Crestwood Village, 1,967 (32.9%) are family households, while 4,012 (67.1%) are nonfamily households. The most numerous type of family households are 2-person households, comprising 1,787, and the most common type of nonfamily households are 1-person households, comprising 3,846.
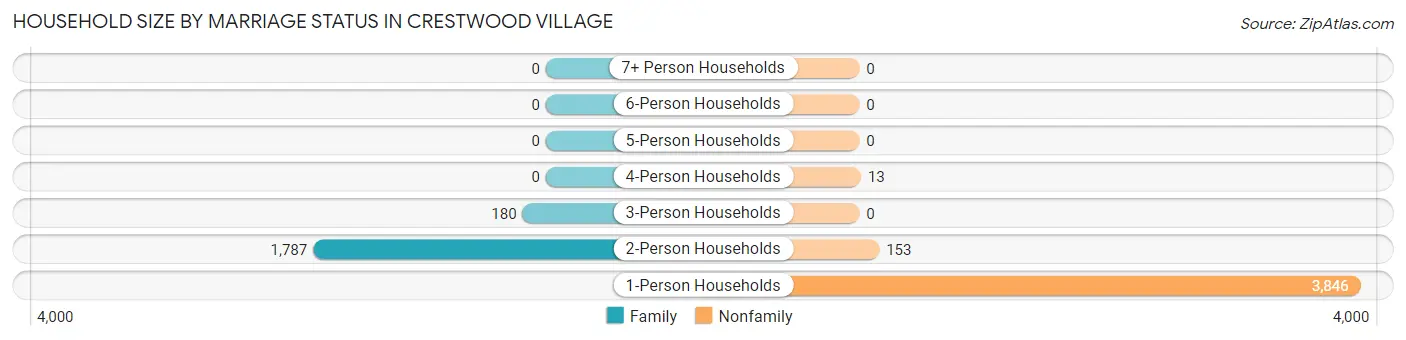
| Household Size | Family Households | Nonfamily Households |
| 1-Person Households | - | 3,846 (64.3%) |
| 2-Person Households | 1,787 (29.9%) | 153 (2.6%) |
| 3-Person Households | 180 (3.0%) | 0 (0.0%) |
| 4-Person Households | 0 (0.0%) | 13 (0.2%) |
| 5-Person Households | 0 (0.0%) | 0 (0.0%) |
| 6-Person Households | 0 (0.0%) | 0 (0.0%) |
| 7+ Person Households | 0 (0.0%) | 0 (0.0%) |
| Total | 1,967 (32.9%) | 4,012 (67.1%) |
Female Fertility in Crestwood Village
Fertility by Age in Crestwood Village
| Age Bracket | Women with Births | Births / 1,000 Women |
| 15 to 19 years | 0 (0.0%) | 0.0 |
| 20 to 34 years | 0 (0.0%) | 0.0 |
| 35 to 50 years | 0 (0.0%) | 0.0 |
| Total | 0 (0.0%) | 0.0 |
Fertility by Age by Marriage Status in Crestwood Village
| Age Bracket | Married | Unmarried |
| 15 to 19 years | 0 (0.0%) | 0 (0.0%) |
| 20 to 34 years | 0 (0.0%) | 0 (0.0%) |
| 35 to 50 years | 0 (0.0%) | 0 (0.0%) |
| Total | 0 (0.0%) | 0 (0.0%) |
Fertility by Education in Crestwood Village
| Educational Attainment | Women with Births | Births / 1,000 Women |
| Less than High School | 0 (0.0%) | 0.0 |
| High School Diploma | 0 (0.0%) | 0.0 |
| College or Associate's Degree | 0 (0.0%) | 0.0 |
| Bachelor's Degree | 0 (0.0%) | 0.0 |
| Graduate Degree | 0 (0.0%) | 0.0 |
| Total | 0 (0.0%) | 0.0 |
Fertility by Education by Marriage Status in Crestwood Village
| Educational Attainment | Married | Unmarried |
| Less than High School | 0 (0.0%) | 0 (0.0%) |
| High School Diploma | 0 (0.0%) | 0 (0.0%) |
| College or Associate's Degree | 0 (0.0%) | 0 (0.0%) |
| Bachelor's Degree | 0 (0.0%) | 0 (0.0%) |
| Graduate Degree | 0 (0.0%) | 0 (0.0%) |
| Total | 0 (0.0%) | 0 (0.0%) |
Employment Characteristics in Crestwood Village
Employment by Class of Employer in Crestwood Village
Among the 1,614 employed individuals in Crestwood Village, private company employees (934 | 57.9%), not-for-profit organizations (188 | 11.7%), and local government employees (145 | 9.0%) make up the most common classes of employment.
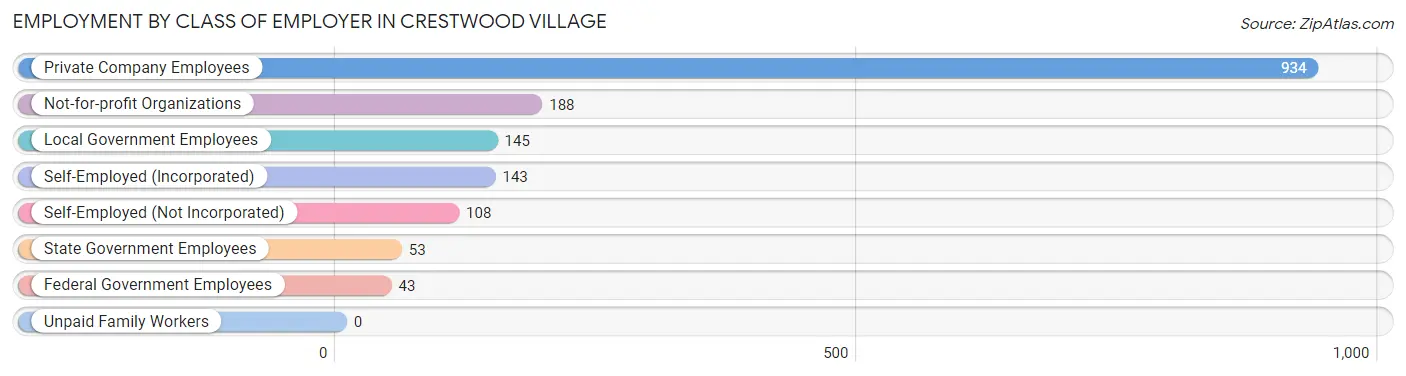
| Employer Class | # Employees | % Employees |
| Private Company Employees | 934 | 57.9% |
| Self-Employed (Incorporated) | 143 | 8.9% |
| Self-Employed (Not Incorporated) | 108 | 6.7% |
| Not-for-profit Organizations | 188 | 11.7% |
| Local Government Employees | 145 | 9.0% |
| State Government Employees | 53 | 3.3% |
| Federal Government Employees | 43 | 2.7% |
| Unpaid Family Workers | 0 | 0.0% |
| Total | 1,614 | 100.0% |
Employment Status by Age in Crestwood Village
According to the labor force statistics for Crestwood Village, out of the total population over 16 years of age (8,445), 22.9% or 1,934 individuals are in the labor force, with 13.0% or 251 of them unemployed. The age group with the highest labor force participation rate is 20 to 24 years, with 100.0% or 21 individuals in the labor force. Within the labor force, the 25 to 29 years age range has the highest percentage of unemployed individuals, with 32.1% or 17 of them being unemployed.
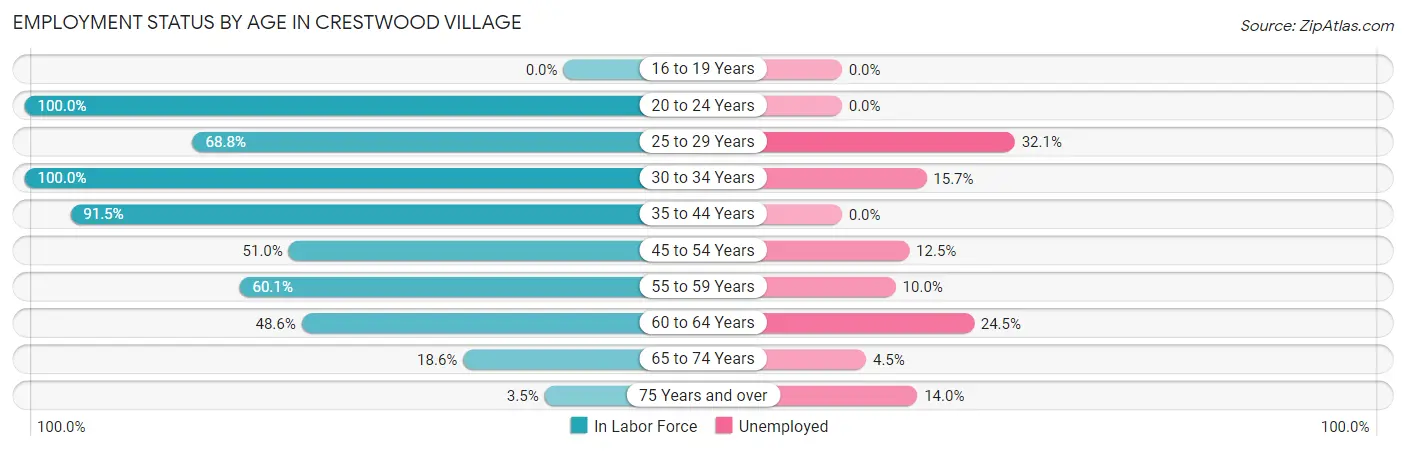
| Age Bracket | In Labor Force | Unemployed |
| 16 to 19 Years | 0 (0.0%) | 0 (0.0%) |
| 20 to 24 Years | 21 (100.0%) | 0 (0.0%) |
| 25 to 29 Years | 53 (68.8%) | 17 (32.1%) |
| 30 to 34 Years | 108 (100.0%) | 17 (15.7%) |
| 35 to 44 Years | 118 (91.5%) | 0 (0.0%) |
| 45 to 54 Years | 104 (51.0%) | 13 (12.5%) |
| 55 to 59 Years | 411 (60.1%) | 41 (10.0%) |
| 60 to 64 Years | 506 (48.6%) | 124 (24.5%) |
| 65 to 74 Years | 490 (18.6%) | 22 (4.5%) |
| 75 Years and over | 122 (3.5%) | 17 (14.0%) |
| Total | 1,934 (22.9%) | 251 (13.0%) |
Employment Status by Educational Attainment in Crestwood Village
According to labor force statistics for Crestwood Village, 58.0% of individuals (1,301) out of the total population between 25 and 64 years of age (2,243) are in the labor force, with 16.3% or 212 of them being unemployed. The group with the highest labor force participation rate are those with the educational attainment of high school diploma, with 68.1% or 577 individuals in the labor force. Within the labor force, individuals with bachelor's degree or higher education have the highest percentage of unemployment, with 21.8% or 78 of them being unemployed.
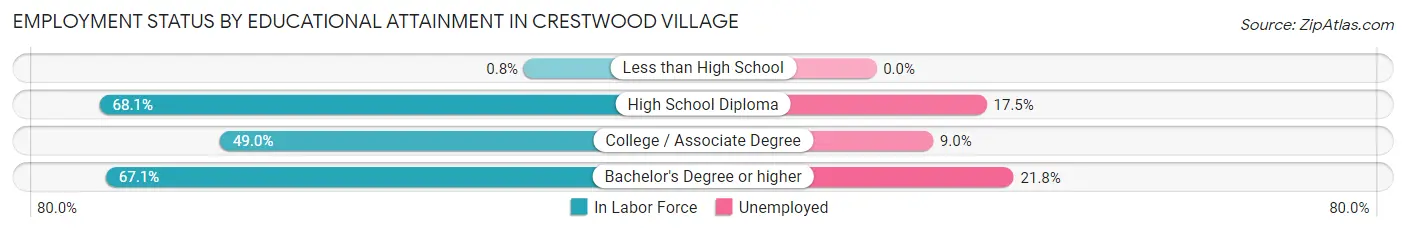
| Educational Attainment | In Labor Force | Unemployed |
| Less than High School | 1 (0.8%) | 0 (0.0%) |
| High School Diploma | 577 (68.1%) | 148 (17.5%) |
| College / Associate Degree | 365 (49.0%) | 67 (9.0%) |
| Bachelor's Degree or higher | 357 (67.1%) | 116 (21.8%) |
| Total | 1,301 (58.0%) | 366 (16.3%) |
Employment Occupations by Sex in Crestwood Village
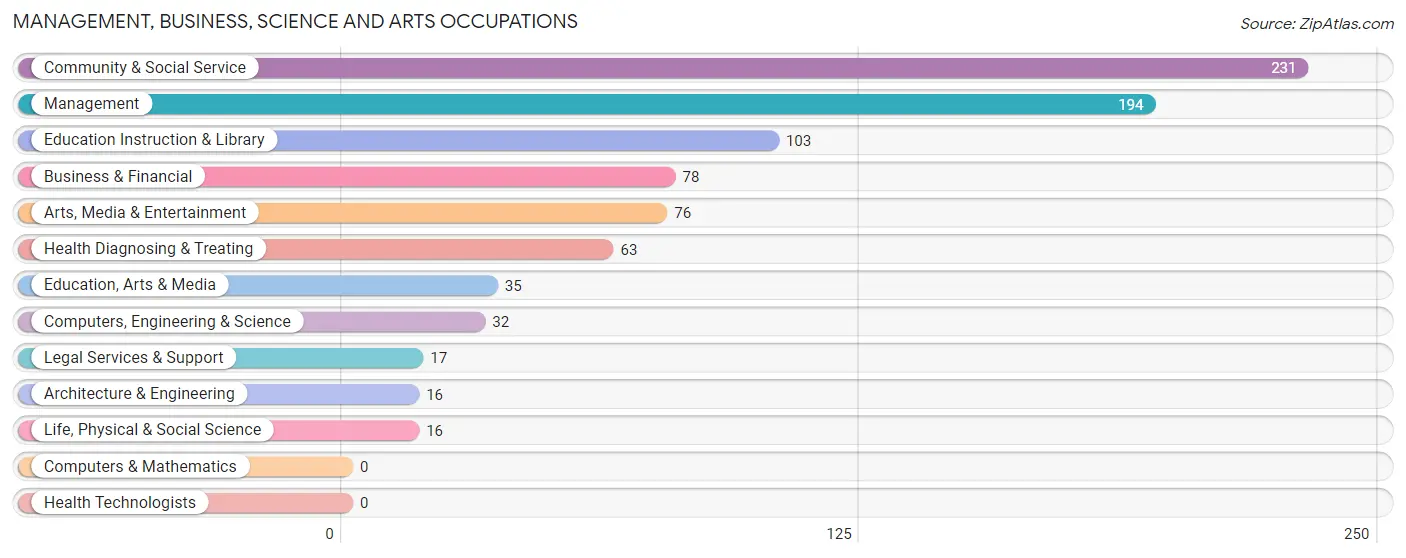
Management, Business, Science and Arts Occupations
The most common Management, Business, Science and Arts occupations in Crestwood Village are Community & Social Service (231 | 13.7%), Management (194 | 11.5%), Education Instruction & Library (103 | 6.1%), Business & Financial (78 | 4.6%), and Arts, Media & Entertainment (76 | 4.5%).
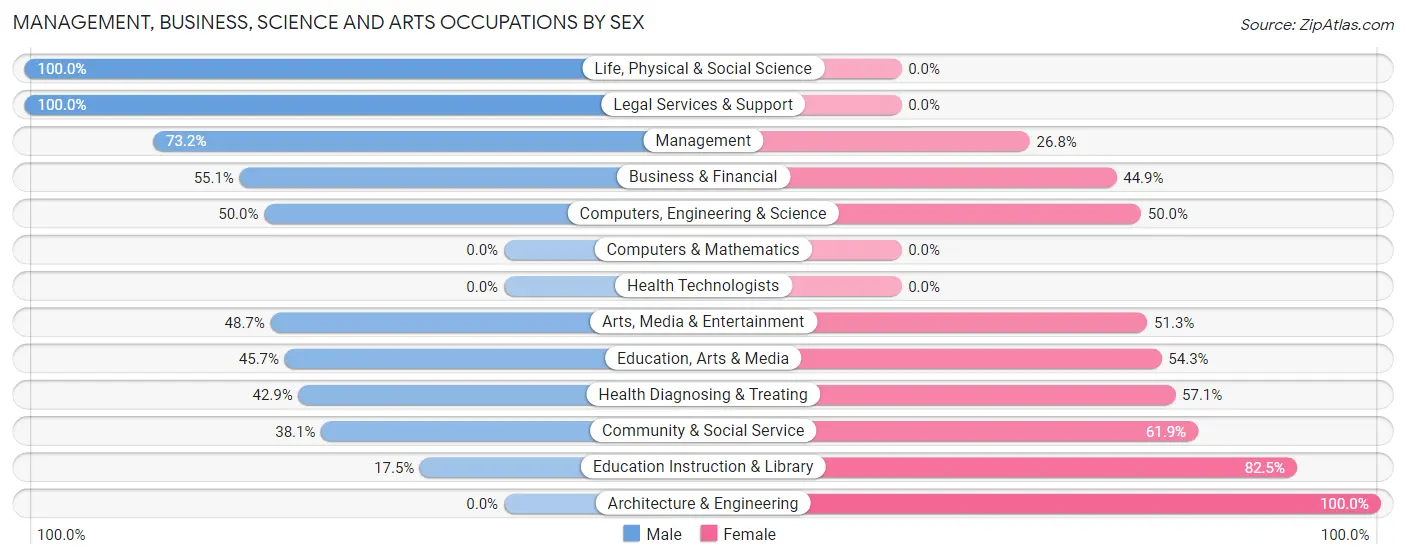
Management, Business, Science and Arts Occupations by Sex
Within the Management, Business, Science and Arts occupations in Crestwood Village, the most male-oriented occupations are Life, Physical & Social Science (100.0%), Legal Services & Support (100.0%), and Management (73.2%), while the most female-oriented occupations are Architecture & Engineering (100.0%), Education Instruction & Library (82.5%), and Community & Social Service (61.9%).
| Occupation | Male | Female |
| Management | 142 (73.2%) | 52 (26.8%) |
| Business & Financial | 43 (55.1%) | 35 (44.9%) |
| Computers, Engineering & Science | 16 (50.0%) | 16 (50.0%) |
| Computers & Mathematics | 0 (0.0%) | 0 (0.0%) |
| Architecture & Engineering | 0 (0.0%) | 16 (100.0%) |
| Life, Physical & Social Science | 16 (100.0%) | 0 (0.0%) |
| Community & Social Service | 88 (38.1%) | 143 (61.9%) |
| Education, Arts & Media | 16 (45.7%) | 19 (54.3%) |
| Legal Services & Support | 17 (100.0%) | 0 (0.0%) |
| Education Instruction & Library | 18 (17.5%) | 85 (82.5%) |
| Arts, Media & Entertainment | 37 (48.7%) | 39 (51.3%) |
| Health Diagnosing & Treating | 27 (42.9%) | 36 (57.1%) |
| Health Technologists | 0 (0.0%) | 0 (0.0%) |
| Total (Category) | 316 (52.8%) | 282 (47.2%) |
| Total (Overall) | 755 (44.9%) | 927 (55.1%) |
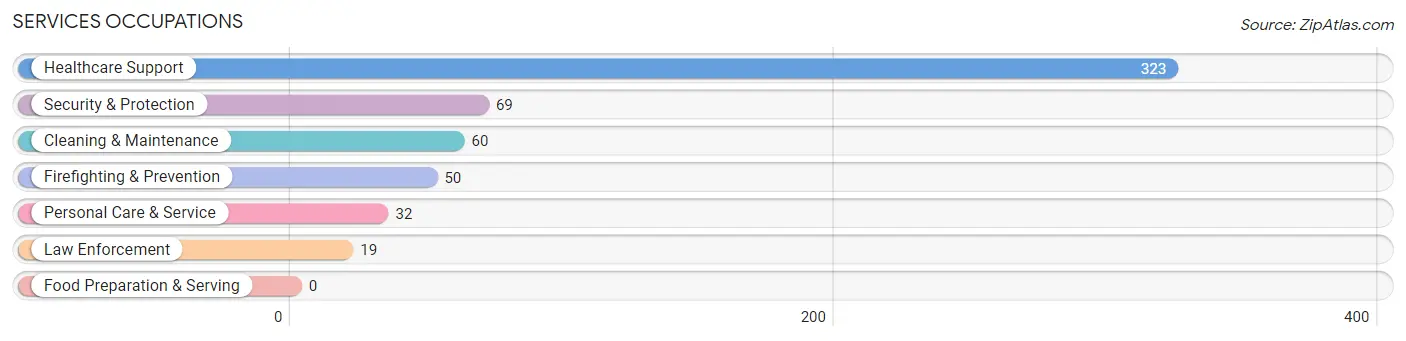
Services Occupations
The most common Services occupations in Crestwood Village are Healthcare Support (323 | 19.2%), Security & Protection (69 | 4.1%), Cleaning & Maintenance (60 | 3.6%), Firefighting & Prevention (50 | 3.0%), and Personal Care & Service (32 | 1.9%).
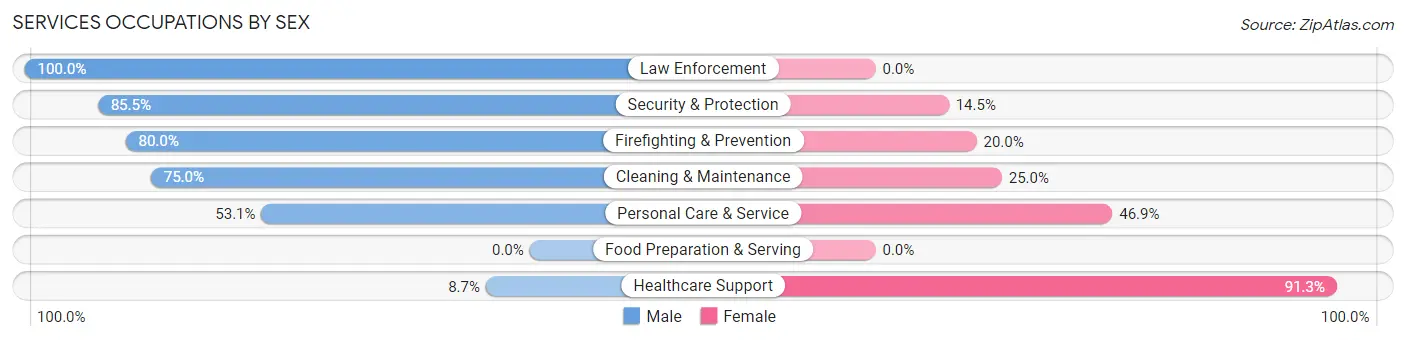
Services Occupations by Sex
Within the Services occupations in Crestwood Village, the most male-oriented occupations are Law Enforcement (100.0%), Security & Protection (85.5%), and Firefighting & Prevention (80.0%), while the most female-oriented occupations are Healthcare Support (91.3%), Personal Care & Service (46.9%), and Cleaning & Maintenance (25.0%).
| Occupation | Male | Female |
| Healthcare Support | 28 (8.7%) | 295 (91.3%) |
| Security & Protection | 59 (85.5%) | 10 (14.5%) |
| Firefighting & Prevention | 40 (80.0%) | 10 (20.0%) |
| Law Enforcement | 19 (100.0%) | 0 (0.0%) |
| Food Preparation & Serving | 0 (0.0%) | 0 (0.0%) |
| Cleaning & Maintenance | 45 (75.0%) | 15 (25.0%) |
| Personal Care & Service | 17 (53.1%) | 15 (46.9%) |
| Total (Category) | 149 (30.8%) | 335 (69.2%) |
| Total (Overall) | 755 (44.9%) | 927 (55.1%) |
Sales and Office Occupations
The most common Sales and Office occupations in Crestwood Village are Office & Administration (216 | 12.8%), and Sales & Related (99 | 5.9%).
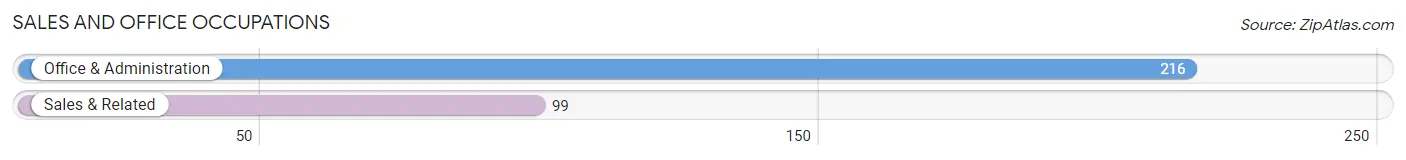
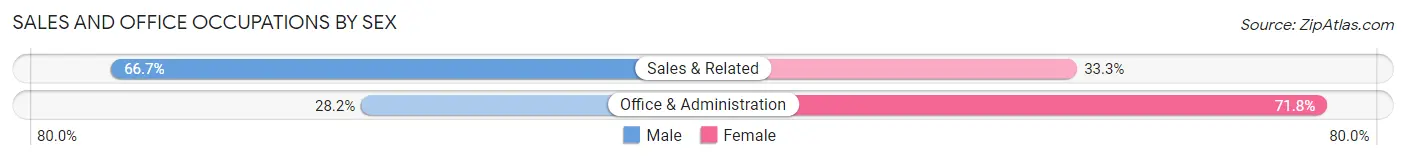
Sales and Office Occupations by Sex
| Occupation | Male | Female |
| Sales & Related | 66 (66.7%) | 33 (33.3%) |
| Office & Administration | 61 (28.2%) | 155 (71.8%) |
| Total (Category) | 127 (40.3%) | 188 (59.7%) |
| Total (Overall) | 755 (44.9%) | 927 (55.1%) |
Natural Resources, Construction and Maintenance Occupations
The most common Natural Resources, Construction and Maintenance occupations in Crestwood Village are , and Construction & Extraction (28 | 1.7%).
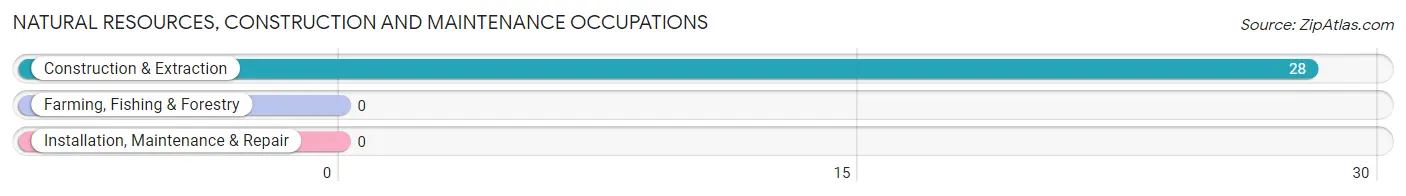
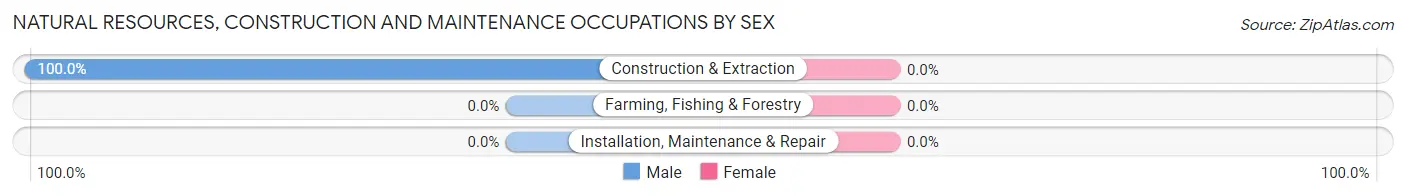
Natural Resources, Construction and Maintenance Occupations by Sex
| Occupation | Male | Female |
| Farming, Fishing & Forestry | 0 (0.0%) | 0 (0.0%) |
| Construction & Extraction | 28 (100.0%) | 0 (0.0%) |
| Installation, Maintenance & Repair | 0 (0.0%) | 0 (0.0%) |
| Total (Category) | 28 (100.0%) | 0 (0.0%) |
| Total (Overall) | 755 (44.9%) | 927 (55.1%) |
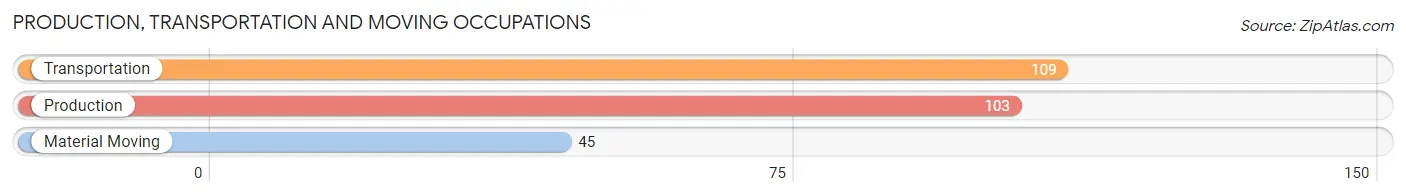
Production, Transportation and Moving Occupations
The most common Production, Transportation and Moving occupations in Crestwood Village are Transportation (109 | 6.5%), Production (103 | 6.1%), and Material Moving (45 | 2.7%).
Production, Transportation and Moving Occupations by Sex
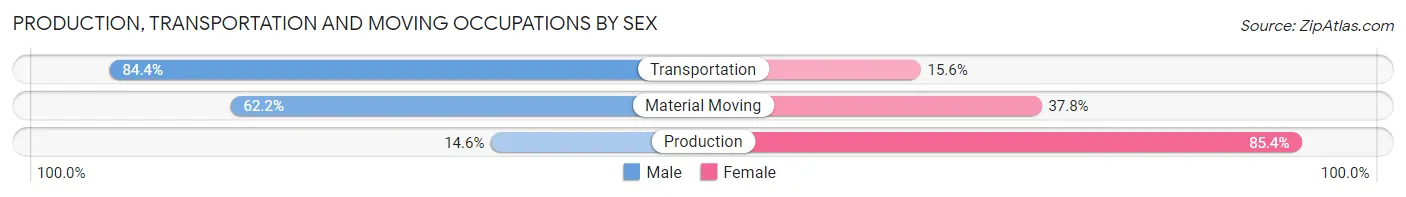
| Occupation | Male | Female |
| Production | 15 (14.6%) | 88 (85.4%) |
| Transportation | 92 (84.4%) | 17 (15.6%) |
| Material Moving | 28 (62.2%) | 17 (37.8%) |
| Total (Category) | 135 (52.5%) | 122 (47.5%) |
| Total (Overall) | 755 (44.9%) | 927 (55.1%) |
Employment Industries by Sex in Crestwood Village
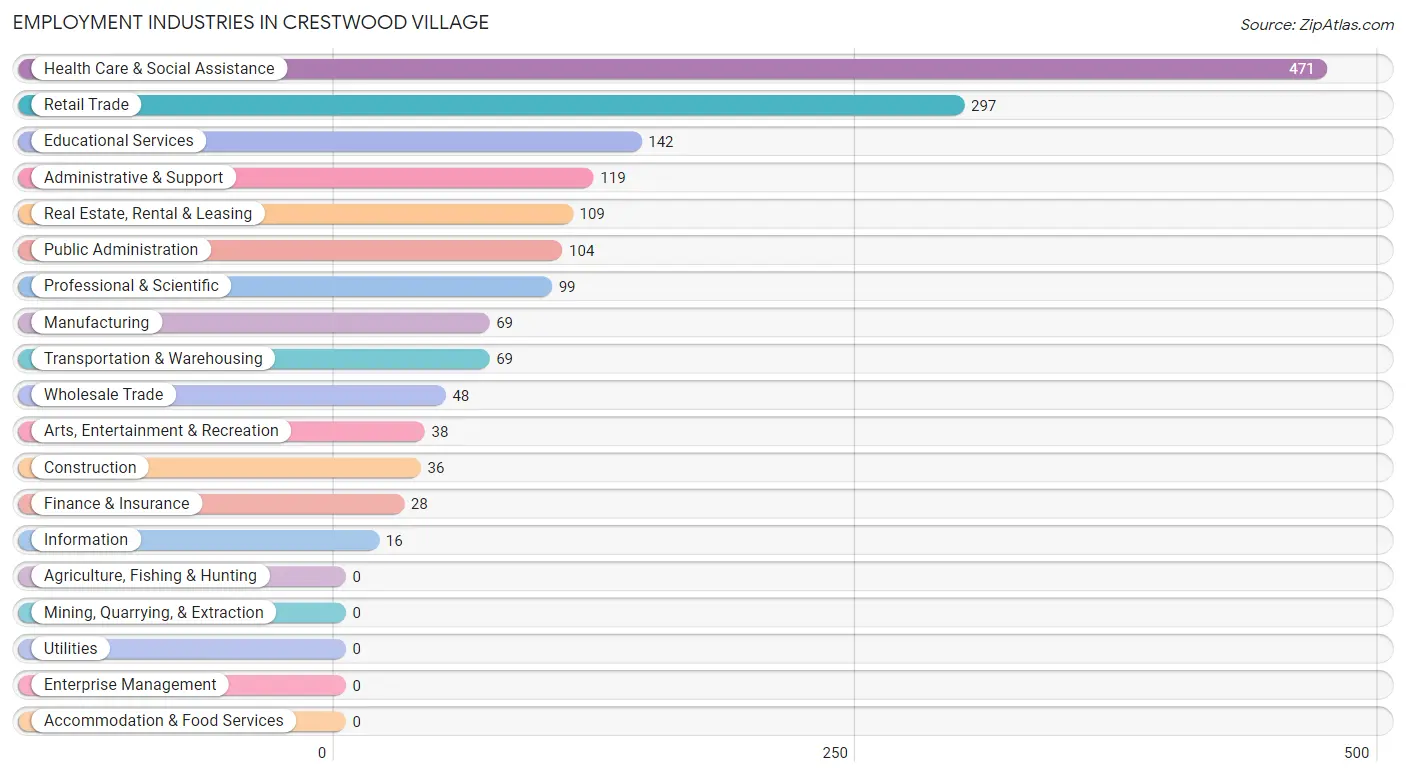
Employment Industries in Crestwood Village
The major employment industries in Crestwood Village include Health Care & Social Assistance (471 | 28.0%), Retail Trade (297 | 17.7%), Educational Services (142 | 8.4%), Administrative & Support (119 | 7.1%), and Real Estate, Rental & Leasing (109 | 6.5%).
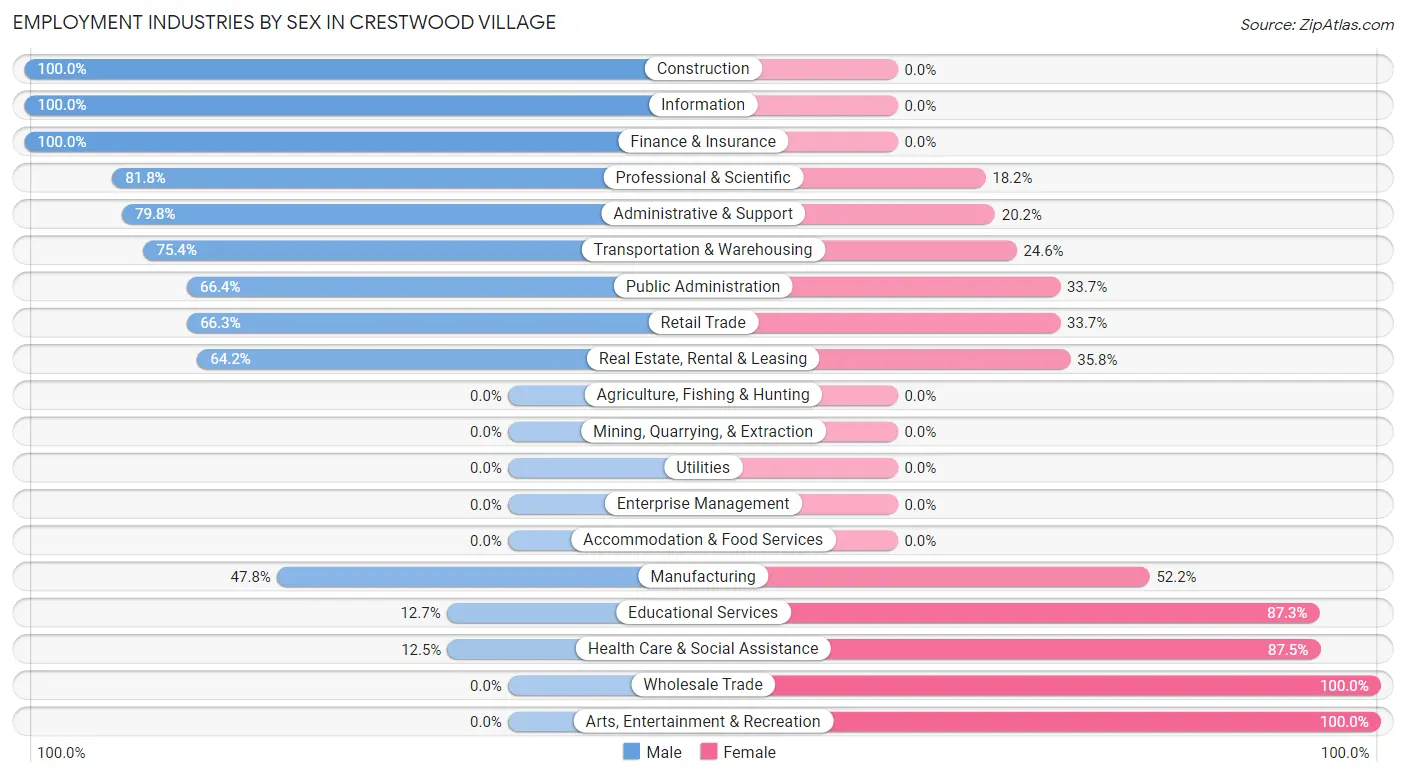
Employment Industries by Sex in Crestwood Village
The Crestwood Village industries that see more men than women are Construction (100.0%), Information (100.0%), and Finance & Insurance (100.0%), whereas the industries that tend to have a higher number of women are Wholesale Trade (100.0%), Arts, Entertainment & Recreation (100.0%), and Health Care & Social Assistance (87.5%).
| Industry | Male | Female |
| Agriculture, Fishing & Hunting | 0 (0.0%) | 0 (0.0%) |
| Mining, Quarrying, & Extraction | 0 (0.0%) | 0 (0.0%) |
| Construction | 36 (100.0%) | 0 (0.0%) |
| Manufacturing | 33 (47.8%) | 36 (52.2%) |
| Wholesale Trade | 0 (0.0%) | 48 (100.0%) |
| Retail Trade | 197 (66.3%) | 100 (33.7%) |
| Transportation & Warehousing | 52 (75.4%) | 17 (24.6%) |
| Utilities | 0 (0.0%) | 0 (0.0%) |
| Information | 16 (100.0%) | 0 (0.0%) |
| Finance & Insurance | 28 (100.0%) | 0 (0.0%) |
| Real Estate, Rental & Leasing | 70 (64.2%) | 39 (35.8%) |
| Professional & Scientific | 81 (81.8%) | 18 (18.2%) |
| Enterprise Management | 0 (0.0%) | 0 (0.0%) |
| Administrative & Support | 95 (79.8%) | 24 (20.2%) |
| Educational Services | 18 (12.7%) | 124 (87.3%) |
| Health Care & Social Assistance | 59 (12.5%) | 412 (87.5%) |
| Arts, Entertainment & Recreation | 0 (0.0%) | 38 (100.0%) |
| Accommodation & Food Services | 0 (0.0%) | 0 (0.0%) |
| Public Administration | 69 (66.3%) | 35 (33.7%) |
| Total | 755 (44.9%) | 927 (55.1%) |
Education in Crestwood Village
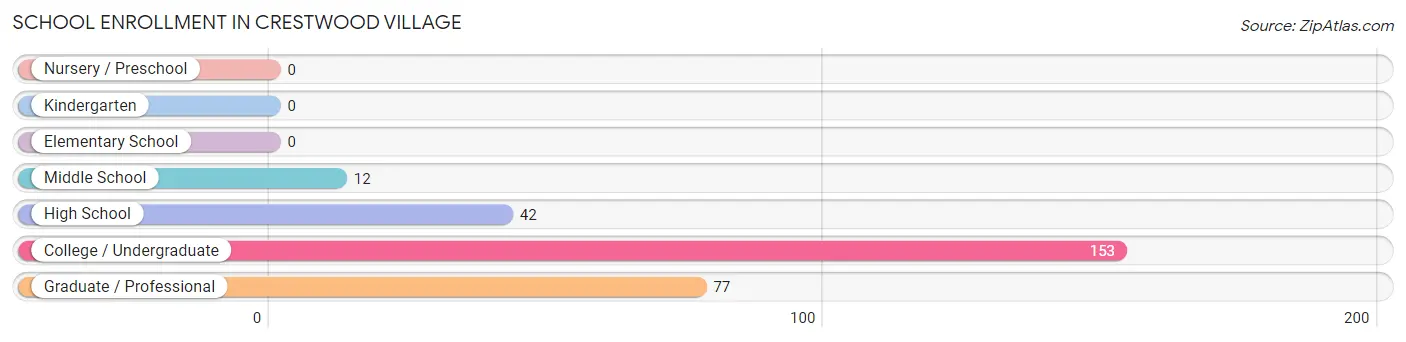
School Enrollment in Crestwood Village
The most common levels of schooling among the 284 students in Crestwood Village are college / undergraduate (153 | 53.9%), graduate / professional (77 | 27.1%), and high school (42 | 14.8%).
| School Level | # Students | % Students |
| Nursery / Preschool | 0 | 0.0% |
| Kindergarten | 0 | 0.0% |
| Elementary School | 0 | 0.0% |
| Middle School | 12 | 4.2% |
| High School | 42 | 14.8% |
| College / Undergraduate | 153 | 53.9% |
| Graduate / Professional | 77 | 27.1% |
| Total | 284 | 100.0% |
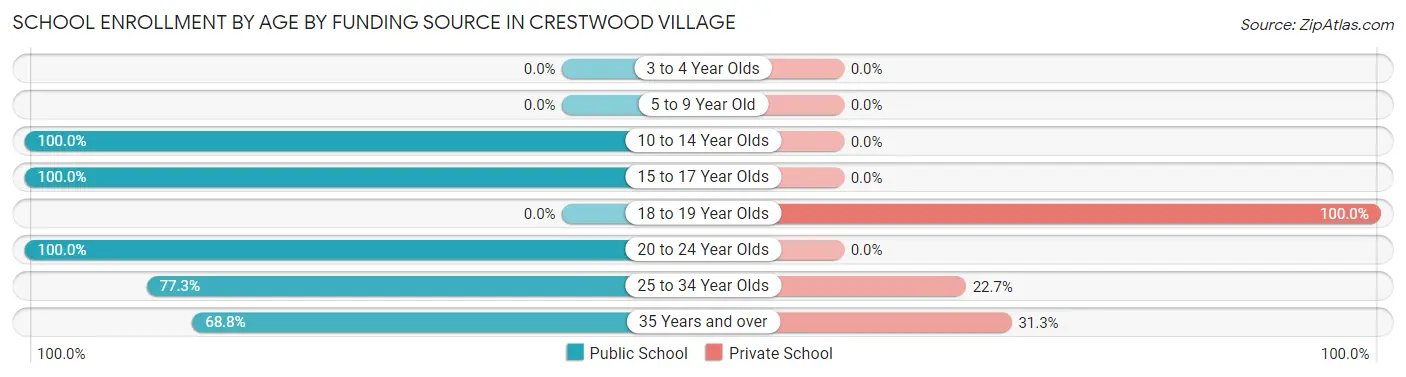
School Enrollment by Age by Funding Source in Crestwood Village
Out of a total of 284 students who are enrolled in schools in Crestwood Village, 107 (37.7%) attend a private institution, while the remaining 177 (62.3%) are enrolled in public schools. The age group of 18 to 19 year olds has the highest likelihood of being enrolled in private schools, with 57 (100.0% in the age bracket) enrolled. Conversely, the age group of 10 to 14 year olds has the lowest likelihood of being enrolled in a private school, with 12 (100.0% in the age bracket) attending a public institution.
| Age Bracket | Public School | Private School |
| 3 to 4 Year Olds | 0 (0.0%) | 0 (0.0%) |
| 5 to 9 Year Old | 0 (0.0%) | 0 (0.0%) |
| 10 to 14 Year Olds | 12 (100.0%) | 0 (0.0%) |
| 15 to 17 Year Olds | 22 (100.0%) | 0 (0.0%) |
| 18 to 19 Year Olds | 0 (0.0%) | 57 (100.0%) |
| 20 to 24 Year Olds | 21 (100.0%) | 0 (0.0%) |
| 25 to 34 Year Olds | 34 (77.3%) | 10 (22.7%) |
| 35 Years and over | 88 (68.8%) | 40 (31.2%) |
| Total | 177 (62.3%) | 107 (37.7%) |
Educational Attainment by Field of Study in Crestwood Village
Education (485 | 27.3%), science & technology (198 | 11.1%), business (196 | 11.0%), liberal arts & history (188 | 10.6%), and social sciences (147 | 8.3%) are the most common fields of study among 1,779 individuals in Crestwood Village who have obtained a bachelor's degree or higher.
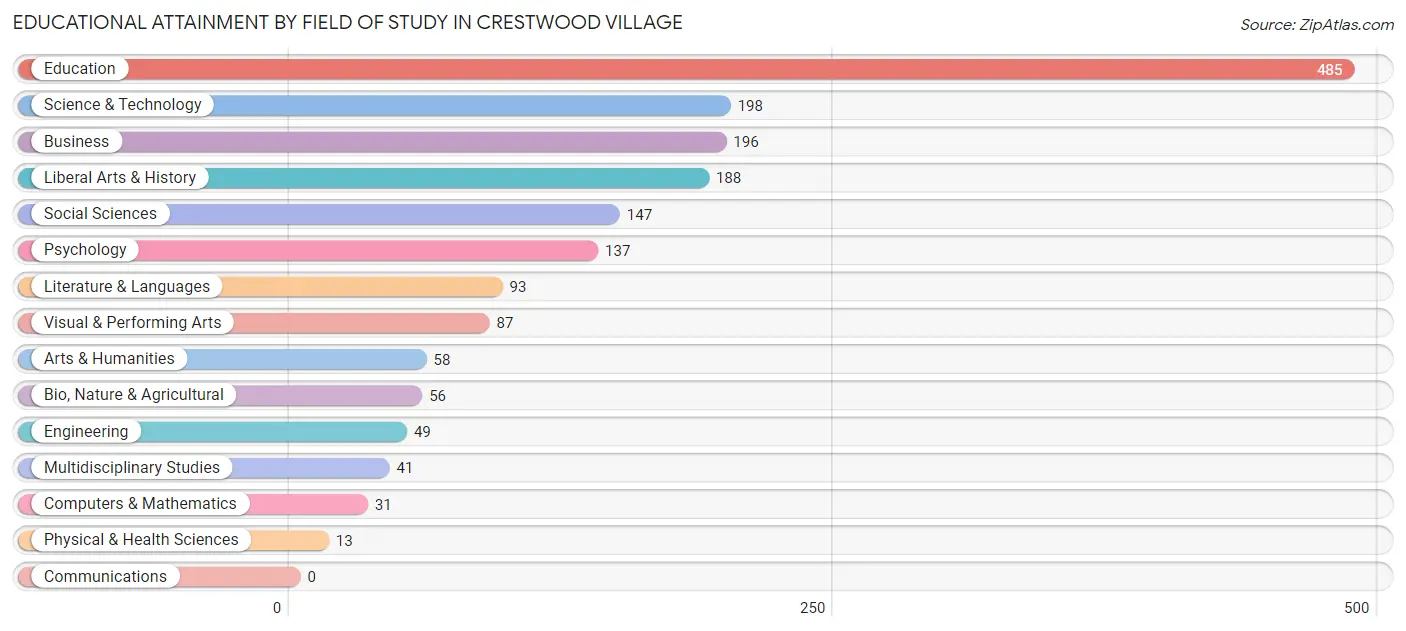
| Field of Study | # Graduates | % Graduates |
| Computers & Mathematics | 31 | 1.7% |
| Bio, Nature & Agricultural | 56 | 3.2% |
| Physical & Health Sciences | 13 | 0.7% |
| Psychology | 137 | 7.7% |
| Social Sciences | 147 | 8.3% |
| Engineering | 49 | 2.8% |
| Multidisciplinary Studies | 41 | 2.3% |
| Science & Technology | 198 | 11.1% |
| Business | 196 | 11.0% |
| Education | 485 | 27.3% |
| Literature & Languages | 93 | 5.2% |
| Liberal Arts & History | 188 | 10.6% |
| Visual & Performing Arts | 87 | 4.9% |
| Communications | 0 | 0.0% |
| Arts & Humanities | 58 | 3.3% |
| Total | 1,779 | 100.0% |
Transportation & Commute in Crestwood Village
Vehicle Availability by Sex in Crestwood Village
The most prevalent vehicle ownership categories in Crestwood Village are males with 2 vehicles (339, accounting for 48.2%) and females with 2 vehicles (322, making up 37.3%).
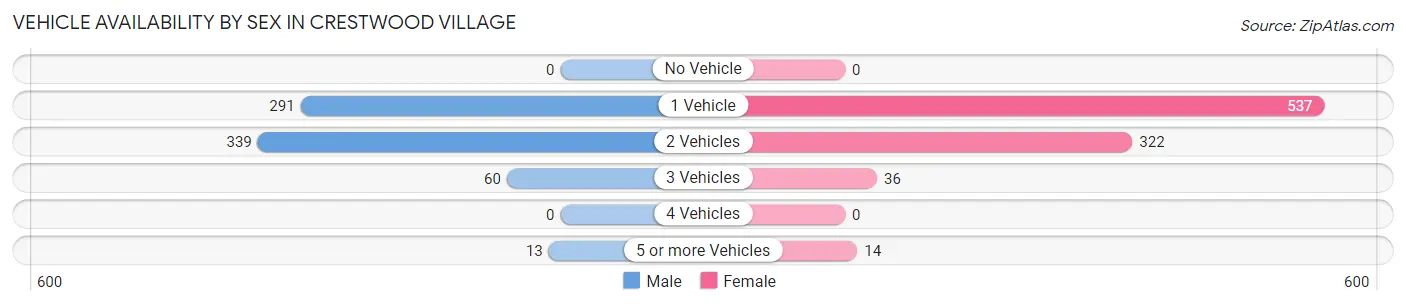
| Vehicles Available | Male | Female |
| No Vehicle | 0 (0.0%) | 0 (0.0%) |
| 1 Vehicle | 291 (41.4%) | 537 (59.1%) |
| 2 Vehicles | 339 (48.2%) | 322 (35.4%) |
| 3 Vehicles | 60 (8.5%) | 36 (4.0%) |
| 4 Vehicles | 0 (0.0%) | 0 (0.0%) |
| 5 or more Vehicles | 13 (1.8%) | 14 (1.5%) |
| Total | 703 (100.0%) | 909 (100.0%) |
Commute Time in Crestwood Village
The most frequently occuring commute durations in Crestwood Village are 30 to 34 minutes (369 commuters, 25.2%), 20 to 24 minutes (237 commuters, 16.2%), and 5 to 9 minutes (200 commuters, 13.7%).
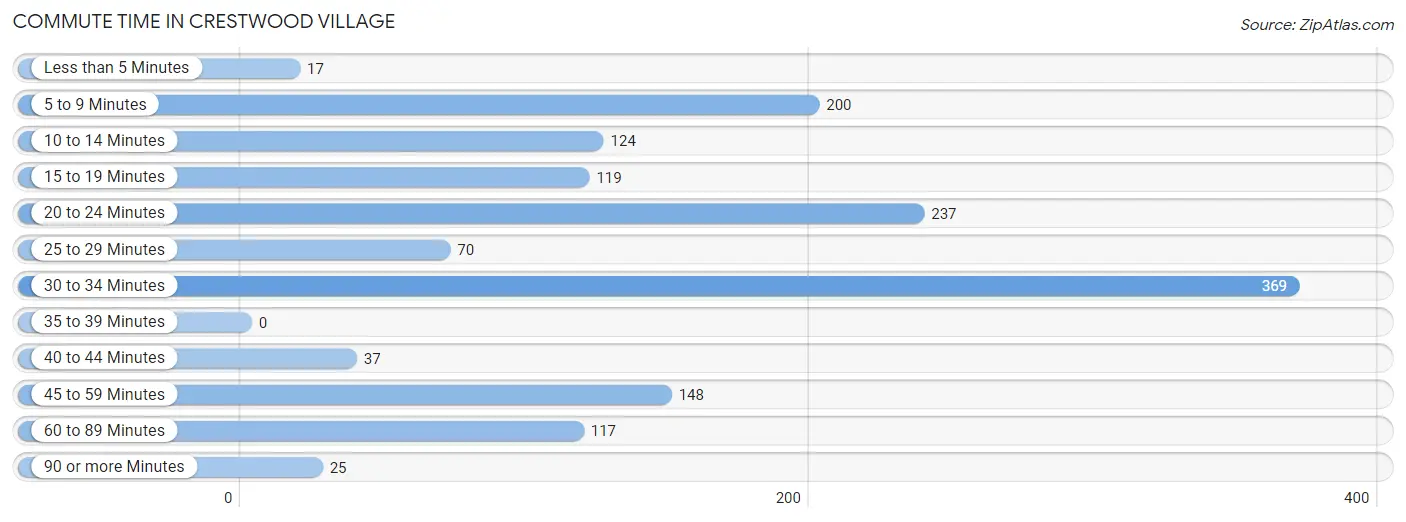
| Commute Time | # Commuters | % Commuters |
| Less than 5 Minutes | 17 | 1.2% |
| 5 to 9 Minutes | 200 | 13.7% |
| 10 to 14 Minutes | 124 | 8.5% |
| 15 to 19 Minutes | 119 | 8.1% |
| 20 to 24 Minutes | 237 | 16.2% |
| 25 to 29 Minutes | 70 | 4.8% |
| 30 to 34 Minutes | 369 | 25.2% |
| 35 to 39 Minutes | 0 | 0.0% |
| 40 to 44 Minutes | 37 | 2.5% |
| 45 to 59 Minutes | 148 | 10.1% |
| 60 to 89 Minutes | 117 | 8.0% |
| 90 or more Minutes | 25 | 1.7% |
Commute Time by Sex in Crestwood Village
The most common commute times in Crestwood Village are 45 to 59 minutes (133 commuters, 22.1%) for males and 30 to 34 minutes (308 commuters, 35.7%) for females.
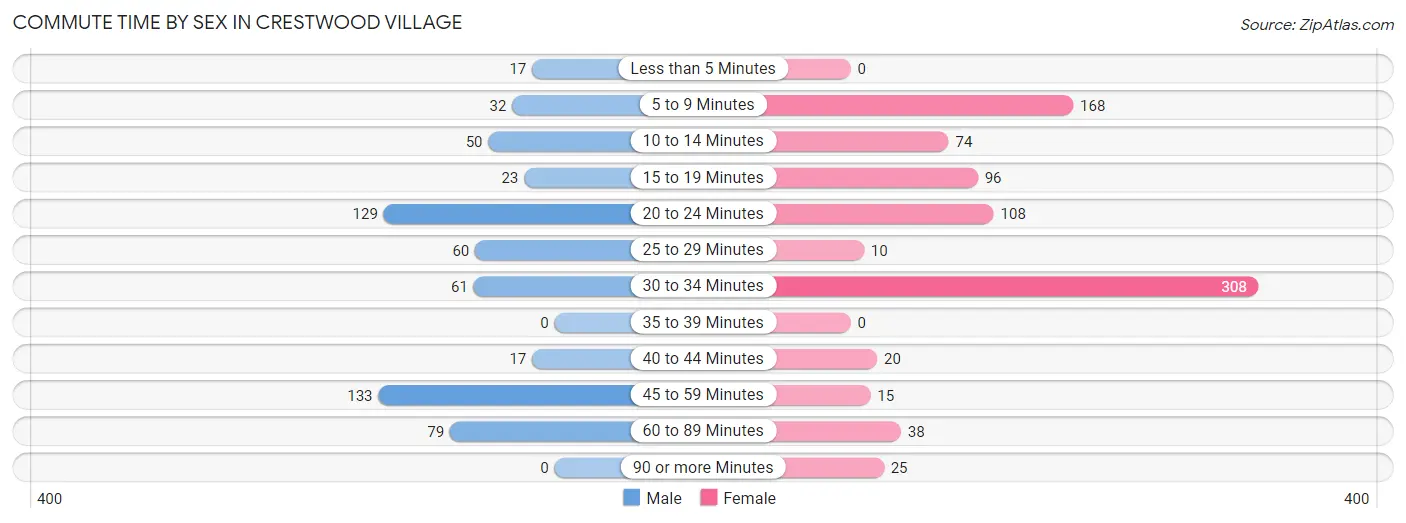
| Commute Time | Male | Female |
| Less than 5 Minutes | 17 (2.8%) | 0 (0.0%) |
| 5 to 9 Minutes | 32 (5.3%) | 168 (19.5%) |
| 10 to 14 Minutes | 50 (8.3%) | 74 (8.6%) |
| 15 to 19 Minutes | 23 (3.8%) | 96 (11.1%) |
| 20 to 24 Minutes | 129 (21.5%) | 108 (12.5%) |
| 25 to 29 Minutes | 60 (10.0%) | 10 (1.2%) |
| 30 to 34 Minutes | 61 (10.2%) | 308 (35.7%) |
| 35 to 39 Minutes | 0 (0.0%) | 0 (0.0%) |
| 40 to 44 Minutes | 17 (2.8%) | 20 (2.3%) |
| 45 to 59 Minutes | 133 (22.1%) | 15 (1.7%) |
| 60 to 89 Minutes | 79 (13.1%) | 38 (4.4%) |
| 90 or more Minutes | 0 (0.0%) | 25 (2.9%) |
Time of Departure to Work by Sex in Crestwood Village
The most frequent times of departure to work in Crestwood Village are 6:00 AM to 6:29 AM (116, 19.3%) for males and 5:30 AM to 5:59 AM (227, 26.3%) for females.
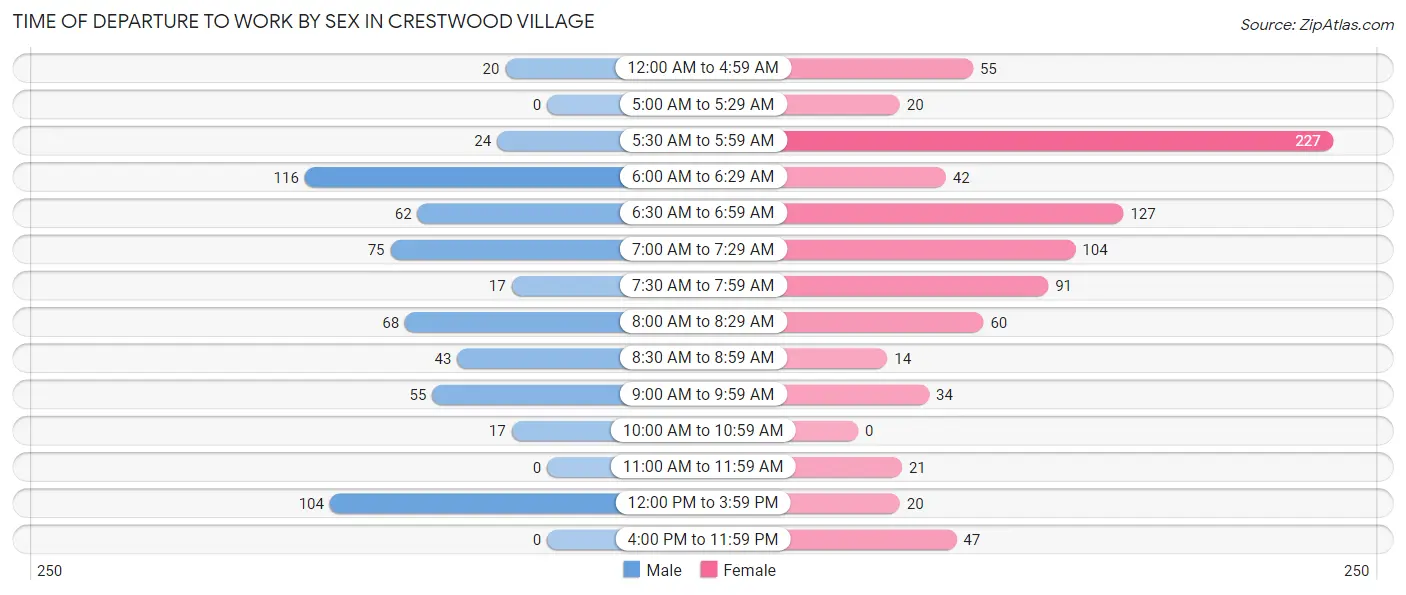
| Time of Departure | Male | Female |
| 12:00 AM to 4:59 AM | 20 (3.3%) | 55 (6.4%) |
| 5:00 AM to 5:29 AM | 0 (0.0%) | 20 (2.3%) |
| 5:30 AM to 5:59 AM | 24 (4.0%) | 227 (26.3%) |
| 6:00 AM to 6:29 AM | 116 (19.3%) | 42 (4.9%) |
| 6:30 AM to 6:59 AM | 62 (10.3%) | 127 (14.7%) |
| 7:00 AM to 7:29 AM | 75 (12.5%) | 104 (12.1%) |
| 7:30 AM to 7:59 AM | 17 (2.8%) | 91 (10.6%) |
| 8:00 AM to 8:29 AM | 68 (11.3%) | 60 (7.0%) |
| 8:30 AM to 8:59 AM | 43 (7.1%) | 14 (1.6%) |
| 9:00 AM to 9:59 AM | 55 (9.1%) | 34 (3.9%) |
| 10:00 AM to 10:59 AM | 17 (2.8%) | 0 (0.0%) |
| 11:00 AM to 11:59 AM | 0 (0.0%) | 21 (2.4%) |
| 12:00 PM to 3:59 PM | 104 (17.3%) | 20 (2.3%) |
| 4:00 PM to 11:59 PM | 0 (0.0%) | 47 (5.4%) |
| Total | 601 (100.0%) | 862 (100.0%) |
Housing Occupancy in Crestwood Village
Occupancy by Ownership in Crestwood Village
Of the total 5,979 dwellings in Crestwood Village, owner-occupied units account for 5,285 (88.4%), while renter-occupied units make up 694 (11.6%).
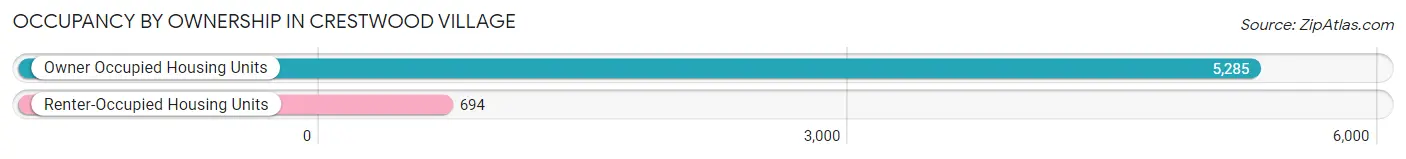
| Occupancy | # Housing Units | % Housing Units |
| Owner Occupied Housing Units | 5,285 | 88.4% |
| Renter-Occupied Housing Units | 694 | 11.6% |
| Total Occupied Housing Units | 5,979 | 100.0% |
Occupancy by Household Size in Crestwood Village
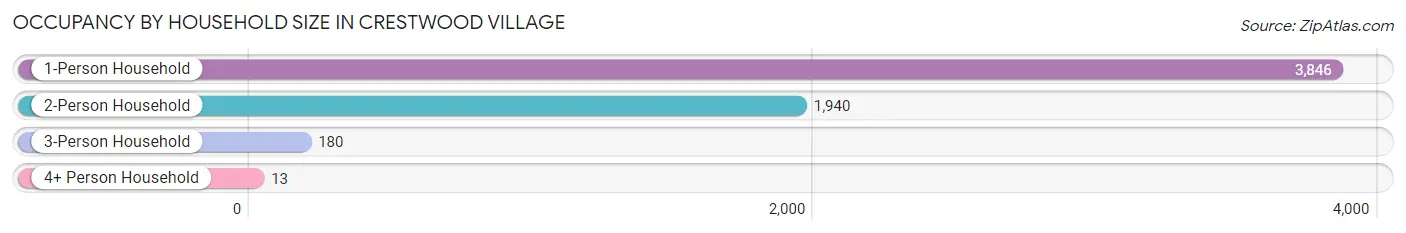
| Household Size | # Housing Units | % Housing Units |
| 1-Person Household | 3,846 | 64.3% |
| 2-Person Household | 1,940 | 32.5% |
| 3-Person Household | 180 | 3.0% |
| 4+ Person Household | 13 | 0.2% |
| Total Housing Units | 5,979 | 100.0% |
Occupancy by Ownership by Household Size in Crestwood Village
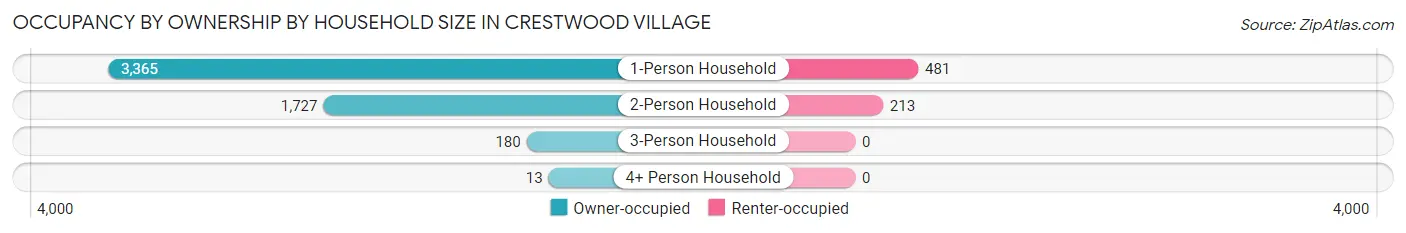
| Household Size | Owner-occupied | Renter-occupied |
| 1-Person Household | 3,365 (87.5%) | 481 (12.5%) |
| 2-Person Household | 1,727 (89.0%) | 213 (11.0%) |
| 3-Person Household | 180 (100.0%) | 0 (0.0%) |
| 4+ Person Household | 13 (100.0%) | 0 (0.0%) |
| Total Housing Units | 5,285 (88.4%) | 694 (11.6%) |
Occupancy by Educational Attainment in Crestwood Village
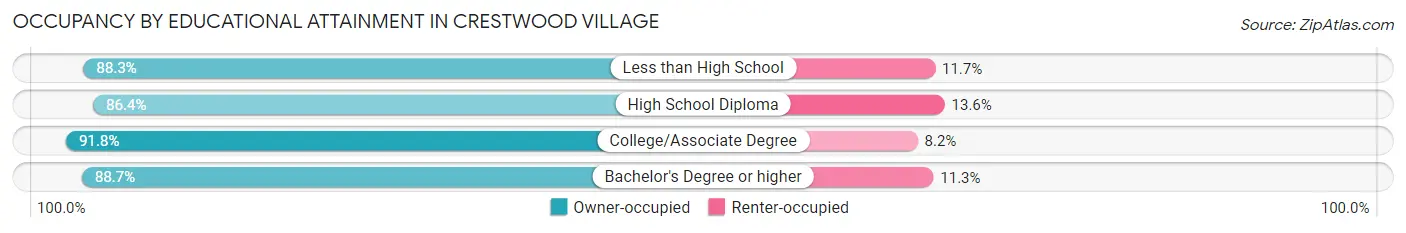
| Household Size | Owner-occupied | Renter-occupied |
| Less than High School | 492 (88.3%) | 65 (11.7%) |
| High School Diploma | 2,306 (86.4%) | 362 (13.6%) |
| College/Associate Degree | 1,330 (91.8%) | 119 (8.2%) |
| Bachelor's Degree or higher | 1,157 (88.7%) | 148 (11.3%) |
Occupancy by Age of Householder in Crestwood Village
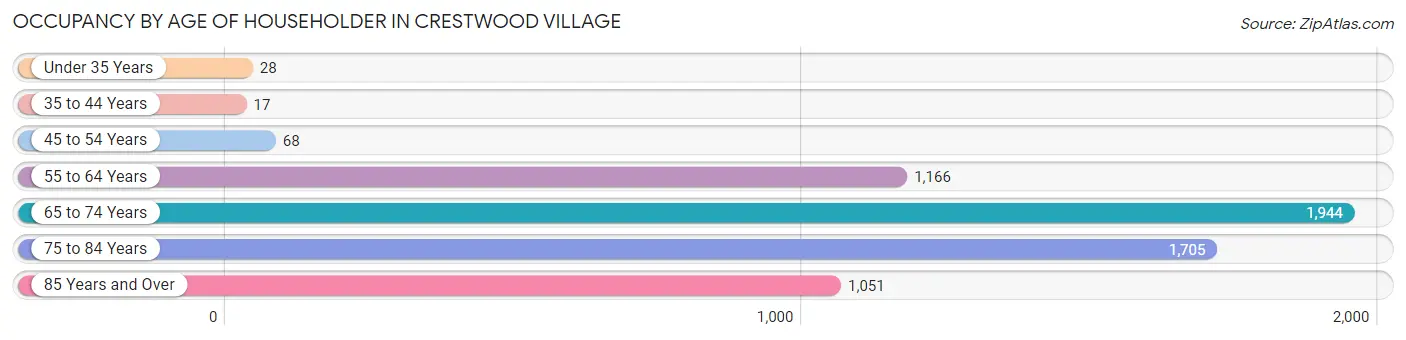
| Age Bracket | # Households | % Households |
| Under 35 Years | 28 | 0.5% |
| 35 to 44 Years | 17 | 0.3% |
| 45 to 54 Years | 68 | 1.1% |
| 55 to 64 Years | 1,166 | 19.5% |
| 65 to 74 Years | 1,944 | 32.5% |
| 75 to 84 Years | 1,705 | 28.5% |
| 85 Years and Over | 1,051 | 17.6% |
| Total | 5,979 | 100.0% |
Housing Finances in Crestwood Village
Median Income by Occupancy in Crestwood Village
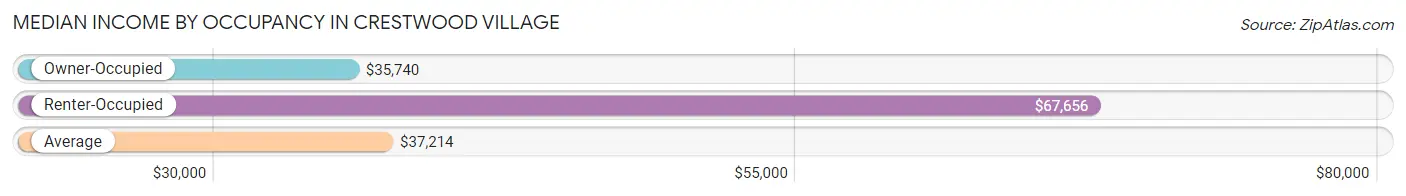
| Occupancy Type | # Households | Median Income |
| Owner-Occupied | 5,285 (88.4%) | $35,740 |
| Renter-Occupied | 694 (11.6%) | $67,656 |
| Average | 5,979 (100.0%) | $37,214 |
Occupancy by Householder Income Bracket in Crestwood Village
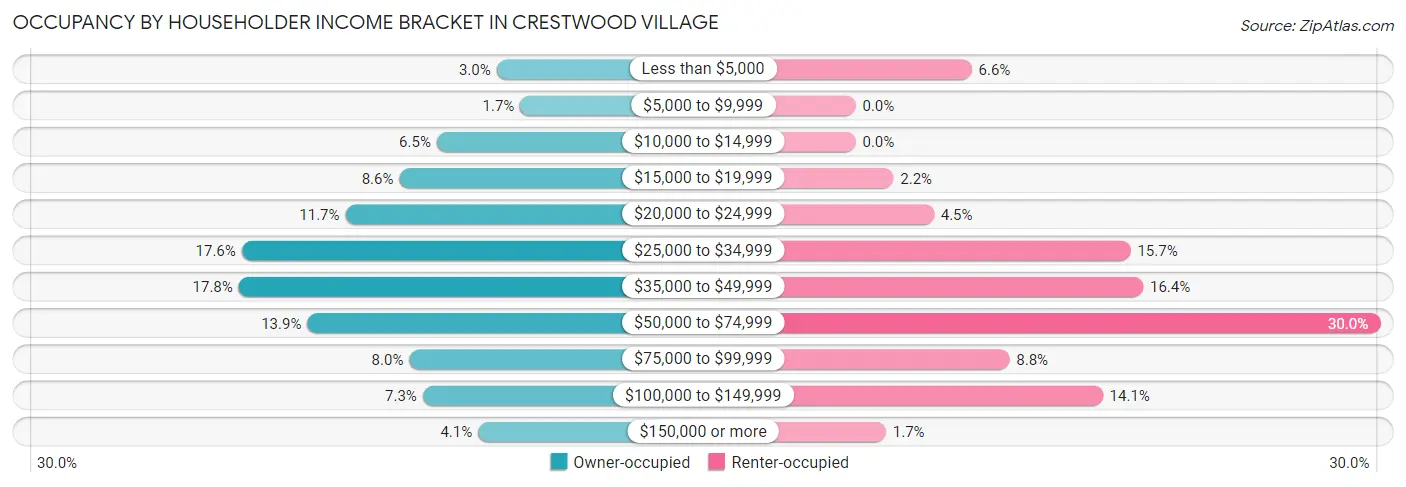
| Income Bracket | Owner-occupied | Renter-occupied |
| Less than $5,000 | 160 (3.0%) | 46 (6.6%) |
| $5,000 to $9,999 | 89 (1.7%) | 0 (0.0%) |
| $10,000 to $14,999 | 341 (6.5%) | 0 (0.0%) |
| $15,000 to $19,999 | 454 (8.6%) | 15 (2.2%) |
| $20,000 to $24,999 | 617 (11.7%) | 31 (4.5%) |
| $25,000 to $34,999 | 930 (17.6%) | 109 (15.7%) |
| $35,000 to $49,999 | 939 (17.8%) | 114 (16.4%) |
| $50,000 to $74,999 | 732 (13.9%) | 208 (30.0%) |
| $75,000 to $99,999 | 424 (8.0%) | 61 (8.8%) |
| $100,000 to $149,999 | 383 (7.2%) | 98 (14.1%) |
| $150,000 or more | 216 (4.1%) | 12 (1.7%) |
| Total | 5,285 (100.0%) | 694 (100.0%) |
Monthly Housing Cost Tiers in Crestwood Village
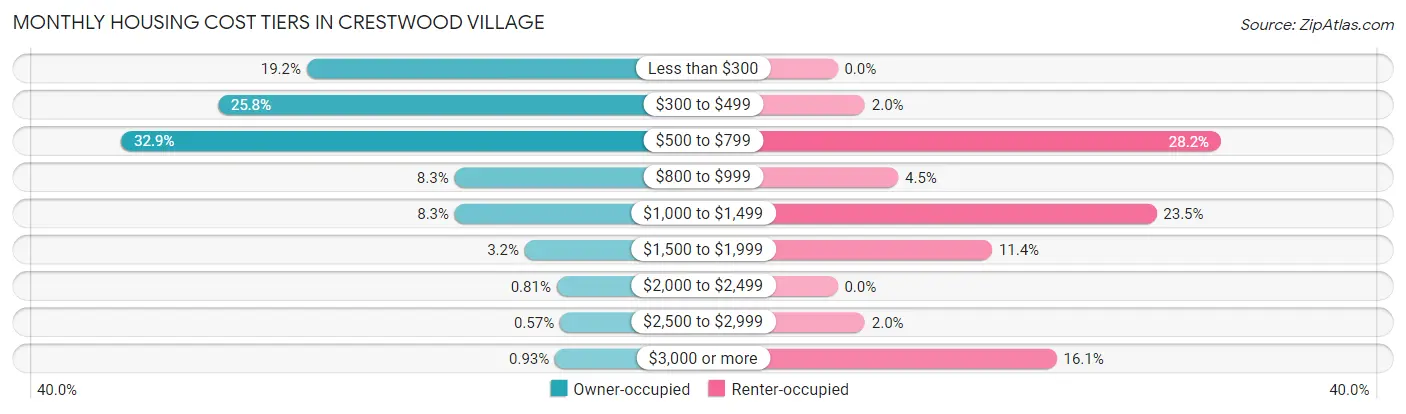
| Monthly Cost | Owner-occupied | Renter-occupied |
| Less than $300 | 1,016 (19.2%) | 0 (0.0%) |
| $300 to $499 | 1,362 (25.8%) | 14 (2.0%) |
| $500 to $799 | 1,738 (32.9%) | 196 (28.2%) |
| $800 to $999 | 441 (8.3%) | 31 (4.5%) |
| $1,000 to $1,499 | 439 (8.3%) | 163 (23.5%) |
| $1,500 to $1,999 | 167 (3.2%) | 79 (11.4%) |
| $2,000 to $2,499 | 43 (0.8%) | 0 (0.0%) |
| $2,500 to $2,999 | 30 (0.6%) | 14 (2.0%) |
| $3,000 or more | 49 (0.9%) | 112 (16.1%) |
| Total | 5,285 (100.0%) | 694 (100.0%) |
Physical Housing Characteristics in Crestwood Village
Housing Structures in Crestwood Village
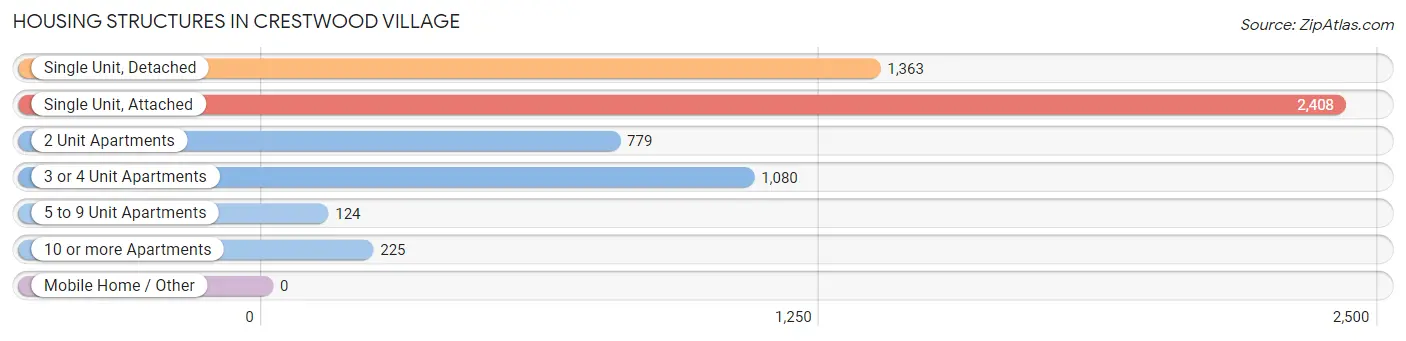
| Structure Type | # Housing Units | % Housing Units |
| Single Unit, Detached | 1,363 | 22.8% |
| Single Unit, Attached | 2,408 | 40.3% |
| 2 Unit Apartments | 779 | 13.0% |
| 3 or 4 Unit Apartments | 1,080 | 18.1% |
| 5 to 9 Unit Apartments | 124 | 2.1% |
| 10 or more Apartments | 225 | 3.8% |
| Mobile Home / Other | 0 | 0.0% |
| Total | 5,979 | 100.0% |
Housing Structures by Occupancy in Crestwood Village
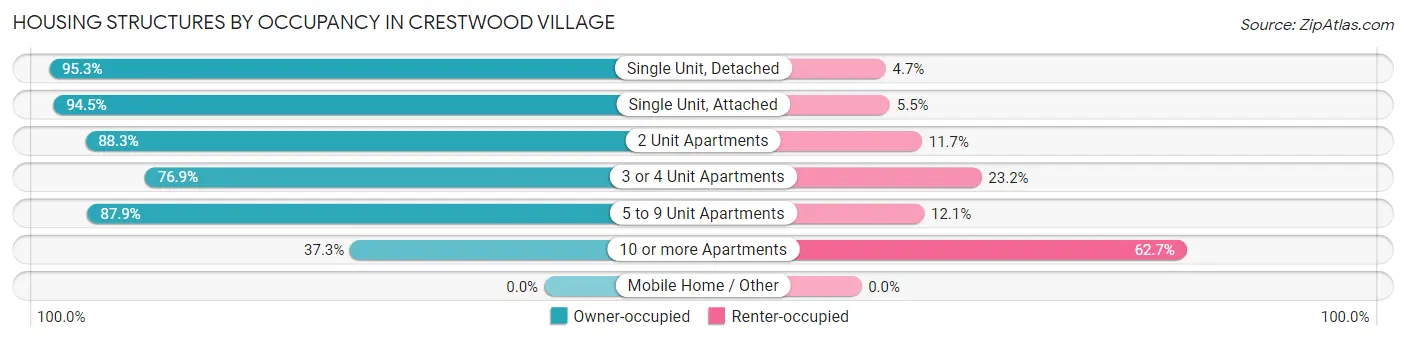
| Structure Type | Owner-occupied | Renter-occupied |
| Single Unit, Detached | 1,299 (95.3%) | 64 (4.7%) |
| Single Unit, Attached | 2,275 (94.5%) | 133 (5.5%) |
| 2 Unit Apartments | 688 (88.3%) | 91 (11.7%) |
| 3 or 4 Unit Apartments | 830 (76.8%) | 250 (23.2%) |
| 5 to 9 Unit Apartments | 109 (87.9%) | 15 (12.1%) |
| 10 or more Apartments | 84 (37.3%) | 141 (62.7%) |
| Mobile Home / Other | 0 (0.0%) | 0 (0.0%) |
| Total | 5,285 (88.4%) | 694 (11.6%) |
Housing Structures by Number of Rooms in Crestwood Village
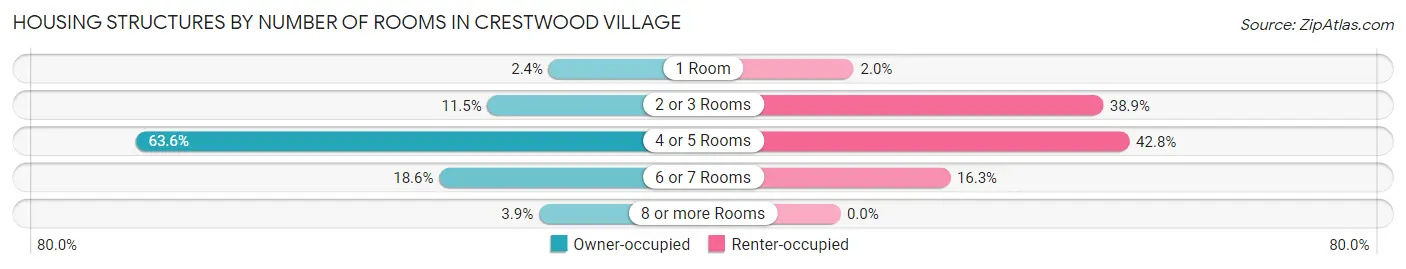
| Number of Rooms | Owner-occupied | Renter-occupied |
| 1 Room | 128 (2.4%) | 14 (2.0%) |
| 2 or 3 Rooms | 607 (11.5%) | 270 (38.9%) |
| 4 or 5 Rooms | 3,360 (63.6%) | 297 (42.8%) |
| 6 or 7 Rooms | 985 (18.6%) | 113 (16.3%) |
| 8 or more Rooms | 205 (3.9%) | 0 (0.0%) |
| Total | 5,285 (100.0%) | 694 (100.0%) |
Housing Structure by Heating Type in Crestwood Village
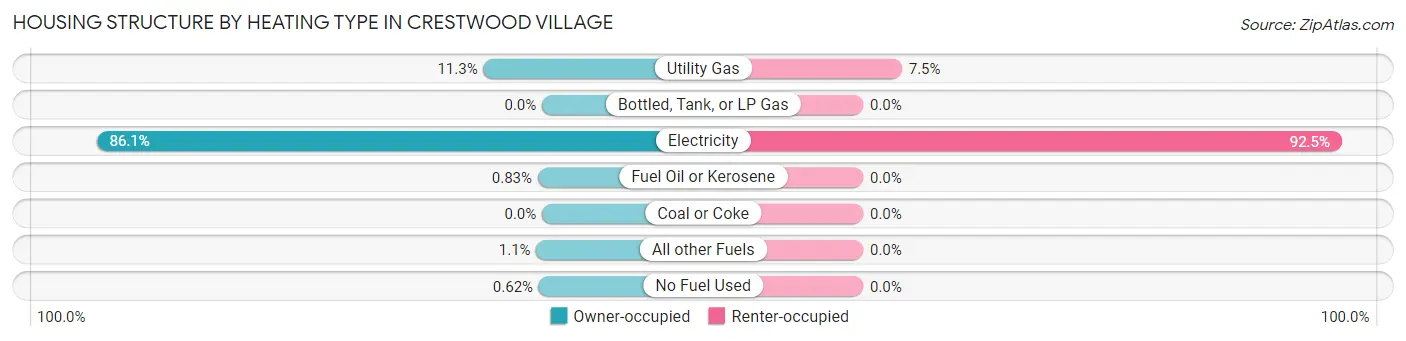
| Heating Type | Owner-occupied | Renter-occupied |
| Utility Gas | 599 (11.3%) | 52 (7.5%) |
| Bottled, Tank, or LP Gas | 0 (0.0%) | 0 (0.0%) |
| Electricity | 4,551 (86.1%) | 642 (92.5%) |
| Fuel Oil or Kerosene | 44 (0.8%) | 0 (0.0%) |
| Coal or Coke | 0 (0.0%) | 0 (0.0%) |
| All other Fuels | 58 (1.1%) | 0 (0.0%) |
| No Fuel Used | 33 (0.6%) | 0 (0.0%) |
| Total | 5,285 (100.0%) | 694 (100.0%) |
Household Vehicle Usage in Crestwood Village
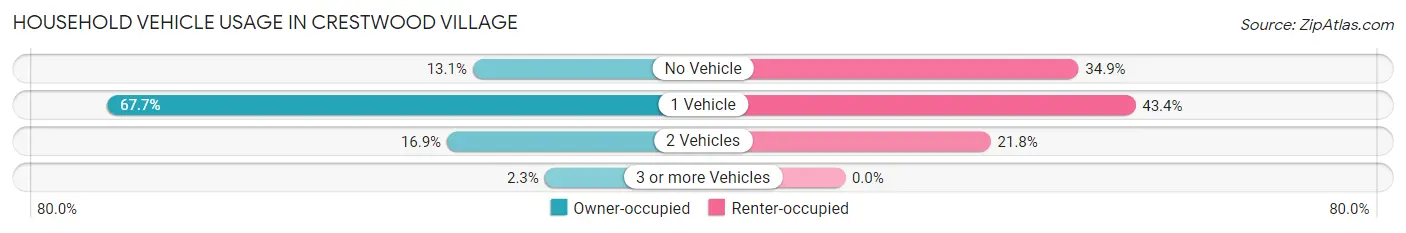
| Vehicles per Household | Owner-occupied | Renter-occupied |
| No Vehicle | 691 (13.1%) | 242 (34.9%) |
| 1 Vehicle | 3,577 (67.7%) | 301 (43.4%) |
| 2 Vehicles | 894 (16.9%) | 151 (21.8%) |
| 3 or more Vehicles | 123 (2.3%) | 0 (0.0%) |
| Total | 5,285 (100.0%) | 694 (100.0%) |
Real Estate & Mortgages in Crestwood Village
Real Estate and Mortgage Overview in Crestwood Village
| Characteristic | Without Mortgage | With Mortgage |
| Housing Units | 4,413 | 872 |
| Median Property Value | $77,300 | $166,200 |
| Median Household Income | $33,240 | $92 |
| Monthly Housing Costs | $481 | $28 |
| Real Estate Taxes | $1,344 | $35 |
Property Value by Mortgage Status in Crestwood Village
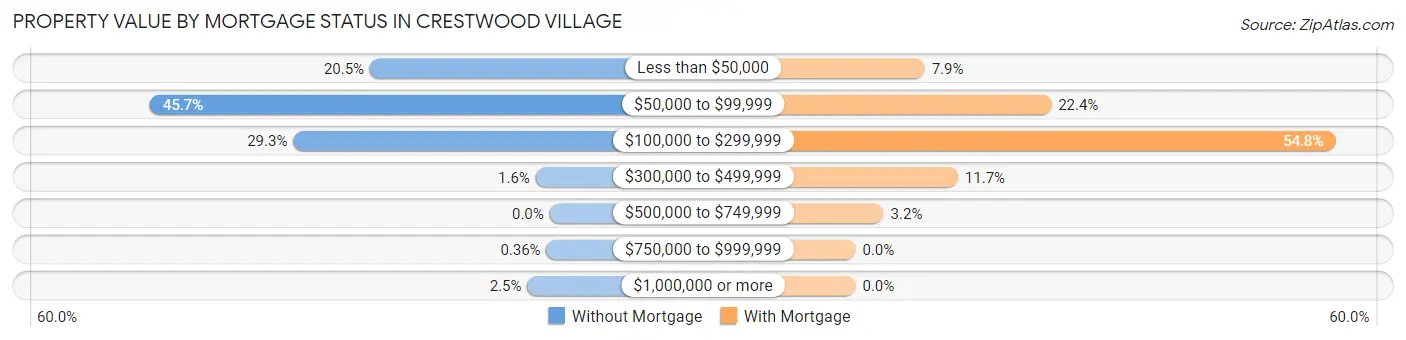
| Property Value | Without Mortgage | With Mortgage |
| Less than $50,000 | 906 (20.5%) | 69 (7.9%) |
| $50,000 to $99,999 | 2,016 (45.7%) | 195 (22.4%) |
| $100,000 to $299,999 | 1,293 (29.3%) | 478 (54.8%) |
| $300,000 to $499,999 | 70 (1.6%) | 102 (11.7%) |
| $500,000 to $749,999 | 0 (0.0%) | 28 (3.2%) |
| $750,000 to $999,999 | 16 (0.4%) | 0 (0.0%) |
| $1,000,000 or more | 112 (2.5%) | 0 (0.0%) |
| Total | 4,413 (100.0%) | 872 (100.0%) |
Household Income by Mortgage Status in Crestwood Village
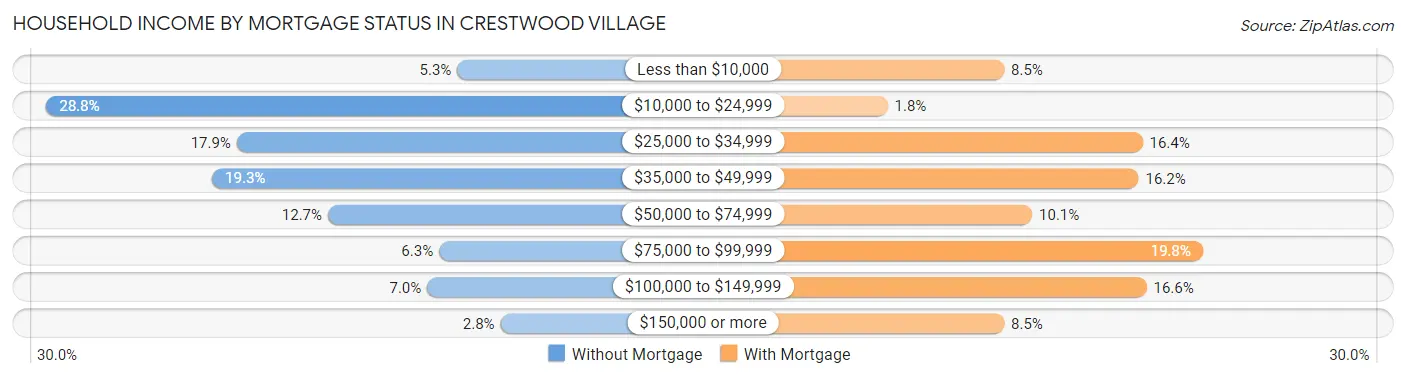
| Household Income | Without Mortgage | With Mortgage |
| Less than $10,000 | 233 (5.3%) | 74 (8.5%) |
| $10,000 to $24,999 | 1,269 (28.8%) | 16 (1.8%) |
| $25,000 to $34,999 | 789 (17.9%) | 143 (16.4%) |
| $35,000 to $49,999 | 851 (19.3%) | 141 (16.2%) |
| $50,000 to $74,999 | 559 (12.7%) | 88 (10.1%) |
| $75,000 to $99,999 | 279 (6.3%) | 173 (19.8%) |
| $100,000 to $149,999 | 309 (7.0%) | 145 (16.6%) |
| $150,000 or more | 124 (2.8%) | 74 (8.5%) |
| Total | 4,413 (100.0%) | 872 (100.0%) |
Property Value to Household Income Ratio in Crestwood Village
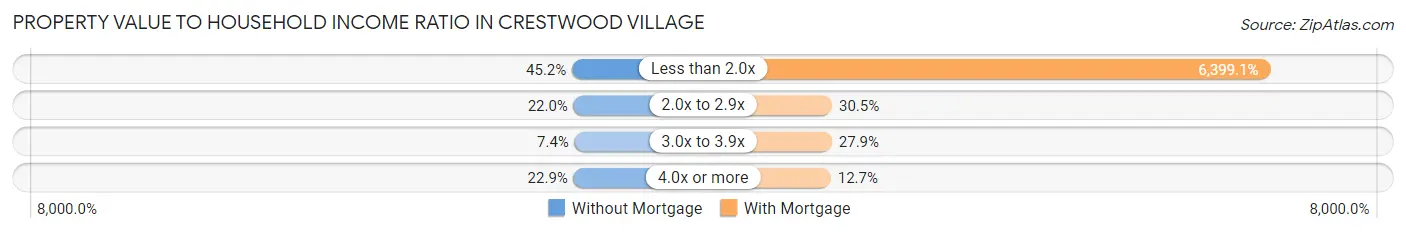
| Value-to-Income Ratio | Without Mortgage | With Mortgage |
| Less than 2.0x | 1,996 (45.2%) | 55,800 (6,399.1%) |
| 2.0x to 2.9x | 970 (22.0%) | 266 (30.5%) |
| 3.0x to 3.9x | 328 (7.4%) | 243 (27.9%) |
| 4.0x or more | 1,010 (22.9%) | 111 (12.7%) |
| Total | 4,413 (100.0%) | 872 (100.0%) |
Real Estate Taxes by Mortgage Status in Crestwood Village
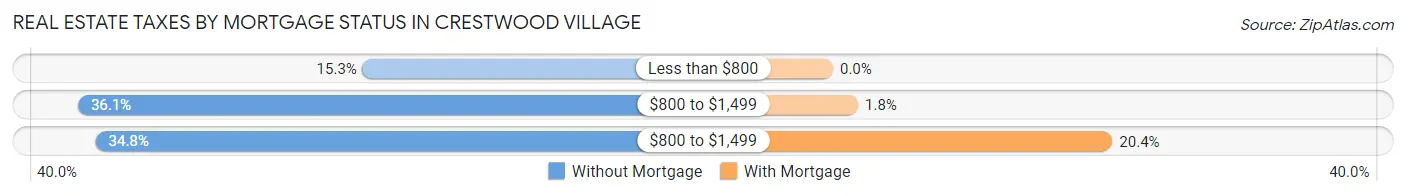
| Property Taxes | Without Mortgage | With Mortgage |
| Less than $800 | 675 (15.3%) | 0 (0.0%) |
| $800 to $1,499 | 1,593 (36.1%) | 16 (1.8%) |
| $800 to $1,499 | 1,536 (34.8%) | 178 (20.4%) |
| Total | 4,413 (100.0%) | 872 (100.0%) |
Health & Disability in Crestwood Village
Health Insurance Coverage by Age in Crestwood Village
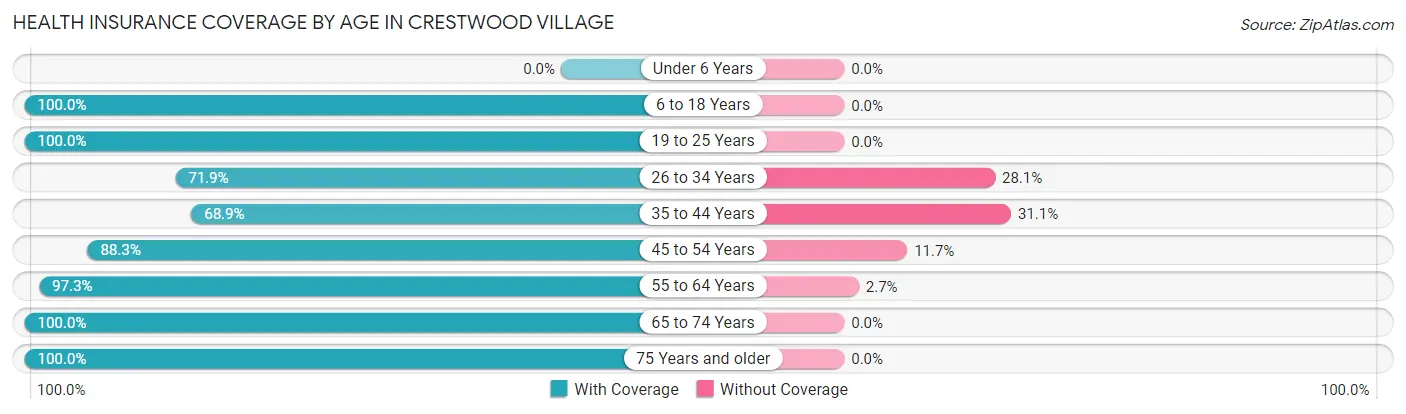
| Age Bracket | With Coverage | Without Coverage |
| Under 6 Years | 0 (0.0%) | 0 (0.0%) |
| 6 to 18 Years | 34 (100.0%) | 0 (0.0%) |
| 19 to 25 Years | 78 (100.0%) | 0 (0.0%) |
| 26 to 34 Years | 133 (71.9%) | 52 (28.1%) |
| 35 to 44 Years | 82 (68.9%) | 37 (31.1%) |
| 45 to 54 Years | 173 (88.3%) | 23 (11.7%) |
| 55 to 64 Years | 1,678 (97.3%) | 47 (2.7%) |
| 65 to 74 Years | 2,607 (100.0%) | 0 (0.0%) |
| 75 Years and older | 3,476 (100.0%) | 0 (0.0%) |
| Total | 8,261 (98.1%) | 159 (1.9%) |
Health Insurance Coverage by Citizenship Status in Crestwood Village
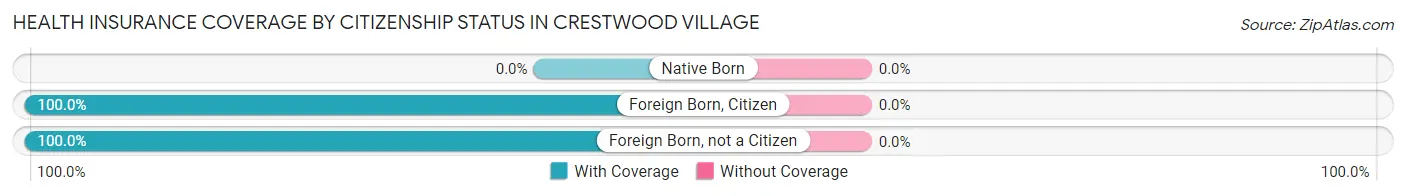
| Citizenship Status | With Coverage | Without Coverage |
| Native Born | 0 (0.0%) | 0 (0.0%) |
| Foreign Born, Citizen | 34 (100.0%) | 0 (0.0%) |
| Foreign Born, not a Citizen | 78 (100.0%) | 0 (0.0%) |
Health Insurance Coverage by Household Income in Crestwood Village
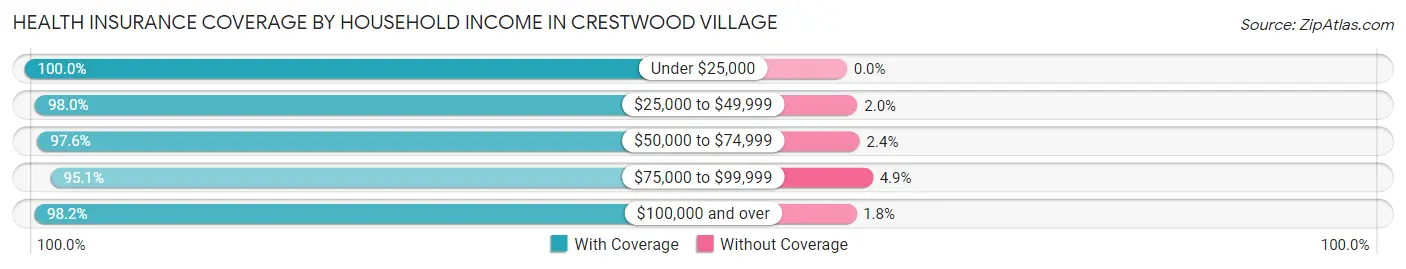
| Household Income | With Coverage | Without Coverage |
| Under $25,000 | 1,876 (100.0%) | 0 (0.0%) |
| $25,000 to $49,999 | 2,821 (98.0%) | 57 (2.0%) |
| $50,000 to $74,999 | 1,460 (97.6%) | 36 (2.4%) |
| $75,000 to $99,999 | 823 (95.1%) | 42 (4.9%) |
| $100,000 and over | 1,277 (98.2%) | 23 (1.8%) |
Public vs Private Health Insurance Coverage by Age in Crestwood Village
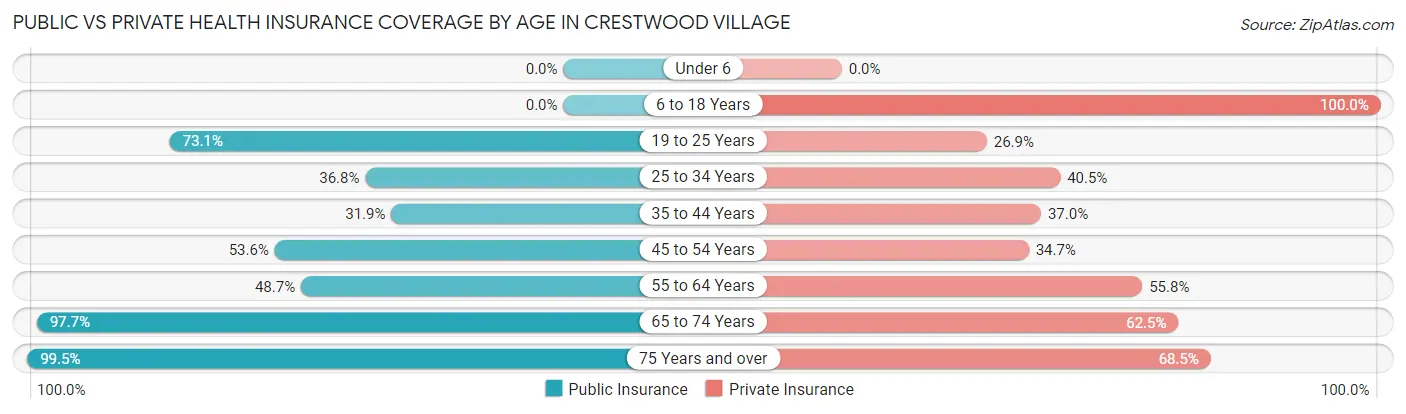
| Age Bracket | Public Insurance | Private Insurance |
| Under 6 | 0 (0.0%) | 0 (0.0%) |
| 6 to 18 Years | 0 (0.0%) | 34 (100.0%) |
| 19 to 25 Years | 57 (73.1%) | 21 (26.9%) |
| 25 to 34 Years | 68 (36.8%) | 75 (40.5%) |
| 35 to 44 Years | 38 (31.9%) | 44 (37.0%) |
| 45 to 54 Years | 105 (53.6%) | 68 (34.7%) |
| 55 to 64 Years | 840 (48.7%) | 962 (55.8%) |
| 65 to 74 Years | 2,548 (97.7%) | 1,628 (62.5%) |
| 75 Years and over | 3,459 (99.5%) | 2,380 (68.5%) |
| Total | 7,115 (84.5%) | 5,212 (61.9%) |
Disability Status by Sex by Age in Crestwood Village
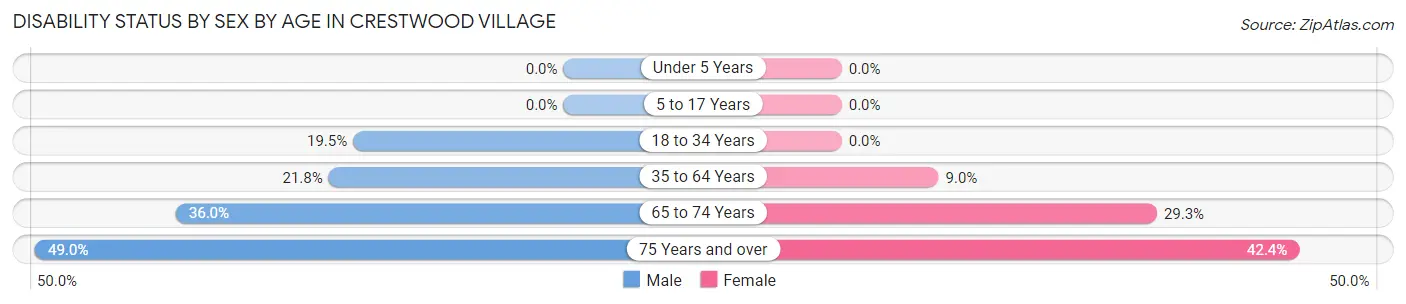
| Age Bracket | Male | Female |
| Under 5 Years | 0 (0.0%) | 0 (0.0%) |
| 5 to 17 Years | 0 (0.0%) | 0 (0.0%) |
| 18 to 34 Years | 41 (19.5%) | 0 (0.0%) |
| 35 to 64 Years | 168 (21.8%) | 114 (9.0%) |
| 65 to 74 Years | 442 (36.0%) | 403 (29.2%) |
| 75 Years and over | 579 (49.0%) | 974 (42.4%) |
Disability Class by Sex by Age in Crestwood Village
Disability Class: Hearing Difficulty
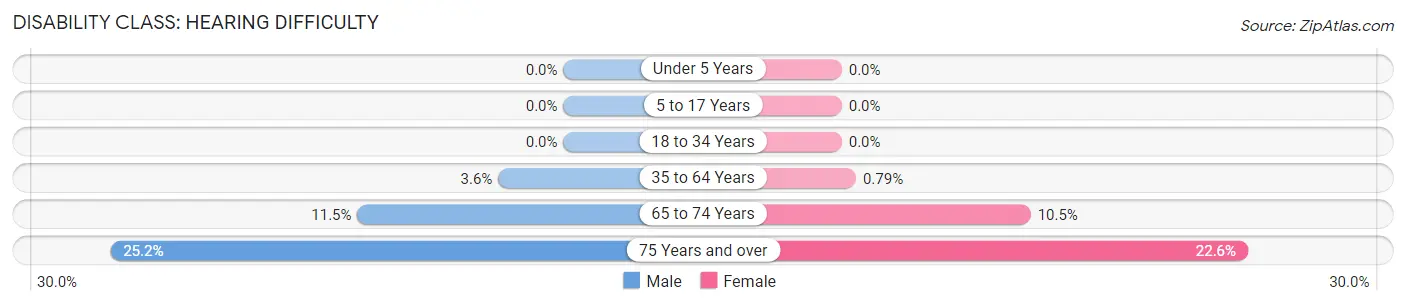
| Age Bracket | Male | Female |
| Under 5 Years | 0 (0.0%) | 0 (0.0%) |
| 5 to 17 Years | 0 (0.0%) | 0 (0.0%) |
| 18 to 34 Years | 0 (0.0%) | 0 (0.0%) |
| 35 to 64 Years | 28 (3.6%) | 10 (0.8%) |
| 65 to 74 Years | 141 (11.5%) | 145 (10.5%) |
| 75 Years and over | 298 (25.2%) | 519 (22.6%) |
Disability Class: Vision Difficulty
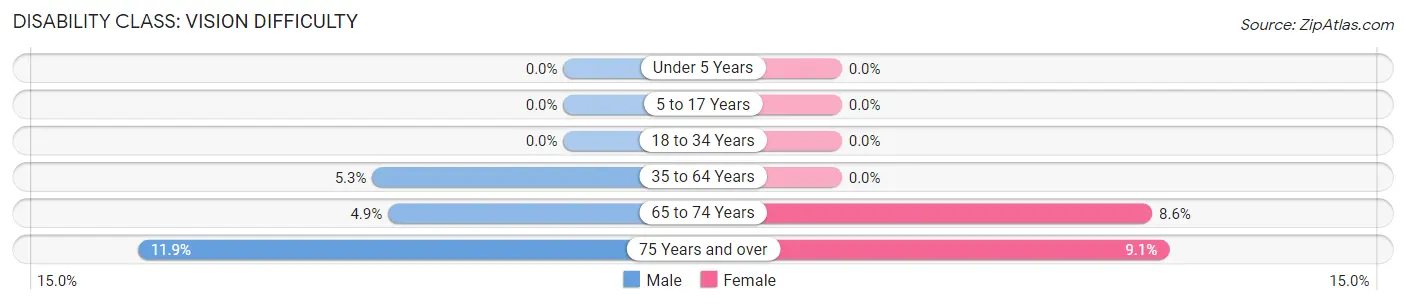
| Age Bracket | Male | Female |
| Under 5 Years | 0 (0.0%) | 0 (0.0%) |
| 5 to 17 Years | 0 (0.0%) | 0 (0.0%) |
| 18 to 34 Years | 0 (0.0%) | 0 (0.0%) |
| 35 to 64 Years | 41 (5.3%) | 0 (0.0%) |
| 65 to 74 Years | 60 (4.9%) | 119 (8.6%) |
| 75 Years and over | 140 (11.8%) | 209 (9.1%) |
Disability Class: Cognitive Difficulty
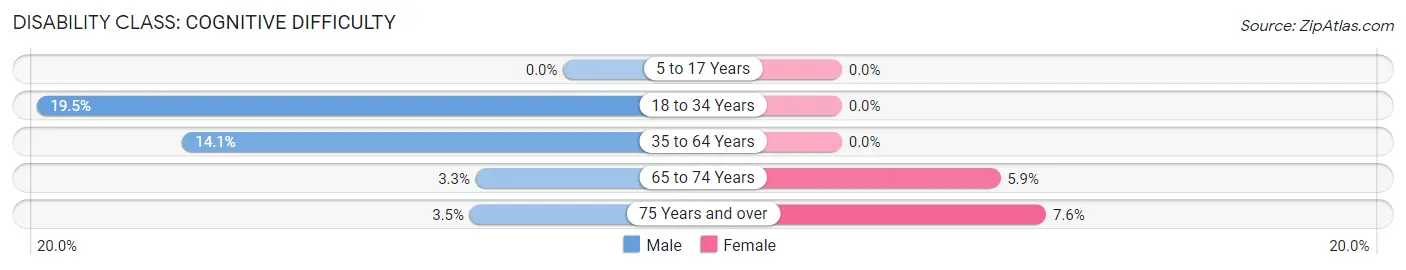
| Age Bracket | Male | Female |
| 5 to 17 Years | 0 (0.0%) | 0 (0.0%) |
| 18 to 34 Years | 41 (19.5%) | 0 (0.0%) |
| 35 to 64 Years | 109 (14.1%) | 0 (0.0%) |
| 65 to 74 Years | 40 (3.3%) | 81 (5.9%) |
| 75 Years and over | 41 (3.5%) | 174 (7.6%) |
Disability Class: Ambulatory Difficulty
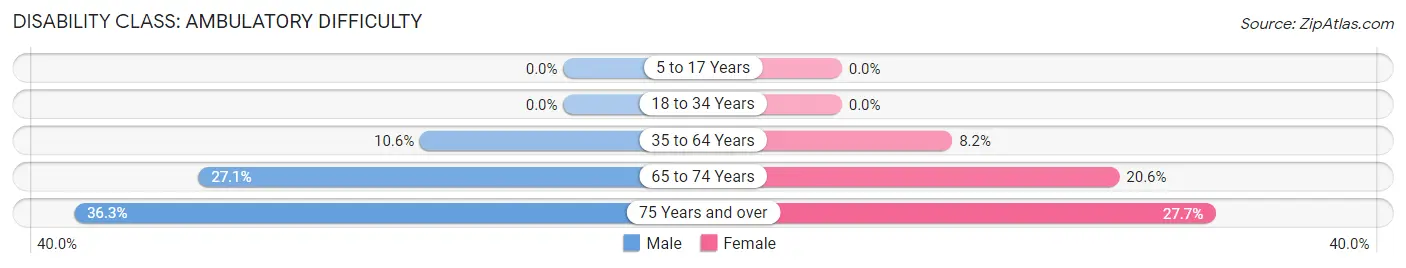
| Age Bracket | Male | Female |
| 5 to 17 Years | 0 (0.0%) | 0 (0.0%) |
| 18 to 34 Years | 0 (0.0%) | 0 (0.0%) |
| 35 to 64 Years | 82 (10.6%) | 104 (8.2%) |
| 65 to 74 Years | 333 (27.1%) | 284 (20.6%) |
| 75 Years and over | 429 (36.3%) | 636 (27.7%) |
Disability Class: Self-Care Difficulty
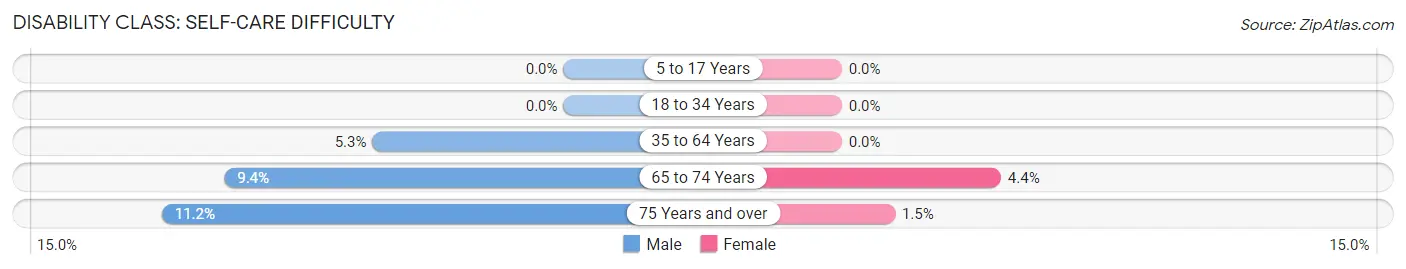
| Age Bracket | Male | Female |
| 5 to 17 Years | 0 (0.0%) | 0 (0.0%) |
| 18 to 34 Years | 0 (0.0%) | 0 (0.0%) |
| 35 to 64 Years | 41 (5.3%) | 0 (0.0%) |
| 65 to 74 Years | 116 (9.4%) | 61 (4.4%) |
| 75 Years and over | 132 (11.2%) | 34 (1.5%) |
Technology Access in Crestwood Village
Computing Device Access in Crestwood Village
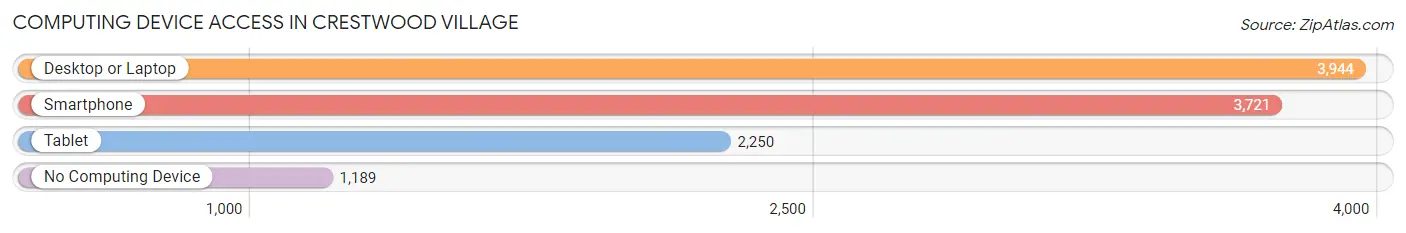
| Device Type | # Households | % Households |
| Desktop or Laptop | 3,944 | 66.0% |
| Smartphone | 3,721 | 62.2% |
| Tablet | 2,250 | 37.6% |
| No Computing Device | 1,189 | 19.9% |
| Total | 5,979 | 100.0% |
Internet Access in Crestwood Village
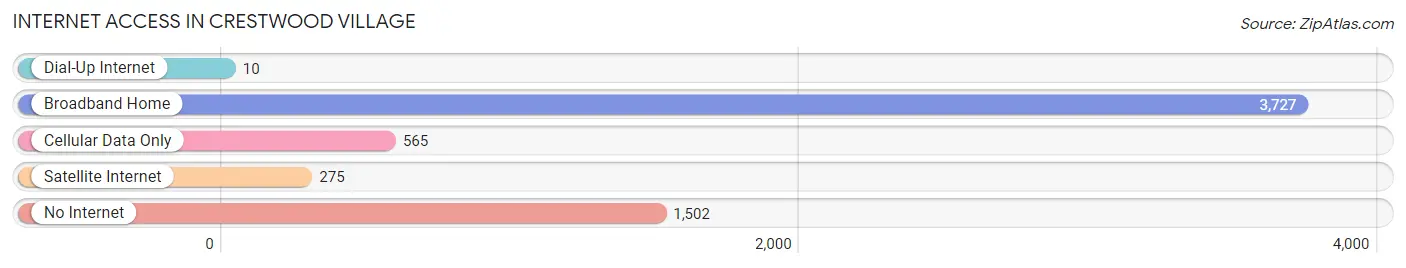
| Internet Type | # Households | % Households |
| Dial-Up Internet | 10 | 0.2% |
| Broadband Home | 3,727 | 62.3% |
| Cellular Data Only | 565 | 9.5% |
| Satellite Internet | 275 | 4.6% |
| No Internet | 1,502 | 25.1% |
| Total | 5,979 | 100.0% |
Crestwood Village Summary
Crestwood Village is a census-designated place located in Ocean County, New Jersey. It is part of the Toms River Metropolitan Statistical Area and is located within the township of Toms River. As of the 2010 United States Census, the population of Crestwood Village was 4,845.
Geography
Crestwood Village is located at 39°56'45" North, 74°14'45" West (39.94583, -74.24583). It is situated in the northern part of Toms River Township, approximately 4 miles from the Atlantic Ocean. The total area of Crestwood Village is 0.9 square miles, all of which is land.
Demographics
As of the 2010 United States Census, there were 4,845 people, 2,072 households, and 1,521 families residing in Crestwood Village. The population density was 5,400.2 people per square mile. The racial makeup of the village was 94.2% White, 1.7% African American, 0.2% Native American, 1.2% Asian, 0.1% Pacific Islander, 1.2% from other races, and 1.6% from two or more races. Hispanic or Latino of any race were 4.3% of the population.
There were 2,072 households, out of which 22.2% had children under the age of 18 living with them, 57.2% were married couples living together, 10.2% had a female householder with no husband present, and 28.7% were non-families. 24.2% of all households were made up of individuals, and 11.7% had someone living alone who was 65 years of age or older. The average household size was 2.35 and the average family size was 2.77.
In Crestwood Village, the population was spread out, with 18.2% under the age of 18, 6.2% from 18 to 24, 22.2% from 25 to 44, 30.2% from 45 to 64, and 23.2% who were 65 years of age or older. The median age was 46.4 years. For every 100 females, there were 92.2 males. For every 100 females age 18 and over, there were 89.2 males.
Economy
Crestwood Village is primarily a residential community, with most of its residents employed in the nearby towns of Toms River and Seaside Heights. The median household income in Crestwood Village was $60,917 in 2010, which was higher than the median income for Toms River Township ($58,945) and Ocean County ($62,735). The unemployment rate in Crestwood Village was 6.2% in 2010, which was lower than the unemployment rate for Toms River Township (7.7%) and Ocean County (8.2%).
History
Crestwood Village was founded in the 1950s as a retirement community for senior citizens. It was originally developed by the Crestwood Village Corporation, which was founded by a group of investors from New York City. The first homes were built in 1954, and the community was officially incorporated in 1956. The community was designed to provide a safe and secure environment for its residents, and it was the first retirement community in the state of New Jersey to be built with a central clubhouse and recreational facilities.
Over the years, Crestwood Village has grown and expanded, and today it is home to a diverse population of all ages. The community is still known for its strong sense of community and its commitment to providing a safe and secure environment for its residents.
Common Questions
What is Per Capita Income in Crestwood Village?
Per Capita income in Crestwood Village is $36,447.
What is the Median Family Income in Crestwood Village?
Median Family Income in Crestwood Village is $64,492.
What is the Median Household income in Crestwood Village?
Median Household Income in Crestwood Village is $37,214.
What is Income or Wage Gap in Crestwood Village?
Income or Wage Gap in Crestwood Village is 25.7%.
Women in Crestwood Village earn 74.3 cents for every dollar earned by a man.
What is Inequality or Gini Index in Crestwood Village?
Inequality or Gini Index in Crestwood Village is 0.42.
What is the Total Population of Crestwood Village?
Total Population of Crestwood Village is 8,479.
What is the Total Male Population of Crestwood Village?
Total Male Population of Crestwood Village is 3,426.
What is the Total Female Population of Crestwood Village?
Total Female Population of Crestwood Village is 5,053.
What is the Ratio of Males per 100 Females in Crestwood Village?
There are 67.80 Males per 100 Females in Crestwood Village.
What is the Ratio of Females per 100 Males in Crestwood Village?
There are 147.49 Females per 100 Males in Crestwood Village.
What is the Median Population Age in Crestwood Village?
Median Population Age in Crestwood Village is 72.3 Years.
What is the Average Family Size in Crestwood Village
Average Family Size in Crestwood Village is 2.1 People.
What is the Average Household Size in Crestwood Village
Average Household Size in Crestwood Village is 1.4 People.
How Large is the Labor Force in Crestwood Village?
There are 1,934 People in the Labor Forcein in Crestwood Village.
What is the Percentage of People in the Labor Force in Crestwood Village?
22.9% of People are in the Labor Force in Crestwood Village.
What is the Unemployment Rate in Crestwood Village?
Unemployment Rate in Crestwood Village is 13.0%.