Cities with the Highest Percentage of Population with a Degree in Social Sciences in Connecticut
RELATED REPORTS & OPTIONS
Social Sciences
Connecticut
Compare Cities
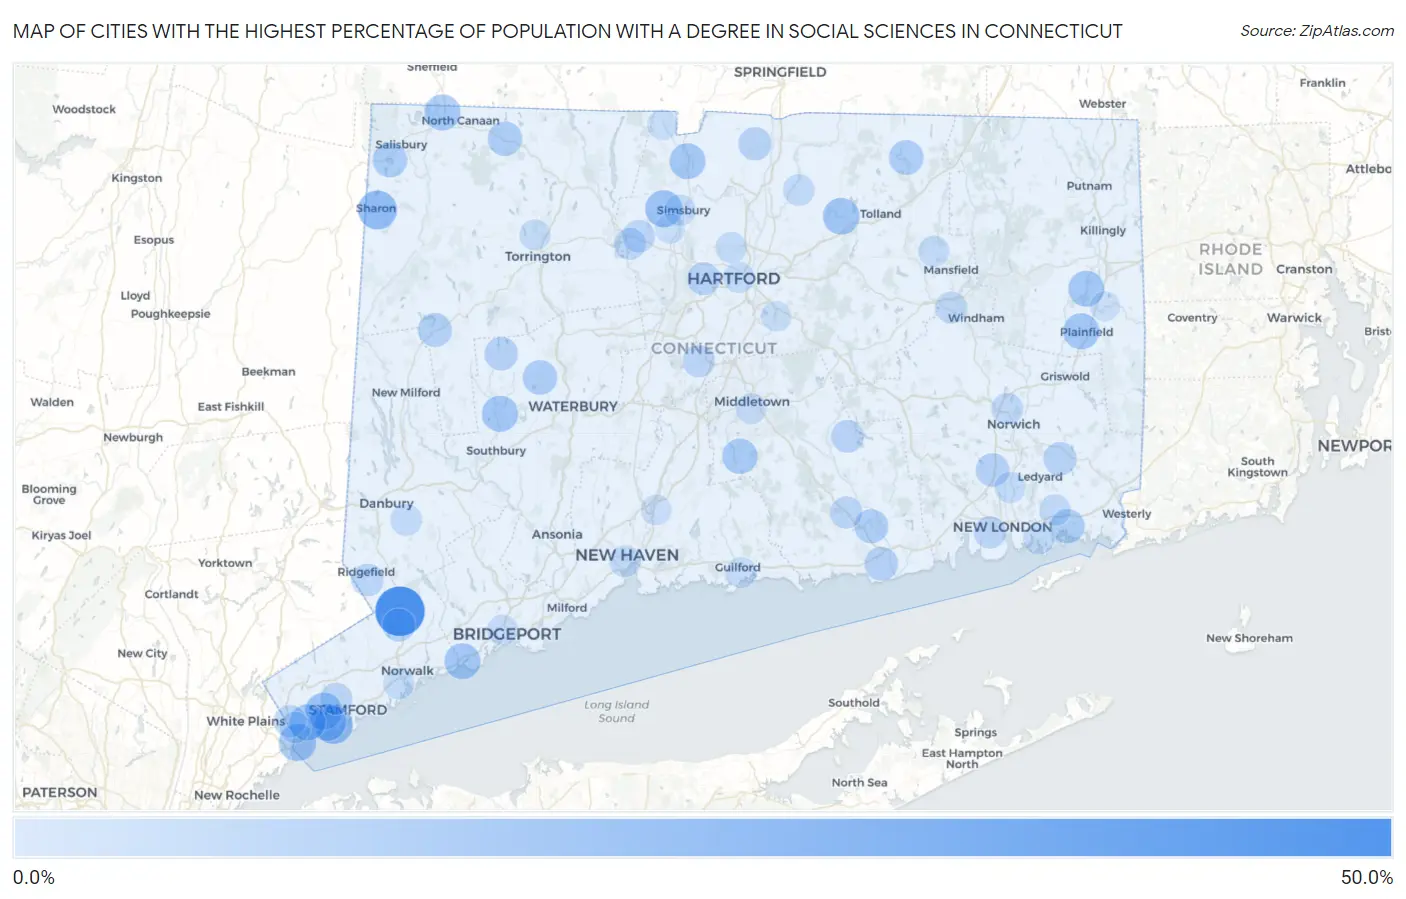
Map of Cities with the Highest Percentage of Population with a Degree in Social Sciences in Connecticut
0.0%
50.0%
Cities with the Highest Percentage of Population with a Degree in Social Sciences in Connecticut
| City | % Graduates | vs State | vs National | |
| 1. | Cannondale | 40.3% | 10.1%(+30.2)#1 | 8.1%(+32.2)#299 |
| 2. | Botsford | 36.6% | 10.1%(+26.6)#2 | 8.1%(+28.6)#368 |
| 3. | Rock Ridge | 36.1% | 10.1%(+26.0)#3 | 8.1%(+28.0)#382 |
| 4. | Mamanasco Lake | 32.0% | 10.1%(+21.9)#4 | 8.1%(+23.9)#476 |
| 5. | Fenwick Borough | 28.1% | 10.1%(+18.1)#5 | 8.1%(+20.1)#629 |
| 6. | Bogus Hill | 25.0% | 10.1%(+14.9)#6 | 8.1%(+16.9)#816 |
| 7. | Poplar Plains | 24.5% | 10.1%(+14.4)#7 | 8.1%(+16.4)#863 |
| 8. | Sharon | 22.9% | 10.1%(+12.9)#8 | 8.1%(+14.9)#967 |
| 9. | Old Greenwich | 21.5% | 10.1%(+11.5)#9 | 8.1%(+13.5)#1,116 |
| 10. | Noroton | 20.9% | 10.1%(+10.9)#10 | 8.1%(+12.9)#1,191 |
| 11. | Tokeneke | 20.9% | 10.1%(+10.8)#11 | 8.1%(+12.8)#1,198 |
| 12. | West Mountain | 20.4% | 10.1%(+10.3)#12 | 8.1%(+12.3)#1,253 |
| 13. | Byram | 20.4% | 10.1%(+10.3)#13 | 8.1%(+12.3)#1,254 |
| 14. | Cos Cob | 20.2% | 10.1%(+10.2)#14 | 8.1%(+12.2)#1,271 |
| 15. | West Simsbury | 20.1% | 10.1%(+9.98)#15 | 8.1%(+12.0)#1,284 |
| 16. | Riverside | 20.0% | 10.1%(+9.90)#16 | 8.1%(+11.9)#1,347 |
| 17. | Rockville | 19.4% | 10.1%(+9.32)#17 | 8.1%(+11.3)#1,411 |
| 18. | Greenwich | 19.1% | 10.1%(+8.99)#18 | 8.1%(+11.0)#1,463 |
| 19. | Woodbury Center | 18.6% | 10.1%(+8.57)#19 | 8.1%(+10.6)#1,540 |
| 20. | Plainfield Village | 18.5% | 10.1%(+8.46)#20 | 8.1%(+10.5)#1,559 |
| 21. | Southport | 18.5% | 10.1%(+8.39)#21 | 8.1%(+10.4)#1,571 |
| 22. | Canaan | 18.4% | 10.1%(+8.35)#22 | 8.1%(+10.3)#1,576 |
| 23. | Darien Downtown | 18.4% | 10.1%(+8.28)#23 | 8.1%(+10.3)#1,584 |
| 24. | Wauregan | 18.4% | 10.1%(+8.28)#24 | 8.1%(+10.3)#1,586 |
| 25. | Coleytown | 18.3% | 10.1%(+8.23)#25 | 8.1%(+10.2)#1,591 |
| 26. | Redding Center | 18.3% | 10.1%(+8.19)#26 | 8.1%(+10.2)#1,595 |
| 27. | Salmon Brook | 18.3% | 10.1%(+8.18)#27 | 8.1%(+10.2)#1,597 |
| 28. | Stonington Borough | 18.2% | 10.1%(+8.08)#28 | 8.1%(+10.1)#1,636 |
| 29. | Saugatuck | 17.9% | 10.1%(+7.82)#29 | 8.1%(+9.82)#1,664 |
| 30. | Noroton Heights | 17.6% | 10.1%(+7.50)#30 | 8.1%(+9.51)#1,726 |
| 31. | Durham | 17.1% | 10.1%(+7.02)#31 | 8.1%(+9.02)#1,825 |
| 32. | Greens Farms | 16.8% | 10.1%(+6.74)#32 | 8.1%(+8.74)#1,885 |
| 33. | Compo | 16.7% | 10.1%(+6.65)#33 | 8.1%(+8.65)#1,903 |
| 34. | Lakeville | 16.3% | 10.1%(+6.28)#34 | 8.1%(+8.28)#2,015 |
| 35. | Westport | 16.3% | 10.1%(+6.25)#35 | 8.1%(+8.25)#2,022 |
| 36. | Stafford Springs | 16.3% | 10.1%(+6.22)#36 | 8.1%(+8.22)#2,025 |
| 37. | Watertown | 16.2% | 10.1%(+6.14)#37 | 8.1%(+8.14)#2,048 |
| 38. | South Wilton | 16.2% | 10.1%(+6.13)#38 | 8.1%(+8.13)#2,050 |
| 39. | Mystic | 15.9% | 10.1%(+5.88)#39 | 8.1%(+7.88)#2,119 |
| 40. | Norfolk | 15.9% | 10.1%(+5.86)#40 | 8.1%(+7.86)#2,126 |
| 41. | New Canaan | 15.6% | 10.1%(+5.53)#41 | 8.1%(+7.53)#2,213 |
| 42. | Essex Village | 15.4% | 10.1%(+5.34)#42 | 8.1%(+7.34)#2,261 |
| 43. | New Preston | 15.3% | 10.1%(+5.19)#43 | 8.1%(+7.19)#2,319 |
| 44. | Newtown Borough | 15.2% | 10.1%(+5.09)#44 | 8.1%(+7.09)#2,345 |
| 45. | Lakeside Woods | 15.0% | 10.1%(+4.95)#45 | 8.1%(+6.95)#2,388 |
| 46. | Old Saybrook Center | 14.7% | 10.1%(+4.63)#46 | 8.1%(+6.63)#2,489 |
| 47. | Hawleyville | 14.7% | 10.1%(+4.59)#47 | 8.1%(+6.60)#2,507 |
| 48. | Oxoboxo River | 14.6% | 10.1%(+4.54)#48 | 8.1%(+6.54)#2,530 |
| 49. | Bethlehem Village | 14.6% | 10.1%(+4.49)#49 | 8.1%(+6.49)#2,546 |
| 50. | Cornwall Bridge | 14.5% | 10.1%(+4.44)#50 | 8.1%(+6.44)#2,557 |
| 51. | Indian Field | 14.5% | 10.1%(+4.41)#51 | 8.1%(+6.41)#2,565 |
| 52. | Mashantucket | 14.3% | 10.1%(+4.21)#52 | 8.1%(+6.21)#2,673 |
| 53. | Suffield Depot | 14.1% | 10.1%(+3.98)#53 | 8.1%(+5.99)#2,745 |
| 54. | Wilton Center | 14.0% | 10.1%(+3.93)#54 | 8.1%(+5.94)#2,761 |
| 55. | West Hartford | 13.7% | 10.1%(+3.58)#55 | 8.1%(+5.58)#2,902 |
| 56. | Groton Long Point Borough | 13.4% | 10.1%(+3.33)#56 | 8.1%(+5.33)#3,014 |
| 57. | Moodus | 13.4% | 10.1%(+3.29)#57 | 8.1%(+5.29)#3,039 |
| 58. | Lakes East | 13.3% | 10.1%(+3.19)#58 | 8.1%(+5.19)#3,099 |
| 59. | Litchfield Borough | 13.3% | 10.1%(+3.19)#59 | 8.1%(+5.19)#3,103 |
| 60. | Lake Chaffee | 13.2% | 10.1%(+3.09)#60 | 8.1%(+5.09)#3,165 |
| 61. | Mill Plain | 13.1% | 10.1%(+3.06)#61 | 8.1%(+5.06)#3,175 |
| 62. | Ridgefield | 13.0% | 10.1%(+2.96)#62 | 8.1%(+4.96)#3,232 |
| 63. | Canton Valley | 13.0% | 10.1%(+2.90)#63 | 8.1%(+4.90)#3,255 |
| 64. | Glenville | 12.8% | 10.1%(+2.73)#64 | 8.1%(+4.73)#3,351 |
| 65. | Kensington | 12.7% | 10.1%(+2.61)#65 | 8.1%(+4.61)#3,414 |
| 66. | Stamford | 12.6% | 10.1%(+2.49)#66 | 8.1%(+4.49)#3,474 |
| 67. | Waterford | 12.5% | 10.1%(+2.45)#67 | 8.1%(+4.45)#3,494 |
| 68. | Deep River Center | 12.5% | 10.1%(+2.41)#68 | 8.1%(+4.41)#3,575 |
| 69. | Topstone | 12.4% | 10.1%(+2.29)#69 | 8.1%(+4.29)#3,625 |
| 70. | Willimantic | 12.2% | 10.1%(+2.17)#70 | 8.1%(+4.17)#3,696 |
| 71. | Collinsville | 12.0% | 10.1%(+1.97)#71 | 8.1%(+3.97)#3,796 |
| 72. | Weston | 11.9% | 10.1%(+1.84)#72 | 8.1%(+3.84)#3,872 |
| 73. | Norwich | 11.8% | 10.1%(+1.76)#73 | 8.1%(+3.76)#3,911 |
| 74. | Candlewood Knolls | 11.8% | 10.1%(+1.69)#74 | 8.1%(+3.69)#3,972 |
| 75. | Bethel | 11.7% | 10.1%(+1.67)#75 | 8.1%(+3.67)#3,983 |
| 76. | Broad Brook | 11.5% | 10.1%(+1.45)#76 | 8.1%(+3.45)#4,141 |
| 77. | Pemberwick | 11.5% | 10.1%(+1.45)#77 | 8.1%(+3.45)#4,144 |
| 78. | New Haven | 11.5% | 10.1%(+1.38)#78 | 8.1%(+3.38)#4,184 |
| 79. | Route 7 Gateway | 11.4% | 10.1%(+1.35)#79 | 8.1%(+3.35)#4,205 |
| 80. | Old Mystic | 11.3% | 10.1%(+1.23)#80 | 8.1%(+3.23)#4,287 |
| 81. | Storrs | 11.1% | 10.1%(+1.01)#81 | 8.1%(+3.01)#4,496 |
| 82. | Simsbury Center | 11.1% | 10.1%(+1.01)#82 | 8.1%(+3.01)#4,497 |
| 83. | Staples | 11.1% | 10.1%(+1.00)#83 | 8.1%(+3.00)#4,503 |
| 84. | Poquonock Bridge | 11.1% | 10.1%(+0.995)#84 | 8.1%(+3.00)#4,507 |
| 85. | Hartford | 11.0% | 10.1%(+0.911)#85 | 8.1%(+2.91)#4,569 |
| 86. | Blue Hills | 10.9% | 10.1%(+0.859)#86 | 8.1%(+2.86)#4,610 |
| 87. | Gales Ferry | 10.8% | 10.1%(+0.739)#87 | 8.1%(+2.74)#4,687 |
| 88. | Torrington | 10.8% | 10.1%(+0.733)#88 | 8.1%(+2.73)#4,701 |
| 89. | Norwalk | 10.7% | 10.1%(+0.664)#89 | 8.1%(+2.66)#4,757 |
| 90. | Bridgeport | 10.5% | 10.1%(+0.457)#90 | 8.1%(+2.46)#4,947 |
| 91. | Woodmont Borough | 10.5% | 10.1%(+0.454)#91 | 8.1%(+2.46)#4,953 |
| 92. | Middletown | 10.4% | 10.1%(+0.369)#92 | 8.1%(+2.37)#5,034 |
| 93. | Guilford Center | 10.3% | 10.1%(+0.255)#93 | 8.1%(+2.26)#5,149 |
| 94. | North Haven | 10.1% | 10.1%(+0.043)#94 | 8.1%(+2.04)#5,349 |
| 95. | North Granby | 9.8% | 10.1%(-0.271)#95 | 8.1%(+1.73)#5,674 |
| 96. | Glastonbury Center | 9.7% | 10.1%(-0.357)#96 | 8.1%(+1.64)#5,758 |
| 97. | Lake Bungee | 9.6% | 10.1%(-0.423)#97 | 8.1%(+1.58)#5,834 |
| 98. | Moosup | 9.5% | 10.1%(-0.564)#98 | 8.1%(+1.44)#6,003 |
| 99. | Stepney | 9.4% | 10.1%(-0.624)#99 | 8.1%(+1.38)#6,057 |
| 100. | Weatogue | 9.4% | 10.1%(-0.627)#100 | 8.1%(+1.37)#6,059 |
Common Questions
What are the Top 10 Cities with the Highest Percentage of Population with a Degree in Social Sciences in Connecticut?
Top 10 Cities with the Highest Percentage of Population with a Degree in Social Sciences in Connecticut are:
#1
40.3%
#2
22.9%
#3
21.5%
#4
20.4%
#5
20.2%
#6
20.1%
#7
20.0%
#8
19.4%
#9
19.1%
#10
18.6%
What city has the Highest Percentage of Population with a Degree in Social Sciences in Connecticut?
Cannondale has the Highest Percentage of Population with a Degree in Social Sciences in Connecticut with 40.3%.
What is the Percentage of Population with a Degree in Social Sciences in the State of Connecticut?
Percentage of Population with a Degree in Social Sciences in Connecticut is 10.1%.
What is the Percentage of Population with a Degree in Social Sciences in the United States?
Percentage of Population with a Degree in Social Sciences in the United States is 8.1%.