States with the Highest Percentage of Population with a Degree in Social Sciences
RELATED REPORTS & OPTIONS
Social Sciences
United States
Compare States
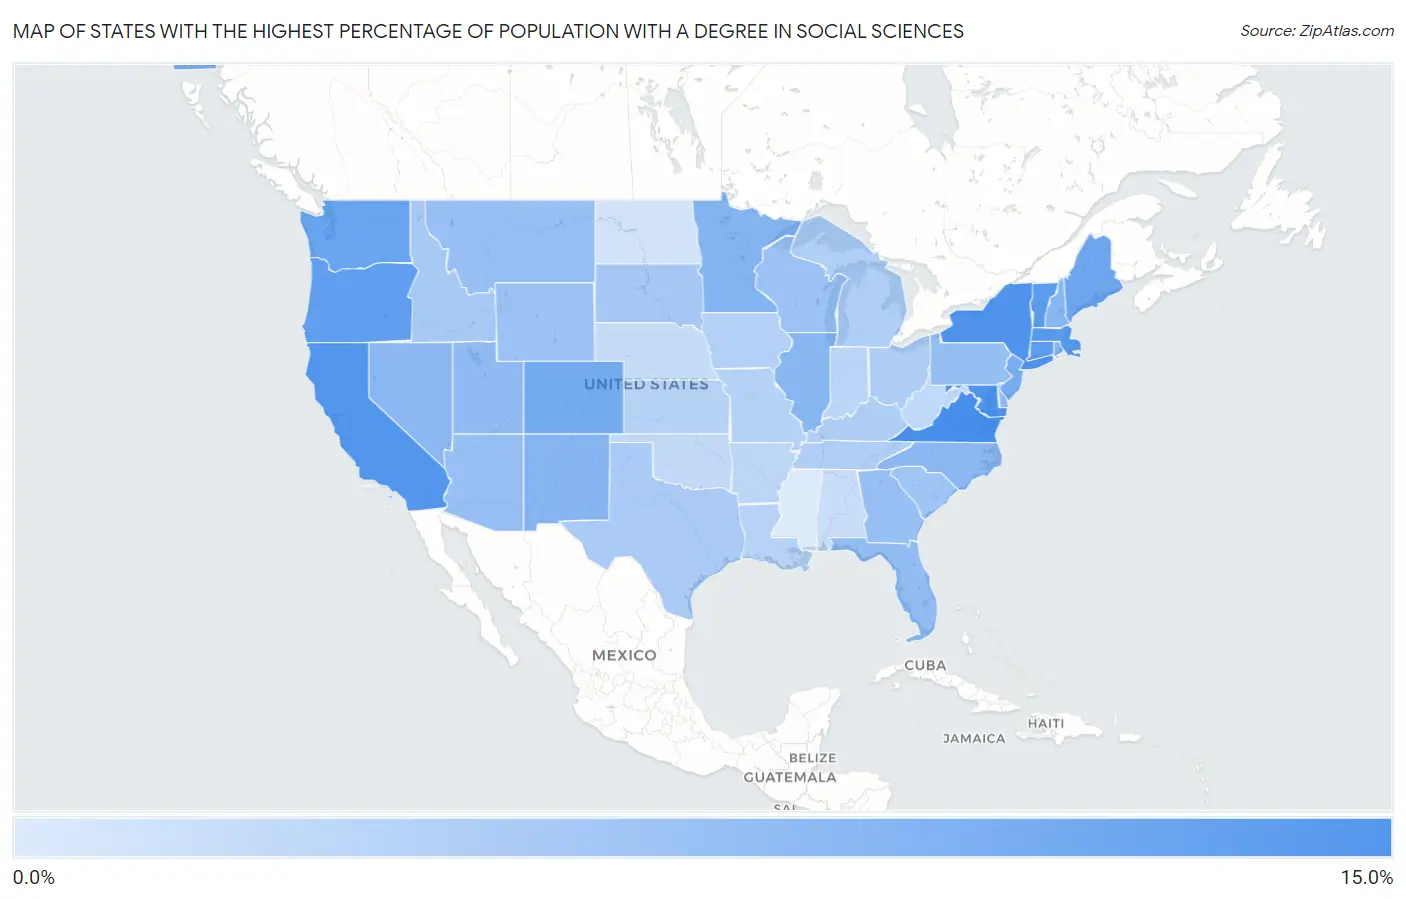
Map of States with the Highest Percentage of Population with a Degree in Social Sciences
0.0%
15.0%
States with the Highest Percentage of Population with a Degree in Social Sciences in the United States
| State | % Graduates | vs State Median | vs National | |
| 1. | Virginia | 11.0% | 7.1% (+3.85) | 8.1%(+2.91) |
| 2. | Hawaii | 10.7% | 7.1% (+3.58) | 8.1%(+2.64) |
| 3. | Maryland | 10.7% | 7.1% (+3.53) | 8.1%(+2.59) |
| 4. | New York | 10.5% | 7.1% (+3.36) | 8.1%(+2.42) |
| 5. | California | 10.4% | 7.1% (+3.24) | 8.1%(+2.30) |
| 6. | Massachusetts | 10.2% | 7.1% (+3.08) | 8.1%(+2.14) |
| 7. | Vermont | 10.1% | 7.1% (+3.01) | 8.1%(+2.07) |
| 8. | Connecticut | 10.1% | 7.1% (+2.94) | 8.1%(+2.00) |
| 9. | Oregon | 9.7% | 7.1% (+2.55) | 8.1%(+1.61) |
| 10. | Washington | 9.3% | 7.1% (+2.16) | 8.1%(+1.22) |
| 11. | Maine | 9.0% | 7.1% (+1.88) | 8.1%(+0.940) |
| 12. | Colorado | 8.7% | 7.1% (+1.60) | 8.1%(+0.656) |
| 13. | New Jersey | 8.6% | 7.1% (+1.43) | 8.1%(+0.493) |
| 14. | Alaska | 8.1% | 7.1% (+0.987) | 8.1%(+0.047) |
| 15. | Minnesota | 8.1% | 7.1% (+0.959) | 8.1%(+0.019) |
| 16. | Rhode Island | 8.1% | 7.1% (+0.943) | 8.1%(+0.003) |
| 17. | New Mexico | 7.9% | 7.1% (+0.785) | 8.1%(-0.155) |
| 18. | New Hampshire | 7.8% | 7.1% (+0.677) | 8.1%(-0.262) |
| 19. | Illinois | 7.8% | 7.1% (+0.665) | 8.1%(-0.275) |
| 20. | Nevada | 7.6% | 7.1% (+0.435) | 8.1%(-0.505) |
| 21. | North Carolina | 7.6% | 7.1% (+0.420) | 8.1%(-0.520) |
| 22. | Utah | 7.4% | 7.1% (+0.299) | 8.1%(-0.641) |
| 23. | Delaware | 7.4% | 7.1% (+0.287) | 8.1%(-0.653) |
| 24. | Florida | 7.3% | 7.1% (+0.124) | 8.1%(-0.816) |
| 25. | Pennsylvania | 7.2% | 7.1% (+0.035) | 8.1%(-0.905) |
| 26. | Montana | 7.1% | 7.1% (-0.035) | 8.1%(-0.974) |
| 27. | Arizona | 7.1% | 7.1% (-0.045) | 8.1%(-0.985) |
| 28. | Georgia | 7.1% | 7.1% (-0.075) | 8.1%(-1.01) |
| 29. | Wyoming | 6.8% | 7.1% (-0.306) | 8.1%(-1.25) |
| 30. | Wisconsin | 6.8% | 7.1% (-0.329) | 8.1%(-1.27) |
| 31. | South Carolina | 6.8% | 7.1% (-0.380) | 8.1%(-1.32) |
| 32. | South Dakota | 6.3% | 7.1% (-0.785) | 8.1%(-1.73) |
| 33. | Idaho | 6.3% | 7.1% (-0.803) | 8.1%(-1.74) |
| 34. | Texas | 6.1% | 7.1% (-1.000) | 8.1%(-1.94) |
| 35. | Ohio | 6.0% | 7.1% (-1.13) | 8.1%(-2.07) |
| 36. | Kentucky | 6.0% | 7.1% (-1.14) | 8.1%(-2.08) |
| 37. | Michigan | 5.9% | 7.1% (-1.28) | 8.1%(-2.22) |
| 38. | Tennessee | 5.8% | 7.1% (-1.32) | 8.1%(-2.26) |
| 39. | Iowa | 5.7% | 7.1% (-1.45) | 8.1%(-2.39) |
| 40. | Missouri | 5.6% | 7.1% (-1.52) | 8.1%(-2.46) |
| 41. | Kansas | 5.6% | 7.1% (-1.56) | 8.1%(-2.50) |
| 42. | Louisiana | 5.5% | 7.1% (-1.62) | 8.1%(-2.56) |
| 43. | Indiana | 5.4% | 7.1% (-1.68) | 8.1%(-2.62) |
| 44. | Arkansas | 5.3% | 7.1% (-1.84) | 8.1%(-2.78) |
| 45. | West Virginia | 5.1% | 7.1% (-1.99) | 8.1%(-2.93) |
| 46. | Oklahoma | 5.1% | 7.1% (-2.02) | 8.1%(-2.96) |
| 47. | Nebraska | 4.9% | 7.1% (-2.23) | 8.1%(-3.17) |
| 48. | Alabama | 4.7% | 7.1% (-2.39) | 8.1%(-3.33) |
| 49. | North Dakota | 4.3% | 7.1% (-2.79) | 8.1%(-3.73) |
| 50. | Mississippi | 3.8% | 7.1% (-3.35) | 8.1%(-4.29) |
1
Common Questions
What are the Top 10 States with the Highest Percentage of Population with a Degree in Social Sciences in the United States?
Top 10 States with the Highest Percentage of Population with a Degree in Social Sciences in the United States are:
#1
11.0%
#2
10.7%
#3
10.7%
#4
10.5%
#5
10.4%
#6
10.2%
#7
10.1%
#8
10.1%
#9
9.7%
#10
9.3%
What state has the Highest Percentage of Population with a Degree in Social Sciences in the United States?
Virginia has the Highest Percentage of Population with a Degree in Social Sciences in the United States with 11.0%.
What is the Percentage of Population with a Degree in Social Sciences in the United States?
Percentage of Population with a Degree in Social Sciences in the United States is 8.1%.