Cities with the Highest Percentage of Population with a Degree in Social Sciences in Louisiana
RELATED REPORTS & OPTIONS
Social Sciences
Louisiana
Compare Cities
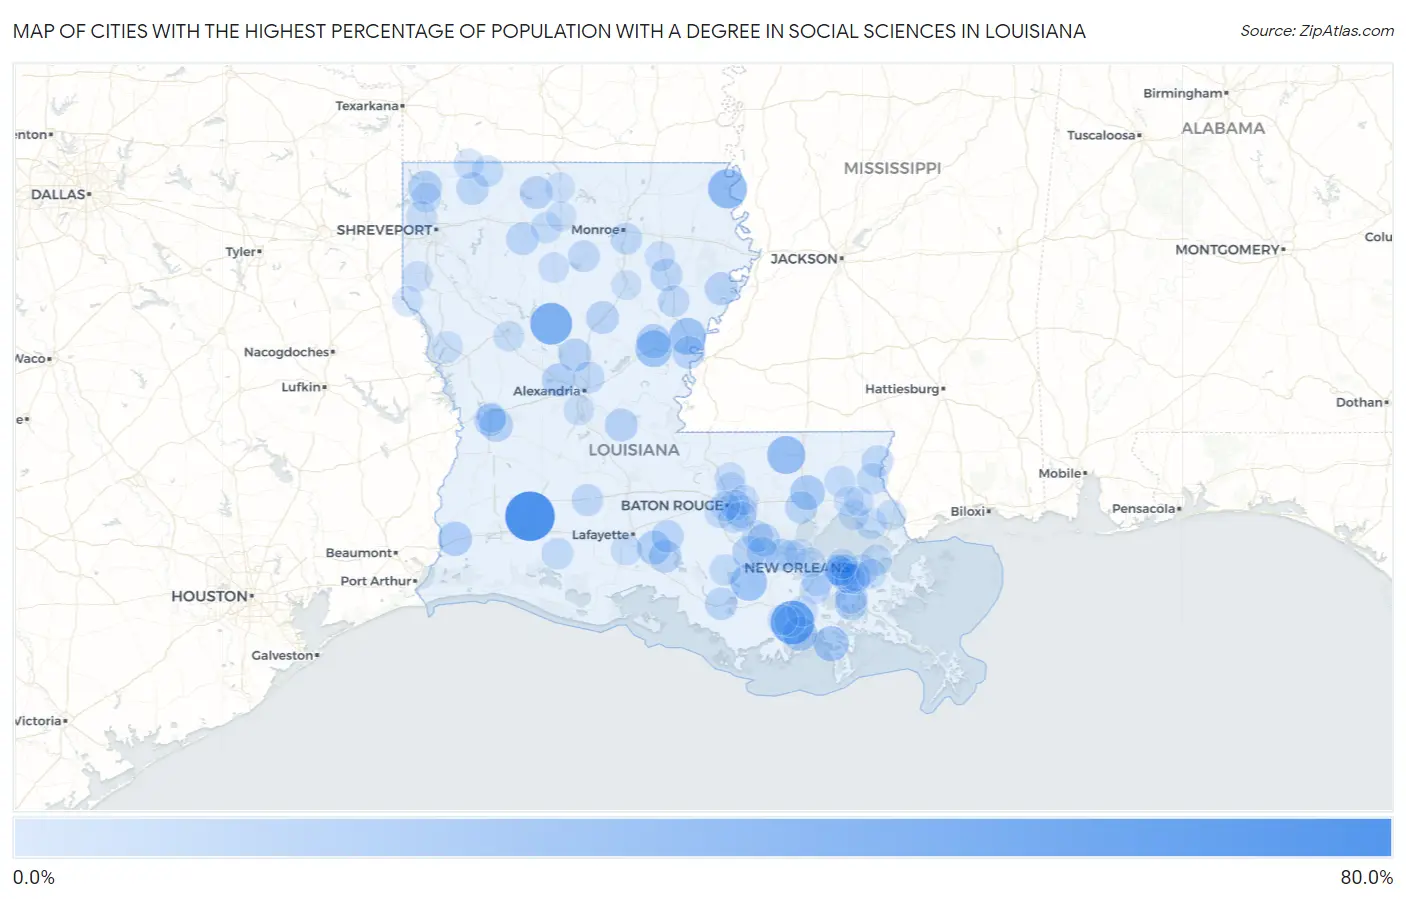
Map of Cities with the Highest Percentage of Population with a Degree in Social Sciences in Louisiana
0.0%
80.0%
Cities with the Highest Percentage of Population with a Degree in Social Sciences in Louisiana
| City | % Graduates | vs State | vs National | |
| 1. | Fenton | 80.0% | 5.5%(+74.5)#1 | 8.1%(+71.9)#70 |
| 2. | Bourg | 56.9% | 5.5%(+51.4)#2 | 8.1%(+48.8)#137 |
| 3. | Atlanta | 50.0% | 5.5%(+44.5)#3 | 8.1%(+41.9)#190 |
| 4. | Lake Providence | 39.7% | 5.5%(+34.2)#4 | 8.1%(+31.6)#322 |
| 5. | Greensburg | 35.3% | 5.5%(+29.8)#5 | 8.1%(+27.2)#393 |
| 6. | Clayton | 30.8% | 5.5%(+25.3)#6 | 8.1%(+22.7)#506 |
| 7. | Jonesville | 30.0% | 5.5%(+24.5)#7 | 8.1%(+21.9)#533 |
| 8. | Supreme | 30.0% | 5.5%(+24.5)#8 | 8.1%(+21.9)#536 |
| 9. | Golden Meadow | 24.9% | 5.5%(+19.4)#9 | 8.1%(+16.8)#846 |
| 10. | Natalbany | 22.7% | 5.5%(+17.2)#10 | 8.1%(+14.7)#982 |
| 11. | Montegut | 21.6% | 5.5%(+16.1)#11 | 8.1%(+13.5)#1,110 |
| 12. | Vinton | 21.2% | 5.5%(+15.6)#12 | 8.1%(+13.1)#1,159 |
| 13. | Wallace Ridge | 21.1% | 5.5%(+15.5)#13 | 8.1%(+13.0)#1,168 |
| 14. | St Martinville | 20.0% | 5.5%(+14.5)#14 | 8.1%(+11.9)#1,348 |
| 15. | Gilliam | 18.8% | 5.5%(+13.2)#15 | 8.1%(+10.7)#1,523 |
| 16. | Fort Polk South | 17.9% | 5.5%(+12.3)#16 | 8.1%(+9.78)#1,678 |
| 17. | Boyce | 17.7% | 5.5%(+12.2)#17 | 8.1%(+9.67)#1,701 |
| 18. | Newellton | 17.1% | 5.5%(+11.6)#18 | 8.1%(+9.07)#1,810 |
| 19. | Hessmer | 16.7% | 5.5%(+11.2)#19 | 8.1%(+8.60)#1,927 |
| 20. | Donaldsonville | 16.5% | 5.5%(+11.0)#20 | 8.1%(+8.41)#1,993 |
| 21. | Dry Prong | 16.4% | 5.5%(+10.9)#21 | 8.1%(+8.37)#2,000 |
| 22. | Loreauville | 16.3% | 5.5%(+10.8)#22 | 8.1%(+8.23)#2,024 |
| 23. | Urania | 15.8% | 5.5%(+10.3)#23 | 8.1%(+7.72)#2,154 |
| 24. | Lafitte | 15.8% | 5.5%(+10.3)#24 | 8.1%(+7.72)#2,156 |
| 25. | Lisbon | 15.6% | 5.5%(+10.1)#25 | 8.1%(+7.55)#2,203 |
| 26. | Sorrento | 15.4% | 5.5%(+9.87)#26 | 8.1%(+7.31)#2,267 |
| 27. | Ridgecrest | 15.2% | 5.5%(+9.64)#27 | 8.1%(+7.08)#2,349 |
| 28. | Catahoula | 15.1% | 5.5%(+9.54)#28 | 8.1%(+6.98)#2,378 |
| 29. | Bryceland | 15.0% | 5.5%(+9.49)#29 | 8.1%(+6.93)#2,404 |
| 30. | Cotton Valley | 14.8% | 5.5%(+9.30)#30 | 8.1%(+6.74)#2,462 |
| 31. | Inniswold | 14.4% | 5.5%(+8.93)#31 | 8.1%(+6.37)#2,584 |
| 32. | Jean Lafitte | 14.4% | 5.5%(+8.93)#32 | 8.1%(+6.37)#2,586 |
| 33. | Lutcher | 14.3% | 5.5%(+8.77)#33 | 8.1%(+6.21)#2,621 |
| 34. | Springfield | 14.3% | 5.5%(+8.77)#34 | 8.1%(+6.21)#2,641 |
| 35. | Berwick | 14.2% | 5.5%(+8.65)#35 | 8.1%(+6.09)#2,704 |
| 36. | New Llano | 14.1% | 5.5%(+8.60)#36 | 8.1%(+6.04)#2,721 |
| 37. | Winnsboro | 13.8% | 5.5%(+8.26)#37 | 8.1%(+5.70)#2,854 |
| 38. | Elmwood | 12.8% | 5.5%(+7.31)#38 | 8.1%(+4.75)#3,346 |
| 39. | Chatham | 12.6% | 5.5%(+7.12)#39 | 8.1%(+4.56)#3,440 |
| 40. | Bogalusa | 12.4% | 5.5%(+6.86)#40 | 8.1%(+4.30)#3,614 |
| 41. | Eunice | 12.0% | 5.5%(+6.48)#41 | 8.1%(+3.92)#3,835 |
| 42. | Ball | 11.7% | 5.5%(+6.17)#42 | 8.1%(+3.61)#4,022 |
| 43. | Boutte | 11.7% | 5.5%(+6.16)#43 | 8.1%(+3.60)#4,030 |
| 44. | Wisner | 11.5% | 5.5%(+5.98)#44 | 8.1%(+3.42)#4,157 |
| 45. | Richwood | 11.4% | 5.5%(+5.93)#45 | 8.1%(+3.37)#4,188 |
| 46. | Lake Arthur | 11.4% | 5.5%(+5.90)#46 | 8.1%(+3.34)#4,212 |
| 47. | Shongaloo | 11.1% | 5.5%(+5.60)#47 | 8.1%(+3.04)#4,473 |
| 48. | Pierre Part | 10.8% | 5.5%(+5.28)#48 | 8.1%(+2.72)#4,706 |
| 49. | Gonzales | 10.8% | 5.5%(+5.25)#49 | 8.1%(+2.69)#4,736 |
| 50. | Arabi | 10.6% | 5.5%(+5.06)#50 | 8.1%(+2.50)#4,916 |
| 51. | Sun | 10.2% | 5.5%(+4.69)#51 | 8.1%(+2.13)#5,263 |
| 52. | Union | 10.2% | 5.5%(+4.69)#52 | 8.1%(+2.13)#5,264 |
| 53. | Lacombe | 10.2% | 5.5%(+4.67)#53 | 8.1%(+2.11)#5,287 |
| 54. | Presquille | 10.1% | 5.5%(+4.57)#54 | 8.1%(+2.01)#5,369 |
| 55. | Gardere | 10.0% | 5.5%(+4.49)#55 | 8.1%(+1.93)#5,426 |
| 56. | Folsom | 9.9% | 5.5%(+4.42)#56 | 8.1%(+1.86)#5,558 |
| 57. | Brusly | 9.7% | 5.5%(+4.19)#57 | 8.1%(+1.63)#5,777 |
| 58. | New Orleans | 9.6% | 5.5%(+4.09)#58 | 8.1%(+1.53)#5,883 |
| 59. | Simsboro | 9.5% | 5.5%(+4.01)#59 | 8.1%(+1.45)#5,980 |
| 60. | Jefferson | 9.1% | 5.5%(+3.59)#60 | 8.1%(+1.03)#6,462 |
| 61. | Westwego | 8.8% | 5.5%(+3.31)#61 | 8.1%(+0.749)#6,823 |
| 62. | Lockport | 8.6% | 5.5%(+3.11)#62 | 8.1%(+0.550)#7,073 |
| 63. | Bridge City | 8.6% | 5.5%(+3.04)#63 | 8.1%(+0.479)#7,174 |
| 64. | Milton | 8.4% | 5.5%(+2.89)#64 | 8.1%(+0.335)#7,338 |
| 65. | Marrero | 8.2% | 5.5%(+2.71)#65 | 8.1%(+0.147)#7,612 |
| 66. | Harvey | 8.1% | 5.5%(+2.60)#66 | 8.1%(+0.036)#7,786 |
| 67. | Natchitoches | 8.0% | 5.5%(+2.48)#67 | 8.1%(-0.075)#7,957 |
| 68. | Zachary | 7.9% | 5.5%(+2.34)#68 | 8.1%(-0.221)#8,181 |
| 69. | Woodworth | 7.8% | 5.5%(+2.24)#69 | 8.1%(-0.315)#8,339 |
| 70. | River Ridge | 7.7% | 5.5%(+2.22)#70 | 8.1%(-0.343)#8,377 |
| 71. | Bayou Gauche | 7.7% | 5.5%(+2.18)#71 | 8.1%(-0.379)#8,425 |
| 72. | Gretna | 7.7% | 5.5%(+2.16)#72 | 8.1%(-0.395)#8,493 |
| 73. | Zwolle | 7.5% | 5.5%(+1.99)#73 | 8.1%(-0.571)#8,745 |
| 74. | Houma | 7.4% | 5.5%(+1.93)#74 | 8.1%(-0.629)#8,836 |
| 75. | Reserve | 7.4% | 5.5%(+1.87)#75 | 8.1%(-0.691)#8,949 |
| 76. | Mandeville | 7.3% | 5.5%(+1.79)#76 | 8.1%(-0.766)#9,050 |
| 77. | Blanchard | 7.2% | 5.5%(+1.74)#77 | 8.1%(-0.821)#9,140 |
| 78. | Keachi | 7.1% | 5.5%(+1.63)#78 | 8.1%(-0.928)#9,334 |
| 79. | Montz | 7.1% | 5.5%(+1.61)#79 | 8.1%(-0.954)#9,369 |
| 80. | Baker | 7.1% | 5.5%(+1.59)#80 | 8.1%(-0.974)#9,406 |
| 81. | Monticello | 7.1% | 5.5%(+1.58)#81 | 8.1%(-0.976)#9,412 |
| 82. | Jonesboro | 7.1% | 5.5%(+1.55)#82 | 8.1%(-1.01)#9,456 |
| 83. | Mangham | 7.0% | 5.5%(+1.53)#83 | 8.1%(-1.03)#9,493 |
| 84. | Baton Rouge | 7.0% | 5.5%(+1.50)#84 | 8.1%(-1.06)#9,542 |
| 85. | Logansport | 6.9% | 5.5%(+1.38)#85 | 8.1%(-1.17)#9,705 |
| 86. | Springhill | 6.9% | 5.5%(+1.35)#86 | 8.1%(-1.21)#9,770 |
| 87. | Pearl River | 6.8% | 5.5%(+1.27)#87 | 8.1%(-1.29)#9,882 |
| 88. | Belcher | 6.7% | 5.5%(+1.16)#88 | 8.1%(-1.40)#10,090 |
| 89. | Meraux | 6.6% | 5.5%(+1.07)#89 | 8.1%(-1.49)#10,212 |
| 90. | Garyville | 6.6% | 5.5%(+1.07)#90 | 8.1%(-1.49)#10,227 |
| 91. | Harahan | 6.5% | 5.5%(+1.01)#91 | 8.1%(-1.55)#10,336 |
| 92. | Metairie | 6.5% | 5.5%(+0.992)#92 | 8.1%(-1.57)#10,360 |
| 93. | Village St George | 6.4% | 5.5%(+0.892)#93 | 8.1%(-1.67)#10,544 |
| 94. | Leesville | 6.3% | 5.5%(+0.773)#94 | 8.1%(-1.79)#10,739 |
| 95. | Port Allen | 6.2% | 5.5%(+0.700)#95 | 8.1%(-1.86)#10,877 |
| 96. | Columbia | 6.1% | 5.5%(+0.549)#96 | 8.1%(-2.01)#11,132 |
| 97. | Covington | 6.0% | 5.5%(+0.491)#97 | 8.1%(-2.07)#11,224 |
| 98. | Bernice | 6.0% | 5.5%(+0.441)#98 | 8.1%(-2.12)#11,335 |
| 99. | Vienna | 5.9% | 5.5%(+0.409)#99 | 8.1%(-2.15)#11,384 |
| 100. | Abita Springs | 5.9% | 5.5%(+0.351)#100 | 8.1%(-2.21)#11,504 |
Common Questions
What are the Top 10 Cities with the Highest Percentage of Population with a Degree in Social Sciences in Louisiana?
Top 10 Cities with the Highest Percentage of Population with a Degree in Social Sciences in Louisiana are:
#1
80.0%
#2
56.9%
#3
50.0%
#4
39.7%
#5
35.3%
#6
30.8%
#7
30.0%
#8
30.0%
#9
24.9%
#10
22.7%
What city has the Highest Percentage of Population with a Degree in Social Sciences in Louisiana?
Fenton has the Highest Percentage of Population with a Degree in Social Sciences in Louisiana with 80.0%.
What is the Percentage of Population with a Degree in Social Sciences in the State of Louisiana?
Percentage of Population with a Degree in Social Sciences in Louisiana is 5.5%.
What is the Percentage of Population with a Degree in Social Sciences in the United States?
Percentage of Population with a Degree in Social Sciences in the United States is 8.1%.