Cities with the Highest Percentage of Population with a Degree in Social Sciences in Tennessee
RELATED REPORTS & OPTIONS
Social Sciences
Tennessee
Compare Cities
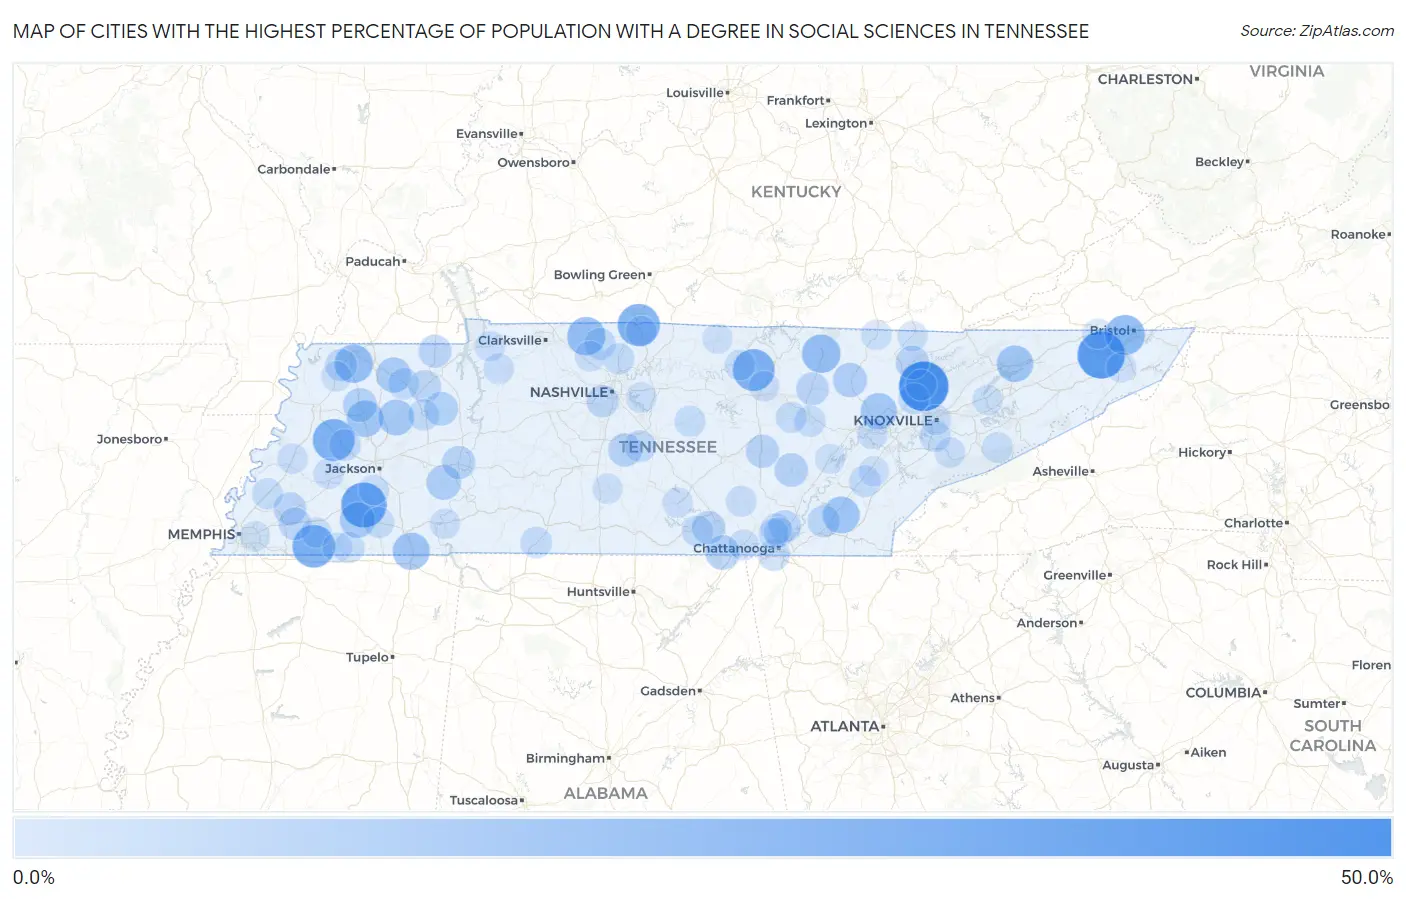
Map of Cities with the Highest Percentage of Population with a Degree in Social Sciences in Tennessee
0.0%
50.0%
Cities with the Highest Percentage of Population with a Degree in Social Sciences in Tennessee
| City | % Graduates | vs State | vs National | |
| 1. | Andersonville | 50.0% | 5.8%(+44.2)#1 | 8.1%(+41.9)#177 |
| 2. | Gray | 45.1% | 5.8%(+39.2)#2 | 8.1%(+37.0)#248 |
| 3. | Toone | 40.0% | 5.8%(+34.2)#3 | 8.1%(+31.9)#307 |
| 4. | Moscow | 34.5% | 5.8%(+28.7)#4 | 8.1%(+26.5)#411 |
| 5. | Mitchellville | 33.3% | 5.8%(+27.5)#5 | 8.1%(+25.3)#437 |
| 6. | Maury City | 32.9% | 5.8%(+27.1)#6 | 8.1%(+24.9)#460 |
| 7. | Dodson Branch | 32.9% | 5.8%(+27.1)#7 | 8.1%(+24.9)#461 |
| 8. | Walnut Hill | 28.5% | 5.8%(+22.7)#8 | 8.1%(+20.4)#616 |
| 9. | Cosby | 25.8% | 5.8%(+19.9)#9 | 8.1%(+17.7)#755 |
| 10. | Jamestown | 25.4% | 5.8%(+19.6)#10 | 8.1%(+17.3)#777 |
| 11. | Cedar Hill | 25.0% | 5.8%(+19.2)#11 | 8.1%(+16.9)#797 |
| 12. | Rives | 25.0% | 5.8%(+19.2)#12 | 8.1%(+16.9)#814 |
| 13. | Guys | 22.2% | 5.8%(+16.4)#13 | 8.1%(+14.2)#1,034 |
| 14. | Charleston | 21.6% | 5.8%(+15.8)#14 | 8.1%(+13.6)#1,103 |
| 15. | Mooresburg | 21.1% | 5.8%(+15.2)#15 | 8.1%(+13.0)#1,166 |
| 16. | Trenton | 21.0% | 5.8%(+15.1)#16 | 8.1%(+12.9)#1,189 |
| 17. | Coalfield | 20.6% | 5.8%(+14.8)#17 | 8.1%(+12.5)#1,229 |
| 18. | Atwood | 19.7% | 5.8%(+13.9)#18 | 8.1%(+11.6)#1,373 |
| 19. | Bolivar | 19.0% | 5.8%(+13.2)#19 | 8.1%(+10.9)#1,481 |
| 20. | Dresden | 18.1% | 5.8%(+12.3)#20 | 8.1%(+10.0)#1,642 |
| 21. | Scotts Hill | 17.0% | 5.8%(+11.2)#21 | 8.1%(+8.97)#1,838 |
| 22. | Orme | 16.7% | 5.8%(+10.9)#22 | 8.1%(+8.60)#1,967 |
| 23. | Sunbright | 16.2% | 5.8%(+10.4)#23 | 8.1%(+8.15)#2,045 |
| 24. | Dyer | 15.5% | 5.8%(+9.72)#24 | 8.1%(+7.46)#2,232 |
| 25. | Hollow Rock | 15.2% | 5.8%(+9.34)#25 | 8.1%(+7.08)#2,350 |
| 26. | Pikeville | 14.8% | 5.8%(+8.96)#26 | 8.1%(+6.70)#2,474 |
| 27. | La Follette | 14.8% | 5.8%(+8.96)#27 | 8.1%(+6.69)#2,475 |
| 28. | Eagleville | 14.7% | 5.8%(+8.94)#28 | 8.1%(+6.68)#2,480 |
| 29. | Spencer | 14.1% | 5.8%(+8.29)#29 | 8.1%(+6.03)#2,723 |
| 30. | Delano | 14.1% | 5.8%(+8.28)#30 | 8.1%(+6.01)#2,733 |
| 31. | Parsons | 13.9% | 5.8%(+8.10)#31 | 8.1%(+5.84)#2,800 |
| 32. | Sewanee | 13.8% | 5.8%(+7.95)#32 | 8.1%(+5.69)#2,863 |
| 33. | Puryear | 13.3% | 5.8%(+7.53)#33 | 8.1%(+5.26)#3,060 |
| 34. | Gallaway | 13.0% | 5.8%(+7.24)#34 | 8.1%(+4.97)#3,215 |
| 35. | Clarkrange | 12.9% | 5.8%(+7.14)#35 | 8.1%(+4.87)#3,275 |
| 36. | Hopewell | 12.5% | 5.8%(+6.66)#36 | 8.1%(+4.39)#3,579 |
| 37. | Oakland | 12.4% | 5.8%(+6.64)#37 | 8.1%(+4.37)#3,589 |
| 38. | Finley | 12.3% | 5.8%(+6.52)#38 | 8.1%(+4.26)#3,650 |
| 39. | Henry | 12.1% | 5.8%(+6.31)#39 | 8.1%(+4.05)#3,757 |
| 40. | Belle Meade | 12.0% | 5.8%(+6.21)#40 | 8.1%(+3.95)#3,810 |
| 41. | Valley Forge | 11.9% | 5.8%(+6.08)#41 | 8.1%(+3.82)#3,886 |
| 42. | Troy | 11.6% | 5.8%(+5.76)#42 | 8.1%(+3.50)#4,104 |
| 43. | Falling Water | 11.5% | 5.8%(+5.73)#43 | 8.1%(+3.47)#4,120 |
| 44. | Rarity Bay | 11.4% | 5.8%(+5.59)#44 | 8.1%(+3.33)#4,216 |
| 45. | Lookout Mountain | 11.2% | 5.8%(+5.37)#45 | 8.1%(+3.11)#4,378 |
| 46. | Rockvale | 11.0% | 5.8%(+5.23)#46 | 8.1%(+2.97)#4,530 |
| 47. | Alamo | 10.9% | 5.8%(+5.13)#47 | 8.1%(+2.87)#4,599 |
| 48. | Gleason | 10.8% | 5.8%(+4.97)#48 | 8.1%(+2.71)#4,718 |
| 49. | Niota | 10.8% | 5.8%(+4.96)#49 | 8.1%(+2.70)#4,730 |
| 50. | Springfield | 10.6% | 5.8%(+4.83)#50 | 8.1%(+2.56)#4,866 |
| 51. | Loretto | 10.3% | 5.8%(+4.54)#51 | 8.1%(+2.27)#5,122 |
| 52. | Huntingdon | 10.3% | 5.8%(+4.45)#52 | 8.1%(+2.19)#5,200 |
| 53. | Cowan | 10.2% | 5.8%(+4.43)#53 | 8.1%(+2.17)#5,234 |
| 54. | Rockford | 10.2% | 5.8%(+4.34)#54 | 8.1%(+2.08)#5,309 |
| 55. | Millersville | 10.1% | 5.8%(+4.30)#55 | 8.1%(+2.04)#5,359 |
| 56. | Saulsbury | 10.0% | 5.8%(+4.19)#56 | 8.1%(+1.93)#5,470 |
| 57. | Crossville | 10.0% | 5.8%(+4.18)#57 | 8.1%(+1.91)#5,502 |
| 58. | Pleasant Hill | 9.7% | 5.8%(+3.89)#58 | 8.1%(+1.63)#5,778 |
| 59. | Clinton | 9.6% | 5.8%(+3.77)#59 | 8.1%(+1.50)#5,920 |
| 60. | Hornsby | 9.5% | 5.8%(+3.72)#60 | 8.1%(+1.45)#5,986 |
| 61. | Fairmount | 9.5% | 5.8%(+3.69)#61 | 8.1%(+1.43)#6,012 |
| 62. | Atoka | 9.5% | 5.8%(+3.68)#62 | 8.1%(+1.41)#6,024 |
| 63. | Auburntown | 9.4% | 5.8%(+3.63)#63 | 8.1%(+1.36)#6,083 |
| 64. | Norris | 9.3% | 5.8%(+3.54)#64 | 8.1%(+1.28)#6,183 |
| 65. | Rocky Top | 9.3% | 5.8%(+3.49)#65 | 8.1%(+1.23)#6,231 |
| 66. | Pittman Center | 9.3% | 5.8%(+3.45)#66 | 8.1%(+1.19)#6,274 |
| 67. | Gruetli Laager | 9.1% | 5.8%(+3.28)#67 | 8.1%(+1.02)#6,474 |
| 68. | Portland | 9.1% | 5.8%(+3.26)#68 | 8.1%(+1.00)#6,540 |
| 69. | Gainesboro | 9.0% | 5.8%(+3.20)#69 | 8.1%(+0.938)#6,604 |
| 70. | Tennessee Ridge | 8.8% | 5.8%(+3.00)#70 | 8.1%(+0.737)#6,836 |
| 71. | Jasper | 8.8% | 5.8%(+2.97)#71 | 8.1%(+0.711)#6,859 |
| 72. | Signal Mountain | 8.7% | 5.8%(+2.92)#72 | 8.1%(+0.662)#6,920 |
| 73. | Kingston | 8.7% | 5.8%(+2.89)#73 | 8.1%(+0.628)#6,961 |
| 74. | Henning | 8.6% | 5.8%(+2.83)#74 | 8.1%(+0.571)#7,052 |
| 75. | Coopertown | 8.6% | 5.8%(+2.77)#75 | 8.1%(+0.511)#7,123 |
| 76. | Oak Grove Cdp Sumner County | 8.6% | 5.8%(+2.76)#76 | 8.1%(+0.500)#7,153 |
| 77. | Dover | 8.4% | 5.8%(+2.63)#77 | 8.1%(+0.366)#7,306 |
| 78. | Williston | 8.3% | 5.8%(+2.53)#78 | 8.1%(+0.262)#7,429 |
| 79. | Walland | 8.3% | 5.8%(+2.53)#79 | 8.1%(+0.262)#7,435 |
| 80. | Medon | 8.3% | 5.8%(+2.53)#80 | 8.1%(+0.262)#7,447 |
| 81. | Algood | 8.3% | 5.8%(+2.49)#81 | 8.1%(+0.226)#7,511 |
| 82. | Rural Hill | 8.2% | 5.8%(+2.41)#82 | 8.1%(+0.148)#7,605 |
| 83. | Brownsville | 8.2% | 5.8%(+2.40)#83 | 8.1%(+0.136)#7,629 |
| 84. | Jellico | 8.2% | 5.8%(+2.36)#84 | 8.1%(+0.100)#7,681 |
| 85. | Winfield | 8.2% | 5.8%(+2.36)#85 | 8.1%(+0.092)#7,694 |
| 86. | Jefferson City | 8.1% | 5.8%(+2.32)#86 | 8.1%(+0.062)#7,739 |
| 87. | Knoxville | 8.1% | 5.8%(+2.31)#87 | 8.1%(+0.047)#7,764 |
| 88. | Tullahoma | 8.1% | 5.8%(+2.31)#88 | 8.1%(+0.044)#7,767 |
| 89. | Karns | 8.1% | 5.8%(+2.26)#89 | 8.1%(-0.007)#7,838 |
| 90. | Obion | 8.1% | 5.8%(+2.26)#90 | 8.1%(-0.007)#7,840 |
| 91. | Walden | 8.0% | 5.8%(+2.23)#91 | 8.1%(-0.034)#7,881 |
| 92. | Savannah | 8.0% | 5.8%(+2.22)#92 | 8.1%(-0.041)#7,886 |
| 93. | Bloomingdale | 7.9% | 5.8%(+2.13)#93 | 8.1%(-0.137)#8,047 |
| 94. | Lewisburg | 7.9% | 5.8%(+2.10)#94 | 8.1%(-0.159)#8,073 |
| 95. | Memphis | 7.9% | 5.8%(+2.06)#95 | 8.1%(-0.202)#8,149 |
| 96. | Sweetwater | 7.8% | 5.8%(+2.03)#96 | 8.1%(-0.237)#8,218 |
| 97. | Central | 7.8% | 5.8%(+1.95)#97 | 8.1%(-0.316)#8,342 |
| 98. | Red Boiling Springs | 7.7% | 5.8%(+1.88)#98 | 8.1%(-0.379)#8,427 |
| 99. | Grand Junction | 7.7% | 5.8%(+1.88)#99 | 8.1%(-0.379)#8,443 |
| 100. | Spring City | 7.6% | 5.8%(+1.82)#100 | 8.1%(-0.444)#8,558 |
Common Questions
What are the Top 10 Cities with the Highest Percentage of Population with a Degree in Social Sciences in Tennessee?
Top 10 Cities with the Highest Percentage of Population with a Degree in Social Sciences in Tennessee are:
#1
50.0%
#2
45.1%
#3
40.0%
#4
34.5%
#5
33.3%
#6
32.9%
#7
32.9%
#8
28.5%
#9
25.4%
#10
25.0%
What city has the Highest Percentage of Population with a Degree in Social Sciences in Tennessee?
Andersonville has the Highest Percentage of Population with a Degree in Social Sciences in Tennessee with 50.0%.
What is the Percentage of Population with a Degree in Social Sciences in the State of Tennessee?
Percentage of Population with a Degree in Social Sciences in Tennessee is 5.8%.
What is the Percentage of Population with a Degree in Social Sciences in the United States?
Percentage of Population with a Degree in Social Sciences in the United States is 8.1%.