Cities with the Highest Percentage of Population with a Degree in Social Sciences in Pennsylvania
RELATED REPORTS & OPTIONS
Social Sciences
Pennsylvania
Compare Cities
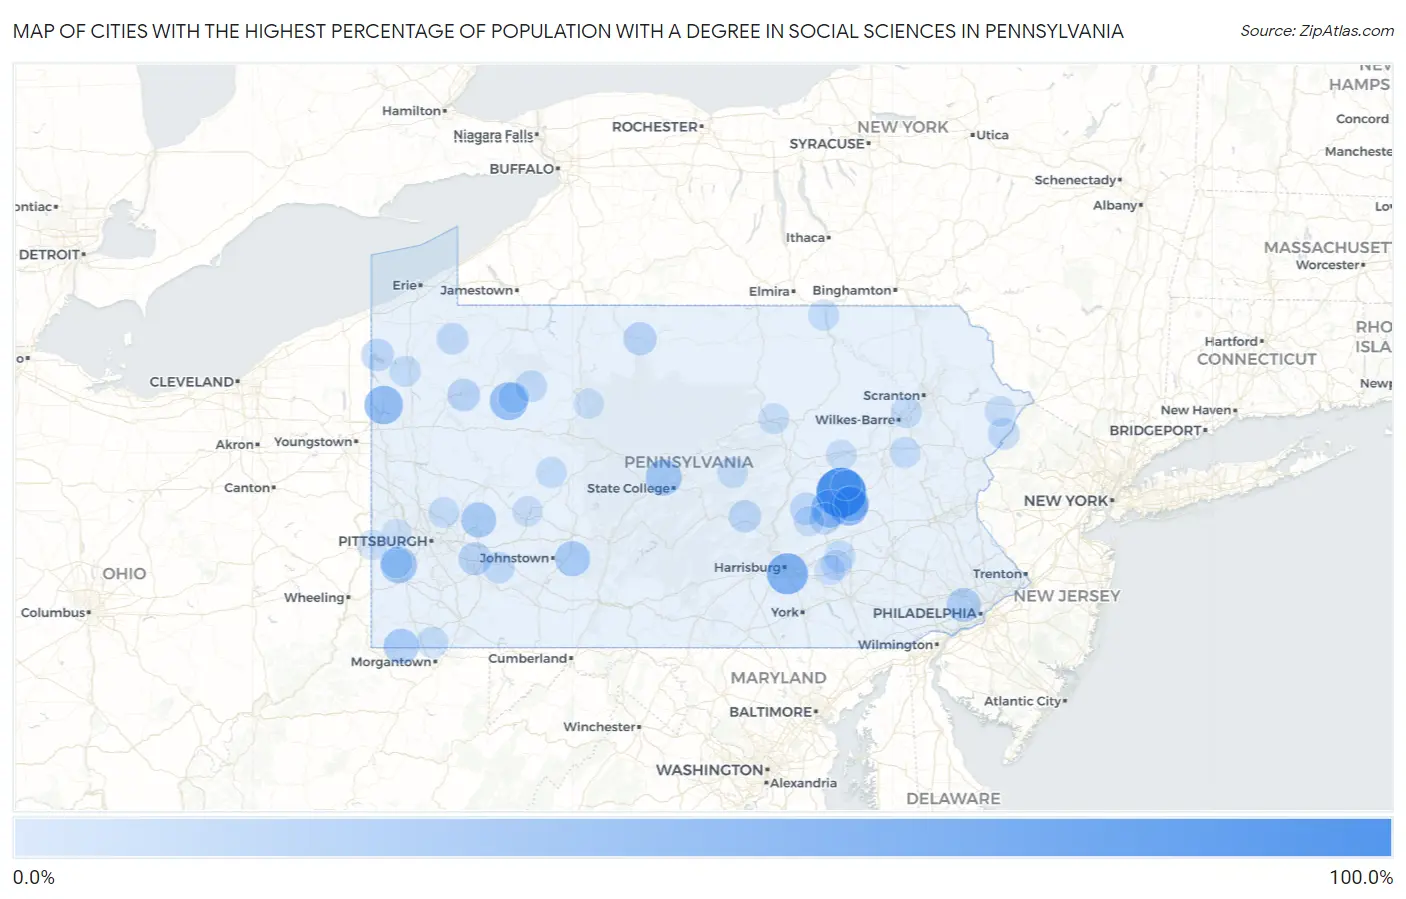
Map of Cities with the Highest Percentage of Population with a Degree in Social Sciences in Pennsylvania
0.0%
100.0%
Cities with the Highest Percentage of Population with a Degree in Social Sciences in Pennsylvania
| City | % Graduates | vs State | vs National | |
| 1. | Lavelle | 100.0% | 7.2%(+92.8)#1 | 8.1%(+91.9)#7 |
| 2. | Coaldale Borough Bedford County | 100.0% | 7.2%(+92.8)#2 | 8.1%(+91.9)#40 |
| 3. | Alverda | 69.2% | 7.2%(+62.1)#3 | 8.1%(+61.2)#84 |
| 4. | New Market | 63.9% | 7.2%(+56.7)#4 | 8.1%(+55.8)#105 |
| 5. | Branchdale | 53.8% | 7.2%(+46.7)#5 | 8.1%(+45.8)#155 |
| 6. | Reynolds Heights | 52.5% | 7.2%(+45.3)#6 | 8.1%(+44.4)#160 |
| 7. | Burnside Borough | 50.0% | 7.2%(+42.8)#7 | 8.1%(+41.9)#189 |
| 8. | East Sharpsburg | 50.0% | 7.2%(+42.8)#8 | 8.1%(+41.9)#192 |
| 9. | Leeper | 50.0% | 7.2%(+42.8)#9 | 8.1%(+41.9)#194 |
| 10. | Newburg Borough Clearfield County | 50.0% | 7.2%(+42.8)#10 | 8.1%(+41.9)#206 |
| 11. | Hegins | 49.3% | 7.2%(+42.1)#11 | 8.1%(+41.2)#220 |
| 12. | Westland | 44.4% | 7.2%(+37.3)#12 | 8.1%(+36.4)#254 |
| 13. | Julian | 42.9% | 7.2%(+35.7)#13 | 8.1%(+34.8)#267 |
| 14. | Seward Borough | 40.0% | 7.2%(+32.8)#14 | 8.1%(+31.9)#306 |
| 15. | Bald Eagle | 40.0% | 7.2%(+32.8)#15 | 8.1%(+31.9)#311 |
| 16. | Forestville | 39.3% | 7.2%(+32.1)#16 | 8.1%(+31.2)#325 |
| 17. | Sidman | 38.9% | 7.2%(+31.7)#17 | 8.1%(+30.8)#332 |
| 18. | Oklahoma | 38.2% | 7.2%(+31.1)#18 | 8.1%(+30.2)#342 |
| 19. | Brave | 38.1% | 7.2%(+30.9)#19 | 8.1%(+30.0)#345 |
| 20. | Haverford College | 34.3% | 7.2%(+27.2)#20 | 8.1%(+26.3)#413 |
| 21. | Scalp Level Borough | 33.3% | 7.2%(+26.2)#21 | 8.1%(+25.3)#426 |
| 22. | Eldorado | 31.9% | 7.2%(+24.7)#22 | 8.1%(+23.8)#477 |
| 23. | Creekside Borough | 31.2% | 7.2%(+24.1)#23 | 8.1%(+23.2)#492 |
| 24. | Dayton Borough | 30.8% | 7.2%(+23.6)#24 | 8.1%(+22.7)#504 |
| 25. | Roulette | 30.7% | 7.2%(+23.5)#25 | 8.1%(+22.6)#513 |
| 26. | Grapeville | 30.3% | 7.2%(+23.2)#26 | 8.1%(+22.3)#521 |
| 27. | Townville Borough | 30.3% | 7.2%(+23.1)#27 | 8.1%(+22.2)#523 |
| 28. | Carlisle Barracks | 29.9% | 7.2%(+22.7)#28 | 8.1%(+21.8)#549 |
| 29. | Applewold Borough | 28.9% | 7.2%(+21.8)#29 | 8.1%(+20.9)#585 |
| 30. | Woodland Heights | 28.6% | 7.2%(+21.4)#30 | 8.1%(+20.5)#597 |
| 31. | Klingerstown | 28.0% | 7.2%(+20.8)#31 | 8.1%(+19.9)#637 |
| 32. | Pymatuning North | 27.5% | 7.2%(+20.3)#32 | 8.1%(+19.4)#660 |
| 33. | Liberty Borough Tioga County | 27.3% | 7.2%(+20.1)#33 | 8.1%(+19.2)#667 |
| 34. | East Salem | 27.3% | 7.2%(+20.1)#34 | 8.1%(+19.2)#672 |
| 35. | Herndon Borough | 27.0% | 7.2%(+19.9)#35 | 8.1%(+19.0)#682 |
| 36. | Mount Holly Springs Borough | 26.6% | 7.2%(+19.5)#36 | 8.1%(+18.6)#710 |
| 37. | Tamaqua Borough | 25.4% | 7.2%(+18.3)#37 | 8.1%(+17.4)#774 |
| 38. | Finleyville Borough | 25.3% | 7.2%(+18.1)#38 | 8.1%(+17.2)#782 |
| 39. | Hostetter | 25.2% | 7.2%(+18.0)#39 | 8.1%(+17.1)#786 |
| 40. | Timblin Borough | 25.0% | 7.2%(+17.8)#40 | 8.1%(+16.9)#823 |
| 41. | Cassandra Borough | 25.0% | 7.2%(+17.8)#41 | 8.1%(+16.9)#830 |
| 42. | Riceville | 25.0% | 7.2%(+17.8)#42 | 8.1%(+16.9)#839 |
| 43. | Jacksonville Cdp Indiana County | 24.6% | 7.2%(+17.4)#43 | 8.1%(+16.5)#858 |
| 44. | Marienville | 24.3% | 7.2%(+17.2)#44 | 8.1%(+16.3)#867 |
| 45. | Pocono Mountain Lake Estates | 24.2% | 7.2%(+17.1)#45 | 8.1%(+16.1)#879 |
| 46. | Delta Borough | 24.2% | 7.2%(+17.0)#46 | 8.1%(+16.1)#882 |
| 47. | Reinerton | 24.1% | 7.2%(+16.9)#47 | 8.1%(+16.0)#889 |
| 48. | Bobtown | 23.9% | 7.2%(+16.7)#48 | 8.1%(+15.8)#901 |
| 49. | Hickory | 23.3% | 7.2%(+16.1)#49 | 8.1%(+15.2)#941 |
| 50. | Hebron | 23.1% | 7.2%(+15.9)#50 | 8.1%(+15.0)#953 |
| 51. | Cross Keys | 23.1% | 7.2%(+15.9)#51 | 8.1%(+15.0)#956 |
| 52. | Matamoras Borough | 22.8% | 7.2%(+15.6)#52 | 8.1%(+14.7)#976 |
| 53. | Sewickley Heights Borough | 22.7% | 7.2%(+15.5)#53 | 8.1%(+14.6)#987 |
| 54. | Greens Landing | 22.4% | 7.2%(+15.2)#54 | 8.1%(+14.3)#1,016 |
| 55. | Inkerman | 22.3% | 7.2%(+15.1)#55 | 8.1%(+14.2)#1,025 |
| 56. | Geneva | 22.2% | 7.2%(+15.1)#56 | 8.1%(+14.2)#1,046 |
| 57. | East Conemaugh Borough | 22.0% | 7.2%(+14.9)#57 | 8.1%(+14.0)#1,063 |
| 58. | Juniata Terrace Borough | 21.9% | 7.2%(+14.7)#58 | 8.1%(+13.8)#1,077 |
| 59. | Bairdford | 21.8% | 7.2%(+14.6)#59 | 8.1%(+13.7)#1,085 |
| 60. | Rossiter | 21.7% | 7.2%(+14.6)#60 | 8.1%(+13.7)#1,089 |
| 61. | Chapman Borough | 21.7% | 7.2%(+14.6)#61 | 8.1%(+13.7)#1,093 |
| 62. | Hickory Hills | 21.6% | 7.2%(+14.4)#62 | 8.1%(+13.5)#1,111 |
| 63. | Mifflintown Borough | 21.4% | 7.2%(+14.3)#63 | 8.1%(+13.4)#1,122 |
| 64. | Tionesta Borough | 21.4% | 7.2%(+14.3)#64 | 8.1%(+13.4)#1,127 |
| 65. | Crown | 21.4% | 7.2%(+14.3)#65 | 8.1%(+13.4)#1,131 |
| 66. | Broad Top City Borough | 21.2% | 7.2%(+14.0)#66 | 8.1%(+13.1)#1,154 |
| 67. | Faxon | 21.2% | 7.2%(+14.0)#67 | 8.1%(+13.1)#1,158 |
| 68. | Summerhill Borough | 21.1% | 7.2%(+13.9)#68 | 8.1%(+13.0)#1,169 |
| 69. | Eastvale Borough | 21.1% | 7.2%(+13.9)#69 | 8.1%(+13.0)#1,177 |
| 70. | Conashaugh Lakes | 20.7% | 7.2%(+13.5)#70 | 8.1%(+12.6)#1,220 |
| 71. | Bellwood Borough | 20.6% | 7.2%(+13.5)#71 | 8.1%(+12.6)#1,224 |
| 72. | Almedia | 20.6% | 7.2%(+13.5)#72 | 8.1%(+12.5)#1,226 |
| 73. | Woodward | 20.6% | 7.2%(+13.4)#73 | 8.1%(+12.5)#1,236 |
| 74. | North York Borough | 20.5% | 7.2%(+13.4)#74 | 8.1%(+12.5)#1,238 |
| 75. | Sadsburyville | 20.4% | 7.2%(+13.2)#75 | 8.1%(+12.3)#1,259 |
| 76. | Chevy Chase Heights | 20.3% | 7.2%(+13.2)#76 | 8.1%(+12.2)#1,264 |
| 77. | Indiana Borough | 20.3% | 7.2%(+13.1)#77 | 8.1%(+12.2)#1,265 |
| 78. | Tarentum Borough | 20.1% | 7.2%(+12.9)#78 | 8.1%(+12.0)#1,281 |
| 79. | Clintonville Borough | 20.0% | 7.2%(+12.8)#79 | 8.1%(+11.9)#1,294 |
| 80. | North Bend | 19.5% | 7.2%(+12.3)#80 | 8.1%(+11.4)#1,392 |
| 81. | Aristes | 19.4% | 7.2%(+12.3)#81 | 8.1%(+11.4)#1,404 |
| 82. | Midway Borough | 19.4% | 7.2%(+12.2)#82 | 8.1%(+11.3)#1,417 |
| 83. | Paris | 19.3% | 7.2%(+12.1)#83 | 8.1%(+11.2)#1,431 |
| 84. | Orbisonia Borough | 19.2% | 7.2%(+12.1)#84 | 8.1%(+11.2)#1,440 |
| 85. | Midland Borough | 19.1% | 7.2%(+12.0)#85 | 8.1%(+11.1)#1,451 |
| 86. | Quentin | 19.1% | 7.2%(+12.0)#86 | 8.1%(+11.1)#1,453 |
| 87. | Wiconsico | 19.0% | 7.2%(+11.9)#87 | 8.1%(+11.0)#1,467 |
| 88. | Friendsville Borough | 19.0% | 7.2%(+11.9)#88 | 8.1%(+11.0)#1,473 |
| 89. | Timber Hills | 19.0% | 7.2%(+11.9)#89 | 8.1%(+11.0)#1,475 |
| 90. | Corsica Borough | 19.0% | 7.2%(+11.8)#90 | 8.1%(+10.9)#1,482 |
| 91. | Kersey | 18.8% | 7.2%(+11.6)#91 | 8.1%(+10.7)#1,515 |
| 92. | Garrett Borough | 18.8% | 7.2%(+11.6)#92 | 8.1%(+10.7)#1,518 |
| 93. | Fayette City Borough | 18.8% | 7.2%(+11.6)#93 | 8.1%(+10.7)#1,519 |
| 94. | East Rochester Borough | 18.6% | 7.2%(+11.4)#94 | 8.1%(+10.5)#1,545 |
| 95. | Shenandoah Borough | 18.2% | 7.2%(+11.0)#95 | 8.1%(+10.1)#1,602 |
| 96. | Morrisville Borough | 18.1% | 7.2%(+11.0)#96 | 8.1%(+10.1)#1,637 |
| 97. | Clinton | 18.1% | 7.2%(+10.9)#97 | 8.1%(+10.0)#1,644 |
| 98. | Mcconnellsburg Borough | 18.1% | 7.2%(+10.9)#98 | 8.1%(+9.98)#1,650 |
| 99. | West Mayfield Borough | 18.0% | 7.2%(+10.9)#99 | 8.1%(+9.96)#1,653 |
| 100. | Thompson Borough | 17.9% | 7.2%(+10.7)#100 | 8.1%(+9.79)#1,674 |
Common Questions
What are the Top 10 Cities with the Highest Percentage of Population with a Degree in Social Sciences in Pennsylvania?
Top 10 Cities with the Highest Percentage of Population with a Degree in Social Sciences in Pennsylvania are:
#1
100.0%
#2
63.9%
#3
53.8%
#4
52.5%
#5
50.0%
#6
49.3%
#7
44.4%
#8
42.9%
#9
39.3%
#10
38.9%
What city has the Highest Percentage of Population with a Degree in Social Sciences in Pennsylvania?
Lavelle has the Highest Percentage of Population with a Degree in Social Sciences in Pennsylvania with 100.0%.
What is the Percentage of Population with a Degree in Social Sciences in the State of Pennsylvania?
Percentage of Population with a Degree in Social Sciences in Pennsylvania is 7.2%.
What is the Percentage of Population with a Degree in Social Sciences in the United States?
Percentage of Population with a Degree in Social Sciences in the United States is 8.1%.