Cities with the Highest Percentage of Population with a Degree in Social Sciences in Utah
RELATED REPORTS & OPTIONS
Social Sciences
Utah
Compare Cities
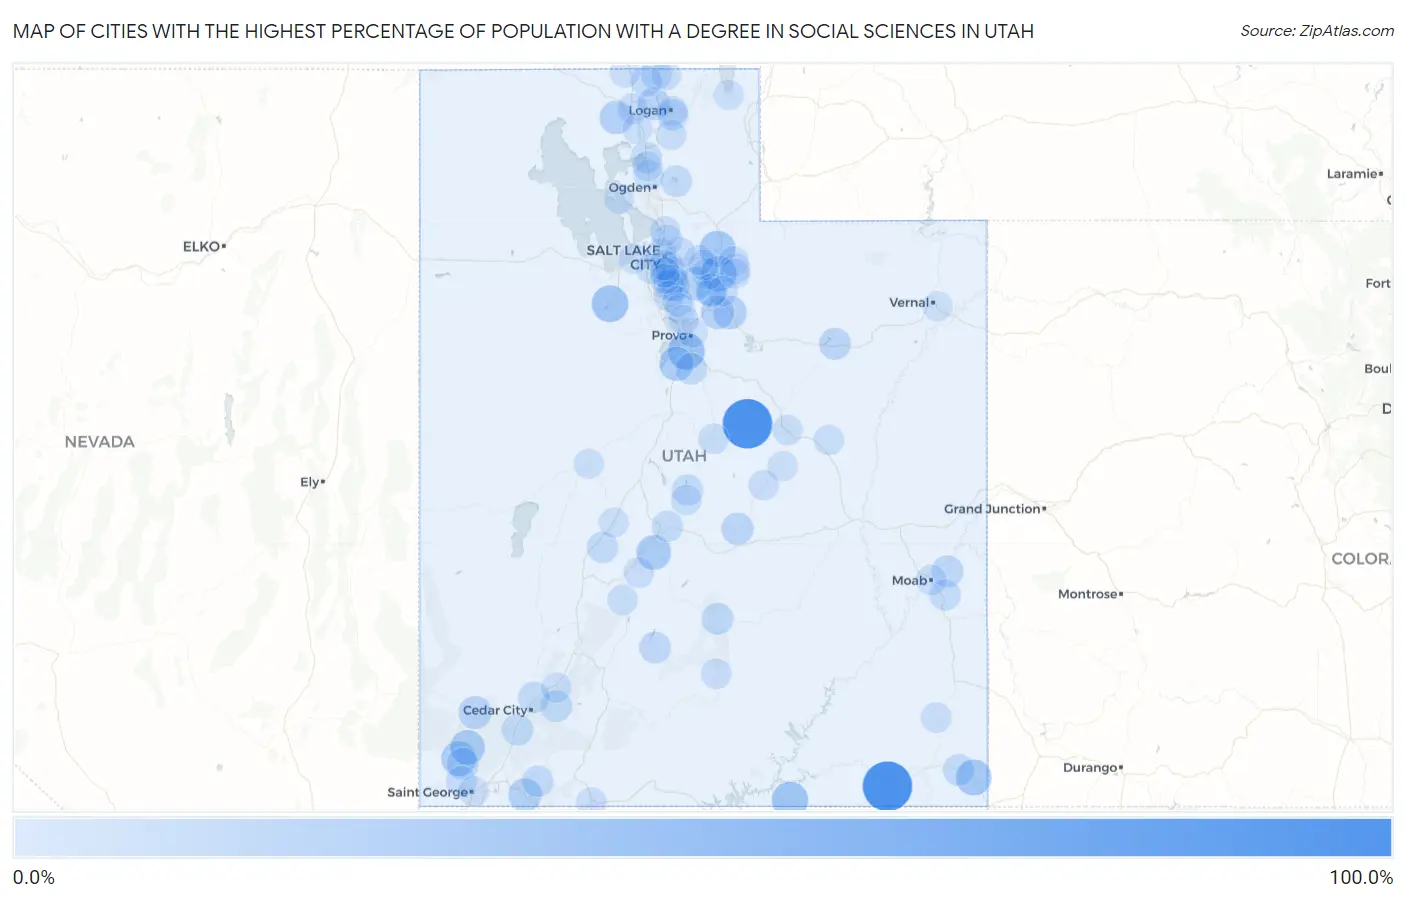
Map of Cities with the Highest Percentage of Population with a Degree in Social Sciences in Utah
0.0%
100.0%
Cities with the Highest Percentage of Population with a Degree in Social Sciences in Utah
| City | % Graduates | vs State | vs National | |
| 1. | Halchita | 100.0% | 7.4%(+92.6)#1 | 8.1%(+91.9)#18 |
| 2. | Clear Creek | 100.0% | 7.4%(+92.6)#2 | 8.1%(+91.9)#59 |
| 3. | Palmyra | 39.1% | 7.4%(+31.7)#3 | 8.1%(+31.1)#327 |
| 4. | Stockton | 37.8% | 7.4%(+30.4)#4 | 8.1%(+29.8)#350 |
| 5. | Navajo Mountain | 36.0% | 7.4%(+28.6)#5 | 8.1%(+27.9)#383 |
| 6. | Wanship | 34.1% | 7.4%(+26.7)#6 | 8.1%(+26.1)#419 |
| 7. | Aneth | 33.3% | 7.4%(+25.9)#7 | 8.1%(+25.3)#431 |
| 8. | Hideout | 32.7% | 7.4%(+25.2)#8 | 8.1%(+24.6)#463 |
| 9. | Veyo | 29.2% | 7.4%(+21.8)#9 | 8.1%(+21.2)#571 |
| 10. | Central | 28.8% | 7.4%(+21.4)#10 | 8.1%(+20.8)#589 |
| 11. | Glenwood | 28.3% | 7.4%(+20.9)#11 | 8.1%(+20.2)#621 |
| 12. | West Mountain | 26.1% | 7.4%(+18.6)#12 | 8.1%(+18.0)#741 |
| 13. | Thatcher | 22.8% | 7.4%(+15.4)#13 | 8.1%(+14.7)#975 |
| 14. | Apple Valley | 22.7% | 7.4%(+15.3)#14 | 8.1%(+14.6)#986 |
| 15. | Independence | 22.6% | 7.4%(+15.2)#15 | 8.1%(+14.5)#997 |
| 16. | Alta | 22.2% | 7.4%(+14.8)#16 | 8.1%(+14.2)#1,035 |
| 17. | East Basin | 22.0% | 7.4%(+14.6)#17 | 8.1%(+14.0)#1,062 |
| 18. | Wallsburg | 21.4% | 7.4%(+14.0)#18 | 8.1%(+13.4)#1,128 |
| 19. | Newcastle | 20.2% | 7.4%(+12.8)#19 | 8.1%(+12.1)#1,272 |
| 20. | Peter | 18.5% | 7.4%(+11.1)#20 | 8.1%(+10.4)#1,567 |
| 21. | Interlaken | 18.4% | 7.4%(+10.9)#21 | 8.1%(+10.3)#1,583 |
| 22. | Granite | 17.6% | 7.4%(+10.1)#22 | 8.1%(+9.48)#1,732 |
| 23. | Emery | 17.1% | 7.4%(+9.71)#23 | 8.1%(+9.07)#1,816 |
| 24. | Sundance | 16.7% | 7.4%(+9.24)#24 | 8.1%(+8.60)#1,965 |
| 25. | Duchesne | 16.2% | 7.4%(+8.75)#25 | 8.1%(+8.11)#2,053 |
| 26. | Dammeron Valley | 15.8% | 7.4%(+8.34)#26 | 8.1%(+7.70)#2,166 |
| 27. | Castle Valley | 15.7% | 7.4%(+8.28)#27 | 8.1%(+7.64)#2,180 |
| 28. | Hobble Creek | 15.4% | 7.4%(+7.95)#28 | 8.1%(+7.31)#2,280 |
| 29. | Torrey | 15.4% | 7.4%(+7.95)#29 | 8.1%(+7.31)#2,281 |
| 30. | Antimony | 15.0% | 7.4%(+7.57)#30 | 8.1%(+6.93)#2,410 |
| 31. | Woodland Hills | 14.0% | 7.4%(+6.56)#31 | 8.1%(+5.91)#2,766 |
| 32. | Kanarraville | 13.8% | 7.4%(+6.42)#32 | 8.1%(+5.78)#2,822 |
| 33. | Huntsville | 13.8% | 7.4%(+6.36)#33 | 8.1%(+5.72)#2,842 |
| 34. | Montezuma Creek | 13.8% | 7.4%(+6.36)#34 | 8.1%(+5.72)#2,844 |
| 35. | Springdale | 13.7% | 7.4%(+6.25)#35 | 8.1%(+5.61)#2,892 |
| 36. | Cornish | 13.6% | 7.4%(+6.21)#36 | 8.1%(+5.57)#2,917 |
| 37. | Brian Head | 13.6% | 7.4%(+6.21)#37 | 8.1%(+5.57)#2,923 |
| 38. | Kanosh | 13.3% | 7.4%(+5.90)#38 | 8.1%(+5.26)#3,062 |
| 39. | Enoch | 13.2% | 7.4%(+5.76)#39 | 8.1%(+5.11)#3,147 |
| 40. | Sterling | 13.2% | 7.4%(+5.73)#40 | 8.1%(+5.09)#3,163 |
| 41. | Salina | 12.7% | 7.4%(+5.30)#41 | 8.1%(+4.66)#3,386 |
| 42. | Willard | 12.7% | 7.4%(+5.29)#42 | 8.1%(+4.65)#3,396 |
| 43. | Providence | 12.5% | 7.4%(+5.10)#43 | 8.1%(+4.46)#3,485 |
| 44. | Spanish Valley | 12.5% | 7.4%(+5.07)#44 | 8.1%(+4.43)#3,525 |
| 45. | Millcreek | 11.8% | 7.4%(+4.37)#45 | 8.1%(+3.73)#3,930 |
| 46. | Clarkston | 11.4% | 7.4%(+3.97)#46 | 8.1%(+3.33)#4,214 |
| 47. | Park City | 11.4% | 7.4%(+3.96)#47 | 8.1%(+3.32)#4,229 |
| 48. | Holladay | 11.4% | 7.4%(+3.94)#48 | 8.1%(+3.30)#4,243 |
| 49. | White | 10.9% | 7.4%(+3.43)#49 | 8.1%(+2.78)#4,657 |
| 50. | Sandy | 10.0% | 7.4%(+2.57)#50 | 8.1%(+1.93)#5,495 |
| 51. | Salt Lake City | 10.0% | 7.4%(+2.53)#51 | 8.1%(+1.89)#5,525 |
| 52. | Mount Pleasant | 9.9% | 7.4%(+2.45)#52 | 8.1%(+1.81)#5,591 |
| 53. | Emigration Canyon | 9.6% | 7.4%(+2.14)#53 | 8.1%(+1.50)#5,921 |
| 54. | Blanding | 9.5% | 7.4%(+2.10)#54 | 8.1%(+1.46)#5,970 |
| 55. | Garland | 9.5% | 7.4%(+2.08)#55 | 8.1%(+1.44)#6,005 |
| 56. | River Heights | 9.5% | 7.4%(+2.06)#56 | 8.1%(+1.42)#6,018 |
| 57. | Ivins | 9.5% | 7.4%(+2.04)#57 | 8.1%(+1.40)#6,039 |
| 58. | Moab | 9.5% | 7.4%(+2.02)#58 | 8.1%(+1.38)#6,054 |
| 59. | Marysvale | 9.4% | 7.4%(+2.00)#59 | 8.1%(+1.36)#6,081 |
| 60. | Bountiful | 9.4% | 7.4%(+2.00)#60 | 8.1%(+1.36)#6,092 |
| 61. | Kanab | 9.3% | 7.4%(+1.91)#61 | 8.1%(+1.26)#6,197 |
| 62. | Snyderville | 9.3% | 7.4%(+1.85)#62 | 8.1%(+1.21)#6,252 |
| 63. | Monroe | 9.3% | 7.4%(+1.83)#63 | 8.1%(+1.19)#6,267 |
| 64. | Marion | 9.2% | 7.4%(+1.81)#64 | 8.1%(+1.17)#6,303 |
| 65. | Cottonwood Heights | 9.0% | 7.4%(+1.59)#65 | 8.1%(+0.949)#6,592 |
| 66. | Castle Dale | 8.9% | 7.4%(+1.51)#66 | 8.1%(+0.872)#6,668 |
| 67. | Price | 8.9% | 7.4%(+1.49)#67 | 8.1%(+0.851)#6,702 |
| 68. | Boulder | 8.9% | 7.4%(+1.44)#68 | 8.1%(+0.800)#6,762 |
| 69. | Heber | 8.8% | 7.4%(+1.33)#69 | 8.1%(+0.690)#6,890 |
| 70. | Parowan | 8.8% | 7.4%(+1.33)#70 | 8.1%(+0.688)#6,892 |
| 71. | West Valley City | 8.7% | 7.4%(+1.26)#71 | 8.1%(+0.620)#6,994 |
| 72. | South Salt Lake | 8.7% | 7.4%(+1.25)#72 | 8.1%(+0.609)#7,013 |
| 73. | Mayfield | 8.6% | 7.4%(+1.14)#73 | 8.1%(+0.500)#7,150 |
| 74. | East Carbon | 8.5% | 7.4%(+1.03)#74 | 8.1%(+0.390)#7,281 |
| 75. | Farr West | 8.4% | 7.4%(+1.000)#75 | 8.1%(+0.359)#7,320 |
| 76. | Draper | 8.4% | 7.4%(+0.963)#76 | 8.1%(+0.322)#7,348 |
| 77. | Oakley | 8.4% | 7.4%(+0.926)#77 | 8.1%(+0.285)#7,395 |
| 78. | Portage | 8.3% | 7.4%(+0.903)#78 | 8.1%(+0.262)#7,453 |
| 79. | Alpine | 8.3% | 7.4%(+0.901)#79 | 8.1%(+0.260)#7,474 |
| 80. | Midvale | 8.3% | 7.4%(+0.896)#80 | 8.1%(+0.255)#7,480 |
| 81. | Kamas | 8.2% | 7.4%(+0.733)#81 | 8.1%(+0.092)#7,691 |
| 82. | Cedar Hills | 8.0% | 7.4%(+0.596)#82 | 8.1%(-0.045)#7,898 |
| 83. | Murray | 8.0% | 7.4%(+0.588)#83 | 8.1%(-0.053)#7,910 |
| 84. | Summit Park | 8.0% | 7.4%(+0.578)#84 | 8.1%(-0.063)#7,918 |
| 85. | Cleveland | 8.0% | 7.4%(+0.570)#85 | 8.1%(-0.071)#7,943 |
| 86. | Fillmore | 8.0% | 7.4%(+0.547)#86 | 8.1%(-0.094)#7,984 |
| 87. | Delta | 8.0% | 7.4%(+0.522)#87 | 8.1%(-0.119)#8,018 |
| 88. | Provo | 7.9% | 7.4%(+0.512)#88 | 8.1%(-0.129)#8,034 |
| 89. | Midway | 7.9% | 7.4%(+0.468)#89 | 8.1%(-0.173)#8,098 |
| 90. | Bear River City | 7.9% | 7.4%(+0.464)#90 | 8.1%(-0.176)#8,110 |
| 91. | Laketown | 7.8% | 7.4%(+0.413)#91 | 8.1%(-0.228)#8,203 |
| 92. | Hooper | 7.8% | 7.4%(+0.376)#92 | 8.1%(-0.265)#8,266 |
| 93. | St George | 7.8% | 7.4%(+0.357)#93 | 8.1%(-0.284)#8,286 |
| 94. | Naples | 7.8% | 7.4%(+0.348)#94 | 8.1%(-0.293)#8,298 |
| 95. | Lindon | 7.7% | 7.4%(+0.298)#95 | 8.1%(-0.343)#8,375 |
| 96. | Paradise | 7.7% | 7.4%(+0.292)#96 | 8.1%(-0.349)#8,387 |
| 97. | Lewiston | 7.6% | 7.4%(+0.192)#97 | 8.1%(-0.449)#8,567 |
| 98. | Magna | 7.6% | 7.4%(+0.156)#98 | 8.1%(-0.485)#8,623 |
| 99. | South Willard | 7.5% | 7.4%(+0.099)#99 | 8.1%(-0.542)#8,695 |
| 100. | Centerville | 7.5% | 7.4%(+0.037)#100 | 8.1%(-0.604)#8,802 |
Common Questions
What are the Top 10 Cities with the Highest Percentage of Population with a Degree in Social Sciences in Utah?
Top 10 Cities with the Highest Percentage of Population with a Degree in Social Sciences in Utah are:
#1
100.0%
#2
100.0%
#3
39.1%
#4
37.8%
#5
36.0%
#6
34.1%
#7
33.3%
#8
32.7%
#9
29.2%
#10
28.8%
What city has the Highest Percentage of Population with a Degree in Social Sciences in Utah?
Halchita has the Highest Percentage of Population with a Degree in Social Sciences in Utah with 100.0%.
What is the Percentage of Population with a Degree in Social Sciences in the State of Utah?
Percentage of Population with a Degree in Social Sciences in Utah is 7.4%.
What is the Percentage of Population with a Degree in Social Sciences in the United States?
Percentage of Population with a Degree in Social Sciences in the United States is 8.1%.