Cities with the Highest Percentage of Population with a Degree in Social Sciences in Wisconsin
RELATED REPORTS & OPTIONS
Social Sciences
Wisconsin
Compare Cities
Map of Cities with the Highest Percentage of Population with a Degree in Social Sciences in Wisconsin
0.0%
100.0%
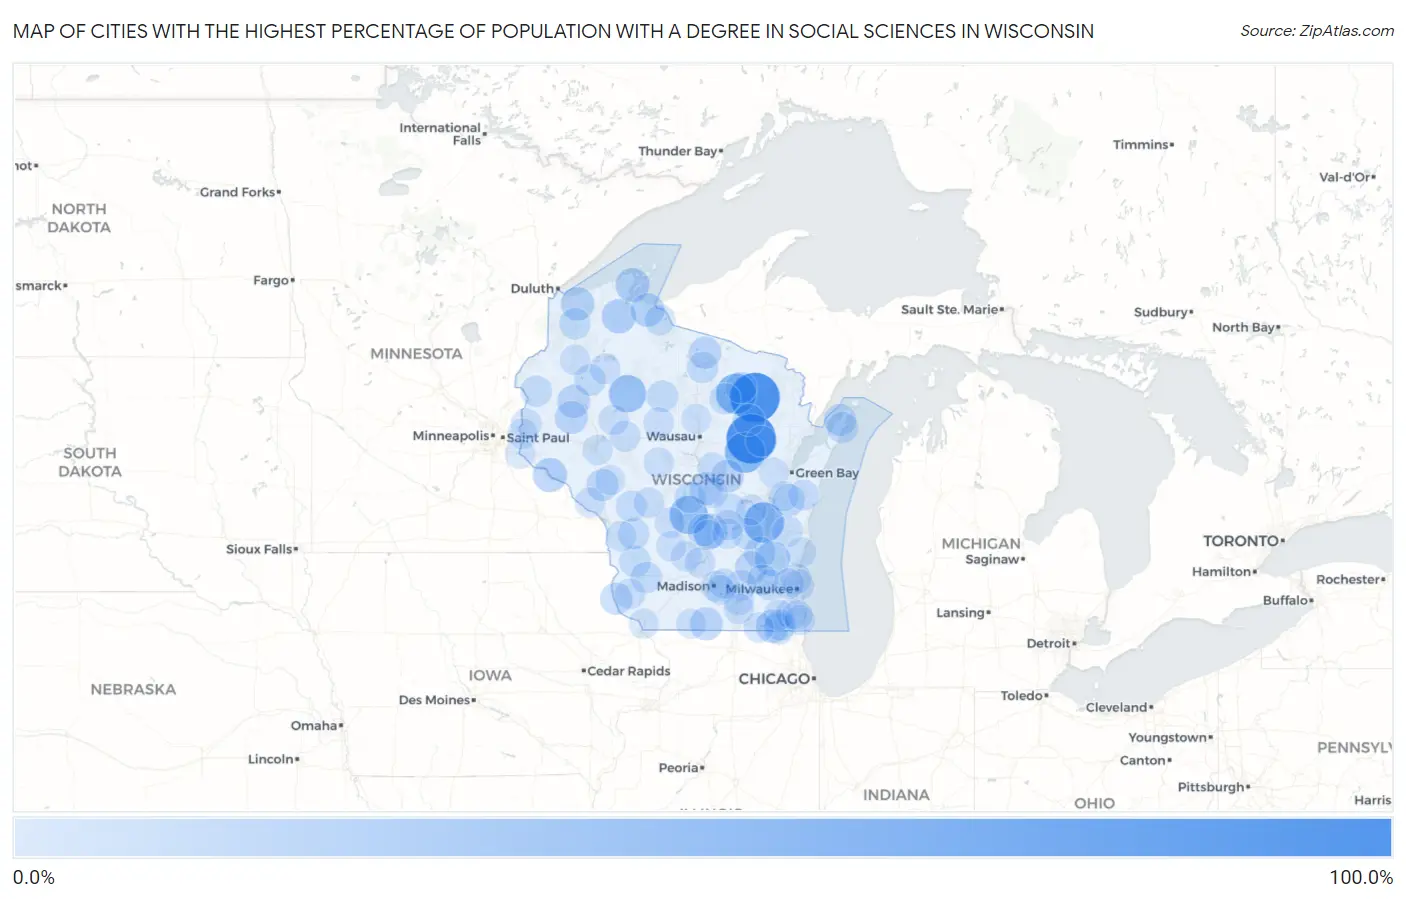
Cities with the Highest Percentage of Population with a Degree in Social Sciences in Wisconsin
| City | % Graduates | vs State | vs National | |
| 1. | Wabeno | 100.0% | 6.8% (+93.2)#1 | 8.1% (+91.9)#20 |
| 2. | Middle Village | 100.0% | 6.8% (+93.2)#2 | 8.1% (+91.9)#23 |
| 3. | Van Dyne | 57.6% | 6.8% (+50.8)#3 | 8.1% (+49.5)#127 |
| 4. | Mole Lake | 57.1% | 6.8% (+50.3)#4 | 8.1% (+49.1)#128 |
| 5. | Leopolis | 57.1% | 6.8% (+50.3)#5 | 8.1% (+49.1)#135 |
| 6. | Friendship | 47.8% | 6.8% (+41.0)#6 | 8.1% (+39.8)#226 |
| 7. | Glen Flora | 42.9% | 6.8% (+36.1)#7 | 8.1% (+34.8)#271 |
| 8. | Allenton | 31.4% | 6.8% (+24.6)#8 | 8.1% (+23.3)#486 |
| 9. | Packwaukee | 30.8% | 6.8% (+24.0)#9 | 8.1% (+22.7)#508 |
| 10. | Mason | 28.6% | 6.8% (+21.8)#10 | 8.1% (+20.5)#613 |
| 11. | Bayfield | 28.2% | 6.8% (+21.4)#11 | 8.1% (+20.1)#624 |
| 12. | Stockholm | 27.9% | 6.8% (+21.1)#12 | 8.1% (+19.8)#641 |
| 13. | Birch Hill | 26.7% | 6.8% (+19.9)#13 | 8.1% (+18.6)#704 |
| 14. | Poplar | 25.6% | 6.8% (+18.8)#14 | 8.1% (+17.5)#759 |
| 15. | Bloomfield | 24.2% | 6.8% (+17.4)#15 | 8.1% (+16.2)#874 |
| 16. | Juda | 23.1% | 6.8% (+16.3)#16 | 8.1% (+15.0)#957 |
| 17. | Barron | 22.8% | 6.8% (+16.0)#17 | 8.1% (+14.8)#972 |
| 18. | Bancroft | 22.4% | 6.8% (+15.6)#18 | 8.1% (+14.4)#1,009 |
| 19. | Ridgeland | 22.2% | 6.8% (+15.4)#19 | 8.1% (+14.2)#1,038 |
| 20. | Scandinavia | 21.9% | 6.8% (+15.1)#20 | 8.1% (+13.8)#1,078 |
| 21. | Sand Pillow | 21.1% | 6.8% (+14.3)#21 | 8.1% (+13.0)#1,174 |
| 22. | Oxford | 20.0% | 6.8% (+13.2)#22 | 8.1% (+11.9)#1,293 |
| 23. | Clyman | 20.0% | 6.8% (+13.2)#23 | 8.1% (+11.9)#1,304 |
| 24. | Brillion | 19.9% | 6.8% (+13.1)#24 | 8.1% (+11.8)#1,353 |
| 25. | Ephraim | 19.5% | 6.8% (+12.7)#25 | 8.1% (+11.5)#1,389 |
| 26. | Sayner | 19.4% | 6.8% (+12.6)#26 | 8.1% (+11.4)#1,405 |
| 27. | Bagley | 19.1% | 6.8% (+12.3)#27 | 8.1% (+11.0)#1,456 |
| 28. | Whitehall | 19.0% | 6.8% (+12.2)#28 | 8.1% (+11.0)#1,465 |
| 29. | White Lake | 18.2% | 6.8% (+11.4)#29 | 8.1% (+10.1)#1,620 |
| 30. | Kekoskee | 17.8% | 6.8% (+11.0)#30 | 8.1% (+9.72)#1,692 |
| 31. | Baileys Harbor | 16.8% | 6.8% (+10.0)#31 | 8.1% (+8.77)#1,879 |
| 32. | Soldiers Grove | 16.7% | 6.8% (+9.86)#32 | 8.1% (+8.60)#1,932 |
| 33. | Ogema | 16.7% | 6.8% (+9.86)#33 | 8.1% (+8.60)#1,947 |
| 34. | Cashton | 16.5% | 6.8% (+9.66)#34 | 8.1% (+8.39)#1,996 |
| 35. | Birchwood | 16.1% | 6.8% (+9.33)#35 | 8.1% (+8.06)#2,075 |
| 36. | Lake Tomahawk | 16.1% | 6.8% (+9.33)#36 | 8.1% (+8.06)#2,080 |
| 37. | Solon Springs | 16.1% | 6.8% (+9.27)#37 | 8.1% (+8.00)#2,088 |
| 38. | Blue River | 16.0% | 6.8% (+9.20)#38 | 8.1% (+7.93)#2,107 |
| 39. | Briggsville | 16.0% | 6.8% (+9.20)#39 | 8.1% (+7.93)#2,110 |
| 40. | Crandon | 15.9% | 6.8% (+9.14)#40 | 8.1% (+7.87)#2,122 |
| 41. | Milltown | 15.9% | 6.8% (+9.14)#41 | 8.1% (+7.87)#2,123 |
| 42. | Twin Lakes | 15.8% | 6.8% (+9.03)#42 | 8.1% (+7.76)#2,143 |
| 43. | Brandon | 15.6% | 6.8% (+8.77)#43 | 8.1% (+7.50)#2,220 |
| 44. | Lake Sherwood | 14.9% | 6.8% (+8.11)#44 | 8.1% (+6.84)#2,429 |
| 45. | Lily Lake | 14.8% | 6.8% (+7.96)#45 | 8.1% (+6.69)#2,476 |
| 46. | Nashotah | 14.3% | 6.8% (+7.48)#46 | 8.1% (+6.21)#2,625 |
| 47. | Elcho | 14.3% | 6.8% (+7.48)#47 | 8.1% (+6.21)#2,657 |
| 48. | Cataract | 14.3% | 6.8% (+7.48)#48 | 8.1% (+6.21)#2,662 |
| 49. | Redgranite | 14.1% | 6.8% (+7.26)#49 | 8.1% (+5.99)#2,740 |
| 50. | Lac La Belle | 13.9% | 6.8% (+7.10)#50 | 8.1% (+5.84)#2,802 |
| 51. | Legend Lake | 13.8% | 6.8% (+7.03)#51 | 8.1% (+5.76)#2,827 |
| 52. | Shorewood | 13.7% | 6.8% (+6.89)#52 | 8.1% (+5.62)#2,889 |
| 53. | Yorkville | 13.5% | 6.8% (+6.67)#53 | 8.1% (+5.40)#2,992 |
| 54. | Stanley | 13.4% | 6.8% (+6.57)#54 | 8.1% (+5.30)#3,036 |
| 55. | Kellnersville | 13.3% | 6.8% (+6.53)#55 | 8.1% (+5.26)#3,069 |
| 56. | Iron Belt | 13.3% | 6.8% (+6.53)#56 | 8.1% (+5.26)#3,072 |
| 57. | Greenbush | 13.3% | 6.8% (+6.53)#57 | 8.1% (+5.26)#3,076 |
| 58. | Monona | 13.2% | 6.8% (+6.39)#58 | 8.1% (+5.12)#3,137 |
| 59. | River Hills | 13.0% | 6.8% (+6.20)#59 | 8.1% (+4.93)#3,244 |
| 60. | Somerset | 13.0% | 6.8% (+6.18)#60 | 8.1% (+4.91)#3,251 |
| 61. | Omro | 13.0% | 6.8% (+6.17)#61 | 8.1% (+4.90)#3,254 |
| 62. | North Freedom | 13.0% | 6.8% (+6.16)#62 | 8.1% (+4.89)#3,266 |
| 63. | Browns Lake | 12.8% | 6.8% (+5.96)#63 | 8.1% (+4.69)#3,373 |
| 64. | Merrimac | 12.7% | 6.8% (+5.90)#64 | 8.1% (+4.63)#3,407 |
| 65. | Medford | 12.6% | 6.8% (+5.82)#65 | 8.1% (+4.55)#3,443 |
| 66. | Marquette | 12.5% | 6.8% (+5.70)#66 | 8.1% (+4.43)#3,533 |
| 67. | Dodge | 12.5% | 6.8% (+5.70)#67 | 8.1% (+4.43)#3,545 |
| 68. | Couderay | 12.5% | 6.8% (+5.70)#68 | 8.1% (+4.43)#3,562 |
| 69. | Trego | 12.5% | 6.8% (+5.70)#69 | 8.1% (+4.43)#3,564 |
| 70. | Lake Mills | 12.5% | 6.8% (+5.67)#70 | 8.1% (+4.40)#3,576 |
| 71. | Cornell | 12.4% | 6.8% (+5.61)#71 | 8.1% (+4.34)#3,595 |
| 72. | Butler | 12.4% | 6.8% (+5.55)#72 | 8.1% (+4.28)#3,633 |
| 73. | Lake Koshkonong | 12.0% | 6.8% (+5.20)#73 | 8.1% (+3.93)#3,824 |
| 74. | New Lisbon | 11.9% | 6.8% (+5.13)#74 | 8.1% (+3.86)#3,863 |
| 75. | Milton | 11.9% | 6.8% (+5.12)#75 | 8.1% (+3.85)#3,869 |
| 76. | Warrens | 11.9% | 6.8% (+5.10)#76 | 8.1% (+3.83)#3,878 |
| 77. | Somers | 11.9% | 6.8% (+5.07)#77 | 8.1% (+3.80)#3,892 |
| 78. | Princeton | 11.8% | 6.8% (+5.02)#78 | 8.1% (+3.75)#3,919 |
| 79. | Mount Hope | 11.8% | 6.8% (+4.96)#79 | 8.1% (+3.69)#3,967 |
| 80. | Polonia | 11.7% | 6.8% (+4.93)#80 | 8.1% (+3.66)#3,987 |
| 81. | Altoona | 11.7% | 6.8% (+4.89)#81 | 8.1% (+3.62)#4,011 |
| 82. | Walworth | 11.6% | 6.8% (+4.81)#82 | 8.1% (+3.54)#4,066 |
| 83. | Cottage Grove | 11.5% | 6.8% (+4.73)#83 | 8.1% (+3.46)#4,135 |
| 84. | Chili | 11.4% | 6.8% (+4.63)#84 | 8.1% (+3.36)#4,197 |
| 85. | Coon Valley | 11.3% | 6.8% (+4.52)#85 | 8.1% (+3.25)#4,278 |
| 86. | Almond | 11.3% | 6.8% (+4.52)#86 | 8.1% (+3.25)#4,280 |
| 87. | Kieler | 11.3% | 6.8% (+4.47)#87 | 8.1% (+3.20)#4,307 |
| 88. | North Hudson | 11.2% | 6.8% (+4.41)#88 | 8.1% (+3.15)#4,351 |
| 89. | Seymour | 11.1% | 6.8% (+4.31)#89 | 8.1% (+3.04)#4,412 |
| 90. | Endeavor | 11.1% | 6.8% (+4.31)#90 | 8.1% (+3.04)#4,435 |
| 91. | La Valle | 11.1% | 6.8% (+4.31)#91 | 8.1% (+3.04)#4,452 |
| 92. | Browntown | 11.1% | 6.8% (+4.31)#92 | 8.1% (+3.04)#4,461 |
| 93. | Clarks Mills | 11.1% | 6.8% (+4.31)#93 | 8.1% (+3.04)#4,470 |
| 94. | Belgium | 11.1% | 6.8% (+4.29)#94 | 8.1% (+3.02)#4,492 |
| 95. | Mcfarland | 11.0% | 6.8% (+4.24)#95 | 8.1% (+2.97)#4,526 |
| 96. | Prescott | 11.0% | 6.8% (+4.15)#96 | 8.1% (+2.88)#4,591 |
| 97. | Pigeon Falls | 10.8% | 6.8% (+3.97)#97 | 8.1% (+2.70)#4,731 |
| 98. | Forest Junction | 10.7% | 6.8% (+3.91)#98 | 8.1% (+2.64)#4,790 |
| 99. | Merrill | 10.6% | 6.8% (+3.79)#99 | 8.1% (+2.52)#4,900 |
| 100. | Sturtevant | 10.6% | 6.8% (+3.76)#100 | 8.1% (+2.49)#4,925 |
Common Questions
What are the Top 10 Cities with the Highest Percentage of Population with a Degree in Social Sciences in Wisconsin?
Top 10 Cities with the Highest Percentage of Population with a Degree in Social Sciences in Wisconsin are:
#1
100.0%
#2
100.0%
#3
57.6%
#4
57.1%
#5
57.1%
#6
47.8%
#7
42.9%
#8
31.4%
#9
30.8%
#10
28.6%
What city has the Highest Percentage of Population with a Degree in Social Sciences in Wisconsin?
Wabeno has the Highest Percentage of Population with a Degree in Social Sciences in Wisconsin with 100.0%.
What is the Percentage of Population with a Degree in Social Sciences in the State of Wisconsin?
Percentage of Population with a Degree in Social Sciences in Wisconsin is 6.8%.
What is the Percentage of Population with a Degree in Social Sciences in the United States?
Percentage of Population with a Degree in Social Sciences in the United States is 8.1%.