Cities with the Highest Percentage of Population with a Degree in Social Sciences in Kansas
RELATED REPORTS & OPTIONS
Social Sciences
Kansas
Compare Cities
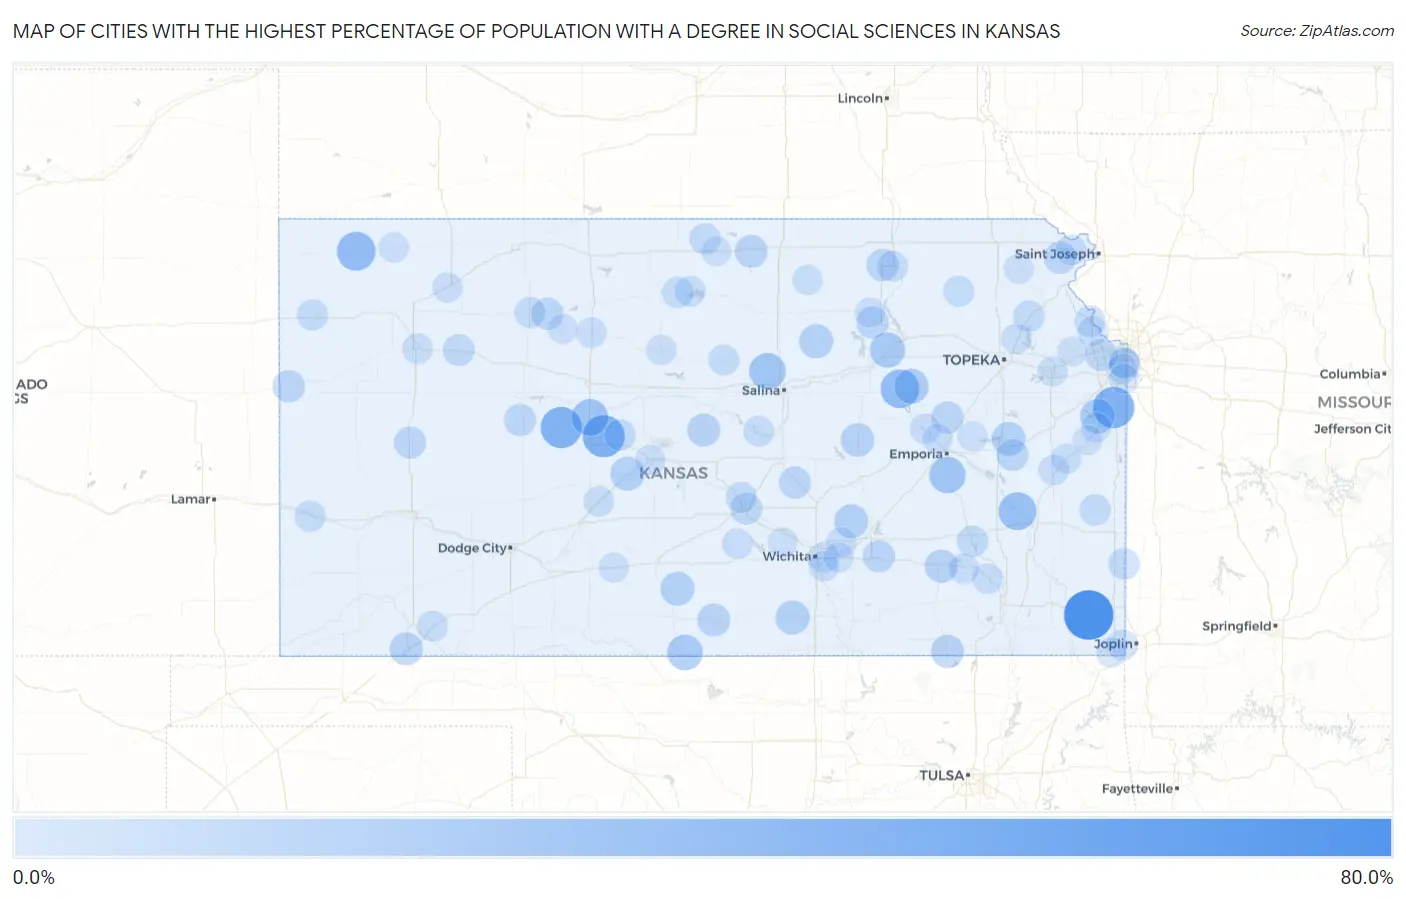
Map of Cities with the Highest Percentage of Population with a Degree in Social Sciences in Kansas
0.0%
80.0%
Cities with the Highest Percentage of Population with a Degree in Social Sciences in Kansas
| City | % Graduates | vs State | vs National | |
| 1. | West Mineral | 75.0% | 5.6%(+69.4)#1 | 8.1%(+66.9)#74 |
| 2. | Croweburg | 64.7% | 5.6%(+59.1)#2 | 8.1%(+56.6)#103 |
| 3. | Bison | 48.0% | 5.6%(+42.4)#3 | 8.1%(+39.9)#224 |
| 4. | Mccracken | 45.5% | 5.6%(+39.9)#4 | 8.1%(+37.4)#244 |
| 5. | Bucyrus | 45.5% | 5.6%(+39.9)#5 | 8.1%(+37.4)#245 |
| 6. | Mcdonald | 36.4% | 5.6%(+30.8)#6 | 8.1%(+28.3)#376 |
| 7. | Dwight | 36.0% | 5.6%(+30.4)#7 | 8.1%(+27.9)#384 |
| 8. | Neosho Falls | 33.3% | 5.6%(+27.8)#8 | 8.1%(+25.3)#436 |
| 9. | Liebenthal | 29.4% | 5.6%(+23.8)#9 | 8.1%(+21.3)#568 |
| 10. | Culver | 28.6% | 5.6%(+23.0)#10 | 8.1%(+20.5)#614 |
| 11. | Olpe | 28.4% | 5.6%(+22.8)#11 | 8.1%(+20.3)#619 |
| 12. | Kiowa | 24.8% | 5.6%(+19.3)#12 | 8.1%(+16.8)#847 |
| 13. | Ogden | 24.2% | 5.6%(+18.6)#13 | 8.1%(+16.1)#880 |
| 14. | Alta Vista | 22.5% | 5.6%(+16.9)#14 | 8.1%(+14.4)#1,004 |
| 15. | Hillsdale | 22.5% | 5.6%(+16.9)#15 | 8.1%(+14.4)#1,006 |
| 16. | Pawnee Rock | 20.0% | 5.6%(+14.4)#16 | 8.1%(+11.9)#1,308 |
| 17. | Isabel | 20.0% | 5.6%(+14.4)#17 | 8.1%(+11.9)#1,332 |
| 18. | Mayfield | 20.0% | 5.6%(+14.4)#18 | 8.1%(+11.9)#1,336 |
| 19. | Longford | 20.0% | 5.6%(+14.4)#19 | 8.1%(+11.9)#1,340 |
| 20. | Potwin | 19.7% | 5.6%(+14.2)#20 | 8.1%(+11.7)#1,366 |
| 21. | Melvern | 19.6% | 5.6%(+14.0)#21 | 8.1%(+11.5)#1,383 |
| 22. | Lincolnville | 18.2% | 5.6%(+12.6)#22 | 8.1%(+10.1)#1,624 |
| 23. | Liberal | 16.8% | 5.6%(+11.3)#23 | 8.1%(+8.77)#1,881 |
| 24. | Severy | 16.7% | 5.6%(+11.1)#24 | 8.1%(+8.60)#1,951 |
| 25. | Lorraine | 16.7% | 5.6%(+11.1)#25 | 8.1%(+8.60)#1,952 |
| 26. | Chautauqua | 16.7% | 5.6%(+11.1)#26 | 8.1%(+8.60)#1,963 |
| 27. | Attica | 16.2% | 5.6%(+10.6)#27 | 8.1%(+8.11)#2,054 |
| 28. | Courtland | 16.1% | 5.6%(+10.6)#28 | 8.1%(+8.06)#2,079 |
| 29. | Bendena | 14.7% | 5.6%(+9.14)#29 | 8.1%(+6.63)#2,496 |
| 30. | Riley | 14.6% | 5.6%(+8.99)#30 | 8.1%(+6.49)#2,545 |
| 31. | Waterville | 14.5% | 5.6%(+8.89)#31 | 8.1%(+6.39)#2,576 |
| 32. | Allen | 14.3% | 5.6%(+8.72)#32 | 8.1%(+6.21)#2,650 |
| 33. | Weskan | 14.3% | 5.6%(+8.72)#33 | 8.1%(+6.21)#2,669 |
| 34. | Leon | 14.1% | 5.6%(+8.49)#34 | 8.1%(+5.99)#2,744 |
| 35. | Ransom | 14.0% | 5.6%(+8.38)#35 | 8.1%(+5.88)#2,778 |
| 36. | Edwardsville | 13.7% | 5.6%(+8.13)#36 | 8.1%(+5.63)#2,882 |
| 37. | Scott City | 13.7% | 5.6%(+8.11)#37 | 8.1%(+5.61)#2,894 |
| 38. | Bogue | 13.6% | 5.6%(+8.07)#38 | 8.1%(+5.57)#2,922 |
| 39. | Moundridge | 13.6% | 5.6%(+8.03)#39 | 8.1%(+5.52)#2,934 |
| 40. | Waverly | 13.2% | 5.6%(+7.67)#40 | 8.1%(+5.16)#3,121 |
| 41. | South Hutchinson | 12.9% | 5.6%(+7.30)#41 | 8.1%(+4.80)#3,310 |
| 42. | Grainfield | 12.5% | 5.6%(+6.93)#42 | 8.1%(+4.43)#3,543 |
| 43. | Valley Falls | 12.0% | 5.6%(+6.47)#43 | 8.1%(+3.97)#3,801 |
| 44. | Otis | 11.8% | 5.6%(+6.20)#44 | 8.1%(+3.69)#3,960 |
| 45. | Arcadia | 11.8% | 5.6%(+6.20)#45 | 8.1%(+3.69)#3,963 |
| 46. | Toronto | 11.8% | 5.6%(+6.20)#46 | 8.1%(+3.69)#3,969 |
| 47. | Mapleton | 11.1% | 5.6%(+5.54)#47 | 8.1%(+3.04)#4,459 |
| 48. | Burr Oak | 11.1% | 5.6%(+5.54)#48 | 8.1%(+3.04)#4,471 |
| 49. | Downs | 10.9% | 5.6%(+5.33)#49 | 8.1%(+2.83)#4,628 |
| 50. | Syracuse | 10.8% | 5.6%(+5.24)#50 | 8.1%(+2.74)#4,685 |
| 51. | Willowbrook | 10.8% | 5.6%(+5.24)#51 | 8.1%(+2.74)#4,698 |
| 52. | Goodland | 10.7% | 5.6%(+5.10)#52 | 8.1%(+2.59)#4,835 |
| 53. | Leavenworth | 10.6% | 5.6%(+5.05)#53 | 8.1%(+2.55)#4,874 |
| 54. | Mission Hills | 10.5% | 5.6%(+4.89)#54 | 8.1%(+2.39)#5,021 |
| 55. | Havensville | 10.3% | 5.6%(+4.69)#55 | 8.1%(+2.19)#5,215 |
| 56. | Hill City | 10.2% | 5.6%(+4.67)#56 | 8.1%(+2.17)#5,235 |
| 57. | Lincoln Center | 9.9% | 5.6%(+4.30)#57 | 8.1%(+1.80)#5,606 |
| 58. | Blue Rapids | 9.8% | 5.6%(+4.21)#58 | 8.1%(+1.70)#5,698 |
| 59. | Kismet | 9.6% | 5.6%(+4.07)#59 | 8.1%(+1.57)#5,845 |
| 60. | Marquette | 9.6% | 5.6%(+4.02)#60 | 8.1%(+1.52)#5,904 |
| 61. | Cawker City | 9.4% | 5.6%(+3.87)#61 | 8.1%(+1.36)#6,082 |
| 62. | Fairway | 9.4% | 5.6%(+3.83)#62 | 8.1%(+1.33)#6,128 |
| 63. | Oakley | 9.4% | 5.6%(+3.80)#63 | 8.1%(+1.30)#6,167 |
| 64. | Pretty Prairie | 9.2% | 5.6%(+3.63)#64 | 8.1%(+1.13)#6,346 |
| 65. | Troy | 9.1% | 5.6%(+3.52)#65 | 8.1%(+1.02)#6,481 |
| 66. | Garfield | 9.1% | 5.6%(+3.52)#66 | 8.1%(+1.02)#6,514 |
| 67. | Galena | 9.1% | 5.6%(+3.50)#67 | 8.1%(+0.996)#6,543 |
| 68. | Garnett | 8.7% | 5.6%(+3.18)#68 | 8.1%(+0.679)#6,899 |
| 69. | Fredonia | 8.7% | 5.6%(+3.16)#69 | 8.1%(+0.654)#6,933 |
| 70. | Plainville | 8.6% | 5.6%(+3.05)#70 | 8.1%(+0.550)#7,074 |
| 71. | Fall River | 8.6% | 5.6%(+3.00)#71 | 8.1%(+0.500)#7,151 |
| 72. | Eastborough | 8.5% | 5.6%(+2.91)#72 | 8.1%(+0.403)#7,261 |
| 73. | Benton | 8.3% | 5.6%(+2.76)#73 | 8.1%(+0.262)#7,421 |
| 74. | Luray | 8.3% | 5.6%(+2.76)#74 | 8.1%(+0.262)#7,460 |
| 75. | Dunlap | 8.3% | 5.6%(+2.76)#75 | 8.1%(+0.262)#7,472 |
| 76. | Lansing | 7.9% | 5.6%(+2.36)#76 | 8.1%(-0.143)#8,051 |
| 77. | Greeley | 7.9% | 5.6%(+2.33)#77 | 8.1%(-0.176)#8,115 |
| 78. | Clyde | 7.9% | 5.6%(+2.31)#78 | 8.1%(-0.197)#8,142 |
| 79. | Meriden | 7.8% | 5.6%(+2.27)#79 | 8.1%(-0.228)#8,201 |
| 80. | Selden | 7.8% | 5.6%(+2.27)#80 | 8.1%(-0.228)#8,205 |
| 81. | Lawrence | 7.8% | 5.6%(+2.22)#81 | 8.1%(-0.282)#8,284 |
| 82. | Mcconnell Afb | 7.8% | 5.6%(+2.21)#82 | 8.1%(-0.290)#8,292 |
| 83. | Americus | 7.7% | 5.6%(+2.12)#83 | 8.1%(-0.379)#8,430 |
| 84. | Great Bend | 7.7% | 5.6%(+2.12)#84 | 8.1%(-0.385)#8,480 |
| 85. | Greeley County Unified Government (Balance) | 7.6% | 5.6%(+2.03)#85 | 8.1%(-0.476)#8,610 |
| 86. | Prairie Village | 7.5% | 5.6%(+1.95)#86 | 8.1%(-0.549)#8,707 |
| 87. | Paola | 7.5% | 5.6%(+1.94)#87 | 8.1%(-0.558)#8,723 |
| 88. | Tonganoxie | 7.5% | 5.6%(+1.90)#88 | 8.1%(-0.602)#8,799 |
| 89. | Baxter Springs | 7.4% | 5.6%(+1.87)#89 | 8.1%(-0.631)#8,839 |
| 90. | Horton | 7.4% | 5.6%(+1.86)#90 | 8.1%(-0.639)#8,847 |
| 91. | Palco | 7.4% | 5.6%(+1.84)#91 | 8.1%(-0.664)#8,901 |
| 92. | Haviland | 7.3% | 5.6%(+1.75)#92 | 8.1%(-0.754)#9,032 |
| 93. | Andover | 7.3% | 5.6%(+1.71)#93 | 8.1%(-0.790)#9,084 |
| 94. | Atwood | 7.2% | 5.6%(+1.66)#94 | 8.1%(-0.842)#9,181 |
| 95. | Mankato | 7.2% | 5.6%(+1.63)#95 | 8.1%(-0.877)#9,240 |
| 96. | Leonardville | 7.1% | 5.6%(+1.57)#96 | 8.1%(-0.928)#9,309 |
| 97. | Reading | 7.1% | 5.6%(+1.57)#97 | 8.1%(-0.928)#9,335 |
| 98. | Leawood | 7.1% | 5.6%(+1.50)#98 | 8.1%(-1.00)#9,449 |
| 99. | Andale | 7.0% | 5.6%(+1.47)#99 | 8.1%(-1.03)#9,490 |
| 100. | Osawatomie | 7.0% | 5.6%(+1.42)#100 | 8.1%(-1.08)#9,579 |
Common Questions
What are the Top 10 Cities with the Highest Percentage of Population with a Degree in Social Sciences in Kansas?
Top 10 Cities with the Highest Percentage of Population with a Degree in Social Sciences in Kansas are:
#1
75.0%
#2
48.0%
#3
45.5%
#4
45.5%
#5
36.4%
#6
36.0%
#7
33.3%
#8
29.4%
#9
28.6%
#10
28.4%
What city has the Highest Percentage of Population with a Degree in Social Sciences in Kansas?
West Mineral has the Highest Percentage of Population with a Degree in Social Sciences in Kansas with 75.0%.
What is the Percentage of Population with a Degree in Social Sciences in the State of Kansas?
Percentage of Population with a Degree in Social Sciences in Kansas is 5.6%.
What is the Percentage of Population with a Degree in Social Sciences in the United States?
Percentage of Population with a Degree in Social Sciences in the United States is 8.1%.