Cities with the Highest Percentage of Population with a Degree in Social Sciences in South Carolina
RELATED REPORTS & OPTIONS
Social Sciences
South Carolina
Compare Cities
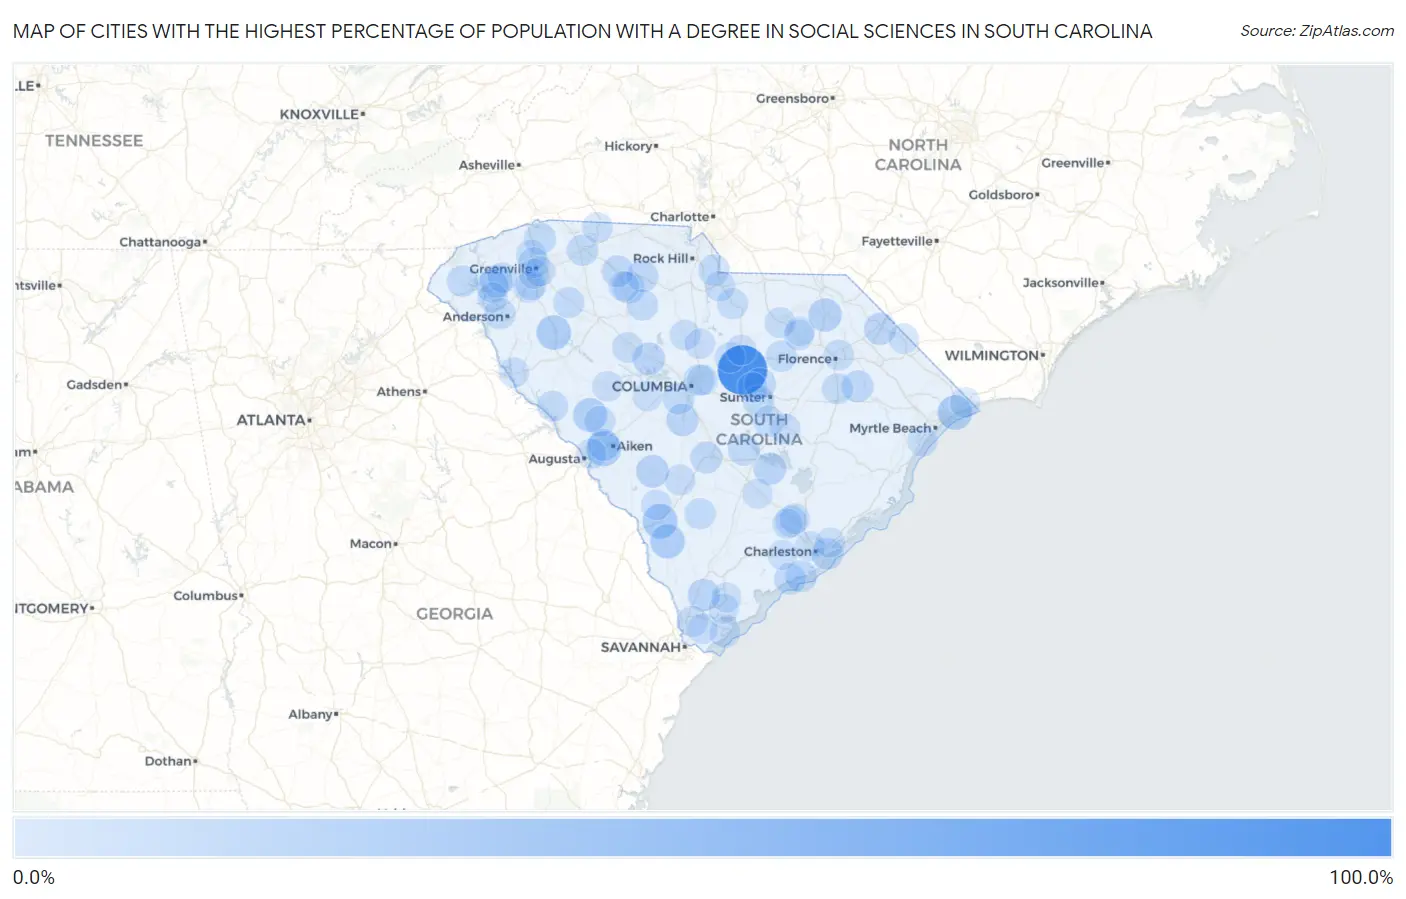
Map of Cities with the Highest Percentage of Population with a Degree in Social Sciences in South Carolina
0.0%
100.0%
Cities with the Highest Percentage of Population with a Degree in Social Sciences in South Carolina
| City | % Graduates | vs State | vs National | |
| 1. | Boykin | 100.0% | 6.8%(+93.2)#1 | 8.1%(+91.9)#34 |
| 2. | Browntown | 100.0% | 6.8%(+93.2)#2 | 8.1%(+91.9)#38 |
| 3. | Daufuskie Island | 51.5% | 6.8%(+44.7)#3 | 8.1%(+43.4)#166 |
| 4. | Green Sea | 50.0% | 6.8%(+43.2)#4 | 8.1%(+41.9)#204 |
| 5. | Warrenville | 29.5% | 6.8%(+22.8)#5 | 8.1%(+21.5)#560 |
| 6. | Allendale | 29.4% | 6.8%(+22.7)#6 | 8.1%(+21.4)#562 |
| 7. | Atlantic Beach | 28.1% | 6.8%(+21.4)#7 | 8.1%(+20.1)#628 |
| 8. | Ware Shoals | 28.0% | 6.8%(+21.2)#8 | 8.1%(+19.9)#633 |
| 9. | Gifford | 27.3% | 6.8%(+20.5)#9 | 8.1%(+19.2)#668 |
| 10. | Edgefield | 25.4% | 6.8%(+18.6)#10 | 8.1%(+17.3)#775 |
| 11. | Dacusville | 24.0% | 6.8%(+17.2)#11 | 8.1%(+15.9)#894 |
| 12. | Beech Island | 22.6% | 6.8%(+15.9)#12 | 8.1%(+14.5)#992 |
| 13. | Society Hill | 22.4% | 6.8%(+15.7)#13 | 8.1%(+14.4)#1,012 |
| 14. | Elko | 20.0% | 6.8%(+13.2)#14 | 8.1%(+11.9)#1,318 |
| 15. | Norris | 19.1% | 6.8%(+12.4)#15 | 8.1%(+11.0)#1,455 |
| 16. | Little Mountain | 18.7% | 6.8%(+11.9)#16 | 8.1%(+10.6)#1,529 |
| 17. | Ridgeland | 18.6% | 6.8%(+11.8)#17 | 8.1%(+10.5)#1,549 |
| 18. | Central | 18.4% | 6.8%(+11.6)#18 | 8.1%(+10.3)#1,580 |
| 19. | Eutawville | 18.2% | 6.8%(+11.4)#19 | 8.1%(+10.1)#1,617 |
| 20. | Swansea | 17.9% | 6.8%(+11.1)#20 | 8.1%(+9.79)#1,668 |
| 21. | Dillon | 17.5% | 6.8%(+10.7)#21 | 8.1%(+9.39)#1,749 |
| 22. | Baxter | 17.0% | 6.8%(+10.2)#22 | 8.1%(+8.91)#1,847 |
| 23. | Edisto | 16.3% | 6.8%(+9.54)#23 | 8.1%(+8.22)#2,027 |
| 24. | Monarch Mill | 16.2% | 6.8%(+9.47)#24 | 8.1%(+8.15)#2,043 |
| 25. | Lockhart | 15.8% | 6.8%(+9.04)#25 | 8.1%(+7.72)#2,157 |
| 26. | Pamplico | 15.7% | 6.8%(+8.94)#26 | 8.1%(+7.62)#2,186 |
| 27. | Graniteville | 15.5% | 6.8%(+8.72)#27 | 8.1%(+7.40)#2,245 |
| 28. | Hilltop | 15.5% | 6.8%(+8.71)#28 | 8.1%(+7.39)#2,248 |
| 29. | Jonesville | 15.4% | 6.8%(+8.63)#29 | 8.1%(+7.31)#2,271 |
| 30. | Sullivan S Island | 15.3% | 6.8%(+8.56)#30 | 8.1%(+7.24)#2,304 |
| 31. | Tigerville | 15.2% | 6.8%(+8.40)#31 | 8.1%(+7.08)#2,348 |
| 32. | Kiawah Island | 15.1% | 6.8%(+8.34)#32 | 8.1%(+7.02)#2,371 |
| 33. | Cane Savannah | 15.1% | 6.8%(+8.33)#33 | 8.1%(+7.01)#2,374 |
| 34. | Seabrook Island | 15.0% | 6.8%(+8.28)#34 | 8.1%(+6.96)#2,386 |
| 35. | South Congaree | 14.9% | 6.8%(+8.19)#35 | 8.1%(+6.87)#2,420 |
| 36. | Dalzell | 14.5% | 6.8%(+7.73)#36 | 8.1%(+6.41)#2,566 |
| 37. | Elloree | 14.3% | 6.8%(+7.53)#37 | 8.1%(+6.21)#2,630 |
| 38. | Lincolnville | 14.3% | 6.8%(+7.53)#38 | 8.1%(+6.21)#2,636 |
| 39. | West Union | 14.3% | 6.8%(+7.53)#39 | 8.1%(+6.21)#2,643 |
| 40. | Hamer | 14.0% | 6.8%(+7.20)#40 | 8.1%(+5.88)#2,775 |
| 41. | Southern Shops | 13.9% | 6.8%(+7.17)#41 | 8.1%(+5.85)#2,790 |
| 42. | Centerville | 13.6% | 6.8%(+6.82)#42 | 8.1%(+5.50)#2,947 |
| 43. | Olympia | 13.5% | 6.8%(+6.76)#43 | 8.1%(+5.44)#2,969 |
| 44. | Paxville | 13.5% | 6.8%(+6.76)#44 | 8.1%(+5.44)#2,972 |
| 45. | Forest Acres | 13.3% | 6.8%(+6.56)#45 | 8.1%(+5.24)#3,085 |
| 46. | Bishopville | 12.8% | 6.8%(+6.08)#46 | 8.1%(+4.76)#3,331 |
| 47. | Van Wyck | 12.8% | 6.8%(+6.07)#47 | 8.1%(+4.75)#3,337 |
| 48. | Carlisle | 12.8% | 6.8%(+6.07)#48 | 8.1%(+4.75)#3,341 |
| 49. | Pimlico | 12.5% | 6.8%(+5.75)#49 | 8.1%(+4.43)#3,508 |
| 50. | Coward | 12.5% | 6.8%(+5.75)#50 | 8.1%(+4.43)#3,524 |
| 51. | Lodge | 12.5% | 6.8%(+5.75)#51 | 8.1%(+4.43)#3,554 |
| 52. | Gray Court | 12.2% | 6.8%(+5.49)#52 | 8.1%(+4.17)#3,690 |
| 53. | Plum Branch | 12.2% | 6.8%(+5.44)#53 | 8.1%(+4.12)#3,720 |
| 54. | Hardeeville | 11.9% | 6.8%(+5.11)#54 | 8.1%(+3.79)#3,900 |
| 55. | Heath Springs | 11.7% | 6.8%(+4.90)#55 | 8.1%(+3.58)#4,039 |
| 56. | Mcbee | 11.5% | 6.8%(+4.76)#56 | 8.1%(+3.44)#4,145 |
| 57. | Trenton | 11.4% | 6.8%(+4.68)#57 | 8.1%(+3.36)#4,198 |
| 58. | Denmark | 11.4% | 6.8%(+4.66)#58 | 8.1%(+3.34)#4,213 |
| 59. | Hilton Head Island | 11.4% | 6.8%(+4.63)#59 | 8.1%(+3.31)#4,236 |
| 60. | The Cliffs Valley | 11.3% | 6.8%(+4.55)#60 | 8.1%(+3.23)#4,285 |
| 61. | Piedmont | 11.2% | 6.8%(+4.45)#61 | 8.1%(+3.13)#4,363 |
| 62. | Lugoff | 10.9% | 6.8%(+4.13)#62 | 8.1%(+2.81)#4,641 |
| 63. | Travelers Rest | 10.8% | 6.8%(+4.02)#63 | 8.1%(+2.70)#4,722 |
| 64. | Lancaster | 10.7% | 6.8%(+3.99)#64 | 8.1%(+2.67)#4,756 |
| 65. | Quinby | 10.7% | 6.8%(+3.96)#65 | 8.1%(+2.64)#4,788 |
| 66. | Golden Grove | 10.7% | 6.8%(+3.94)#66 | 8.1%(+2.62)#4,816 |
| 67. | Newberry | 10.7% | 6.8%(+3.92)#67 | 8.1%(+2.60)#4,828 |
| 68. | Winnsboro | 10.6% | 6.8%(+3.86)#68 | 8.1%(+2.54)#4,889 |
| 69. | Kline | 10.5% | 6.8%(+3.78)#69 | 8.1%(+2.46)#4,977 |
| 70. | Manning | 10.4% | 6.8%(+3.69)#70 | 8.1%(+2.37)#5,037 |
| 71. | Sans Souci | 10.4% | 6.8%(+3.64)#71 | 8.1%(+2.32)#5,082 |
| 72. | Saluda | 10.3% | 6.8%(+3.59)#72 | 8.1%(+2.27)#5,121 |
| 73. | Chesnee | 10.3% | 6.8%(+3.51)#73 | 8.1%(+2.19)#5,211 |
| 74. | Columbia | 10.2% | 6.8%(+3.46)#74 | 8.1%(+2.14)#5,258 |
| 75. | Union | 10.0% | 6.8%(+3.28)#75 | 8.1%(+1.96)#5,409 |
| 76. | Camden | 10.0% | 6.8%(+3.26)#76 | 8.1%(+1.94)#5,425 |
| 77. | Ridgeway | 10.0% | 6.8%(+3.25)#77 | 8.1%(+1.93)#5,467 |
| 78. | Sangaree | 9.9% | 6.8%(+3.15)#78 | 8.1%(+1.83)#5,582 |
| 79. | Clearwater | 9.8% | 6.8%(+3.05)#79 | 8.1%(+1.73)#5,669 |
| 80. | Calhoun Falls | 9.8% | 6.8%(+3.00)#80 | 8.1%(+1.68)#5,714 |
| 81. | Hartsville | 9.7% | 6.8%(+2.97)#81 | 8.1%(+1.65)#5,755 |
| 82. | Lake View | 9.4% | 6.8%(+2.62)#82 | 8.1%(+1.30)#6,154 |
| 83. | Bluffton | 9.4% | 6.8%(+2.60)#83 | 8.1%(+1.28)#6,176 |
| 84. | Garden City | 9.3% | 6.8%(+2.55)#84 | 8.1%(+1.23)#6,242 |
| 85. | Oakland | 9.3% | 6.8%(+2.50)#85 | 8.1%(+1.18)#6,289 |
| 86. | Summerville | 9.2% | 6.8%(+2.42)#86 | 8.1%(+1.10)#6,394 |
| 87. | Dunean | 9.1% | 6.8%(+2.37)#87 | 8.1%(+1.05)#6,448 |
| 88. | Liberty | 9.1% | 6.8%(+2.32)#88 | 8.1%(+0.996)#6,542 |
| 89. | Little River | 9.0% | 6.8%(+2.26)#89 | 8.1%(+0.937)#6,605 |
| 90. | Port Royal | 9.0% | 6.8%(+2.21)#90 | 8.1%(+0.891)#6,655 |
| 91. | Beaufort | 8.9% | 6.8%(+2.19)#91 | 8.1%(+0.871)#6,670 |
| 92. | Summit | 8.8% | 6.8%(+2.02)#92 | 8.1%(+0.701)#6,877 |
| 93. | Harleyville | 8.7% | 6.8%(+2.00)#93 | 8.1%(+0.679)#6,901 |
| 94. | Charleston | 8.7% | 6.8%(+1.96)#94 | 8.1%(+0.641)#6,949 |
| 95. | Pendleton | 8.7% | 6.8%(+1.93)#95 | 8.1%(+0.609)#7,011 |
| 96. | Mount Pleasant | 8.7% | 6.8%(+1.92)#96 | 8.1%(+0.597)#7,023 |
| 97. | Fripp Island | 8.5% | 6.8%(+1.78)#97 | 8.1%(+0.458)#7,198 |
| 98. | Greenville | 8.4% | 6.8%(+1.66)#98 | 8.1%(+0.340)#7,335 |
| 99. | Hollywood | 8.3% | 6.8%(+1.56)#99 | 8.1%(+0.242)#7,494 |
| 100. | North Hartsville | 8.3% | 6.8%(+1.55)#100 | 8.1%(+0.228)#7,508 |
Common Questions
What are the Top 10 Cities with the Highest Percentage of Population with a Degree in Social Sciences in South Carolina?
Top 10 Cities with the Highest Percentage of Population with a Degree in Social Sciences in South Carolina are:
#1
100.0%
#2
29.5%
#3
29.4%
#4
28.1%
#5
28.0%
#6
27.3%
#7
25.4%
#8
22.4%
#9
20.0%
#10
19.1%
What city has the Highest Percentage of Population with a Degree in Social Sciences in South Carolina?
Boykin has the Highest Percentage of Population with a Degree in Social Sciences in South Carolina with 100.0%.
What is the Percentage of Population with a Degree in Social Sciences in the State of South Carolina?
Percentage of Population with a Degree in Social Sciences in South Carolina is 6.8%.
What is the Percentage of Population with a Degree in Social Sciences in the United States?
Percentage of Population with a Degree in Social Sciences in the United States is 8.1%.