Cities with the Highest Percentage of Population with a Degree in Social Sciences in Illinois
RELATED REPORTS & OPTIONS
Social Sciences
Illinois
Compare Cities
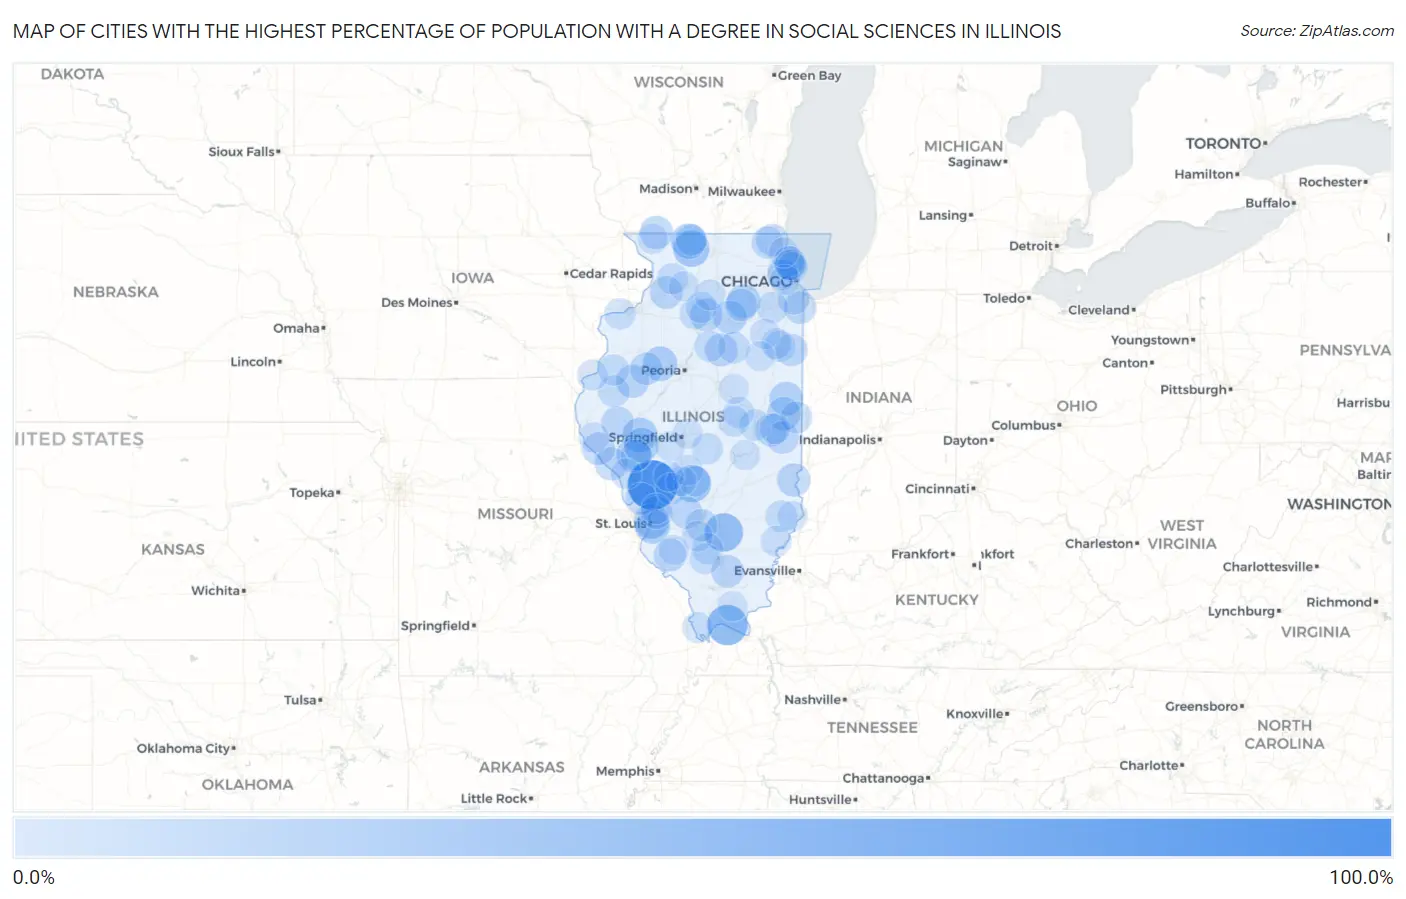
Map of Cities with the Highest Percentage of Population with a Degree in Social Sciences in Illinois
0.0%
100.0%
Cities with the Highest Percentage of Population with a Degree in Social Sciences in Illinois
| City | % Graduates | vs State | vs National | |
| 1. | Serena | 100.0% | 7.8%(+92.2)#1 | 8.1%(+91.9)#21 |
| 2. | Fidelity | 100.0% | 7.8%(+92.2)#2 | 8.1%(+91.9)#43 |
| 3. | Lake | 100.0% | 7.8%(+92.2)#3 | 8.1%(+91.9)#54 |
| 4. | Lynn Center | 100.0% | 7.8%(+92.2)#4 | 8.1%(+91.9)#60 |
| 5. | Joppa | 58.3% | 7.8%(+50.5)#5 | 8.1%(+50.3)#123 |
| 6. | Kell | 50.0% | 7.8%(+42.2)#6 | 8.1%(+41.9)#187 |
| 7. | Schram City | 44.2% | 7.8%(+36.4)#7 | 8.1%(+36.2)#255 |
| 8. | Ridott | 40.0% | 7.8%(+32.2)#8 | 8.1%(+31.9)#314 |
| 9. | Dakota | 35.7% | 7.8%(+27.9)#9 | 8.1%(+27.6)#389 |
| 10. | Brooklyn | 34.6% | 7.8%(+26.8)#10 | 8.1%(+26.6)#408 |
| 11. | Sauget | 33.3% | 7.8%(+25.5)#11 | 8.1%(+25.3)#434 |
| 12. | Concord | 33.3% | 7.8%(+25.5)#12 | 8.1%(+25.3)#435 |
| 13. | Glasgow | 33.3% | 7.8%(+25.5)#13 | 8.1%(+25.3)#439 |
| 14. | Lynnville | 33.3% | 7.8%(+25.5)#14 | 8.1%(+25.3)#442 |
| 15. | Unity | 33.3% | 7.8%(+25.5)#15 | 8.1%(+25.3)#455 |
| 16. | Yates City | 32.9% | 7.8%(+25.1)#16 | 8.1%(+24.8)#462 |
| 17. | Alexander | 31.2% | 7.8%(+23.5)#17 | 8.1%(+23.2)#493 |
| 18. | Potomac | 29.4% | 7.8%(+21.6)#18 | 8.1%(+21.3)#564 |
| 19. | Millbrook | 29.2% | 7.8%(+21.4)#19 | 8.1%(+21.1)#576 |
| 20. | Muncie | 27.8% | 7.8%(+20.0)#20 | 8.1%(+19.7)#647 |
| 21. | Apple River | 27.3% | 7.8%(+19.5)#21 | 8.1%(+19.2)#665 |
| 22. | West Union | 27.3% | 7.8%(+19.5)#22 | 8.1%(+19.2)#669 |
| 23. | Dayton | 26.8% | 7.8%(+19.0)#23 | 8.1%(+18.7)#694 |
| 24. | Bushnell | 26.4% | 7.8%(+18.6)#24 | 8.1%(+18.4)#718 |
| 25. | Cherry | 25.6% | 7.8%(+17.8)#25 | 8.1%(+17.6)#758 |
| 26. | Pleasant Hill | 25.6% | 7.8%(+17.8)#26 | 8.1%(+17.5)#765 |
| 27. | Lyndon | 25.5% | 7.8%(+17.7)#27 | 8.1%(+17.4)#769 |
| 28. | Baldwin | 25.0% | 7.8%(+17.2)#28 | 8.1%(+16.9)#796 |
| 29. | Hanaford | 25.0% | 7.8%(+17.2)#29 | 8.1%(+16.9)#799 |
| 30. | New Canton | 25.0% | 7.8%(+17.2)#30 | 8.1%(+16.9)#810 |
| 31. | Dana | 25.0% | 7.8%(+17.2)#31 | 8.1%(+16.9)#820 |
| 32. | Longview | 25.0% | 7.8%(+17.2)#32 | 8.1%(+16.9)#836 |
| 33. | Mitchell | 24.5% | 7.8%(+16.7)#33 | 8.1%(+16.4)#860 |
| 34. | Lynwood | 24.0% | 7.8%(+16.3)#34 | 8.1%(+16.0)#890 |
| 35. | London Mills | 23.8% | 7.8%(+16.0)#35 | 8.1%(+15.7)#904 |
| 36. | Hume | 23.6% | 7.8%(+15.8)#36 | 8.1%(+15.6)#916 |
| 37. | Papineau | 23.5% | 7.8%(+15.7)#37 | 8.1%(+15.5)#925 |
| 38. | Millington | 23.4% | 7.8%(+15.6)#38 | 8.1%(+15.3)#935 |
| 39. | Pierron | 23.3% | 7.8%(+15.5)#39 | 8.1%(+15.3)#939 |
| 40. | Mount Sterling | 23.0% | 7.8%(+15.2)#40 | 8.1%(+14.9)#964 |
| 41. | Venetian Village | 22.8% | 7.8%(+15.0)#41 | 8.1%(+14.7)#978 |
| 42. | Elsah | 22.4% | 7.8%(+14.7)#42 | 8.1%(+14.4)#1,011 |
| 43. | Winnetka | 22.4% | 7.8%(+14.6)#43 | 8.1%(+14.4)#1,014 |
| 44. | Huey | 22.2% | 7.8%(+14.4)#44 | 8.1%(+14.2)#1,045 |
| 45. | Long Lake | 21.8% | 7.8%(+14.0)#45 | 8.1%(+13.8)#1,081 |
| 46. | Belgium | 21.1% | 7.8%(+13.3)#46 | 8.1%(+13.0)#1,172 |
| 47. | Kenilworth | 21.0% | 7.8%(+13.2)#47 | 8.1%(+12.9)#1,188 |
| 48. | Sumner | 20.3% | 7.8%(+12.5)#48 | 8.1%(+12.2)#1,270 |
| 49. | Dixmoor | 20.0% | 7.8%(+12.2)#49 | 8.1%(+11.9)#1,286 |
| 50. | Cornell | 20.0% | 7.8%(+12.2)#50 | 8.1%(+11.9)#1,299 |
| 51. | Mount Clare | 20.0% | 7.8%(+12.2)#51 | 8.1%(+11.9)#1,307 |
| 52. | Tennessee | 20.0% | 7.8%(+12.2)#52 | 8.1%(+11.9)#1,331 |
| 53. | Sadorus | 18.9% | 7.8%(+11.1)#53 | 8.1%(+10.8)#1,489 |
| 54. | Chebanse | 18.6% | 7.8%(+10.8)#54 | 8.1%(+10.5)#1,541 |
| 55. | Andalusia | 18.5% | 7.8%(+10.7)#55 | 8.1%(+10.4)#1,561 |
| 56. | Rock City | 18.5% | 7.8%(+10.7)#56 | 8.1%(+10.4)#1,564 |
| 57. | Ingalls Park | 18.5% | 7.8%(+10.7)#57 | 8.1%(+10.4)#1,573 |
| 58. | Toluca | 18.2% | 7.8%(+10.4)#58 | 8.1%(+10.1)#1,607 |
| 59. | De Land | 18.2% | 7.8%(+10.4)#59 | 8.1%(+10.1)#1,616 |
| 60. | Coleta | 18.2% | 7.8%(+10.4)#60 | 8.1%(+10.1)#1,622 |
| 61. | Raritan | 18.2% | 7.8%(+10.4)#61 | 8.1%(+10.1)#1,628 |
| 62. | Radom | 18.2% | 7.8%(+10.4)#62 | 8.1%(+10.1)#1,629 |
| 63. | Dover | 18.2% | 7.8%(+10.4)#63 | 8.1%(+10.1)#1,631 |
| 64. | Stonington | 17.9% | 7.8%(+10.1)#64 | 8.1%(+9.85)#1,661 |
| 65. | Cisco | 17.9% | 7.8%(+10.1)#65 | 8.1%(+9.79)#1,675 |
| 66. | La Moille | 17.6% | 7.8%(+9.85)#66 | 8.1%(+9.58)#1,711 |
| 67. | Alsey | 17.4% | 7.8%(+9.59)#67 | 8.1%(+9.32)#1,766 |
| 68. | Tamaroa | 17.1% | 7.8%(+9.35)#68 | 8.1%(+9.07)#1,814 |
| 69. | Olive Branch | 16.7% | 7.8%(+8.87)#69 | 8.1%(+8.60)#1,931 |
| 70. | Kampsville | 16.7% | 7.8%(+8.87)#70 | 8.1%(+8.60)#1,944 |
| 71. | Browns | 16.7% | 7.8%(+8.87)#71 | 8.1%(+8.60)#1,945 |
| 72. | Harvel | 16.7% | 7.8%(+8.87)#72 | 8.1%(+8.60)#1,948 |
| 73. | West Brooklyn | 16.7% | 7.8%(+8.87)#73 | 8.1%(+8.60)#1,953 |
| 74. | Pontoosuc | 16.7% | 7.8%(+8.87)#74 | 8.1%(+8.60)#1,957 |
| 75. | Irwin | 16.7% | 7.8%(+8.87)#75 | 8.1%(+8.60)#1,966 |
| 76. | Rosemont | 16.1% | 7.8%(+8.34)#76 | 8.1%(+8.06)#2,068 |
| 77. | Broadlands | 16.1% | 7.8%(+8.33)#77 | 8.1%(+8.06)#2,077 |
| 78. | Schiller Park | 16.0% | 7.8%(+8.25)#78 | 8.1%(+7.97)#2,096 |
| 79. | New Minden | 16.0% | 7.8%(+8.20)#79 | 8.1%(+7.93)#2,112 |
| 80. | Glencoe | 15.6% | 7.8%(+7.85)#80 | 8.1%(+7.57)#2,196 |
| 81. | Apple Canyon Lake | 15.5% | 7.8%(+7.68)#81 | 8.1%(+7.41)#2,242 |
| 82. | Hartford | 15.4% | 7.8%(+7.59)#82 | 8.1%(+7.31)#2,268 |
| 83. | Essex | 15.3% | 7.8%(+7.53)#83 | 8.1%(+7.26)#2,301 |
| 84. | Plainville | 15.0% | 7.8%(+7.20)#84 | 8.1%(+6.93)#2,403 |
| 85. | Evanston | 14.8% | 7.8%(+7.04)#85 | 8.1%(+6.76)#2,456 |
| 86. | Lawrenceville | 14.7% | 7.8%(+6.94)#86 | 8.1%(+6.66)#2,482 |
| 87. | Irving | 14.7% | 7.8%(+6.91)#87 | 8.1%(+6.63)#2,494 |
| 88. | River Forest | 14.6% | 7.8%(+6.83)#88 | 8.1%(+6.55)#2,527 |
| 89. | Wilmette | 14.5% | 7.8%(+6.67)#89 | 8.1%(+6.39)#2,569 |
| 90. | Loami | 14.4% | 7.8%(+6.65)#90 | 8.1%(+6.37)#2,580 |
| 91. | Litchfield | 14.4% | 7.8%(+6.63)#91 | 8.1%(+6.35)#2,590 |
| 92. | Carlinville | 14.4% | 7.8%(+6.58)#92 | 8.1%(+6.31)#2,600 |
| 93. | Ellsworth | 14.3% | 7.8%(+6.49)#93 | 8.1%(+6.21)#2,655 |
| 94. | Nelson | 14.3% | 7.8%(+6.49)#94 | 8.1%(+6.21)#2,667 |
| 95. | Allenville | 14.3% | 7.8%(+6.49)#95 | 8.1%(+6.21)#2,675 |
| 96. | Simpson | 14.3% | 7.8%(+6.49)#96 | 8.1%(+6.21)#2,679 |
| 97. | Lake Forest | 14.1% | 7.8%(+6.33)#97 | 8.1%(+6.06)#2,715 |
| 98. | Riverton | 14.1% | 7.8%(+6.33)#98 | 8.1%(+6.05)#2,716 |
| 99. | Cullom | 14.0% | 7.8%(+6.20)#99 | 8.1%(+5.93)#2,765 |
| 100. | Marissa | 14.0% | 7.8%(+6.17)#100 | 8.1%(+5.90)#2,769 |
Common Questions
What are the Top 10 Cities with the Highest Percentage of Population with a Degree in Social Sciences in Illinois?
Top 10 Cities with the Highest Percentage of Population with a Degree in Social Sciences in Illinois are:
What city has the Highest Percentage of Population with a Degree in Social Sciences in Illinois?
Fidelity has the Highest Percentage of Population with a Degree in Social Sciences in Illinois with 100.0%.
What is the Percentage of Population with a Degree in Social Sciences in the State of Illinois?
Percentage of Population with a Degree in Social Sciences in Illinois is 7.8%.
What is the Percentage of Population with a Degree in Social Sciences in the United States?
Percentage of Population with a Degree in Social Sciences in the United States is 8.1%.