Cities with the Highest Percentage of Population with a Degree in Social Sciences in Massachusetts
RELATED REPORTS & OPTIONS
Social Sciences
Massachusetts
Compare Cities
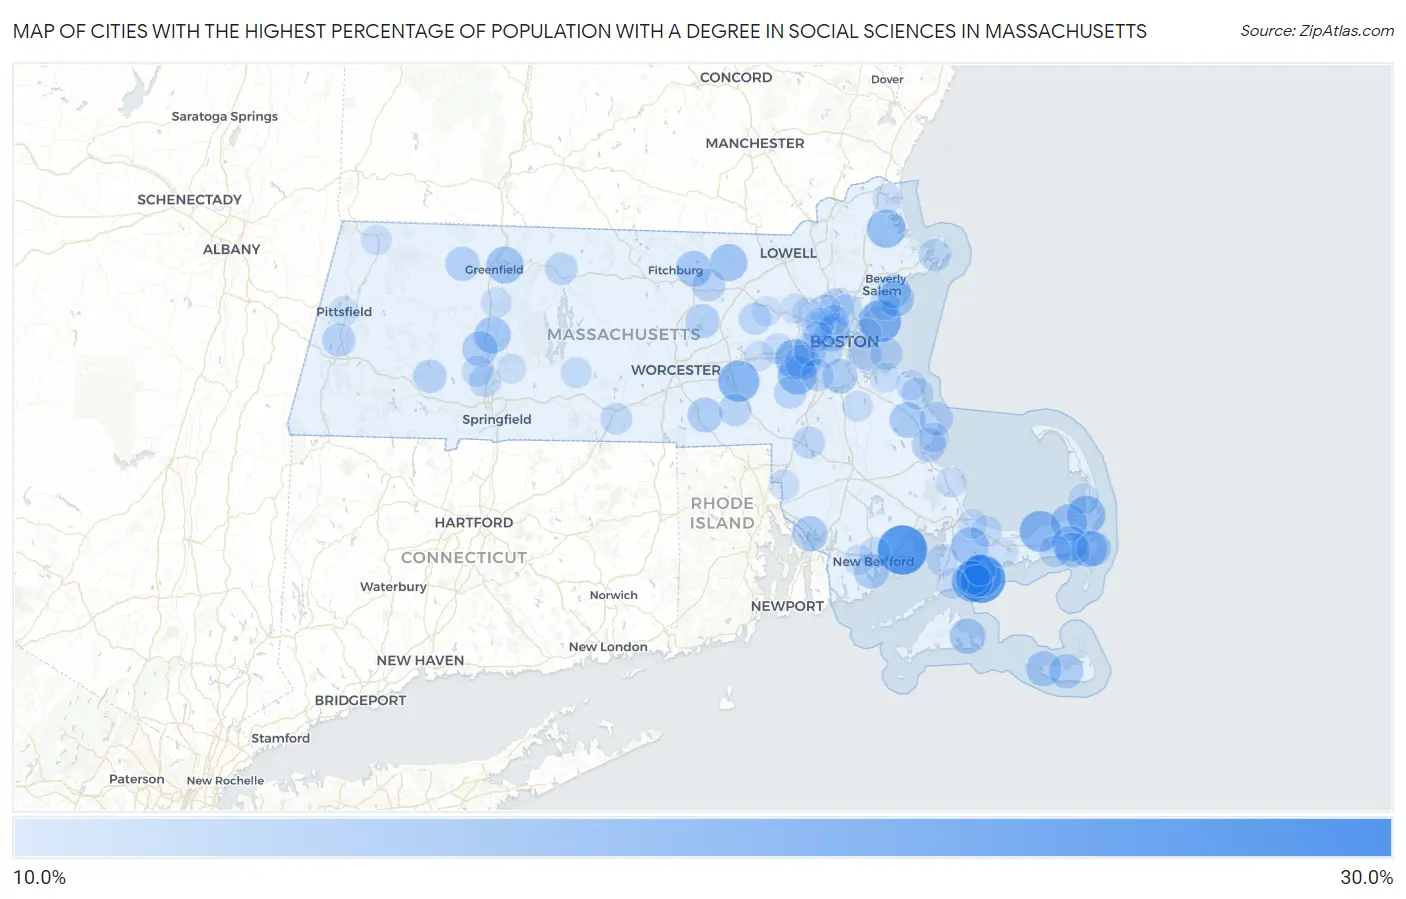
Map of Cities with the Highest Percentage of Population with a Degree in Social Sciences in Massachusetts
0.0%
30.0%
Cities with the Highest Percentage of Population with a Degree in Social Sciences in Massachusetts
| City | % Graduates | vs State | vs National | |
| 1. | Green Harbor | 29.7% | 10.2%(+19.5)#1 | 8.1%(+21.6)#552 |
| 2. | Mattapoisett Center | 27.8% | 10.2%(+17.6)#2 | 8.1%(+19.7)#644 |
| 3. | Popponesset | 26.7% | 10.2%(+16.5)#3 | 8.1%(+18.6)#703 |
| 4. | Nahant | 21.2% | 10.2%(+11.0)#4 | 8.1%(+13.2)#1,153 |
| 5. | Monomoscoy Island | 20.5% | 10.2%(+10.2)#5 | 8.1%(+12.4)#1,249 |
| 6. | Popponesset Island | 20.4% | 10.2%(+10.2)#6 | 8.1%(+12.3)#1,252 |
| 7. | Hopkinton | 20.3% | 10.2%(+10.1)#7 | 8.1%(+12.3)#1,263 |
| 8. | Dennis | 20.0% | 10.2%(+9.74)#8 | 8.1%(+11.9)#1,349 |
| 9. | Wellesley | 18.7% | 10.2%(+8.44)#9 | 8.1%(+10.6)#1,536 |
| 10. | Dover | 18.3% | 10.2%(+8.07)#10 | 8.1%(+10.2)#1,593 |
| 11. | Orleans | 17.9% | 10.2%(+7.65)#11 | 8.1%(+9.79)#1,667 |
| 12. | Rowley | 17.8% | 10.2%(+7.62)#12 | 8.1%(+9.76)#1,680 |
| 13. | Forestdale | 17.3% | 10.2%(+7.12)#13 | 8.1%(+9.26)#1,779 |
| 14. | West Warren | 17.2% | 10.2%(+6.99)#14 | 8.1%(+9.13)#1,800 |
| 15. | Groton | 16.8% | 10.2%(+6.55)#15 | 8.1%(+8.69)#1,894 |
| 16. | Turners Falls | 16.7% | 10.2%(+6.52)#16 | 8.1%(+8.66)#1,902 |
| 17. | West Chatham | 16.5% | 10.2%(+6.34)#17 | 8.1%(+8.48)#1,986 |
| 18. | Brewster | 16.3% | 10.2%(+6.04)#18 | 8.1%(+8.18)#2,035 |
| 19. | Hatfield | 16.1% | 10.2%(+5.93)#19 | 8.1%(+8.07)#2,066 |
| 20. | Harwich Center | 15.8% | 10.2%(+5.57)#20 | 8.1%(+7.71)#2,165 |
| 21. | Lunenburg | 15.5% | 10.2%(+5.33)#21 | 8.1%(+7.47)#2,226 |
| 22. | Edgartown | 15.5% | 10.2%(+5.25)#22 | 8.1%(+7.39)#2,247 |
| 23. | Marblehead | 15.4% | 10.2%(+5.21)#23 | 8.1%(+7.35)#2,258 |
| 24. | North Pembroke | 15.4% | 10.2%(+5.16)#24 | 8.1%(+7.30)#2,294 |
| 25. | Needham | 15.3% | 10.2%(+5.08)#25 | 8.1%(+7.22)#2,312 |
| 26. | Madaket | 15.1% | 10.2%(+4.93)#26 | 8.1%(+7.07)#2,355 |
| 27. | Northampton | 15.1% | 10.2%(+4.91)#27 | 8.1%(+7.05)#2,359 |
| 28. | Ocean Grove | 15.1% | 10.2%(+4.89)#28 | 8.1%(+7.03)#2,363 |
| 29. | Harwich Port | 15.0% | 10.2%(+4.75)#29 | 8.1%(+6.89)#2,415 |
| 30. | Cambridge | 14.9% | 10.2%(+4.65)#30 | 8.1%(+6.80)#2,444 |
| 31. | Bliss Corner | 14.8% | 10.2%(+4.61)#31 | 8.1%(+6.75)#2,459 |
| 32. | Whitinsville | 14.8% | 10.2%(+4.57)#32 | 8.1%(+6.71)#2,473 |
| 33. | Chatham | 14.7% | 10.2%(+4.52)#33 | 8.1%(+6.66)#2,483 |
| 34. | Milton | 14.7% | 10.2%(+4.52)#34 | 8.1%(+6.66)#2,486 |
| 35. | Nantucket | 14.5% | 10.2%(+4.24)#35 | 8.1%(+6.38)#2,577 |
| 36. | Shelburne Falls | 14.2% | 10.2%(+4.03)#36 | 8.1%(+6.17)#2,686 |
| 37. | Seabrook | 14.0% | 10.2%(+3.81)#37 | 8.1%(+5.95)#2,755 |
| 38. | Salem | 14.0% | 10.2%(+3.80)#38 | 8.1%(+5.94)#2,759 |
| 39. | Clinton | 14.0% | 10.2%(+3.79)#39 | 8.1%(+5.93)#2,763 |
| 40. | South Duxbury | 13.8% | 10.2%(+3.60)#40 | 8.1%(+5.74)#2,836 |
| 41. | Ocean Bluff Brant Rock | 13.6% | 10.2%(+3.38)#41 | 8.1%(+5.52)#2,938 |
| 42. | Huntington | 13.5% | 10.2%(+3.24)#42 | 8.1%(+5.38)#2,999 |
| 43. | Newton | 13.4% | 10.2%(+3.20)#43 | 8.1%(+5.34)#3,012 |
| 44. | Lenox | 13.4% | 10.2%(+3.15)#44 | 8.1%(+5.29)#3,037 |
| 45. | Amherst | 13.3% | 10.2%(+3.12)#45 | 8.1%(+5.26)#3,081 |
| 46. | Shirley | 13.3% | 10.2%(+3.05)#46 | 8.1%(+5.19)#3,102 |
| 47. | Stoneham | 13.1% | 10.2%(+2.94)#47 | 8.1%(+5.08)#3,167 |
| 48. | Boston | 13.0% | 10.2%(+2.81)#48 | 8.1%(+4.95)#3,235 |
| 49. | Brookline | 13.0% | 10.2%(+2.75)#49 | 8.1%(+4.89)#3,262 |
| 50. | Hopedale | 12.9% | 10.2%(+2.73)#50 | 8.1%(+4.87)#3,274 |
| 51. | Orange | 12.8% | 10.2%(+2.56)#51 | 8.1%(+4.70)#3,363 |
| 52. | Hull | 12.7% | 10.2%(+2.50)#52 | 8.1%(+4.64)#3,401 |
| 53. | Gloucester | 12.6% | 10.2%(+2.39)#53 | 8.1%(+4.53)#3,455 |
| 54. | New Seabury | 12.6% | 10.2%(+2.39)#54 | 8.1%(+4.53)#3,457 |
| 55. | Mansfield Center | 12.6% | 10.2%(+2.35)#55 | 8.1%(+4.49)#3,477 |
| 56. | Maynard | 12.5% | 10.2%(+2.33)#56 | 8.1%(+4.47)#3,482 |
| 57. | Medfield | 12.5% | 10.2%(+2.29)#57 | 8.1%(+4.43)#3,501 |
| 58. | Dedham | 12.5% | 10.2%(+2.25)#58 | 8.1%(+4.39)#3,581 |
| 59. | Scituate | 12.4% | 10.2%(+2.18)#59 | 8.1%(+4.32)#3,609 |
| 60. | Dennis Port | 12.3% | 10.2%(+2.05)#60 | 8.1%(+4.19)#3,678 |
| 61. | Holyoke | 12.2% | 10.2%(+2.02)#61 | 8.1%(+4.16)#3,699 |
| 62. | Melrose | 12.2% | 10.2%(+2.00)#62 | 8.1%(+4.14)#3,712 |
| 63. | Sturbridge | 12.2% | 10.2%(+1.96)#63 | 8.1%(+4.10)#3,727 |
| 64. | North Falmouth | 12.2% | 10.2%(+1.94)#64 | 8.1%(+4.08)#3,737 |
| 65. | Somerville | 12.1% | 10.2%(+1.86)#65 | 8.1%(+4.00)#3,783 |
| 66. | Belmont | 12.1% | 10.2%(+1.85)#66 | 8.1%(+3.99)#3,792 |
| 67. | Winchester | 12.0% | 10.2%(+1.78)#67 | 8.1%(+3.92)#3,832 |
| 68. | East Sandwich | 11.9% | 10.2%(+1.65)#68 | 8.1%(+3.79)#3,899 |
| 69. | Easthampton Town | 11.7% | 10.2%(+1.53)#69 | 8.1%(+3.67)#3,984 |
| 70. | Mashpee Neck | 11.6% | 10.2%(+1.40)#70 | 8.1%(+3.54)#4,069 |
| 71. | Ware | 11.6% | 10.2%(+1.37)#71 | 8.1%(+3.51)#4,088 |
| 72. | New Bedford | 11.5% | 10.2%(+1.26)#72 | 8.1%(+3.40)#4,168 |
| 73. | Cochituate | 11.4% | 10.2%(+1.14)#73 | 8.1%(+3.28)#4,253 |
| 74. | North Seekonk | 11.3% | 10.2%(+1.04)#74 | 8.1%(+3.18)#4,316 |
| 75. | North Attleborough | 11.2% | 10.2%(+1.03)#75 | 8.1%(+3.17)#4,325 |
| 76. | Teaticket | 11.2% | 10.2%(+1.01)#76 | 8.1%(+3.15)#4,343 |
| 77. | South Deerfield | 11.2% | 10.2%(+0.997)#77 | 8.1%(+3.14)#4,359 |
| 78. | Greenfield | 11.2% | 10.2%(+0.987)#78 | 8.1%(+3.13)#4,367 |
| 79. | Winthrop Town | 11.2% | 10.2%(+0.982)#79 | 8.1%(+3.12)#4,371 |
| 80. | Holbrook | 11.2% | 10.2%(+0.971)#80 | 8.1%(+3.11)#4,377 |
| 81. | Swampscott | 11.1% | 10.2%(+0.928)#81 | 8.1%(+3.07)#4,397 |
| 82. | Duxbury | 11.1% | 10.2%(+0.900)#82 | 8.1%(+3.04)#4,414 |
| 83. | Medford | 11.1% | 10.2%(+0.890)#83 | 8.1%(+3.03)#4,485 |
| 84. | North Eastham | 11.1% | 10.2%(+0.887)#84 | 8.1%(+3.03)#4,489 |
| 85. | North Scituate | 11.1% | 10.2%(+0.850)#85 | 8.1%(+2.99)#4,514 |
| 86. | Smith Mills | 11.1% | 10.2%(+0.849)#86 | 8.1%(+2.99)#4,516 |
| 87. | Lexington | 11.0% | 10.2%(+0.838)#87 | 8.1%(+2.98)#4,522 |
| 88. | North Adams | 11.0% | 10.2%(+0.792)#88 | 8.1%(+2.93)#4,552 |
| 89. | Hingham | 11.0% | 10.2%(+0.776)#89 | 8.1%(+2.92)#4,565 |
| 90. | Hanscom Afb | 10.9% | 10.2%(+0.639)#90 | 8.1%(+2.78)#4,659 |
| 91. | The Pinehills | 10.8% | 10.2%(+0.625)#91 | 8.1%(+2.77)#4,668 |
| 92. | Arlington | 10.8% | 10.2%(+0.558)#92 | 8.1%(+2.70)#4,725 |
| 93. | Barnstable Town | 10.7% | 10.2%(+0.530)#93 | 8.1%(+2.67)#4,753 |
| 94. | West Concord | 10.7% | 10.2%(+0.519)#94 | 8.1%(+2.66)#4,760 |
| 95. | Watertown Town | 10.7% | 10.2%(+0.486)#95 | 8.1%(+2.63)#4,812 |
| 96. | Newburyport | 10.7% | 10.2%(+0.457)#96 | 8.1%(+2.60)#4,832 |
| 97. | Pittsfield | 10.6% | 10.2%(+0.430)#97 | 8.1%(+2.57)#4,855 |
| 98. | Granby | 10.6% | 10.2%(+0.406)#98 | 8.1%(+2.55)#4,879 |
| 99. | Framingham | 10.6% | 10.2%(+0.390)#99 | 8.1%(+2.53)#4,896 |
| 100. | Sandwich | 10.6% | 10.2%(+0.383)#100 | 8.1%(+2.52)#4,902 |
Common Questions
What are the Top 10 Cities with the Highest Percentage of Population with a Degree in Social Sciences in Massachusetts?
Top 10 Cities with the Highest Percentage of Population with a Degree in Social Sciences in Massachusetts are:
#1
27.8%
#2
26.7%
#3
21.2%
#4
20.5%
#5
20.4%
#6
20.3%
#7
20.0%
#8
18.7%
#9
18.3%
#10
17.9%
What city has the Highest Percentage of Population with a Degree in Social Sciences in Massachusetts?
Mattapoisett Center has the Highest Percentage of Population with a Degree in Social Sciences in Massachusetts with 27.8%.
What is the Percentage of Population with a Degree in Social Sciences in the State of Massachusetts?
Percentage of Population with a Degree in Social Sciences in Massachusetts is 10.2%.
What is the Percentage of Population with a Degree in Social Sciences in the United States?
Percentage of Population with a Degree in Social Sciences in the United States is 8.1%.