Cities with the Highest Percentage of Population with a Degree in Social Sciences in North Carolina
RELATED REPORTS & OPTIONS
Social Sciences
North Carolina
Compare Cities
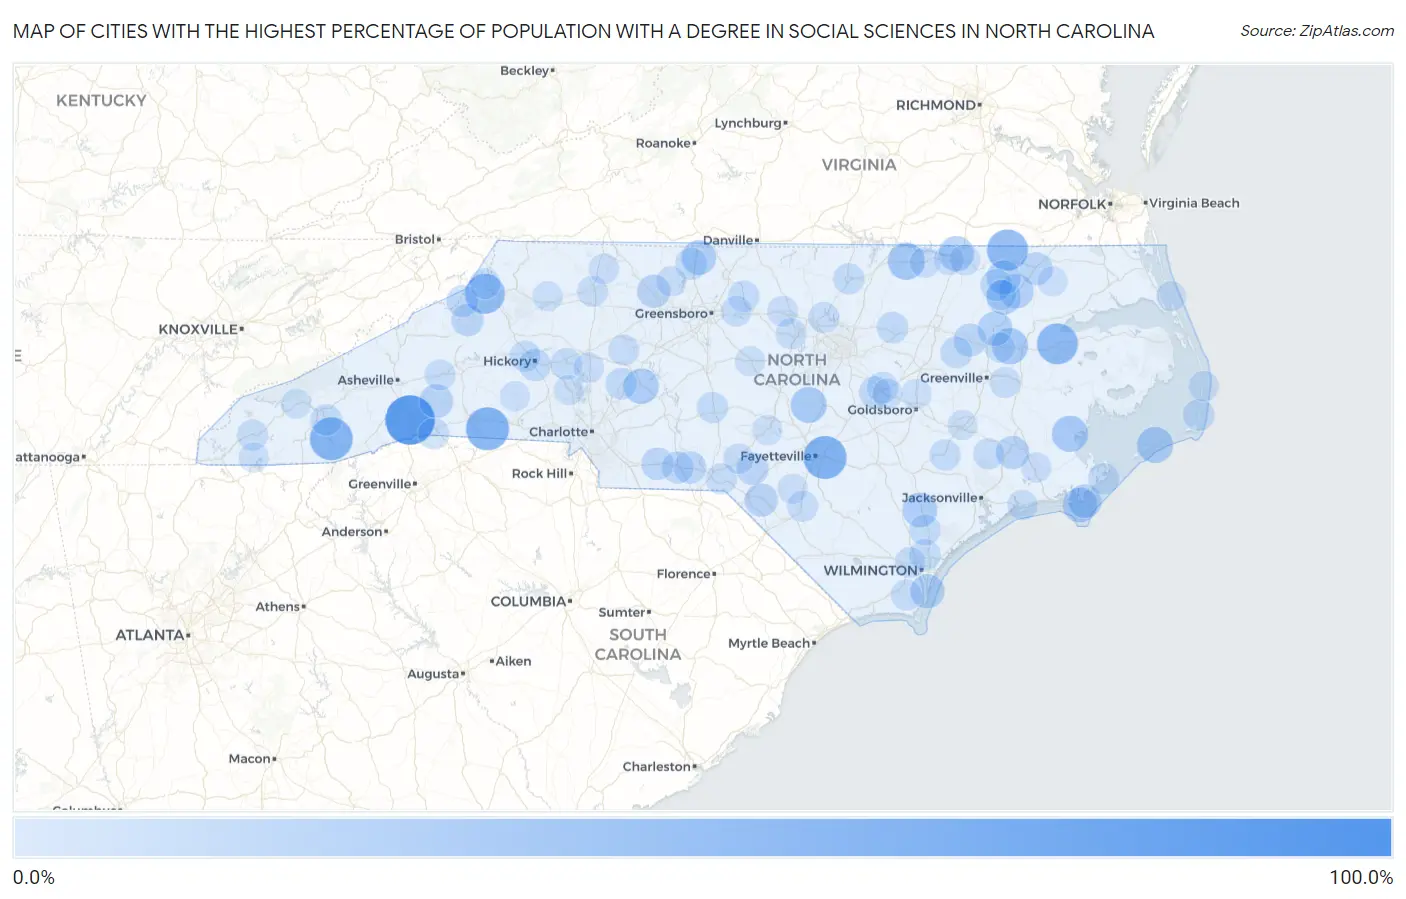
Map of Cities with the Highest Percentage of Population with a Degree in Social Sciences in North Carolina
0.0%
100.0%
Cities with the Highest Percentage of Population with a Degree in Social Sciences in North Carolina
| City | % Graduates | vs State | vs National | |
| 1. | Gold Hill | 100.0% | 7.6%(+92.4)#1 | 8.1%(+91.9)#14 |
| 2. | Barker Heights | 88.0% | 7.6%(+80.4)#2 | 8.1%(+79.9)#63 |
| 3. | Cliffside | 62.1% | 7.6%(+54.6)#3 | 8.1%(+54.1)#111 |
| 4. | Vander | 62.0% | 7.6%(+54.5)#4 | 8.1%(+53.9)#112 |
| 5. | Glenville | 61.2% | 7.6%(+53.7)#5 | 8.1%(+53.2)#114 |
| 6. | Severn | 54.5% | 7.6%(+47.0)#6 | 8.1%(+46.5)#151 |
| 7. | Plymouth | 53.5% | 7.6%(+46.0)#7 | 8.1%(+45.5)#157 |
| 8. | Linville | 52.2% | 7.6%(+44.6)#8 | 8.1%(+44.1)#161 |
| 9. | Valle Crucis | 50.0% | 7.6%(+42.4)#9 | 8.1%(+41.9)#195 |
| 10. | Macon | 38.5% | 7.6%(+30.9)#10 | 8.1%(+30.4)#340 |
| 11. | Everetts | 35.3% | 7.6%(+27.7)#11 | 8.1%(+27.2)#395 |
| 12. | Mesic | 35.3% | 7.6%(+27.7)#12 | 8.1%(+27.2)#397 |
| 13. | Ocracoke | 34.9% | 7.6%(+27.4)#13 | 8.1%(+26.8)#403 |
| 14. | Mamers | 34.2% | 7.6%(+26.6)#14 | 8.1%(+26.1)#416 |
| 15. | Gaston | 31.6% | 7.6%(+24.0)#15 | 8.1%(+23.5)#482 |
| 16. | Rockwell | 31.3% | 7.6%(+23.7)#16 | 8.1%(+23.2)#488 |
| 17. | Harkers Island | 30.0% | 7.6%(+22.5)#17 | 8.1%(+22.0)#530 |
| 18. | Stoneville | 29.4% | 7.6%(+21.9)#18 | 8.1%(+21.3)#563 |
| 19. | Watha | 29.4% | 7.6%(+21.9)#19 | 8.1%(+21.3)#567 |
| 20. | Aulander | 28.6% | 7.6%(+21.0)#20 | 8.1%(+20.5)#599 |
| 21. | Oak City | 28.6% | 7.6%(+21.0)#21 | 8.1%(+20.5)#601 |
| 22. | Kelford | 28.6% | 7.6%(+21.0)#22 | 8.1%(+20.5)#604 |
| 23. | Woodland | 28.4% | 7.6%(+20.8)#23 | 8.1%(+20.3)#620 |
| 24. | Sea Breeze | 27.8% | 7.6%(+20.2)#24 | 8.1%(+19.7)#645 |
| 25. | Lake Lure | 26.1% | 7.6%(+18.5)#25 | 8.1%(+18.0)#735 |
| 26. | Marshallberg | 26.0% | 7.6%(+18.5)#26 | 8.1%(+18.0)#742 |
| 27. | River Bend | 24.3% | 7.6%(+16.7)#27 | 8.1%(+16.2)#873 |
| 28. | Maxton | 24.0% | 7.6%(+16.4)#28 | 8.1%(+15.9)#892 |
| 29. | Rural Hall | 23.8% | 7.6%(+16.2)#29 | 8.1%(+15.7)#908 |
| 30. | Princeville | 23.1% | 7.6%(+15.5)#30 | 8.1%(+15.0)#952 |
| 31. | Winton | 23.0% | 7.6%(+15.4)#31 | 8.1%(+14.9)#965 |
| 32. | Crossnore | 21.1% | 7.6%(+13.5)#32 | 8.1%(+13.0)#1,178 |
| 33. | Peachland | 20.8% | 7.6%(+13.3)#33 | 8.1%(+12.8)#1,208 |
| 34. | Lilesville | 20.7% | 7.6%(+13.1)#34 | 8.1%(+12.6)#1,221 |
| 35. | Deercroft | 20.6% | 7.6%(+13.1)#35 | 8.1%(+12.5)#1,227 |
| 36. | Elk Park | 20.3% | 7.6%(+12.7)#36 | 8.1%(+12.2)#1,267 |
| 37. | Brookford | 20.0% | 7.6%(+12.4)#37 | 8.1%(+11.9)#1,300 |
| 38. | Smithfield | 19.8% | 7.6%(+12.3)#38 | 8.1%(+11.7)#1,361 |
| 39. | Wadesboro | 19.6% | 7.6%(+12.0)#39 | 8.1%(+11.5)#1,385 |
| 40. | Rich Square | 19.0% | 7.6%(+11.5)#40 | 8.1%(+10.9)#1,477 |
| 41. | Pinetops | 18.8% | 7.6%(+11.2)#41 | 8.1%(+10.7)#1,504 |
| 42. | Mayodan | 18.7% | 7.6%(+11.2)#42 | 8.1%(+10.7)#1,525 |
| 43. | Avon | 18.6% | 7.6%(+11.1)#43 | 8.1%(+10.5)#1,547 |
| 44. | Arrowhead Beach | 18.5% | 7.6%(+10.9)#44 | 8.1%(+10.4)#1,570 |
| 45. | China Grove | 18.2% | 7.6%(+10.6)#45 | 8.1%(+10.1)#1,634 |
| 46. | Lake Royale | 18.0% | 7.6%(+10.4)#46 | 8.1%(+9.89)#1,658 |
| 47. | Cullowhee | 17.6% | 7.6%(+10.0)#47 | 8.1%(+9.49)#1,730 |
| 48. | Selma | 17.4% | 7.6%(+9.80)#48 | 8.1%(+9.28)#1,773 |
| 49. | Altamahaw | 17.2% | 7.6%(+9.64)#49 | 8.1%(+9.12)#1,801 |
| 50. | Skippers Corner | 17.2% | 7.6%(+9.60)#50 | 8.1%(+9.08)#1,808 |
| 51. | Star | 16.7% | 7.6%(+9.12)#51 | 8.1%(+8.60)#1,914 |
| 52. | Catawba | 16.7% | 7.6%(+9.12)#52 | 8.1%(+8.60)#1,926 |
| 53. | Pink Hill | 16.7% | 7.6%(+9.12)#53 | 8.1%(+8.60)#1,933 |
| 54. | Oxford | 16.6% | 7.6%(+9.05)#54 | 8.1%(+8.53)#1,974 |
| 55. | St Helena | 16.4% | 7.6%(+8.81)#55 | 8.1%(+8.29)#2,011 |
| 56. | Atlantic | 16.3% | 7.6%(+8.78)#56 | 8.1%(+8.26)#2,019 |
| 57. | Tryon | 16.2% | 7.6%(+8.61)#57 | 8.1%(+8.09)#2,059 |
| 58. | Rhodhiss | 16.1% | 7.6%(+8.58)#58 | 8.1%(+8.06)#2,071 |
| 59. | Andrews | 15.9% | 7.6%(+8.32)#59 | 8.1%(+7.80)#2,134 |
| 60. | Hamlet | 15.8% | 7.6%(+8.27)#60 | 8.1%(+7.75)#2,147 |
| 61. | Gorman | 15.8% | 7.6%(+8.21)#61 | 8.1%(+7.69)#2,171 |
| 62. | Barker Ten Mile | 15.7% | 7.6%(+8.14)#62 | 8.1%(+7.62)#2,188 |
| 63. | Grimesland | 15.6% | 7.6%(+8.07)#63 | 8.1%(+7.55)#2,202 |
| 64. | Carrboro | 15.6% | 7.6%(+8.04)#64 | 8.1%(+7.52)#2,217 |
| 65. | Navassa | 15.6% | 7.6%(+8.00)#65 | 8.1%(+7.48)#2,224 |
| 66. | Trenton | 15.4% | 7.6%(+7.83)#66 | 8.1%(+7.31)#2,287 |
| 67. | Boiling Spring Lakes | 15.2% | 7.6%(+7.63)#67 | 8.1%(+7.11)#2,343 |
| 68. | Cove Creek | 15.1% | 7.6%(+7.58)#68 | 8.1%(+7.06)#2,357 |
| 69. | Whitsett | 15.1% | 7.6%(+7.53)#69 | 8.1%(+7.01)#2,375 |
| 70. | Cooleemee | 15.0% | 7.6%(+7.45)#70 | 8.1%(+6.93)#2,395 |
| 71. | Glenwood | 14.8% | 7.6%(+7.21)#71 | 8.1%(+6.69)#2,477 |
| 72. | Old Fort | 14.7% | 7.6%(+7.18)#72 | 8.1%(+6.66)#2,485 |
| 73. | Garysburg | 14.7% | 7.6%(+7.14)#73 | 8.1%(+6.62)#2,501 |
| 74. | Jonesville | 14.6% | 7.6%(+7.06)#74 | 8.1%(+6.54)#2,529 |
| 75. | Efland | 14.5% | 7.6%(+6.97)#75 | 8.1%(+6.44)#2,555 |
| 76. | Littleton | 14.0% | 7.6%(+6.42)#76 | 8.1%(+5.90)#2,770 |
| 77. | Hoffman | 13.6% | 7.6%(+6.09)#77 | 8.1%(+5.57)#2,911 |
| 78. | Dobson | 13.6% | 7.6%(+6.04)#78 | 8.1%(+5.52)#2,937 |
| 79. | Troutman | 13.6% | 7.6%(+6.02)#79 | 8.1%(+5.50)#2,944 |
| 80. | Barnardsville | 13.5% | 7.6%(+5.91)#80 | 8.1%(+5.39)#2,996 |
| 81. | Neuse Forest | 13.4% | 7.6%(+5.84)#81 | 8.1%(+5.32)#3,026 |
| 82. | Salvo | 13.3% | 7.6%(+5.70)#82 | 8.1%(+5.18)#3,110 |
| 83. | Cape Carteret | 13.2% | 7.6%(+5.64)#83 | 8.1%(+5.12)#3,144 |
| 84. | Walnut Cove | 13.1% | 7.6%(+5.59)#84 | 8.1%(+5.07)#3,172 |
| 85. | Vass | 13.0% | 7.6%(+5.44)#85 | 8.1%(+4.92)#3,245 |
| 86. | Pikeville | 13.0% | 7.6%(+5.43)#86 | 8.1%(+4.91)#3,252 |
| 87. | Rennert | 12.9% | 7.6%(+5.35)#87 | 8.1%(+4.83)#3,301 |
| 88. | Siler City | 12.8% | 7.6%(+5.28)#88 | 8.1%(+4.76)#3,329 |
| 89. | Hayesville | 12.7% | 7.6%(+5.18)#89 | 8.1%(+4.66)#3,389 |
| 90. | Roxobel | 12.7% | 7.6%(+5.18)#90 | 8.1%(+4.66)#3,391 |
| 91. | Robersonville | 12.7% | 7.6%(+5.12)#91 | 8.1%(+4.60)#3,422 |
| 92. | Denver | 12.6% | 7.6%(+5.08)#92 | 8.1%(+4.56)#3,437 |
| 93. | Millers Creek | 12.5% | 7.6%(+4.95)#93 | 8.1%(+4.43)#3,511 |
| 94. | Belwood | 12.5% | 7.6%(+4.95)#94 | 8.1%(+4.43)#3,514 |
| 95. | Harrellsville | 12.5% | 7.6%(+4.95)#95 | 8.1%(+4.43)#3,549 |
| 96. | Kinston | 12.4% | 7.6%(+4.89)#96 | 8.1%(+4.37)#3,591 |
| 97. | Bryson City | 12.4% | 7.6%(+4.87)#97 | 8.1%(+4.35)#3,593 |
| 98. | Duck | 12.4% | 7.6%(+4.85)#98 | 8.1%(+4.33)#3,603 |
| 99. | Pine Level | 12.4% | 7.6%(+4.82)#99 | 8.1%(+4.30)#3,618 |
| 100. | South Rosemary | 12.3% | 7.6%(+4.79)#100 | 8.1%(+4.27)#3,643 |
Common Questions
What are the Top 10 Cities with the Highest Percentage of Population with a Degree in Social Sciences in North Carolina?
Top 10 Cities with the Highest Percentage of Population with a Degree in Social Sciences in North Carolina are:
#1
88.0%
#2
62.1%
#3
62.0%
#4
61.2%
#5
54.5%
#6
53.5%
#7
50.0%
#8
38.5%
#9
35.3%
#10
35.3%
What city has the Highest Percentage of Population with a Degree in Social Sciences in North Carolina?
Barker Heights has the Highest Percentage of Population with a Degree in Social Sciences in North Carolina with 88.0%.
What is the Percentage of Population with a Degree in Social Sciences in the State of North Carolina?
Percentage of Population with a Degree in Social Sciences in North Carolina is 7.6%.
What is the Percentage of Population with a Degree in Social Sciences in the United States?
Percentage of Population with a Degree in Social Sciences in the United States is 8.1%.