Cities with the Highest Percentage of Population with a Degree in Social Sciences in Virginia
RELATED REPORTS & OPTIONS
Social Sciences
Virginia
Compare Cities
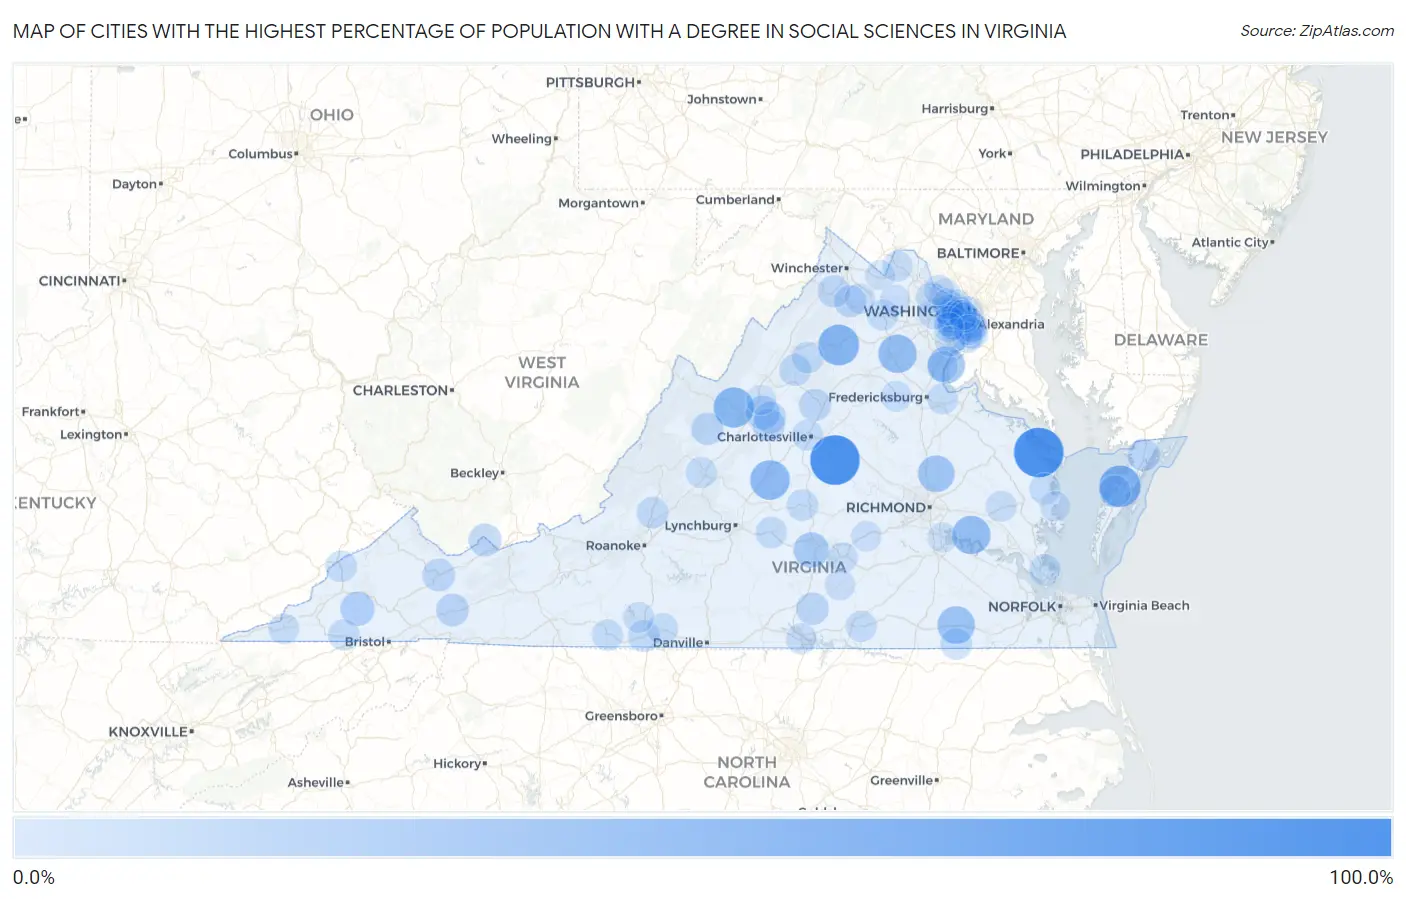
Map of Cities with the Highest Percentage of Population with a Degree in Social Sciences in Virginia
0.0%
100.0%
Cities with the Highest Percentage of Population with a Degree in Social Sciences in Virginia
| City | % Graduates | vs State | vs National | |
| 1. | Heathsville | 100.0% | 11.0%(+89.0)#1 | 8.1%(+91.9)#31 |
| 2. | Palmyra | 100.0% | 11.0%(+89.0)#2 | 8.1%(+91.9)#32 |
| 3. | Savageville | 64.1% | 11.0%(+53.1)#3 | 8.1%(+56.0)#104 |
| 4. | Upperville | 63.0% | 11.0%(+52.0)#4 | 8.1%(+54.9)#108 |
| 5. | Sperryville | 60.7% | 11.0%(+49.7)#5 | 8.1%(+52.6)#116 |
| 6. | Churchville | 58.1% | 11.0%(+47.1)#6 | 8.1%(+50.0)#125 |
| 7. | Shipman | 55.2% | 11.0%(+44.2)#7 | 8.1%(+47.1)#146 |
| 8. | Midland | 50.0% | 11.0%(+39.0)#8 | 8.1%(+41.9)#188 |
| 9. | Charles City | 50.0% | 11.0%(+39.0)#9 | 8.1%(+41.9)#214 |
| 10. | Capron | 46.2% | 11.0%(+35.2)#10 | 8.1%(+38.1)#241 |
| 11. | Quantico | 44.8% | 11.0%(+33.9)#11 | 8.1%(+36.8)#249 |
| 12. | Hanover | 42.6% | 11.0%(+31.6)#12 | 8.1%(+34.5)#274 |
| 13. | Hampden Sydney | 36.6% | 11.0%(+25.6)#13 | 8.1%(+28.5)#369 |
| 14. | Camp Barrett | 34.8% | 11.0%(+23.9)#14 | 8.1%(+26.8)#404 |
| 15. | Dungannon | 31.8% | 11.0%(+20.8)#15 | 8.1%(+23.7)#478 |
| 16. | Kincora | 29.7% | 11.0%(+18.7)#16 | 8.1%(+21.6)#553 |
| 17. | New Hope | 29.2% | 11.0%(+18.2)#17 | 8.1%(+21.1)#572 |
| 18. | Pocahontas | 26.1% | 11.0%(+15.1)#18 | 8.1%(+18.0)#740 |
| 19. | Seven Mile Ford | 25.8% | 11.0%(+14.8)#19 | 8.1%(+17.7)#747 |
| 20. | Claypool Hill | 25.2% | 11.0%(+14.2)#20 | 8.1%(+17.2)#784 |
| 21. | Meadowview | 25.2% | 11.0%(+14.2)#21 | 8.1%(+17.1)#785 |
| 22. | Fairview | 25.0% | 11.0%(+14.0)#22 | 8.1%(+16.9)#807 |
| 23. | Temperanceville | 24.3% | 11.0%(+13.3)#23 | 8.1%(+16.3)#870 |
| 24. | Singers Glen | 24.3% | 11.0%(+13.3)#24 | 8.1%(+16.3)#871 |
| 25. | Craigsville | 24.2% | 11.0%(+13.3)#25 | 8.1%(+16.2)#875 |
| 26. | Dooms | 24.1% | 11.0%(+13.1)#26 | 8.1%(+16.0)#887 |
| 27. | Middletown | 23.3% | 11.0%(+12.3)#27 | 8.1%(+15.2)#940 |
| 28. | Crimora | 23.1% | 11.0%(+12.1)#28 | 8.1%(+15.0)#951 |
| 29. | Twin Lakes | 22.8% | 11.0%(+11.8)#29 | 8.1%(+14.7)#979 |
| 30. | Shenandoah Shores | 22.6% | 11.0%(+11.6)#30 | 8.1%(+14.5)#993 |
| 31. | Weems | 22.1% | 11.0%(+11.1)#31 | 8.1%(+14.0)#1,060 |
| 32. | Bobtown | 22.0% | 11.0%(+11.0)#32 | 8.1%(+13.9)#1,067 |
| 33. | Fincastle | 21.9% | 11.0%(+11.0)#33 | 8.1%(+13.9)#1,070 |
| 34. | Ravensworth | 21.6% | 11.0%(+10.6)#34 | 8.1%(+13.6)#1,100 |
| 35. | Shenandoah | 21.2% | 11.0%(+10.3)#35 | 8.1%(+13.2)#1,152 |
| 36. | Arlington | 21.1% | 11.0%(+10.2)#36 | 8.1%(+13.1)#1,162 |
| 37. | Buckingham Courthouse | 21.0% | 11.0%(+9.99)#37 | 8.1%(+12.9)#1,187 |
| 38. | Horse Pasture | 20.9% | 11.0%(+9.90)#38 | 8.1%(+12.8)#1,200 |
| 39. | Boykins | 20.8% | 11.0%(+9.78)#39 | 8.1%(+12.7)#1,213 |
| 40. | Lake Barcroft | 20.6% | 11.0%(+9.57)#40 | 8.1%(+12.5)#1,237 |
| 41. | Bethel Manor | 20.5% | 11.0%(+9.50)#41 | 8.1%(+12.4)#1,243 |
| 42. | Pound | 20.3% | 11.0%(+9.36)#42 | 8.1%(+12.3)#1,261 |
| 43. | Appomattox | 20.2% | 11.0%(+9.20)#43 | 8.1%(+12.1)#1,275 |
| 44. | Stanley | 20.1% | 11.0%(+9.16)#44 | 8.1%(+12.1)#1,278 |
| 45. | Mclean | 20.1% | 11.0%(+9.14)#45 | 8.1%(+12.0)#1,279 |
| 46. | Gate City | 19.7% | 11.0%(+8.75)#46 | 8.1%(+11.7)#1,367 |
| 47. | Laurel Park | 19.5% | 11.0%(+8.50)#47 | 8.1%(+11.4)#1,397 |
| 48. | Lexington | 19.5% | 11.0%(+8.49)#48 | 8.1%(+11.4)#1,400 |
| 49. | Irvington | 19.1% | 11.0%(+8.10)#49 | 8.1%(+11.0)#1,462 |
| 50. | Stuart | 18.9% | 11.0%(+7.93)#50 | 8.1%(+10.8)#1,493 |
| 51. | Passapatanzy | 18.8% | 11.0%(+7.81)#51 | 8.1%(+10.7)#1,505 |
| 52. | Marshall | 18.8% | 11.0%(+7.77)#52 | 8.1%(+10.7)#1,509 |
| 53. | Alexandria | 18.6% | 11.0%(+7.64)#53 | 8.1%(+10.5)#1,542 |
| 54. | University Of Virginia | 18.5% | 11.0%(+7.50)#54 | 8.1%(+10.4)#1,569 |
| 55. | Earlysville | 18.5% | 11.0%(+7.48)#55 | 8.1%(+10.4)#1,572 |
| 56. | Brodnax | 18.4% | 11.0%(+7.44)#56 | 8.1%(+10.3)#1,578 |
| 57. | Greenbriar | 18.1% | 11.0%(+7.14)#57 | 8.1%(+10.0)#1,643 |
| 58. | Lake Wilderness | 17.8% | 11.0%(+6.83)#58 | 8.1%(+9.74)#1,691 |
| 59. | Falls Church | 17.8% | 11.0%(+6.79)#59 | 8.1%(+9.70)#1,699 |
| 60. | Mantua | 17.6% | 11.0%(+6.59)#60 | 8.1%(+9.50)#1,728 |
| 61. | West Point | 17.5% | 11.0%(+6.53)#61 | 8.1%(+9.44)#1,738 |
| 62. | Kings Park | 17.4% | 11.0%(+6.43)#62 | 8.1%(+9.34)#1,757 |
| 63. | Hybla Valley | 17.4% | 11.0%(+6.39)#63 | 8.1%(+9.30)#1,770 |
| 64. | Oak Grove | 17.3% | 11.0%(+6.35)#64 | 8.1%(+9.26)#1,777 |
| 65. | Merrifield | 17.3% | 11.0%(+6.30)#65 | 8.1%(+9.21)#1,785 |
| 66. | Huntington | 17.2% | 11.0%(+6.23)#66 | 8.1%(+9.14)#1,799 |
| 67. | Pimmit Hills | 17.0% | 11.0%(+6.03)#67 | 8.1%(+8.94)#1,843 |
| 68. | Clarksville | 17.0% | 11.0%(+6.03)#68 | 8.1%(+8.94)#1,844 |
| 69. | Bassett | 16.9% | 11.0%(+5.97)#69 | 8.1%(+8.88)#1,859 |
| 70. | Jonesville | 16.9% | 11.0%(+5.94)#70 | 8.1%(+8.85)#1,866 |
| 71. | Burkeville | 16.9% | 11.0%(+5.94)#71 | 8.1%(+8.85)#1,867 |
| 72. | Hillsboro | 16.9% | 11.0%(+5.94)#72 | 8.1%(+8.85)#1,868 |
| 73. | Woodburn | 16.9% | 11.0%(+5.93)#73 | 8.1%(+8.84)#1,869 |
| 74. | Quantico Base | 16.9% | 11.0%(+5.90)#74 | 8.1%(+8.81)#1,874 |
| 75. | Great Falls | 16.8% | 11.0%(+5.78)#75 | 8.1%(+8.69)#1,895 |
| 76. | Woodlawn Cdp Carroll County | 16.7% | 11.0%(+5.69)#76 | 8.1%(+8.60)#1,913 |
| 77. | Rose Hill Cdp Fairfax County | 16.6% | 11.0%(+5.61)#77 | 8.1%(+8.52)#1,979 |
| 78. | West Falls Church | 16.6% | 11.0%(+5.61)#78 | 8.1%(+8.52)#1,981 |
| 79. | Vienna | 16.4% | 11.0%(+5.40)#79 | 8.1%(+8.31)#2,008 |
| 80. | Amelia Court House | 16.4% | 11.0%(+5.38)#80 | 8.1%(+8.29)#2,010 |
| 81. | Wolf Trap | 16.2% | 11.0%(+5.23)#81 | 8.1%(+8.14)#2,049 |
| 82. | Fort Hunt | 16.2% | 11.0%(+5.18)#82 | 8.1%(+8.09)#2,060 |
| 83. | Victoria | 16.0% | 11.0%(+4.98)#83 | 8.1%(+7.89)#2,116 |
| 84. | Shenandoah Farms | 16.0% | 11.0%(+4.97)#84 | 8.1%(+7.88)#2,118 |
| 85. | Newington | 15.7% | 11.0%(+4.69)#85 | 8.1%(+7.60)#2,194 |
| 86. | Belle Haven | 15.6% | 11.0%(+4.65)#86 | 8.1%(+7.56)#2,199 |
| 87. | Deltaville | 15.6% | 11.0%(+4.63)#87 | 8.1%(+7.54)#2,209 |
| 88. | Middleburg | 15.5% | 11.0%(+4.51)#88 | 8.1%(+7.42)#2,240 |
| 89. | Mount Vernon | 15.4% | 11.0%(+4.45)#89 | 8.1%(+7.36)#2,256 |
| 90. | Long Branch | 15.4% | 11.0%(+4.44)#90 | 8.1%(+7.34)#2,259 |
| 91. | Lowes Island | 15.4% | 11.0%(+4.43)#91 | 8.1%(+7.34)#2,260 |
| 92. | Difficult Run | 15.4% | 11.0%(+4.43)#92 | 8.1%(+7.34)#2,262 |
| 93. | Bailey S Crossroads | 15.3% | 11.0%(+4.34)#93 | 8.1%(+7.25)#2,303 |
| 94. | Seven Corners | 15.2% | 11.0%(+4.22)#94 | 8.1%(+7.13)#2,341 |
| 95. | Groveton | 15.1% | 11.0%(+4.12)#95 | 8.1%(+7.03)#2,366 |
| 96. | Enon | 14.9% | 11.0%(+3.87)#96 | 8.1%(+6.78)#2,449 |
| 97. | Occoquan | 14.8% | 11.0%(+3.84)#97 | 8.1%(+6.74)#2,461 |
| 98. | Burke | 14.8% | 11.0%(+3.78)#98 | 8.1%(+6.68)#2,478 |
| 99. | Shenandoah Retreat | 14.7% | 11.0%(+3.68)#99 | 8.1%(+6.58)#2,510 |
| 100. | Weyers Cave | 14.7% | 11.0%(+3.67)#100 | 8.1%(+6.58)#2,514 |
Common Questions
What are the Top 10 Cities with the Highest Percentage of Population with a Degree in Social Sciences in Virginia?
Top 10 Cities with the Highest Percentage of Population with a Degree in Social Sciences in Virginia are:
#1
100.0%
#2
100.0%
#3
64.1%
#4
60.7%
#5
58.1%
#6
55.2%
#7
50.0%
#8
50.0%
#9
46.2%
#10
44.8%
What city has the Highest Percentage of Population with a Degree in Social Sciences in Virginia?
Heathsville has the Highest Percentage of Population with a Degree in Social Sciences in Virginia with 100.0%.
What is the Percentage of Population with a Degree in Social Sciences in the State of Virginia?
Percentage of Population with a Degree in Social Sciences in Virginia is 11.0%.
What is the Percentage of Population with a Degree in Social Sciences in the United States?
Percentage of Population with a Degree in Social Sciences in the United States is 8.1%.