Cities with the Highest Percentage of Population with a Degree in Social Sciences in Nevada
RELATED REPORTS & OPTIONS
Social Sciences
Nevada
Compare Cities
Map of Cities with the Highest Percentage of Population with a Degree in Social Sciences in Nevada
0.0%
60.0%
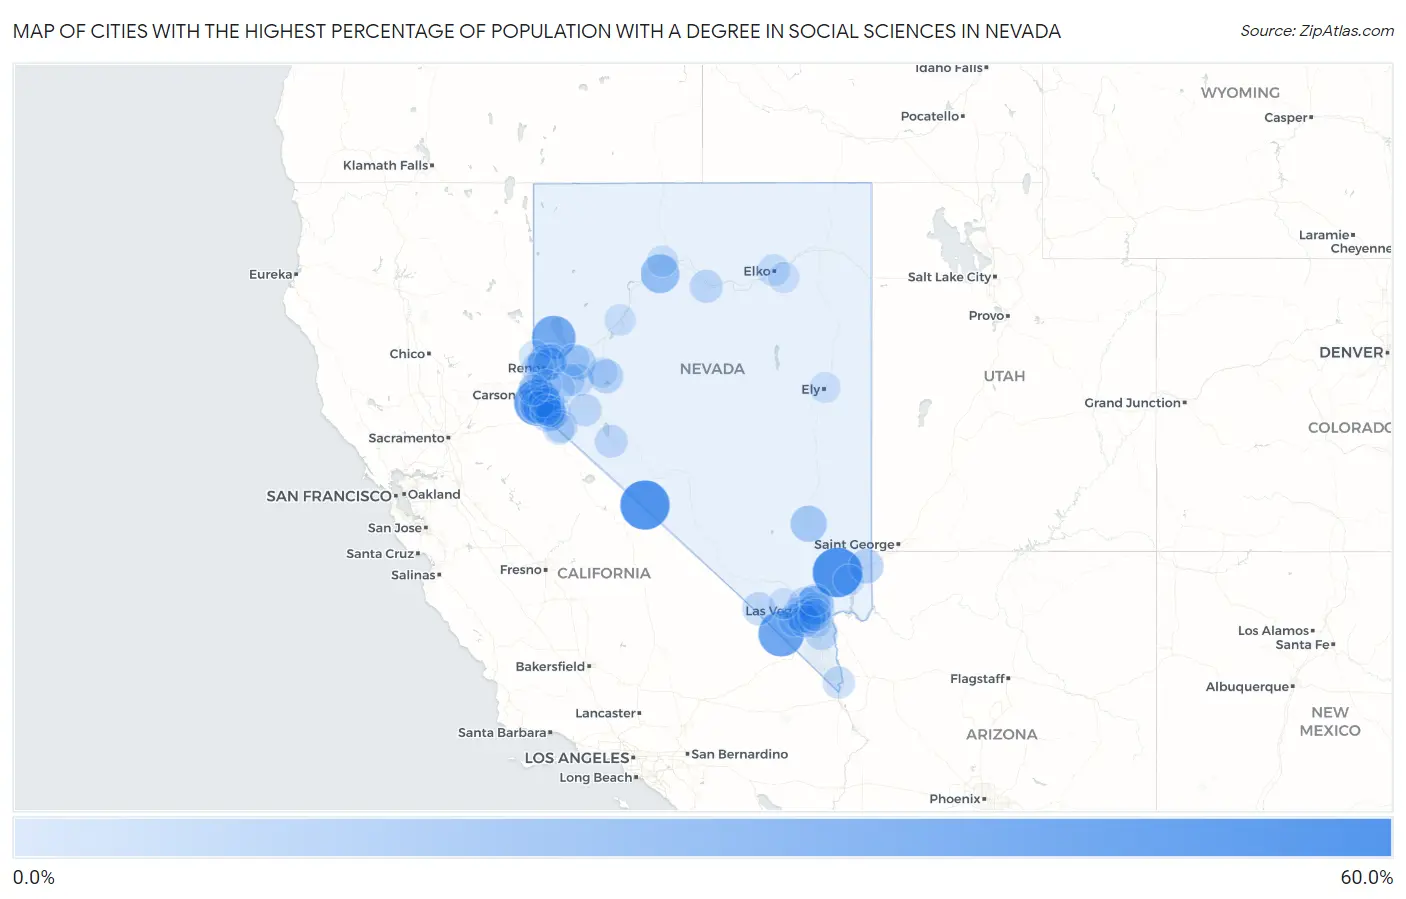
Cities with the Highest Percentage of Population with a Degree in Social Sciences in Nevada
| City | % Graduates | vs State | vs National | |
| 1. | Moapa Town | 54.5% | 7.6%(+47.0)#1 | 8.1%(+46.5)#150 |
| 2. | Dyer | 53.6% | 7.6%(+46.1)#2 | 8.1%(+45.6)#156 |
| 3. | Logan Creek | 46.4% | 7.6%(+38.9)#3 | 8.1%(+38.4)#235 |
| 4. | Sandy Valley | 43.5% | 7.6%(+35.9)#4 | 8.1%(+35.4)#261 |
| 5. | Sutcliffe | 37.5% | 7.6%(+29.9)#5 | 8.1%(+29.4)#353 |
| 6. | Grass Valley | 23.7% | 7.6%(+16.1)#6 | 8.1%(+15.6)#911 |
| 7. | Nellis Afb | 21.6% | 7.6%(+14.0)#7 | 8.1%(+13.5)#1,109 |
| 8. | Sun Valley | 17.4% | 7.6%(+9.84)#8 | 8.1%(+9.33)#1,759 |
| 9. | Zephyr Cove | 17.0% | 7.6%(+9.40)#9 | 8.1%(+8.90)#1,854 |
| 10. | Alamo | 16.7% | 7.6%(+9.10)#10 | 8.1%(+8.60)#1,916 |
| 11. | Skyland | 15.5% | 7.6%(+7.91)#11 | 8.1%(+7.41)#2,243 |
| 12. | Mesquite | 12.1% | 7.6%(+4.52)#12 | 8.1%(+4.02)#3,776 |
| 13. | Glenbrook | 11.7% | 7.6%(+4.11)#13 | 8.1%(+3.61)#4,025 |
| 14. | Fernley | 11.3% | 7.6%(+3.70)#14 | 8.1%(+3.19)#4,310 |
| 15. | Fallon Station | 10.7% | 7.6%(+3.15)#15 | 8.1%(+2.64)#4,786 |
| 16. | Genoa | 10.5% | 7.6%(+2.90)#16 | 8.1%(+2.40)#5,011 |
| 17. | Gardnerville | 10.4% | 7.6%(+2.84)#17 | 8.1%(+2.34)#5,071 |
| 18. | Incline Village | 9.0% | 7.6%(+1.44)#18 | 8.1%(+0.938)#6,602 |
| 19. | Gardnerville Ranchos | 8.8% | 7.6%(+1.23)#19 | 8.1%(+0.725)#6,847 |
| 20. | Fish Springs | 8.5% | 7.6%(+0.945)#20 | 8.1%(+0.439)#7,222 |
| 21. | Reno | 8.4% | 7.6%(+0.788)#21 | 8.1%(+0.283)#7,397 |
| 22. | Las Vegas | 8.3% | 7.6%(+0.745)#22 | 8.1%(+0.239)#7,496 |
| 23. | Carson | 8.2% | 7.6%(+0.604)#23 | 8.1%(+0.099)#7,683 |
| 24. | Amargosa Valley | 8.0% | 7.6%(+0.405)#24 | 8.1%(-0.100)#7,994 |
| 25. | Summerlin South | 8.0% | 7.6%(+0.387)#25 | 8.1%(-0.118)#8,017 |
| 26. | Battle Mountain | 7.9% | 7.6%(+0.355)#26 | 8.1%(-0.150)#8,057 |
| 27. | Winchester | 7.9% | 7.6%(+0.342)#27 | 8.1%(-0.164)#8,080 |
| 28. | Spring Valley | 7.8% | 7.6%(+0.258)#28 | 8.1%(-0.247)#8,241 |
| 29. | Henderson | 7.8% | 7.6%(+0.195)#29 | 8.1%(-0.310)#8,329 |
| 30. | Blue Diamond | 7.6% | 7.6%(+0.073)#30 | 8.1%(-0.432)#8,541 |
| 31. | Kingsbury | 7.6% | 7.6%(+0.057)#31 | 8.1%(-0.448)#8,566 |
| 32. | Pahrump | 7.6% | 7.6%(+0.055)#32 | 8.1%(-0.450)#8,569 |
| 33. | Boulder City | 7.4% | 7.6%(-0.177)#33 | 8.1%(-0.682)#8,932 |
| 34. | Hawthorne | 7.4% | 7.6%(-0.178)#34 | 8.1%(-0.683)#8,937 |
| 35. | Silver Springs | 7.3% | 7.6%(-0.290)#35 | 8.1%(-0.795)#9,090 |
| 36. | Sunrise Manor | 7.2% | 7.6%(-0.368)#36 | 8.1%(-0.874)#9,233 |
| 37. | Paradise | 6.9% | 7.6%(-0.674)#37 | 8.1%(-1.18)#9,732 |
| 38. | Johnson Lane | 6.8% | 7.6%(-0.773)#38 | 8.1%(-1.28)#9,867 |
| 39. | Yerington | 6.8% | 7.6%(-0.813)#39 | 8.1%(-1.32)#9,935 |
| 40. | Enterprise | 6.6% | 7.6%(-0.988)#40 | 8.1%(-1.49)#10,239 |
| 41. | Whitney | 6.6% | 7.6%(-1.01)#41 | 8.1%(-1.52)#10,279 |
| 42. | Sparks | 6.5% | 7.6%(-1.05)#42 | 8.1%(-1.56)#10,341 |
| 43. | Topaz Ranch Estates | 6.3% | 7.6%(-1.25)#43 | 8.1%(-1.76)#10,689 |
| 44. | Round Hill Village | 6.3% | 7.6%(-1.27)#44 | 8.1%(-1.77)#10,722 |
| 45. | Spanish Springs | 5.8% | 7.6%(-1.77)#45 | 8.1%(-2.27)#11,601 |
| 46. | Laughlin | 5.8% | 7.6%(-1.81)#46 | 8.1%(-2.32)#11,689 |
| 47. | Mogul | 5.5% | 7.6%(-2.05)#47 | 8.1%(-2.56)#12,088 |
| 48. | Stagecoach | 5.4% | 7.6%(-2.18)#48 | 8.1%(-2.68)#12,316 |
| 49. | North Las Vegas | 5.3% | 7.6%(-2.28)#49 | 8.1%(-2.79)#12,504 |
| 50. | Dayton | 5.3% | 7.6%(-2.31)#50 | 8.1%(-2.81)#12,590 |
| 51. | Indian Hills | 5.2% | 7.6%(-2.38)#51 | 8.1%(-2.88)#12,691 |
| 52. | Wadsworth | 5.0% | 7.6%(-2.57)#52 | 8.1%(-3.07)#12,999 |
| 53. | Elko | 4.9% | 7.6%(-2.66)#53 | 8.1%(-3.16)#13,162 |
| 54. | Cold Springs | 4.7% | 7.6%(-2.88)#54 | 8.1%(-3.38)#13,562 |
| 55. | Ruhenstroth | 4.7% | 7.6%(-2.91)#55 | 8.1%(-3.42)#13,614 |
| 56. | Topaz Lake | 4.3% | 7.6%(-3.22)#56 | 8.1%(-3.72)#14,183 |
| 57. | East Valley | 4.0% | 7.6%(-3.59)#57 | 8.1%(-4.10)#14,809 |
| 58. | Winnemucca | 3.4% | 7.6%(-4.13)#58 | 8.1%(-4.64)#15,748 |
| 59. | Lovelock | 3.4% | 7.6%(-4.16)#59 | 8.1%(-4.67)#15,789 |
| 60. | Washoe Valley | 3.4% | 7.6%(-4.21)#60 | 8.1%(-4.71)#15,869 |
| 61. | Minden | 3.2% | 7.6%(-4.35)#61 | 8.1%(-4.85)#16,097 |
| 62. | Crystal Bay | 3.0% | 7.6%(-4.57)#62 | 8.1%(-5.08)#16,450 |
| 63. | Spring Creek | 2.9% | 7.6%(-4.66)#63 | 8.1%(-5.17)#16,590 |
| 64. | Mount Charleston | 2.7% | 7.6%(-4.83)#64 | 8.1%(-5.34)#16,876 |
| 65. | Ely | 2.2% | 7.6%(-5.40)#65 | 8.1%(-5.90)#17,687 |
| 66. | Moapa Valley | 2.1% | 7.6%(-5.46)#66 | 8.1%(-5.96)#17,760 |
| 67. | Fallon | 1.4% | 7.6%(-6.12)#67 | 8.1%(-6.63)#18,514 |
1
2Common Questions
What are the Top 10 Cities with the Highest Percentage of Population with a Degree in Social Sciences in Nevada?
Top 10 Cities with the Highest Percentage of Population with a Degree in Social Sciences in Nevada are:
#1
54.5%
#2
53.6%
#3
46.4%
#4
43.5%
#5
37.5%
#6
23.7%
#7
21.6%
#8
17.4%
#9
17.0%
#10
16.7%
What city has the Highest Percentage of Population with a Degree in Social Sciences in Nevada?
Moapa Town has the Highest Percentage of Population with a Degree in Social Sciences in Nevada with 54.5%.
What is the Percentage of Population with a Degree in Social Sciences in the State of Nevada?
Percentage of Population with a Degree in Social Sciences in Nevada is 7.6%.
What is the Percentage of Population with a Degree in Social Sciences in the United States?
Percentage of Population with a Degree in Social Sciences in the United States is 8.1%.