Cities with the Highest Percentage of Population with a Degree in Social Sciences in Mississippi
RELATED REPORTS & OPTIONS
Social Sciences
Mississippi
Compare Cities
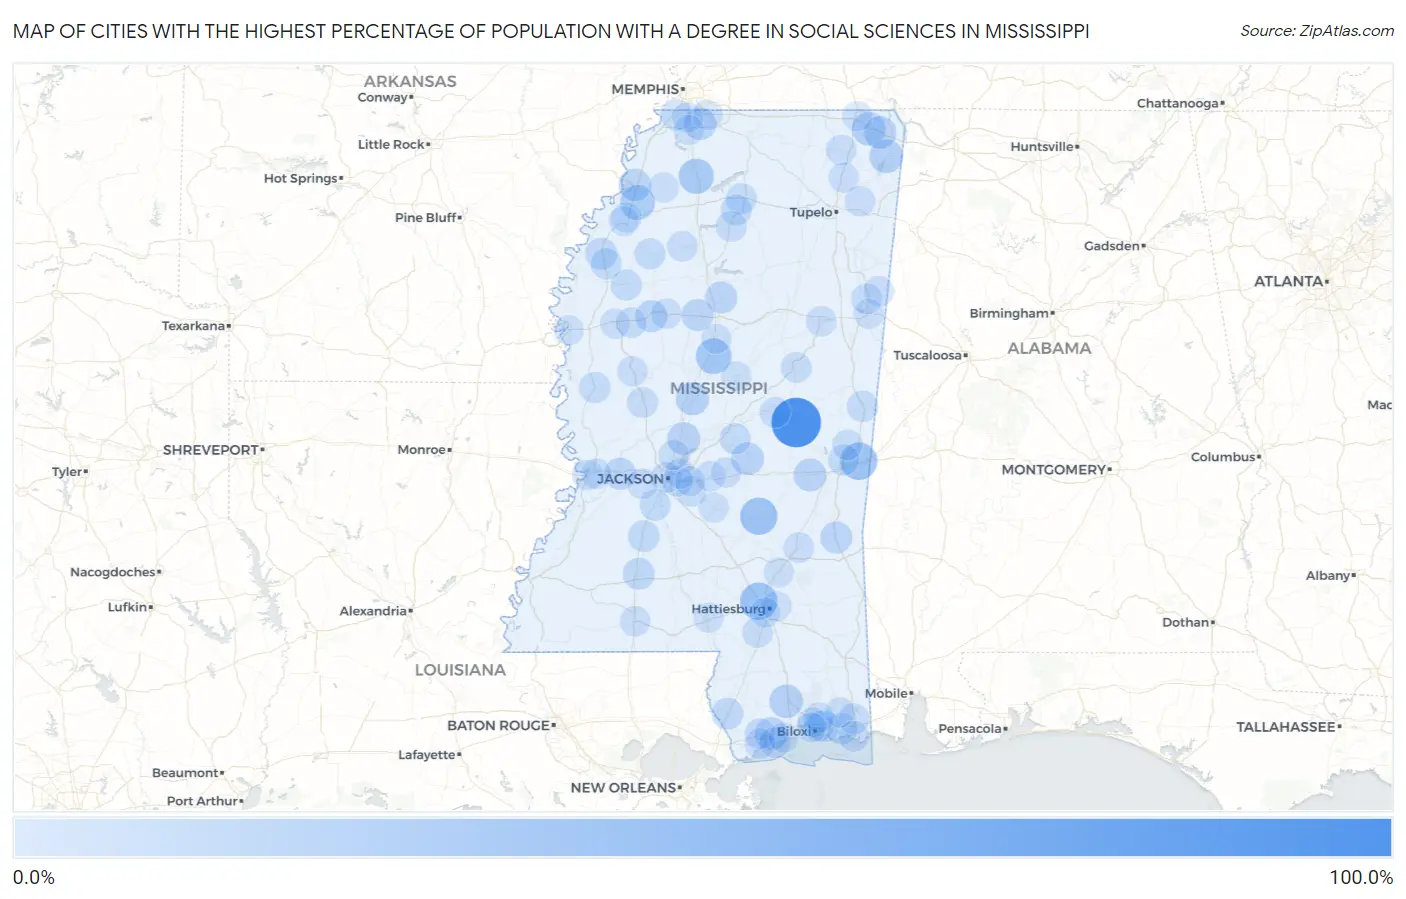
Map of Cities with the Highest Percentage of Population with a Degree in Social Sciences in Mississippi
0.0%
100.0%
Cities with the Highest Percentage of Population with a Degree in Social Sciences in Mississippi
| City | % Graduates | vs State | vs National | |
| 1. | Tucker | 100.0% | 3.8%(+96.2)#1 | 8.1%(+91.9)#11 |
| 2. | Kokomo | 100.0% | 3.8%(+96.2)#2 | 8.1%(+91.9)#13 |
| 3. | Wheeler | 41.4% | 3.8%(+37.6)#3 | 8.1%(+33.3)#284 |
| 4. | Rawls Springs | 38.5% | 3.8%(+34.7)#4 | 8.1%(+30.4)#337 |
| 5. | Toomsuba | 38.0% | 3.8%(+34.2)#5 | 8.1%(+29.9)#346 |
| 6. | Sylvarena | 37.5% | 3.8%(+33.7)#6 | 8.1%(+29.4)#354 |
| 7. | West | 30.3% | 3.8%(+26.5)#7 | 8.1%(+22.2)#525 |
| 8. | Como | 27.1% | 3.8%(+23.3)#8 | 8.1%(+19.0)#680 |
| 9. | Jonestown | 25.7% | 3.8%(+21.9)#9 | 8.1%(+17.6)#756 |
| 10. | Bovina | 21.1% | 3.8%(+17.4)#10 | 8.1%(+13.1)#1,161 |
| 11. | Glen | 20.0% | 3.8%(+16.2)#11 | 8.1%(+11.9)#1,301 |
| 12. | Paden | 20.0% | 3.8%(+16.2)#12 | 8.1%(+11.9)#1,334 |
| 13. | Saucier | 19.3% | 3.8%(+15.5)#13 | 8.1%(+11.2)#1,434 |
| 14. | Pickens | 17.7% | 3.8%(+13.9)#14 | 8.1%(+9.65)#1,705 |
| 15. | Delisle | 17.3% | 3.8%(+13.5)#15 | 8.1%(+9.22)#1,783 |
| 16. | Hillsboro | 16.8% | 3.8%(+13.0)#16 | 8.1%(+8.73)#1,887 |
| 17. | Canton | 16.7% | 3.8%(+12.9)#17 | 8.1%(+8.65)#1,905 |
| 18. | Burnsville | 16.7% | 3.8%(+12.9)#18 | 8.1%(+8.60)#1,918 |
| 19. | Chunky | 16.7% | 3.8%(+12.9)#19 | 8.1%(+8.60)#1,943 |
| 20. | Bridgetown | 15.4% | 3.8%(+11.7)#20 | 8.1%(+7.38)#2,250 |
| 21. | Lula | 15.4% | 3.8%(+11.6)#21 | 8.1%(+7.31)#2,284 |
| 22. | Edwards | 13.3% | 3.8%(+9.55)#22 | 8.1%(+5.26)#3,058 |
| 23. | Carrollton | 12.9% | 3.8%(+9.15)#23 | 8.1%(+4.86)#3,285 |
| 24. | Itta Bena | 12.9% | 3.8%(+9.12)#24 | 8.1%(+4.83)#3,293 |
| 25. | Duck Hill | 12.9% | 3.8%(+9.12)#25 | 8.1%(+4.83)#3,294 |
| 26. | Shubuta | 12.5% | 3.8%(+8.71)#26 | 8.1%(+4.43)#3,529 |
| 27. | Shelby | 12.4% | 3.8%(+8.66)#27 | 8.1%(+4.38)#3,587 |
| 28. | Gulf Hills | 11.6% | 3.8%(+7.79)#28 | 8.1%(+3.51)#4,098 |
| 29. | Brookhaven | 11.4% | 3.8%(+7.60)#29 | 8.1%(+3.32)#4,231 |
| 30. | Picayune | 10.9% | 3.8%(+7.10)#30 | 8.1%(+2.81)#4,638 |
| 31. | Gautier | 10.9% | 3.8%(+7.08)#31 | 8.1%(+2.80)#4,651 |
| 32. | Hazlehurst | 10.5% | 3.8%(+6.69)#32 | 8.1%(+2.40)#5,009 |
| 33. | Anguilla | 9.3% | 3.8%(+5.47)#33 | 8.1%(+1.19)#6,273 |
| 34. | Terry | 9.1% | 3.8%(+5.33)#34 | 8.1%(+1.05)#6,447 |
| 35. | Scooba | 9.1% | 3.8%(+5.30)#35 | 8.1%(+1.02)#6,482 |
| 36. | Mound Bayou | 9.1% | 3.8%(+5.27)#36 | 8.1%(+0.985)#6,555 |
| 37. | Lynchburg | 8.8% | 3.8%(+5.02)#37 | 8.1%(+0.739)#6,833 |
| 38. | Oxford | 8.1% | 3.8%(+4.35)#38 | 8.1%(+0.061)#7,742 |
| 39. | Webb | 8.0% | 3.8%(+4.21)#39 | 8.1%(-0.071)#7,945 |
| 40. | Taylor | 8.0% | 3.8%(+4.21)#40 | 8.1%(-0.071)#7,951 |
| 41. | Marion | 7.9% | 3.8%(+4.13)#41 | 8.1%(-0.153)#8,064 |
| 42. | Ruleville | 7.9% | 3.8%(+4.13)#42 | 8.1%(-0.157)#8,066 |
| 43. | Lena | 7.7% | 3.8%(+3.91)#43 | 8.1%(-0.379)#8,468 |
| 44. | Water Valley | 7.6% | 3.8%(+3.82)#44 | 8.1%(-0.469)#8,597 |
| 45. | Pass Christian | 7.2% | 3.8%(+3.45)#45 | 8.1%(-0.831)#9,164 |
| 46. | Escatawpa | 7.2% | 3.8%(+3.45)#46 | 8.1%(-0.836)#9,169 |
| 47. | Pearl River | 7.1% | 3.8%(+3.32)#47 | 8.1%(-0.965)#9,383 |
| 48. | Yazoo City | 6.9% | 3.8%(+3.11)#48 | 8.1%(-1.17)#9,701 |
| 49. | Robinhood | 6.8% | 3.8%(+3.01)#49 | 8.1%(-1.28)#9,858 |
| 50. | Louisville | 6.7% | 3.8%(+2.90)#50 | 8.1%(-1.38)#10,025 |
| 51. | Purvis | 6.6% | 3.8%(+2.83)#51 | 8.1%(-1.46)#10,170 |
| 52. | Pearl | 6.5% | 3.8%(+2.68)#52 | 8.1%(-1.60)#10,422 |
| 53. | Pascagoula | 6.4% | 3.8%(+2.57)#53 | 8.1%(-1.72)#10,626 |
| 54. | Diamondhead | 6.3% | 3.8%(+2.50)#54 | 8.1%(-1.79)#10,738 |
| 55. | Jackson | 6.3% | 3.8%(+2.47)#55 | 8.1%(-1.82)#10,776 |
| 56. | Moorhead | 6.2% | 3.8%(+2.43)#56 | 8.1%(-1.86)#10,879 |
| 57. | Sandersville | 6.0% | 3.8%(+2.21)#57 | 8.1%(-2.07)#11,236 |
| 58. | Bay St Louis | 6.0% | 3.8%(+2.18)#58 | 8.1%(-2.11)#11,303 |
| 59. | Columbus Afb | 5.8% | 3.8%(+2.04)#59 | 8.1%(-2.25)#11,562 |
| 60. | Charleston | 5.8% | 3.8%(+1.98)#60 | 8.1%(-2.31)#11,673 |
| 61. | Jumpertown | 5.7% | 3.8%(+1.93)#61 | 8.1%(-2.36)#11,748 |
| 62. | Starkville | 5.7% | 3.8%(+1.92)#62 | 8.1%(-2.37)#11,770 |
| 63. | Vicksburg | 5.6% | 3.8%(+1.85)#63 | 8.1%(-2.43)#11,871 |
| 64. | Pelahatchie | 5.5% | 3.8%(+1.69)#64 | 8.1%(-2.59)#12,144 |
| 65. | Meridian Station | 5.5% | 3.8%(+1.68)#65 | 8.1%(-2.61)#12,175 |
| 66. | Beechwood | 5.4% | 3.8%(+1.65)#66 | 8.1%(-2.64)#12,245 |
| 67. | Raymond | 5.3% | 3.8%(+1.48)#67 | 8.1%(-2.81)#12,541 |
| 68. | Silver City | 5.3% | 3.8%(+1.48)#68 | 8.1%(-2.81)#12,582 |
| 69. | Mantachie | 5.2% | 3.8%(+1.45)#69 | 8.1%(-2.83)#12,618 |
| 70. | Caledonia | 5.1% | 3.8%(+1.36)#70 | 8.1%(-2.93)#12,768 |
| 71. | Mccomb | 5.1% | 3.8%(+1.27)#71 | 8.1%(-3.02)#12,907 |
| 72. | St Martin | 5.0% | 3.8%(+1.21)#72 | 8.1%(-3.07)#12,981 |
| 73. | Greenwood | 5.0% | 3.8%(+1.17)#73 | 8.1%(-3.12)#13,070 |
| 74. | Southaven | 4.9% | 3.8%(+1.12)#74 | 8.1%(-3.17)#13,173 |
| 75. | Long Beach | 4.9% | 3.8%(+1.08)#75 | 8.1%(-3.21)#13,239 |
| 76. | Morton | 4.8% | 3.8%(+0.976)#76 | 8.1%(-3.31)#13,405 |
| 77. | Flowood | 4.7% | 3.8%(+0.916)#77 | 8.1%(-3.37)#13,542 |
| 78. | Madison | 4.7% | 3.8%(+0.899)#78 | 8.1%(-3.39)#13,576 |
| 79. | Latimer | 4.6% | 3.8%(+0.772)#79 | 8.1%(-3.51)#13,767 |
| 80. | Baldwyn | 4.5% | 3.8%(+0.737)#80 | 8.1%(-3.55)#13,852 |
| 81. | Sledge | 4.4% | 3.8%(+0.659)#81 | 8.1%(-3.63)#13,989 |
| 82. | D Iberville | 4.4% | 3.8%(+0.595)#82 | 8.1%(-3.69)#14,095 |
| 83. | Olive Branch | 4.2% | 3.8%(+0.433)#83 | 8.1%(-3.85)#14,396 |
| 84. | Petal | 4.2% | 3.8%(+0.422)#84 | 8.1%(-3.86)#14,423 |
| 85. | Puckett | 4.2% | 3.8%(+0.381)#85 | 8.1%(-3.90)#14,501 |
| 86. | Vaiden | 4.1% | 3.8%(+0.352)#86 | 8.1%(-3.93)#14,558 |
| 87. | Kosciusko | 4.1% | 3.8%(+0.277)#87 | 8.1%(-4.01)#14,658 |
| 88. | Hattiesburg | 4.0% | 3.8%(+0.240)#88 | 8.1%(-4.05)#14,723 |
| 89. | Ellisville | 3.8% | 3.8%(+0.060)#89 | 8.1%(-4.22)#15,000 |
| 90. | Corinth | 3.8% | 3.8%(+0.052)#90 | 8.1%(-4.23)#15,045 |
| 91. | Columbus | 3.8% | 3.8%(+0.041)#91 | 8.1%(-4.24)#15,060 |
| 92. | Columbia | 3.8% | 3.8%(+0.032)#92 | 8.1%(-4.25)#15,073 |
| 93. | Biloxi | 3.8% | 3.8%(+0.002)#93 | 8.1%(-4.28)#15,130 |
| 94. | Greenville | 3.8% | 3.8%(-0.025)#94 | 8.1%(-4.31)#15,178 |
| 95. | Indianola | 3.8% | 3.8%(-0.033)#95 | 8.1%(-4.32)#15,191 |
| 96. | Brandon | 3.7% | 3.8%(-0.048)#96 | 8.1%(-4.33)#15,218 |
| 97. | Hernando | 3.7% | 3.8%(-0.058)#97 | 8.1%(-4.34)#15,230 |
| 98. | Lyon | 3.7% | 3.8%(-0.082)#98 | 8.1%(-4.37)#15,289 |
| 99. | Vancleave | 3.7% | 3.8%(-0.086)#99 | 8.1%(-4.37)#15,312 |
| 100. | Clarksdale | 3.6% | 3.8%(-0.136)#100 | 8.1%(-4.42)#15,375 |
Common Questions
What are the Top 10 Cities with the Highest Percentage of Population with a Degree in Social Sciences in Mississippi?
Top 10 Cities with the Highest Percentage of Population with a Degree in Social Sciences in Mississippi are:
What city has the Highest Percentage of Population with a Degree in Social Sciences in Mississippi?
Tucker has the Highest Percentage of Population with a Degree in Social Sciences in Mississippi with 100.0%.
What is the Percentage of Population with a Degree in Social Sciences in the State of Mississippi?
Percentage of Population with a Degree in Social Sciences in Mississippi is 3.8%.
What is the Percentage of Population with a Degree in Social Sciences in the United States?
Percentage of Population with a Degree in Social Sciences in the United States is 8.1%.